Csr and Corporate Governace
34
Corporate Governance and Firm Value: The Impact of Corporate Social Responsibility Hoje Jo Maretno A. Harjoto ABSTRACT. This st udy inve st igat es the ef fects of inter nal and extern al corp orate governan ce and moni - toring mec han isms on the choice of corporate soc ial responsibility (CSR) engagement and the value of firms eng agi ng in CSR act ivi tie s. The study fin ds the CSR choic e is pos iti vel y ass oci ated wit h the int ern al and extern al corp orate gove rnanc e and moni torin g mecha - nisms, including board leadership, board independence, ins titutio nal owners hip , ana lys t followin g, and ant i- takeover provi sio ns, aft er controlli ng for various fir m charac ter ist ics . Af ter correc tin g for end og ene ity and simul tanei ty issue s, the results show that CSR engage- me nt positi vely infl ue nces fi rm va lue measur ed by industry-adjusted Tobin’s q. We find that the impact of analyst following for firms that engage in CSR on firm va lue is st rong ly positive, whil e the board leader- ship, board independence, blockholders’ ownership, and insti tutio nal ownership play a relati vely weaker role in enhan cing firm value. Furthermo re, we find that CSR activities that address internal social enhancement within the firm, such as emplo yees diversity , firm relations hip wit h its employ ees, and pro duc t qua lit y, enh ance the val ue of fir m mor e tha n oth er CSR subca teg ori es for broader external social enhancement such as community relation and environmental concerns. KEY WORDS: corp orate social respo nsib ility , corp o- rate governance, analyst following, firm value JEL CLASSIFICATION: G34, L2, M14 Introduction Alth ough there has been a note wort hy discu ssion among scholars and practitioners over the last two decades on what constitutes the be st corpor at e gove rnan ce prac tices , corp orat e gove rnan ce acro ss corporate America is more heterogeneous than ever before. The recent collapse of many firms has not only proven to be a watershed momentum in U.S. cor porate governance, it als o has hi ghl igh ted the importance of info rmati on transparency. Info rma- tion prob lems and mana geri al ince ntive s typic ally limit the effe ctive ness of corp orate governa nce in public corporations (Jensen, 1993; Miller, 2005). As a result, there has been a tremendous acceleration of cor por ate gov ern anc e act ivi ties, as we ll as a con- vergence of certain trends in corporate governance over the last few years (Hermalin, 2005). While the liter ature indi cates that effe ctive corporate gove r- nance curt ails man ageri al self -inte rest and prot ects shareholder interests, this study posits that corporate governance manages the interests of multiple stake- holders and resolves the conflicts of interest between shareholders and non-investing stakeholders. Along with the acceleration of corporate gover- nance issue, one of the most sig nifi can t and con- tentio us cor por ate tre nds of the las t de cad e is the growth of Corporate Social Responsibility (CSR). In ess enc e, CSR is an extensio n of firms’ eff orts to foste r effective corp orate gove rnan ce, ensu ring firms’ sustainability via sound business practices that promote accountability and transparency. However, the re are var iou s defi ni tio ns of CSR. Fr ied ma n (1970) first defines CSR as follows: ‘‘Corporate so- ci al re sponsi bi li ty is to cond uc t the busi ness in acco rdan ce with share hold ers’ desi res, whic h gen- erally will be to make as much money as possible while conforming to the basic rules of society, both those embodied in law and those embodied in eth- ical custom.’’ Carroll ( 1979) and Hill et al. (2007) defi ne the hi era rch ica l CSR as economic, leg al, mo ra l, and phil anthropic acti ons of fir ms that Journal of Business Ethics (2011) 103:351–383 Springer 2011 DOI 10.1007/s10551-011-0869-y
-
Upload
uzzal-haque -
Category
Documents
-
view
229 -
download
0
Transcript of Csr and Corporate Governace
8/12/2019 Csr and Corporate Governace
http://slidepdf.com/reader/full/csr-and-corporate-governace 1/34
Corporate Governance and Firm Value:
The Impact of Corporate SocialResponsibility
Hoje JoMaretno A. Harjoto
ABSTRACT. This study investigates the effects of
internal and external corporate governance and moni-
toring mechanisms on the choice of corporate social
responsibility (CSR) engagement and the value of firms
engaging in CSR activities. The study finds the CSR
choice is positively associated with the internal and
external corporate governance and monitoring mecha-
nisms, including board leadership, board independence,
institutional ownership, analyst following, and anti-
takeover provisions, after controlling for various firm
characteristics. After correcting for endogeneity and
simultaneity issues, the results show that CSR engage-
ment positively influences firm value measured by
industry-adjusted Tobin’s q. We find that the impact of
analyst following for firms that engage in CSR on firm
value is strongly positive, while the board leader-
ship, board independence, blockholders’ ownership, andinstitutional ownership play a relatively weaker role in
enhancing firm value. Furthermore, we find that CSR
activities that address internal social enhancement within
the firm, such as employees diversity, firm relationship
with its employees, and product quality, enhance the
value of firm more than other CSR subcategories for
broader external social enhancement such as community
relation and environmental concerns.
KEY WORDS: corporate social responsibility, corpo-
rate governance, analyst following, firm value
JEL CLASSIFICATION: G34, L2, M14
Introduction
Although there has been a noteworthy discussion
among scholars and practitioners over the last two
decades on what constitutes the best corporate
governance practices, corporate governance across
corporate America is more heterogeneous than ever
before. The recent collapse of many firms has not
only proven to be a watershed momentum in U.S.
corporate governance, it also has highlighted theimportance of information transparency. Informa-
tion problems and managerial incentives typically
limit the effectiveness of corporate governance in
public corporations (Jensen, 1993; Miller, 2005). As
a result, there has been a tremendous acceleration of
corporate governance activities, as well as a con-
vergence of certain trends in corporate governance
over the last few years (Hermalin, 2005). While the
literature indicates that effective corporate gover-
nance curtails managerial self-interest and protects
shareholder interests, this study posits that corporate
governance manages the interests of multiple stake-
holders and resolves the conflicts of interest between
shareholders and non-investing stakeholders.
Along with the acceleration of corporate gover-
nance issue, one of the most significant and con-
tentious corporate trends of the last decade is the
growth of Corporate Social Responsibility (CSR).
In essence, CSR is an extension of firms’ efforts
to foster effective corporate governance, ensuring
firms’ sustainability via sound business practices that
promote accountability and transparency. However,
there are various definitions of CSR. Friedman(1970) first defines CSR as follows: ‘‘Corporate so-
cial responsibility is to conduct the business in
accordance with shareholders’ desires, which gen-
erally will be to make as much money as possible
while conforming to the basic rules of society, both
those embodied in law and those embodied in eth-
ical custom.’’ Carroll (1979) and Hill et al. (2007)
define the hierarchical CSR as economic, legal,
moral, and philanthropic actions of firms that
Journal of Business Ethics (2011) 103:351–383 Springer 2011
DOI 10.1007/s10551-011-0869-y
8/12/2019 Csr and Corporate Governace
http://slidepdf.com/reader/full/csr-and-corporate-governace 2/34
influence the quality of life of relevant stakeholders.
While the definitions of CSR vary, it generally refers
to serving people, communities, and society in ways
that go above and beyond what is legally required of
a firm. According to Barnea and Rubin (2010),however, if CSR initiatives do not maximize firm
value, such initiatives are a waste of valuable re-
sources and a potentially value-destroying proposi-
tion. CSR has continued to be a highly topical
subject regarding whether investments in CSR are
value-enhancing, value-destroying, or even value-
irrelevant. The debates about CSR continue to grow
without a clear consensus on its meaning or value.
In this paper, we first examine the empirical
association between various corporate governance
and monitoring mechanisms and U.S. firms’ choiceof CSR involvement. We then explore how CSR
engagement and various governance mechanisms
affect firm value after correcting for endogeneity and
simultaneity. Well-designed corporate governance
systems would align managers’ incentives with those
of stakeholders. Hence, firms with effective corpo-
rate governance should place a greater emphasis on
value maximization. We examine two categories of
governance devices: internal (ownership concentra-
tion and board structure) and external (institutional
ownership and monitoring by security analysts).
Given that the relations among CSR, corporategovernance, and firm value are mixed, and that
previous studies do not control for the simultaneity
bias and endogeneity, this study explores the impact
of various governance mechanisms on firms’ choice
of CSR engagement and the effect of this engage-
ment on firm value after controlling for both the
simultaneity bias and endogeneity.1
As one of the essential rationales behind CSR
engagement is to build trust relationships and social
capital, increasing attention is being paid to the effects
that social capital has on economic variables.
2
Severalstudies analyze the relation between social capital and
economic growth (Knack and Keefer, 1997); social
capital and trust building (La Porta et al., 1997a, b);
social capital and government performance (La Porta
et al., 1999; Putnam, 1993); and social capital and
financial development (Guiso, et al., 2004). In spite
of the increasing attention given to social capital,
however, only a few studies in finance examine CSR
engagement. Aggrawal and Nanda (2004) investigate
the relation between board size and social objectives
and find that the number of social objectives posi-
tively affects firms’ board size. Fisman et al. (2005)
examine the link between firms’ CSR engagement
and accounting profit. They find that the effect of
CSR on profitability is stronger for firms in morecompetitive industries. Barnea and Rubin (2010)
examine the relation between firms’ CSR ratings and
their ownership and capital structures and find that
insiders tend to over-invest in CSR. Goss and
Roberts (2007) analyze the association between CSR
and the cost of bank loans. They find that firms with
the worst social responsibility scores pay higher loan
costs while firms with good scores do not receive
lower loan costs. Hong and Kacperczyk (2009) find
sin stocks from publicly traded firms that produce
alcohol, tobacco, and gambling have higher risk andreturns indicating that social norms affect stock prices
and returns. Although these studies enhance our
understanding of the important benefits and costs of
CSR engagement, in our view, the previous research
on this issue is still premature to provide any definite
conclusions regarding the impact of CSR engage-
ment on firm value.3
To correctly examine the relationship between
CSR and firm value, we need to consider potential
simultaneity bias and endogenous treatment effects.
Since better quality firms tend to choose CSR
engagement, the contribution of CSR engagementto firm value will be overstated (Greene, 1993) if we
do not correct for the simultaneity and endogeneity
problems. In this paper, we conduct our endoge-
neity and simultaneity analyses in two stages. We
examine the factors determining CSR engagement
extensively in the first stage, and then compare the
firm values of CSR engaging versus CSR non-
engaging firms in the second stage. Based upon a
large sample of 12,527 firm-year (2952 firms)
observations, including both CSR and no-CSR
firms during the 1993–2004 period, we initiallyperform a first-stage probit regression analysis of
CSR engagement. Consistent with the conflict-
resolution hypothesis, the results show that the
likelihood of opting for CSR involvement is sig-
nificantly and positively related to governance
characteristics such as board leadership, board inde-
pendence, institutional ownership, analyst following,
and anti-takeover provisions after controlling for
such firm characteristics as firm size, leverage, prof-
itability, R&D, a firm’s diversification, and risk.
352 Hoje Jo and Maretno A. Harjoto
8/12/2019 Csr and Corporate Governace
http://slidepdf.com/reader/full/csr-and-corporate-governace 3/34
In the second-stage analysis, we find that after
correcting for the endogenous treatment effect and
simultaneity bias, respectively, firm value, measured
by industry-adjusted Tobin’s q, is positively
related to the CSR choice or the CSR-combinedscores, suggesting that CSR engagement positively
influences firm value. The results support the
conflict-resolution hypothesis, as opposed to the
overinvestment explanation, and remain robust
under various specifications, including the OLS, the
Heckman two-stage regressions, and the instru-
mental variables approach. Our results also suggest
that the value enhancement of firms’ CSR engage-
ment comes from firms’ internal social enhance-
ment, such as diversity, employee relations, and
product issues more than their CSR involvement inbroader external enhancement, such as activities
related to community and environmental issues. In
addition, after controlling for a potential simultaneity
bias, our inferences concerning the positive associ-
ation between CSR and firm value remain intact.
Furthermore, we maintain that security analysts
are important information intermediaries who
improve the transparency of a firm’s CSR activities.
Accordingly, the impact of CSR activities are
stronger when analyst following is higher, and the
impact of analyst following on firm value is also
strongly positive in all models. However, the mon-itoring impact of institutional investors is occasion-
ally positive, but relatively weaker than that of
security analysts, presumably because of their dual
roles of monitors and investors. Overall, our results
suggest that firms’ engagement in CSR activities,
together with external monitoring by security ana-
lysts, is value enhancing. Furthermore, the positive
impact of CSR activities on firm value implies that
U.S. firms do not over-invest in CSR activities in
the sample period.
This paper contributes to the literature on CSRand corporate governance in three distinct ways.
First, we conduct a full examination of the deter-
minants of CSR engagement and provide insights
into how corporate governance influences firms’
choice to engage in CSR by using all CSR firms
and no-CSR firms available from the Kinder,
Lydenberg, and Domini’s (KLD) Stats database,
RiskMetrics (formerly, the Investor Responsibility
Research Center’s (IRRC) governance and direc-
tor) database, and the Institutional Brokers Estima-
tion Services (I/B/E/S) database during the 1993–
2004 period. Second, we consider more extensive
governance and monitoring mechanisms to examine
the impact of CSR on firms’ value and revisit the
over-investment hypothesis and the conflict-resolu-tion explanation in light of CSR. By appropriately
controlling for the endogenous treatment effects and
simultaneity bias, we are able to determine whether
firms over-invest in CSR activities. We postulate
that the role of corporate governance in the choice
of CSR engagement and the impact of that choice
on firm value might be different for each of the
internal and external governance mechanisms. We
believe that this is the first empirical study to for-
mally address both the simultaneity and endogeneity
issues. Third, we provide further evidence that theimpact of security analyst following on firm value is
one of the most significant among several considered
governance and monitoring mechanisms in the
presence of CSR engagement.
Hypotheses
Why do firms engage in CSR?
Despite large literature on CSR (Bowen, 1953;
Donham, 1927; and for an overview, see Whetten,et al., 2002), there is no unified theory behind CSR
engagement, and there are at least two alternative
explanations regarding its existence. First, based on
Jensen and Meckling’s (1976) agency theory, Barnea
and Rubin (2010) consider CSR engagement as a
principal-agent relation between managers and
shareholders, and argue that affiliated insiders have
an interest in overinvesting in CSR in order to
obtain private benefits of building reputation as good
social citizens, possibly at a cost to shareholders.
As reputation improves, top management willenjoy better outside career opportunities and greater
negotiation power, which will eventually lead them
to have overconfidence. Malmendier and Tate
(2005) suggest that there is some evidence of over-
investment by overconfident CEOs. Goel and
Thakor’s (2008) theoretical model also shows that
overconfident managers sometimes make value-
destroying investments. In a related vein, Bertrand
and Mullainathan (2003) argue that when manag-
ers are not closely monitored and insulated from
353Corporate Governance and Firm Value
8/12/2019 Csr and Corporate Governace
http://slidepdf.com/reader/full/csr-and-corporate-governace 4/34
takeovers, active empire building may not be the
norm and managers may prefer to enjoy a quiet life.
If overconfident CEOs tend to over-invest in order
to build their reputations as good social citizens
without monitoring, we expect an inverse associa-tion between monitoring and CSR choice because
the higher internal and external monitoring through
various governance mechanisms should reduce the
insiders’ incentive for CSR over-investment.
Second, while it may not be completely possible
to satisfy all related stakeholders, there is a growing
literature on conflict resolution based on stakeholder
theory (e,g., Calton and Payne, 2003; Harjoto and
Jo, 2011; Jensen, 2002; Sherere et al., 2006), in
which the role of the corporation is to serve the
interests of other non-investing stakeholders as well.According to the conflict-resolution hypothesis,
to the extent that managers use effective monitor-
ing/governance mechanisms together with CSR
engagement to resolve conflicts among stakeholders,
CSR engagement should be positively related to
effective governance mechanisms. Alternatively, if
various governance and monitoring mechanisms
view the firm’s CSR engagement as an effort of
potential conflict resolution among various stake-
holders, then we would expect a positive association
between corporate governance and CSR engage-
ment.
Hypothesis 1: According to the over-investment
hypothesis, we expect that the choice of CSR
engagement is inversely associated with gover-
nance and monitoring mechanisms after control-
ling for confounding factors, while according to
the conflict-resolution hypothesis, we expect a
positive association between the choice of CSR
engagement and governance and monitoring
mechanisms.
CSR, corporate governance, and firm value
The impact of CSR engagement on accounting
performance (i.e., return on assets (ROA)), is a long-
standing, but still unresolved question. According to
the management literature summarized by Margolis
and Walsh (2003), over 120 studies between 1971
and 2001 examine the empirical relation between
CSR and financial performance, and the results are
largely inconclusive. They suggest that previous
studies are subject to various imperfections, such as
measurement problems related to both CSR and
financial performance, a lack of necessary analyses of causality and/or endogeneity, omitted variable
problems, a lack of methodological rigor, and a lack
of theory. While it is hard to draw a definite con-
clusion because of the imperfect nature of many
studies, the review of the empirical CSR literature
conducted by Margolis and Walsh (2003) indicates a
generally positive association between investing in
socially responsible activities and financial perfor-
mance.
The impact of CSR engagement on firm value,
however, is relatively less examined.
4
In particular,there is less evidence regarding how corporate
governance and the CSR engagement jointly affect
firm value after controlling for both the simultaneity
bias and endogeneity. According to the over-
investment hypothesis, insiders such as the CEO and
the board have a natural motivation to over-invest in
CSR activities if doing so enhances their reputation
building process (Barnea and Rubin, 2010). Then,
firm value will be negatively influenced by the
CSR engagement. In contrast, the conflict-resolu-
tion hypothesis suggests that if managers use effective
governance and monitoring mechanisms in con- junction with CSR engagement to resolve conflicts
among stakeholders, then firm value could be posi-
tively associated with CSR engagement and effective
governance mechanisms through reduced conflict-
of-interests among various stakeholders.
Since there is no clear monitoring mechanism to
prevent firms from over-investing in various CSR
activities, we postulate that there should be some
effective monitoring mechanism out of all consid-
ered internal and external governance mechanisms
for the checking and balancing of CSR investments.Board independence can be important in monitoring
the behavior of top management. Fama and Jensen
(1983) maintain that boards can be effective mech-
anisms to monitor top management on behalf of
dispersed shareholders by effectuating management
appointments, dismissals, suspensions, and rewards.
Other studies, however, point toward a paradoxical,
insignificant, or negative association between gov-
ernance quality, as proxied by the percentage of
outside directors on the board, and firm value.
354 Hoje Jo and Maretno A. Harjoto
8/12/2019 Csr and Corporate Governace
http://slidepdf.com/reader/full/csr-and-corporate-governace 5/34
8/12/2019 Csr and Corporate Governace
http://slidepdf.com/reader/full/csr-and-corporate-governace 6/34
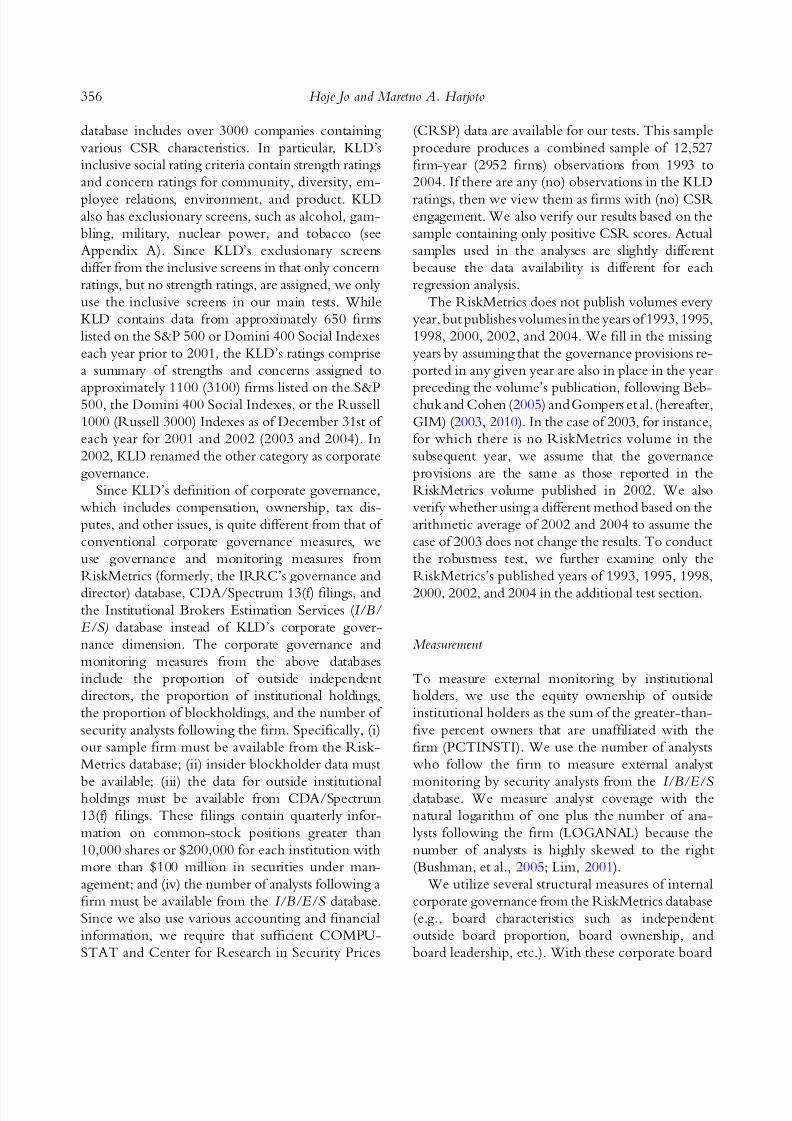
database includes over 3000 companies containing
various CSR characteristics. In particular, KLD’s
inclusive social rating criteria contain strength ratings
and concern ratings for community, diversity, em-
ployee relations, environment, and product. KLDalso has exclusionary screens, such as alcohol, gam-
bling, military, nuclear power, and tobacco (see
Appendix A). Since KLD’s exclusionary screens
differ from the inclusive screens in that only concern
ratings, but no strength ratings, are assigned, we only
use the inclusive screens in our main tests. While
KLD contains data from approximately 650 firms
listed on the S&P 500 or Domini 400 Social Indexes
each year prior to 2001, the KLD’s ratings comprise
a summary of strengths and concerns assigned to
approximately 1100 (3100) firms listed on the S&P500, the Domini 400 Social Indexes, or the Russell
1000 (Russell 3000) Indexes as of December 31st of
each year for 2001 and 2002 (2003 and 2004). In
2002, KLD renamed the other category as corporate
governance.
Since KLD’s definition of corporate governance,
which includes compensation, ownership, tax dis-
putes, and other issues, is quite different from that of
conventional corporate governance measures, we
use governance and monitoring measures from
RiskMetrics (formerly, the IRRC’s governance and
director) database, CDA/Spectrum 13(f) filings, andthe Institutional Brokers Estimation Services (I/B/
E/S) database instead of KLD’s corporate gover-
nance dimension. The corporate governance and
monitoring measures from the above databases
include the proportion of outside independent
directors, the proportion of institutional holdings,
the proportion of blockholdings, and the number of
security analysts following the firm. Specifically, (i)
our sample firm must be available from the Risk-
Metrics database; (ii) insider blockholder data must
be available; (iii) the data for outside institutionalholdings must be available from CDA/Spectrum
13(f) filings. These filings contain quarterly infor-
mation on common-stock positions greater than
10,000 shares or $200,000 for each institution with
more than $100 million in securities under man-
agement; and (iv) the number of analysts following a
firm must be available from the I/B/E/S database.
Since we also use various accounting and financial
information, we require that sufficient COMPU-
STAT and Center for Research in Security Prices
(CRSP) data are available for our tests. This sample
procedure produces a combined sample of 12,527
firm-year (2952 firms) observations from 1993 to
2004. If there are any (no) observations in the KLD
ratings, then we view them as firms with (no) CSRengagement. We also verify our results based on the
sample containing only positive CSR scores. Actual
samples used in the analyses are slightly different
because the data availability is different for each
regression analysis.
The RiskMetrics does not publish volumes every
year, but publishes volumes in the years of 1993, 1995,
1998, 2000, 2002, and 2004. We fill in the missing
years by assuming that the governance provisions re-
ported in any given year are also in place in the year
preceding the volume’s publication, following Beb-chuk and Cohen (2005) and Gompers et al. (hereafter,
GIM) (2003, 2010). In the case of 2003, for instance,
for which there is no RiskMetrics volume in the
subsequent year, we assume that the governance
provisions are the same as those reported in the
RiskMetrics volume published in 2002. We also
verify whether using a different method based on the
arithmetic average of 2002 and 2004 to assume the
case of 2003 does not change the results. To conduct
the robustness test, we further examine only the
RiskMetrics’s published years of 1993, 1995, 1998,
2000, 2002, and 2004 in the additional test section.
Measurement
To measure external monitoring by institutional
holders, we use the equity ownership of outside
institutional holders as the sum of the greater-than-
five percent owners that are unaffiliated with the
firm (PCTINSTI). We use the number of analysts
who follow the firm to measure external analyst
monitoring by security analysts from the I/B/E/S database. We measure analyst coverage with the
natural logarithm of one plus the number of ana-
lysts following the firm (LOGANAL) because the
number of analysts is highly skewed to the right
(Bushman, et al., 2005; Lim, 2001).
We utilize several structural measures of internal
corporate governance from the RiskMetrics database
(e.g., board characteristics such as independent
outside board proportion, board ownership, and
board leadership, etc.). With these corporate board
356 Hoje Jo and Maretno A. Harjoto
8/12/2019 Csr and Corporate Governace
http://slidepdf.com/reader/full/csr-and-corporate-governace 7/34
variables, we compare and contrast effective versus
ineffective corporate governance. We first focus on
effective corporate governance, using an indepen-
dent outside director because the rise of such
directors has been a major trend over the last twodecades (see Harris and Raviv, 2008; Hermalin and
Weisbach, 1998, 2003; Raheja, 2005). We follow
the definition of an independent director from that
of the RiskMetrics, which defines an independent
outside director as a director elected by shareholders
who is not affiliated with the company. Based on
Linck et al. (2008), we measure board independence
by the proportion of outside independent directors
(PCTINDEP), and board leadership by a dummy
variable of one if the CEO is the chair of the board
(DUALITY) and another dummy variable if theCEO is the chair or a member of the nomination
committee (CEONOM).
To measure managerial entrenchment, we use the
governance index (GINDEX) developed by GIM
(2003). The RiskMetrics reports 24 anti-takeover
provisions (ATPs) at the firm level because the basic
ingredients for the GINDEX are ATPs. The GIN-
DEX, therefore, ranges from 0 to 24. A high value
indicates stronger managerial power (less takeover
pressure), and a greater potential for managerial
entrenchment. Bebchuk et al. (2009) create an
entrenchment index (ENTINDEX) based on theGINDEX, particularly using six provisions – four
constitutional provisions that prevent a majority of
shareholders from having their way (e.g., staggered
boards, limits to shareholder bylaw amendments,
supermajority requirements for mergers, and super-
majority requirements for charter amendments), and
two takeover-readiness provisions that boards
establish to be ready for a hostile takeover (i.e.,
poison pills and golden parachutes). Bebchuk et al.
(2009) argue that the ENTINDEX based on these
six ATPs drives the main results of firm valuation.This ENTINDEX ranges from 0 to 6, with a higher
value indicating stronger managerial entrenchment.
Thus, we also use Bebchuk et al.’s (2009) ENT-
INDEX to measure managerial entrenchment. See
the definitions of governance, monitoring, and other
control variables in Appendix B.
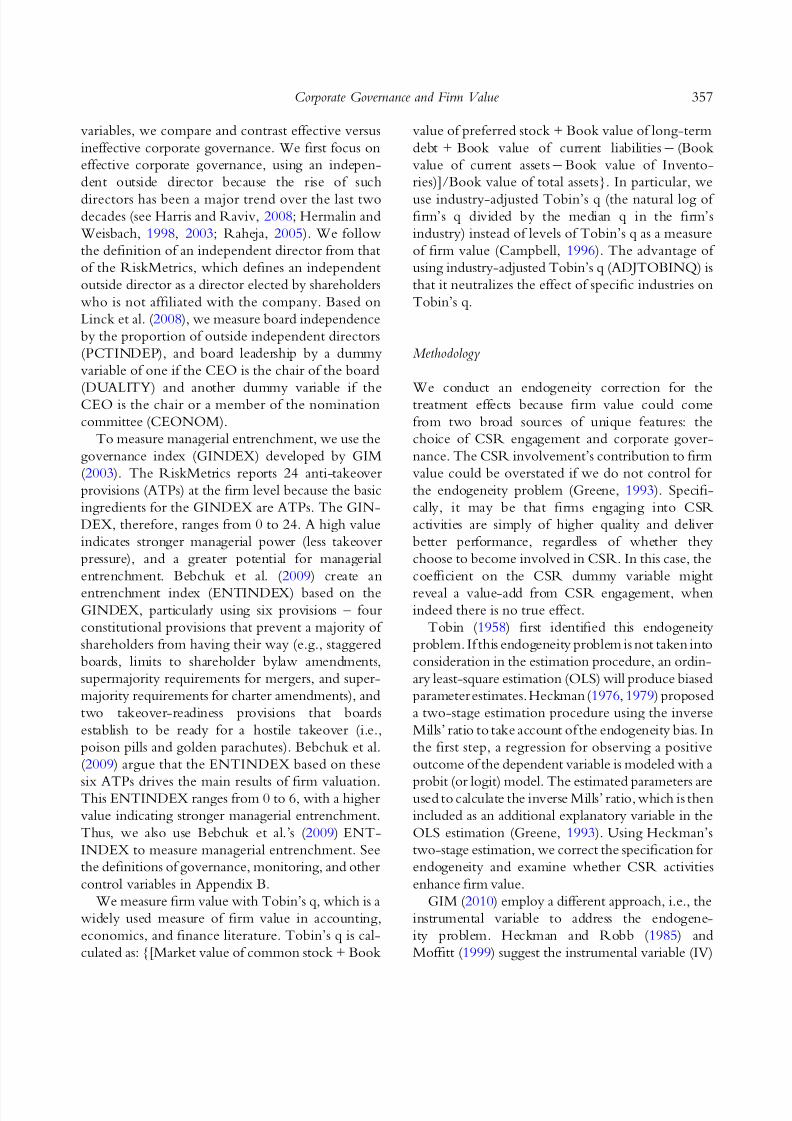
We measure firm value with Tobin’s q, which is a
widely used measure of firm value in accounting,
economics, and finance literature. Tobin’s q is cal-
culated as: {[Market value of common stock + Book
value of preferred stock + Book value of long-term
debt + Book value of current liabilities- (Book
value of current assets-Book value of Invento-
ries)]/Book value of total assets}. In particular, we
use industry-adjusted Tobin’s q (the natural log of firm’s q divided by the median q in the firm’s
industry) instead of levels of Tobin’s q as a measure
of firm value (Campbell, 1996). The advantage of
using industry-adjusted Tobin’s q (ADJTOBINQ) is
that it neutralizes the effect of specific industries on
Tobin’s q.
Methodology
We conduct an endogeneity correction for thetreatment effects because firm value could come
from two broad sources of unique features: the
choice of CSR engagement and corporate gover-
nance. The CSR involvement’s contribution to firm
value could be overstated if we do not control for
the endogeneity problem (Greene, 1993). Specifi-
cally, it may be that firms engaging into CSR
activities are simply of higher quality and deliver
better performance, regardless of whether they
choose to become involved in CSR. In this case, the
coefficient on the CSR dummy variable might
reveal a value-add from CSR engagement, whenindeed there is no true effect.
Tobin (1958) first identified this endogeneity
problem. If this endogeneity problem is not taken into
consideration in the estimation procedure, an ordin-
ary least-square estimation (OLS) will produce biased
parameter estimates. Heckman (1976, 1979) proposed
a two-stage estimation procedure using the inverse
Mills’ ratio to take account of the endogeneity bias. In
the first step, a regression for observing a positive
outcome of the dependent variable is modeled with a
probit (or logit) model. The estimated parameters areused to calculate the inverse Mills’ ratio, which is then
included as an additional explanatory variable in the
OLS estimation (Greene, 1993). Using Heckman’s
two-stage estimation, we correct the specification for
endogeneity and examine whether CSR activities
enhance firm value.
GIM (2010) employ a different approach, i.e., the
instrumental variable to address the endogene-
ity problem. Heckman and Robb (1985) and
Moffitt (1999) suggest the instrumental variable (IV)
357Corporate Governance and Firm Value
8/12/2019 Csr and Corporate Governace
http://slidepdf.com/reader/full/csr-and-corporate-governace 8/34
method, which focuses on finding a variable (or
variables) that influences the CSR choice, but does
not influence Tobin’s q (and thus is not correlated
with the random error term in the Tobin’s q
equation). Angrist (2000) asserts that the IV methodworks even when the second-stage model is non-
linear, if the researcher focuses on the causal effects.
Moffitt (1999) further suggests that each IV, that is
indeed uncorrelated with the random error term
in the Tobin’s q equation, will yield unbiased
estimates.5
Our choice of an instrumental variable
is FIRMAGE, which is highly correlated with
CSRDUMMY, but is uncorrelated with industry-
adjusted Tobin’s q (see Table II). We interpret the
results to suggest that older firms can afford CSR
engagement, but not necessarily lead to higher firmvalue.6
Empirical results
Univariate tests and bivariate correlations
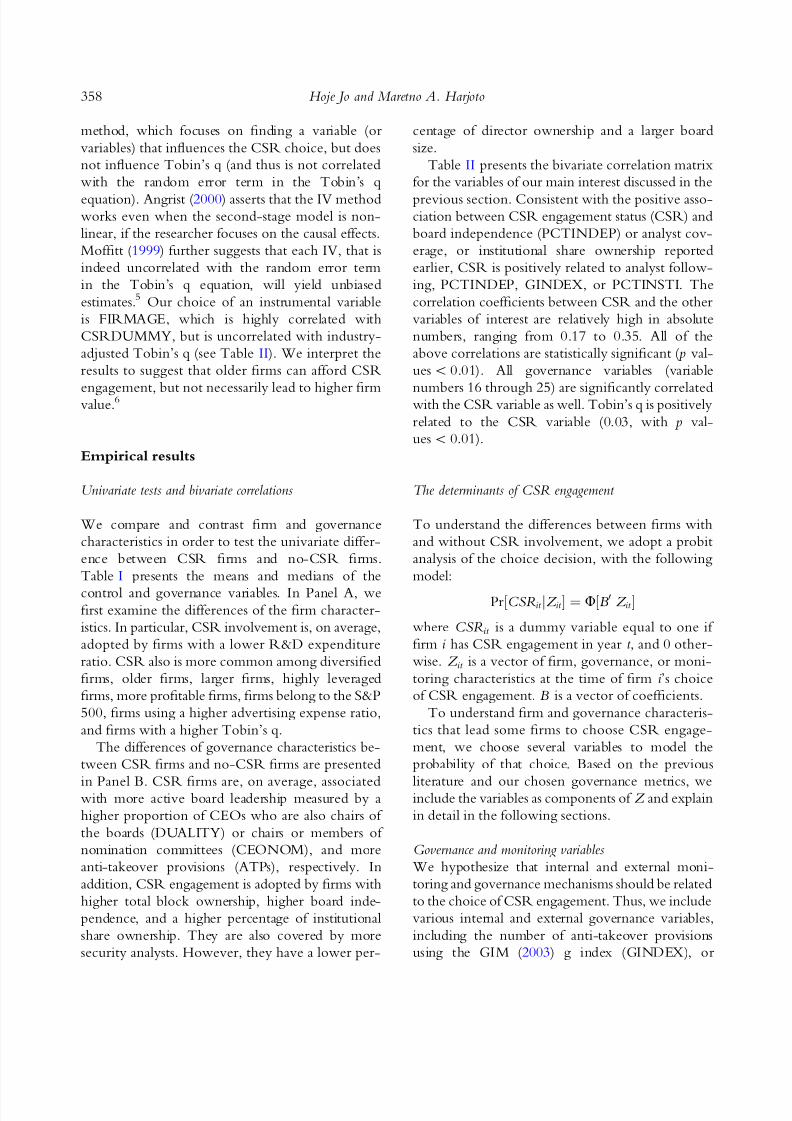
We compare and contrast firm and governance
characteristics in order to test the univariate differ-
ence between CSR firms and no-CSR firms.
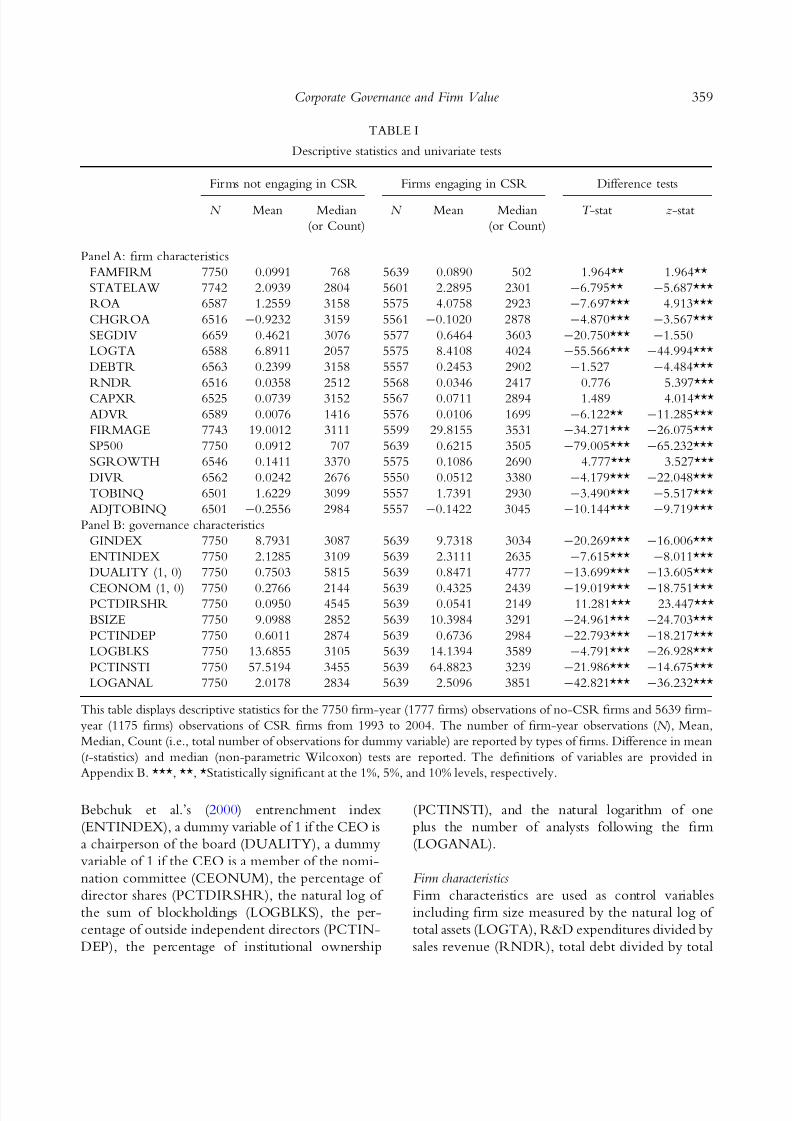
Table I presents the means and medians of the
control and governance variables. In Panel A, wefirst examine the differences of the firm character-
istics. In particular, CSR involvement is, on average,
adopted by firms with a lower R&D expenditure
ratio. CSR also is more common among diversified
firms, older firms, larger firms, highly leveraged
firms, more profitable firms, firms belong to the S&P
500, firms using a higher advertising expense ratio,
and firms with a higher Tobin’s q.
The differences of governance characteristics be-
tween CSR firms and no-CSR firms are presented
in Panel B. CSR firms are, on average, associatedwith more active board leadership measured by a
higher proportion of CEOs who are also chairs of
the boards (DUALITY) or chairs or members of
nomination committees (CEONOM), and more
anti-takeover provisions (ATPs), respectively. In
addition, CSR engagement is adopted by firms with
higher total block ownership, higher board inde-
pendence, and a higher percentage of institutional
share ownership. They are also covered by more
security analysts. However, they have a lower per-
centage of director ownership and a larger board
size.
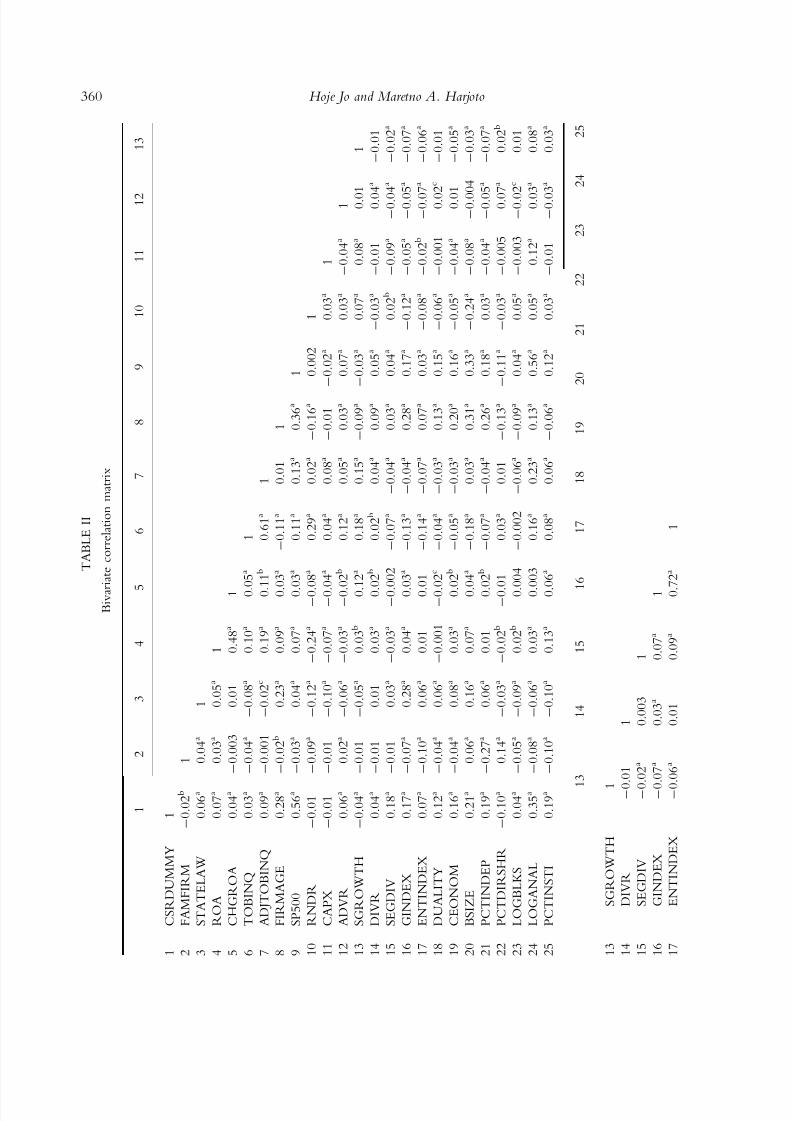
Table II presents the bivariate correlation matrix
for the variables of our main interest discussed in the
previous section. Consistent with the positive asso-ciation between CSR engagement status (CSR) and
board independence (PCTINDEP) or analyst cov-
erage, or institutional share ownership reported
earlier, CSR is positively related to analyst follow-
ing, PCTINDEP, GINDEX, or PCTINSTI. The
correlation coefficients between CSR and the other
variables of interest are relatively high in absolute
numbers, ranging from 0.17 to 0.35. All of the
above correlations are statistically significant ( p val-
ues< 0.01). All governance variables (variable
numbers 16 through 25) are significantly correlatedwith the CSR variable as well. Tobin’s q is positively
related to the CSR variable (0.03, with p val-
ues< 0.01).
The determinants of CSR engagement
To understand the differences between firms with
and without CSR involvement, we adopt a probit
analysis of the choice decision, with the following
model:
Pr ½CSR it jZ it ¼ U½B 0 Z it
where CSR it is a dummy variable equal to one if
firm i has CSR engagement in year t , and 0 other-
wise. Z it is a vector of firm, governance, or moni-
toring characteristics at the time of firm i ’s choice
of CSR engagement. B is a vector of coefficients.
To understand firm and governance characteris-
tics that lead some firms to choose CSR engage-
ment, we choose several variables to model the
probability of that choice. Based on the previous
literature and our chosen governance metrics, weinclude the variables as components of Z and explain
in detail in the following sections.
Governance and monitoring variables
We hypothesize that internal and external moni-
toring and governance mechanisms should be related
to the choice of CSR engagement. Thus, we include
various internal and external governance variables,
including the number of anti-takeover provisions
using the GIM (2003) g index (GINDEX), or
358 Hoje Jo and Maretno A. Harjoto
8/12/2019 Csr and Corporate Governace
http://slidepdf.com/reader/full/csr-and-corporate-governace 9/34
Bebchuk et al.’s (2000) entrenchment index
(ENTINDEX), a dummy variable of 1 if the CEO is
a chairperson of the board (DUALITY), a dummy
variable of 1 if the CEO is a member of the nomi-
nation committee (CEONUM), the percentage of
director shares (PCTDIRSHR), the natural log of
the sum of blockholdings (LOGBLKS), the per-
centage of outside independent directors (PCTIN-
DEP), the percentage of institutional ownership
(PCTINSTI), and the natural logarithm of one
plus the number of analysts following the firm
(LOGANAL).
Firm characteristics
Firm characteristics are used as control variables
including firm size measured by the natural log of
total assets (LOGTA), R&D expenditures divided by
sales revenue (RNDR), total debt divided by total
TABLE I
Descriptive statistics and univariate tests
Firms not engaging in CSR Firms engaging in CSR Difference tests
N Mean Median N Mean Median T -stat z-stat
(or Count) (or Count)
Panel A: firm characteristics
FAMFIRM 7750 0.0991 768 5639 0.0890 502 1.964** 1.964**
STATELAW 7742 2.0939 2804 5601 2.2895 2301 -6.795** -5.687***
ROA 6587 1.2559 3158 5575 4.0758 2923 -7.697*** 4.913***
CHGROA 6516 -0.9232 3159 5561 -0.1020 2878 -4.870*** -3.567***
SEGDIV 6659 0.4621 3076 5577 0.6464 3603 -20.750*** -1.550
LOGTA 6588 6.8911 2057 5575 8.4108 4024 -55.566*** -44.994***
DEBTR 6563 0.2399 3158 5557 0.2453 2902 -1.527 -4.484***
RNDR 6516 0.0358 2512 5568 0.0346 2417 0.776 5.397***
CAPXR 6525 0.0739 3152 5567 0.0711 2894 1.489 4.014***
ADVR 6589 0.0076 1416 5576 0.0106 1699 -6.122** -11.285***
FIRMAGE 7743 19.0012 3111 5599 29.8155 3531 -34.271*** -26.075***
SP500 7750 0.0912 707 5639 0.6215 3505 -79.005*** -65.232***
SGROWTH 6546 0.1411 3370 5575 0.1086 2690 4.777*** 3.527***
DIVR 6562 0.0242 2676 5550 0.0512 3380 -4.179*** -22.048***
TOBINQ 6501 1.6229 3099 5557 1.7391 2930 -3.490*** -5.517***
ADJTOBINQ 6501 -0.2556 2984 5557 -0.1422 3045 -10.144*** -9.719***
Panel B: governance characteristics
GINDEX 7750 8.7931 3087 5639 9.7318 3034 -20.269*** -16.006***
ENTINDEX 7750 2.1285 3109 5639 2.3111 2635 -7.615*** -8.011***
DUALITY (1, 0) 7750 0.7503 5815 5639 0.8471 4777 -13.699*** -13.605***
CEONOM (1, 0) 7750 0.2766 2144 5639 0.4325 2439 -19.019*** -18.751***PCTDIRSHR 7750 0.0950 4545 5639 0.0541 2149 11.281*** 23.447***
BSIZE 7750 9.0988 2852 5639 10.3984 3291 -24.961*** -24.703***
PCTINDEP 7750 0.6011 2874 5639 0.6736 2984 -22.793*** -18.217***
LOGBLKS 7750 13.6855 3105 5639 14.1394 3589 -4.791*** -26.928***
PCTINSTI 7750 57.5194 3455 5639 64.8823 3239 -21.986*** -14.675***
LOGANAL 7750 2.0178 2834 5639 2.5096 3851 -42.821*** -36.232***
This table displays descriptive statistics for the 7750 firm-year (1777 firms) observations of no-CSR firms and 5639 firm-
year (1175 firms) observations of CSR firms from 1993 to 2004. The number of firm-year observations (N ), Mean,
Median, Count (i.e., total number of observations for dummy variable) are reported by types of firms. Difference in mean
(t -statistics) and median (non-parametric Wilcoxon) tests are reported. The definitions of variables are provided in
Appendix B. ***, **, *Statistically significant at the 1%, 5%, and 10% levels, respectively.
359Corporate Governance and Firm Value
8/12/2019 Csr and Corporate Governace
http://slidepdf.com/reader/full/csr-and-corporate-governace 10/34
8/12/2019 Csr and Corporate Governace
http://slidepdf.com/reader/full/csr-and-corporate-governace 11/34
assets (DEBTR), and the Fama–French 48-industry
classification. GIM (2010) suggest using the State
Law as anti-takeover index. Similar to GIM, we
also use the State Law anti-takeover index
(STATELAW), family firms (FAMFIRM), ROA,the natural log of the change in ROA (CHGROA)
to measure profitability, and the diversification
dummy (SEGDIV). We choose family firms instead
of GIM’s name variable because the private benefits
of control should be more relevant to family
firms, following Anderson and Reeb (2003) and
Villalonga and Amit (2006).
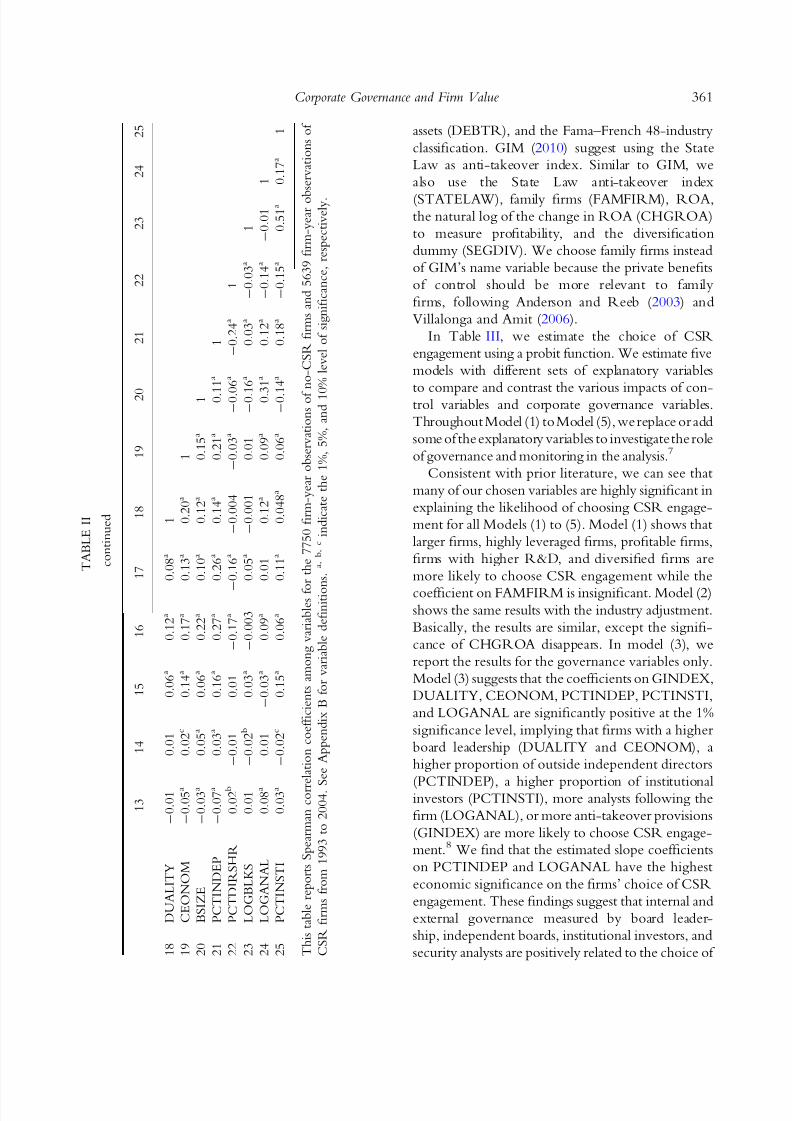
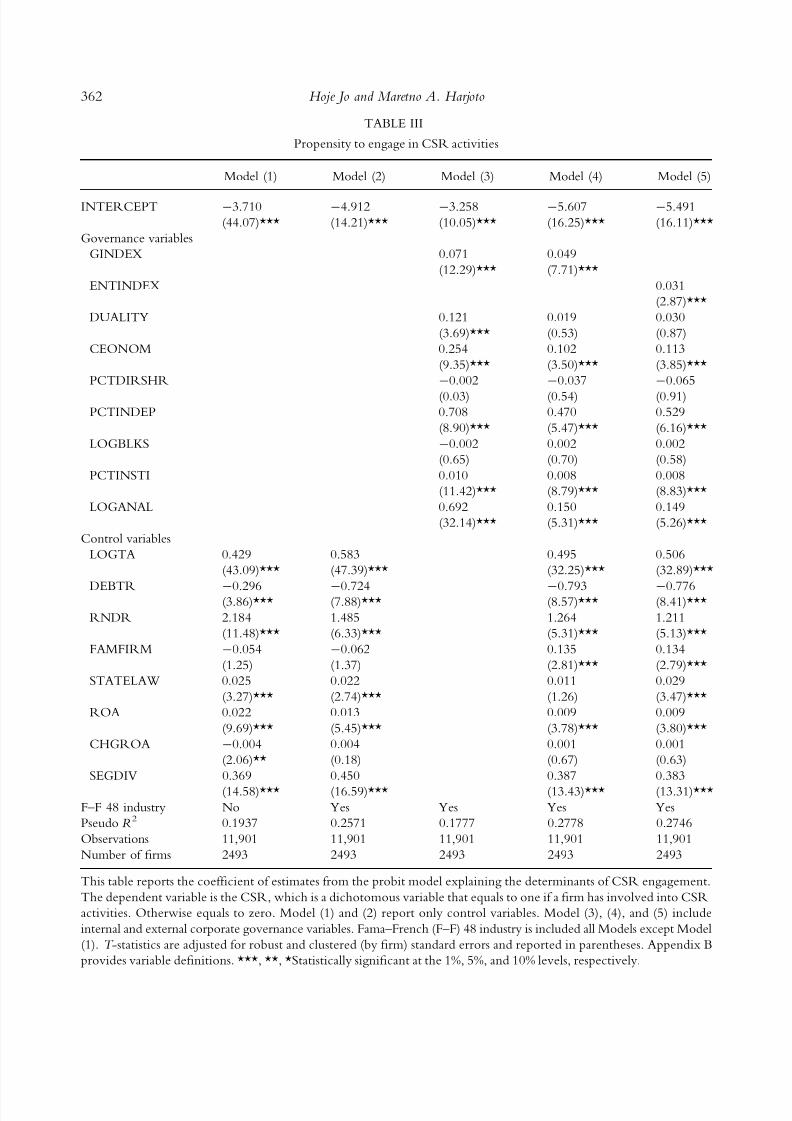
In Table III, we estimate the choice of CSR
engagement using a probit function. We estimate five
models with different sets of explanatory variables
to compare and contrast the various impacts of con-trol variables and corporate governance variables.
Throughout Model (1) to Model (5), we replace or add
some of the explanatory variables to investigatethe role
of governance and monitoring in the analysis.7
Consistent with prior literature, we can see that
many of our chosen variables are highly significant in
explaining the likelihood of choosing CSR engage-
ment for all Models (1) to (5). Model (1) shows that
larger firms, highly leveraged firms, profitable firms,
firms with higher R&D, and diversified firms are
more likely to choose CSR engagement while the
coefficient on FAMFIRM is insignificant. Model (2)shows the same results with the industry adjustment.
Basically, the results are similar, except the signifi-
cance of CHGROA disappears. In model (3), we
report the results for the governance variables only.
Model (3) suggests that the coefficients on GINDEX,
DUALITY, CEONOM, PCTINDEP, PCTINSTI,
and LOGANAL are significantly positive at the 1%
significance level, implying that firms with a higher
board leadership (DUALITY and CEONOM), a
higher proportion of outside independent directors
(PCTINDEP), a higher proportion of institutionalinvestors (PCTINSTI), more analysts following the
firm (LOGANAL), or more anti-takeover provisions
(GINDEX) are more likely to choose CSR engage-
ment.8 We find that the estimated slope coefficients
on PCTINDEP and LOGANAL have the highest
economic significance on the firms’ choice of CSR
engagement. These findings suggest that internal and
external governance measured by board leader-
ship, independent boards, institutional investors, and
security analysts are positively related to the choice of
T A B L E I I
c o n t i n u e d
1 3
1 4
1 5
1 6
1 7
1 8
1 9
2 0
2 1
2 2
2 3
2 4
2 5
1 8
D U A L I T Y
- 0 . 0 1
0 . 0 1
0 . 0 6 a
0 . 1 2 a
0 . 0 8 a
1
1 9
C E O N O M
- 0 . 0 5 a
0 . 0 2 c
0 . 1 4 a
0 . 1 7 a
0 . 1 3 a
0 . 2 0 a
1
2 0
B S I Z E
- 0 . 0 3 a
0 . 0 5 a
0 . 0 6 a
0 . 2 2 a
0 . 1 0 a
0 . 1 2 a
0 . 1 5 a
1
2 1
P C T I N D E P
- 0 . 0 7 a
0 . 0 3 a
0 . 1 6 a
0 . 2 7 a
0 . 2 6 a
0 . 1 4 a
0 . 2 1 a
0 . 1
1 a
1
2 2
P C T D I R S H R
0 . 0 2 b
- 0 . 0 1
0 . 0 1
- 0 . 1 7 a
-
0 . 1 6 a
- 0 . 0 0 4
- 0 . 0 3 a
- 0 . 0
6 a
- 0 . 2 4 a
1
2 3
L O G B L K S
0 . 0 1
- 0 . 0 2 b
0 . 0 3 a
- 0 . 0 0 3
0 . 0 5 a
- 0 . 0 0 1
0 . 0 1
- 0 . 1
6 a
0 . 0 3 a
- 0 . 0 3 a
1
2 4
L O G A N A L
0 . 0 8 a
0 . 0 1
- 0 . 0 3 a
0 . 0 9 a
0 . 0 1
0 . 1 2 a
0 . 0 9 a
0 . 3
1 a
0 . 1 2 a
- 0 . 1 4 a
- 0 . 0 1
1
2 5
P C T I N S T I
0 . 0 3 a
- 0 . 0 2 c
0 . 1 5 a
0 . 0 6 a
0 . 1 1 a
0 . 0 4 8 a
0 . 0 6 a
- 0 . 1
4 a
0 . 1 8 a
- 0 . 1 5 a
0 . 5 1 a
0 . 1 7 a
1
T h i s t a b l e r e p o r t s S p e a r m a n c o r r e l a t i o n c o e f fi c i e n t s a m o n g v a r i a b l e s f o
r t h e 7 7 5 0 fi r m - y e a r o b s e r v a t i o n s o f n o - C S R fi r m s a n d 5 6 3 9 fi r m - y e a r o b
s e r v a t i o n s o f
C S R fi r m s f r o m 1 9 9 3 t o 2 0 0 4 . S
e e A p p e n d i x B f o r v a r i a b l e d e fi n i t i o n s .
a ,
b ,
c
i n d i c a t e t h e 1 % , 5 % , a n d 1 0
% l e v e l o f s i g n i fi c a n c e , r e s p e c t i v e l y .
361Corporate Governance and Firm Value
8/12/2019 Csr and Corporate Governace
http://slidepdf.com/reader/full/csr-and-corporate-governace 12/34
TABLE III
Propensity to engage in CSR activities
Model (1) Model (2) Model (3) Model (4) Model (5)
INTERCEPT -3.710
(44.07)***
-4.912
(14.21)***
-3.258
(10.05)***
-5.607
(16.25)***
-5.491
(16.11)***
Governance variables
GINDEX 0.071
(12.29)***
0.049
(7.71)***
ENTINDEX 0.031
(2.87)***
DUALITY 0.121
(3.69)***
0.019
(0.53)
0.030
(0.87)
CEONOM 0.254
(9.35)***
0.102
(3.50)***
0.113
(3.85)***
PCTDIRSHR -0.002
(0.03)
-0.037
(0.54)
-0.065
(0.91)PCTINDEP 0.708
(8.90)***
0.470
(5.47)***
0.529
(6.16)***
LOGBLKS -0.002
(0.65)
0.002
(0.70)
0.002
(0.58)
PCTINSTI 0.010
(11.42)***
0.008
(8.79)***
0.008
(8.83)***
LOGANAL 0.692
(32.14)***
0.150
(5.31)***
0.149
(5.26)***
Control variables
LOGTA 0.429
(43.09)***
0.583
(47.39)***
0.495
(32.25)***
0.506
(32.89)***
DEBTR -0.296(3.86)***
-0.724(7.88)***
-0.793(8.57)***
-0.776(8.41)***
RNDR 2.184
(11.48)***
1.485
(6.33)***
1.264
(5.31)***
1.211
(5.13)***
FAMFIRM -0.054
(1.25)
-0.062
(1.37)
0.135
(2.81)***
0.134
(2.79)***
STATELAW 0.025
(3.27)***
0.022
(2.74)***
0.011
(1.26)
0.029
(3.47)***
ROA 0.022
(9.69)***
0.013
(5.45)***
0.009
(3.78)***
0.009
(3.80)***
CHGROA -0.004
(2.06)**
0.004
(0.18)
0.001
(0.67)
0.001
(0.63)
SEGDIV 0.369
(14.58)***
0.450
(16.59)***
0.387
(13.43)***
0.383
(13.31)***
F–F 48 industry No Yes Yes Yes Yes
Pseudo R 2 0.1937 0.2571 0.1777 0.2778 0.2746
Observations 11,901 11,901 11,901 11,901 11,901
Number of firms 2493 2493 2493 2493 2493
This table reports the coefficient of estimates from the probit model explaining the determinants of CSR engagement.
The dependent variable is the CSR, which is a dichotomous variable that equals to one if a firm has involved into CSR
activities. Otherwise equals to zero. Model (1) and (2) report only control variables. Model (3), (4), and (5) include
internal and external corporate governance variables. Fama–French (F–F) 48 industry is included all Models except Model
(1). T -statistics are adjusted for robust and clustered (by firm) standard errors and reported in parentheses. Appendix B
provides variable definitions. ***, **, *Statistically significant at the 1%, 5%, and 10% levels, respectively.
362 Hoje Jo and Maretno A. Harjoto
8/12/2019 Csr and Corporate Governace
http://slidepdf.com/reader/full/csr-and-corporate-governace 13/34
CSR engagement, supporting the conflict-resolution
hypothesis, as stated in hypothesis 1.
Other variables are insignificant at the conventional
level. In models (4) and (5), we report the results when
we include both control variables and governancevariables. The results for the governance variables are
qualitatively similar to those of model (3), except the
insignificance of the DUALITY variable. It is
important to note that the internal and external gov-
ernance variables are highly significant, suggesting
that they are major determinants of CSR engagement.
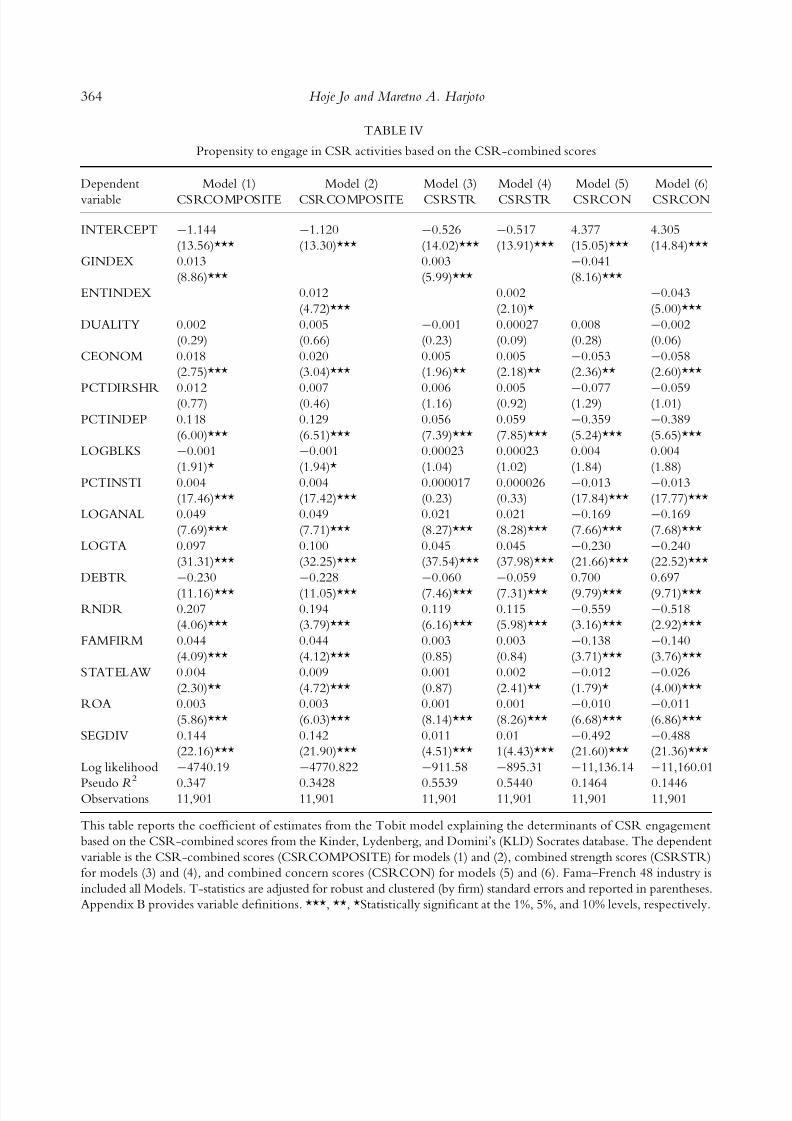
Table IV reports the coefficient of estimates from
the Tobit model explaining the determinants of
CSR engagement based on the CSR-combined
scores instead of the CSR choice (dummy) variable.
We use the Tobit model because the dependentvariables are left censored at zero rather than
dichotomous variables. The Tobit model is an
econometric model proposed by Tobin (1958)
to describe the relation between a non-negative
dependent variable and an independent variable (or
vector). We compute the arithmetic average of the
combined scores of KLD inclusive strengths and
concerns of community, environment, diversity,
employee relations, and product criteria to get
combined CSR scores. KLD scores report both
strengths and concerns for the above-mentioned
dimensions. The dependent variable is the CSR-combined scores, including both strengths and
concerns (CSRCOMPOSITE) for models (1) and
(2), combined strength scores (CSRSTR) for models
(3) and (4), and combined concern scores (CSR-
CON) for models (5) and (6), respectively [see the
calculation procedures of the combined strengths
and concerns, combined strength, and combined
concern scores (unreported, but similar to the cal-
culation of strength scores in Appendix C)]. The
results closely mirror those of Table III, in that
the governance and monitoring variables positivelyaffect the firms’ decisions about CSR engagement,
supporting the conflict-resolution hypothesis. As
expected, the signs of the coefficients on all the
variables based on CSRCON are exactly opposite of
those of the coefficients based on CSRSTR.
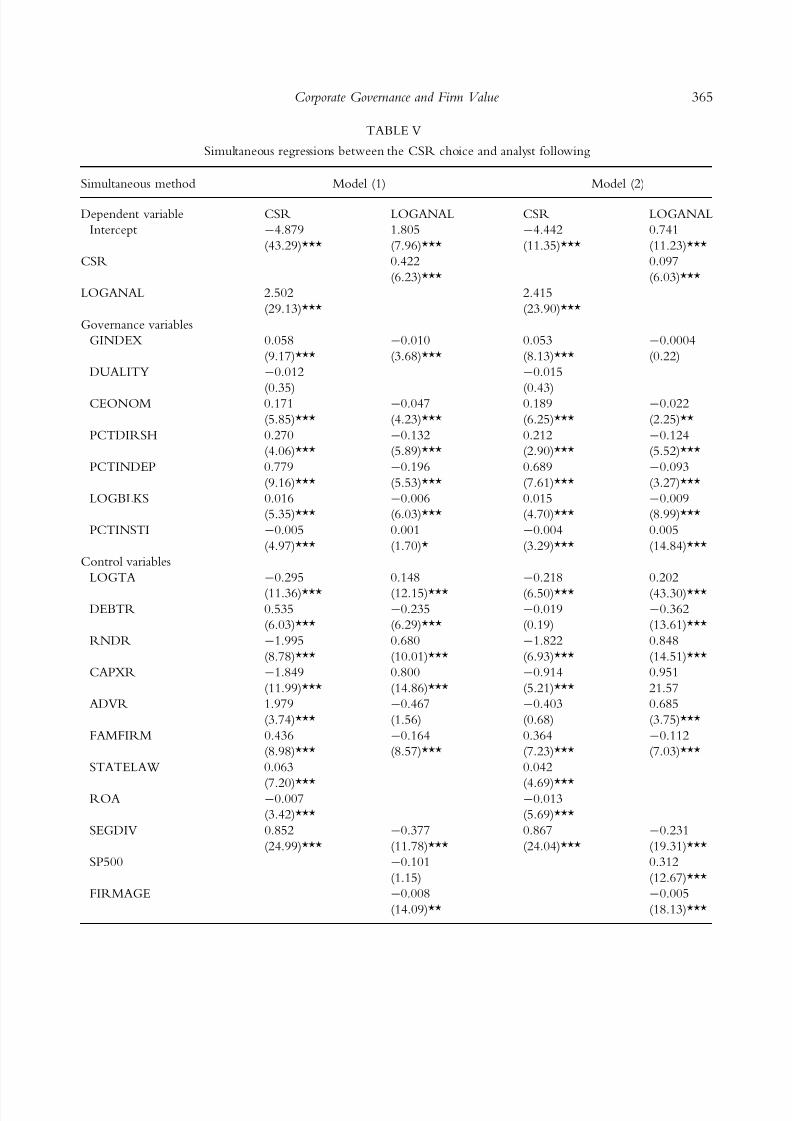
Table V shows the results of the 2SLS with the two
dependent variables of CSR and LOGANAL. We
employ the 2SLS estimation method described in
Maddala (1983) for simultaneous equations models in
which one of the endogenous variables is continuous
(LOGANAL) and the other endogenous variable is
dichotomous (CSR). Our results suggest that after
correcting for a potential simultaneity bias, the possi-
bility that firms with a greater analyst following tend to
engage in CSR engagement (with t -values of 23.90– 29.13) is much higher than the possibility that firms
choosing CSR tend to have a higher analyst following
(with t -values of 6.03–6.23). It seems that firms with
greater analyst coverage (i.e., firms with a transparent
information environment) opt for CSR engagement
after incorporating the reverse causality. In addition,
although the top management of CSR firms can
control the number of outside independent directors,
they cannot control the number of analysts following
the firm. Accordingly, security analysts, as third-party
information intermediaries, can provide an externalmonitoring mechanism in the top management’s
decision-making about CSR engagement.
So far, we use board independence as one of the
measures for the quality of the firm’s internal gov-
ernance. But for two reasons there may not be a
one-to-one relation between governance quality and
board independence. First, Coles et al. (2008) indi-
cate that board independence reflects such things as
firm diversification, firm size, firm age, and insider
ownership. These researchers claim that board
independence reflects, and is driven by, other
characteristics of the firm and its line of business.There is no single board structure that fits all
firms. Rather, board independence is endogenously
determined by firm and managerial characteristics.
This indicates that board independence may or may
not be an indicator of governance quality. Suppose,
for example, that ceteris paribus, board independence
does improve governance. Then, firms with few
independent directors might have more blockhold-
ers, or fewer takeover defenses, or more bond cov-
enants, to offset the effects of having few
independent directors. The result could be that suchfirms have better governance, not worse. Thus, we
include such variables, including firm diversification,
firm size, firm age, insider ownership, blockholder
ownership, and GIM index, etc. in the independent
director equation to address the endogeneity issue.
Our unreported results based on two-stage least-
square (2SLS) regressions, in which both CSR
engagement and the percentage of outside indepen-
dent directors are dependent variables, again support
the monitoring role of outside independent directors.
363Corporate Governance and Firm Value
8/12/2019 Csr and Corporate Governace
http://slidepdf.com/reader/full/csr-and-corporate-governace 14/34
TABLE IV
Propensity to engage in CSR activities based on the CSR-combined scores
Dependent
variable
Model (1) Model (2) Model (3) Model (4) Model (5) Model (6)
CSRCOMPOSITE CSRCOMPOSITE CSRSTR CSRSTR CSRCON CSRCON
INTERCEPT -1.144
(13.56)***
-1.120
(13.30)***
-0.526
(14.02)***
-0.517
(13.91)***
4.377
(15.05)***
4.305
(14.84)***
GINDEX 0.013
(8.86)***
0.003
(5.99)***
-0.041
(8.16)***
ENTINDEX 0.012
(4.72)***
0.002
(2.10)*
-0.043
(5.00)***
DUALITY 0.002
(0.29)
0.005
(0.66)
-0.001
(0.23)
0.00027
(0.09)
0.008
(0.28)
-0.002
(0.06)
CEONOM 0.018
(2.75)***
0.020
(3.04)***
0.005
(1.96)**
0.005
(2.18)**
-0.053
(2.36)**
-0.058
(2.60)***
PCTDIRSHR 0.012(0.77) 0.007(0.46) 0.006(1.16) 0.005(0.92)
-
0.077(1.29)
-
0.059(1.01)
PCTINDEP 0.118
(6.00)***
0.129
(6.51)***
0.056
(7.39)***
0.059
(7.85)***
-0.359
(5.24)***
-0.389
(5.65)***
LOGBLKS -0.001
(1.91)*
-0.001
(1.94)*
0.00023
(1.04)
0.00023
(1.02)
0.004
(1.84)
0.004
(1.88)
PCTINSTI 0.004
(17.46)***
0.004
(17.42)***
0.000017
(0.23)
0.000026
(0.33)
-0.013
(17.84)***
-0.013
(17.77)***
LOGANAL 0.049
(7.69)***
0.049
(7.71)***
0.021
(8.27)***
0.021
(8.28)***
-0.169
(7.66)***
-0.169
(7.68)***
LOGTA 0.097
(31.31)***
0.100
(32.25)***
0.045
(37.54)***
0.045
(37.98)***
-0.230
(21.66)***
-0.240
(22.52)***
DEBTR -0.230
(11.16)***
-0.228
(11.05)***
-0.060
(7.46)***
-0.059
(7.31)***
0.700
(9.79)***
0.697
(9.71)***RNDR 0.207
(4.06)***
0.194
(3.79)***
0.119
(6.16)***
0.115
(5.98)***
-0.559
(3.16)***
-0.518
(2.92)***
FAMFIRM 0.044
(4.09)***
0.044
(4.12)***
0.003
(0.85)
0.003
(0.84)
-0.138
(3.71)***
-0.140
(3.76)***
STATELAW 0.004
(2.30)**
0.009
(4.72)***
0.001
(0.87)
0.002
(2.41)**
-0.012
(1.79)*
-0.026
(4.00)***
ROA 0.003
(5.86)***
0.003
(6.03)***
0.001
(8.14)***
0.001
(8.26)***
-0.010
(6.68)***
-0.011
(6.86)***
SEGDIV 0.144
(22.16)***
0.142
(21.90)***
0.011
(4.51)***
0.01
1(4.43)***
-0.492
(21.60)***
-0.488
(21.36)***
Log likelihood -4740.19 -4770.822 -911.58 -895.31 -11,136.14 -11,160.01
Pseudo R 2
0.347 0.3428 0.5539 0.5440 0.1464 0.1446Observations 11,901 11,901 11,901 11,901 11,901 11,901
This table reports the coefficient of estimates from the Tobit model explaining the determinants of CSR engagement
based on the CSR-combined scores from the Kinder, Lydenberg, and Domini’s (KLD) Socrates database. The dependent
variable is the CSR-combined scores (CSRCOMPOSITE) for models (1) and (2), combined strength scores (CSRSTR)
for models (3) and (4), and combined concern scores (CSRCON) for models (5) and (6). Fama–French 48 industry is
included all Models. T-statistics are adjusted for robust and clustered (by firm) standard errors and reported in parentheses.
Appendix B provides variable definitions. ***, **, *Statistically significant at the 1%, 5%, and 10% levels, respectively.
364 Hoje Jo and Maretno A. Harjoto
8/12/2019 Csr and Corporate Governace
http://slidepdf.com/reader/full/csr-and-corporate-governace 15/34
TABLE V
Simultaneous regressions between the CSR choice and analyst following
Simultaneous method Model (1) Model (2)
Dependent variable CSR LOGANAL CSR LOGANAL
Intercept -4.879
(43.29)***
1.805
(7.96)***
-4.442
(11.35)***
0.741
(11.23)***
CSR 0.422
(6.23)***
0.097
(6.03)***
LOGANAL 2.502
(29.13)***
2.415
(23.90)***
Governance variables
GINDEX 0.058
(9.17)***
-0.010
(3.68)***
0.053
(8.13)***
-0.0004
(0.22)
DUALITY -0.012
(0.35)
-0.015
(0.43)CEONOM 0.171
(5.85)***
-0.047
(4.23)***
0.189
(6.25)***
-0.022
(2.25)**
PCTDIRSH 0.270
(4.06)***
-0.132
(5.89)***
0.212
(2.90)***
-0.124
(5.52)***
PCTINDEP 0.779
(9.16)***
-0.196
(5.53)***
0.689
(7.61)***
-0.093
(3.27)***
LOGBLKS 0.016
(5.35)***
-0.006
(6.03)***
0.015
(4.70)***
-0.009
(8.99)***
PCTINSTI -0.005
(4.97)***
0.001
(1.70)*
-0.004
(3.29)***
0.005
(14.84)***
Control variables
LOGTA -0.295
(11.36)***
0.148
(12.15)***
-0.218
(6.50)***
0.202
(43.30)***DEBTR 0.535
(6.03)***
-0.235
(6.29)***
-0.019
(0.19)
-0.362
(13.61)***
RNDR -1.995
(8.78)***
0.680
(10.01)***
-1.822
(6.93)***
0.848
(14.51)***
CAPXR -1.849
(11.99)***
0.800
(14.86)***
-0.914
(5.21)***
0.951
21.57
ADVR 1.979
(3.74)***
-0.467
(1.56)
-0.403
(0.68)
0.685
(3.75)***
FAMFIRM 0.436
(8.98)***
-0.164
(8.57)***
0.364
(7.23)***
-0.112
(7.03)***
STATELAW 0.063
(7.20)***
0.042
(4.69)***ROA -0.007
(3.42)***
-0.013
(5.69)***
SEGDIV 0.852
(24.99)***
-0.377
(11.78)***
0.867
(24.04)***
-0.231
(19.31)***
SP500 -0.101
(1.15)
0.312
(12.67)***
FIRMAGE -0.008
(14.09)**
-0.005
(18.13)***
365Corporate Governance and Firm Value

8/12/2019 Csr and Corporate Governace
http://slidepdf.com/reader/full/csr-and-corporate-governace 16/34
We find that the coefficients on PCTINDEP and
CSR are positive and statistically significant ( p va-lue< 0.01). We also find that the coefficients on
PCTDIRSHR, LOGBLKS, and LOGANAL are
significantly positive. These results suggest that having
a certain governance structure is important in deter-
mining CSR involvement. However, we also find
that the causality runs from some governance and
control variables to board independence. Since nei-
ther CSR engagement nor board independence
changes frequently, simple 2SLS results may not
capture causality precisely.9 Nevertheless, this reverse
causality suggests that after correcting for a potentialsimultaneity bias, the possibility that firms choosing
CSR engagement tend to have outside independent
directors (with t -values of 9.17–10.35) is slightly
smaller than the possibility that firms with a higher
proportion of independent directors engage in CSR
engagement (with t -values of 17.58–19.12). It seems
that the potential simultaneity bias does not signifi-
cantly change our inferences concerning the associa-
tion between the governance and monitoring
variables and CSR engagement.
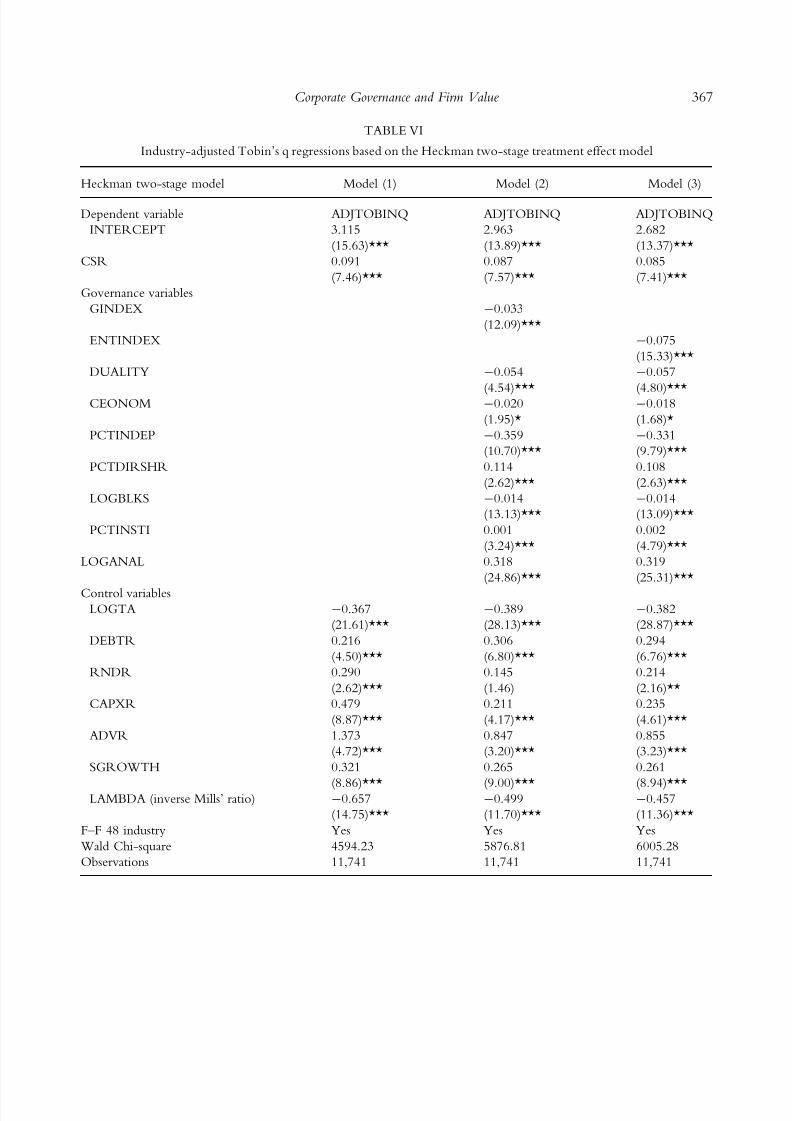
The value of firms with CSR engagement
Next, this study examines the impact of CSR
involvement on firm value, measured by industry-
adjusted Tobin’s q (ADJTOBINQ) because Camp-
bell (1996) suggests that ADJTOBINQ neutralizes
the industry effect on Tobin’s q. Using Heckman’s
(1979) two-stage model, we report several models in
Table VI. In model (1), following GIM (2010), Shin
and Stulz (2000), and Morck and Yang (2001), we
include capital expenditures divided by total sales
(CAPXR), the ratio of advertising to sales (ADVR),growth options measured by R&D expenditure
divided by sales (RNDR), and sales growth
(SGROWTH). The evidence suggests that CSR
engagement positively affects firm value measured
by industry-adjusted Tobin’s q after correcting for
the endogenous treatment effect, supporting the
conflict-resolution hypothesis as opposed to the
overinvestment hypothesis.
Next, we add governance and monitoring vari-
ables to examine whether any governance or moni-
toring variables influence firm value after theendogeneity correction, and report the results of the
positive association between CSR and ADJTO-
BINQ in model (2). In particular, a one unit increase
of CSR engagement is followed by an increase of
0.085 times of ADJTOBINQ. In addition, the
coefficient on LOGANAL is significantly positive
with a t -value of 24.86, suggesting that security
analysts provide an additional monitoring role, which
is supportive for hypothesis 2(b). This evidence is
consistent with Chung and Jo (1996), who find that
analyst coverage makes a firm’s information envi-
ronment transparent and positively affects firm value.
The coefficient on PCTINSTI is also positive, but its
magnitude is only marginal. In contrast, however, the
coefficients on DUALITY and GINDEX are sig-
nificantly negative, indicating that the dual role of the
CEO and the chairperson and many take-over de-
fenses through anti-takeover provisions (GINDEX)
adversely affect firm value. In particular, an inverse
association between GINDEX and industry-adjusted
Tobin’s q implies that too much take-over defense
TABLE V
continued
Simultaneous method Model (1) Model (2)
F–F 48 Industry No No Yes Yes
Pseudo R 2 0.2862 0.3130
Adjusted R 2 0.5305 0.5304
Observations 11,808 11,808 11,808 11,808
This table shows the results from two-stage estimation method described in Maddala (1983) for simultaneous equations
models in which one of the endogenous variables is continuous (LOGANAL) and the other endogenous variable is
dichotomous (CSR). T-statistics are adjusted for robust and clustered (by firm) standard errors and reported in parentheses.
See Appendix B for variable definitions. ***, **, *Statistically significant at the 1%, 5%, and 10% levels, respectively.
366 Hoje Jo and Maretno A. Harjoto
8/12/2019 Csr and Corporate Governace
http://slidepdf.com/reader/full/csr-and-corporate-governace 17/34
8/12/2019 Csr and Corporate Governace
http://slidepdf.com/reader/full/csr-and-corporate-governace 18/34
adversely affects firm value, which is consistent with
Cremers and Nair (2005) and GIM (2003).
Model (3) shows that the results based on Bebchuket al.’s (2009) entrenchment index are even more
significantly and inversely associated with industry-
adjusted Tobin’s q, confirming the adverse effects of
managerial entrenchment on firm value. More
importantly, the positive associations between CSR
and ADJTOBINQ and LOGANAL and ADJTO-
BINQ remain unchanged. Although unreported, the
above results do not change when we run the
regressions with each governance variable separately
to reduce potential problems due to multicollinear-
ity. Consistent with Agrawal and Knoeber (1996),we also find a negative association between ADJT-
OBINQ and the proportion of outside independent
directors. The coefficients on lambda (inverse Mills’
ratio), however, are significantly negative in all three
models, implying a possibility that the above results
contain some sample selection bias.
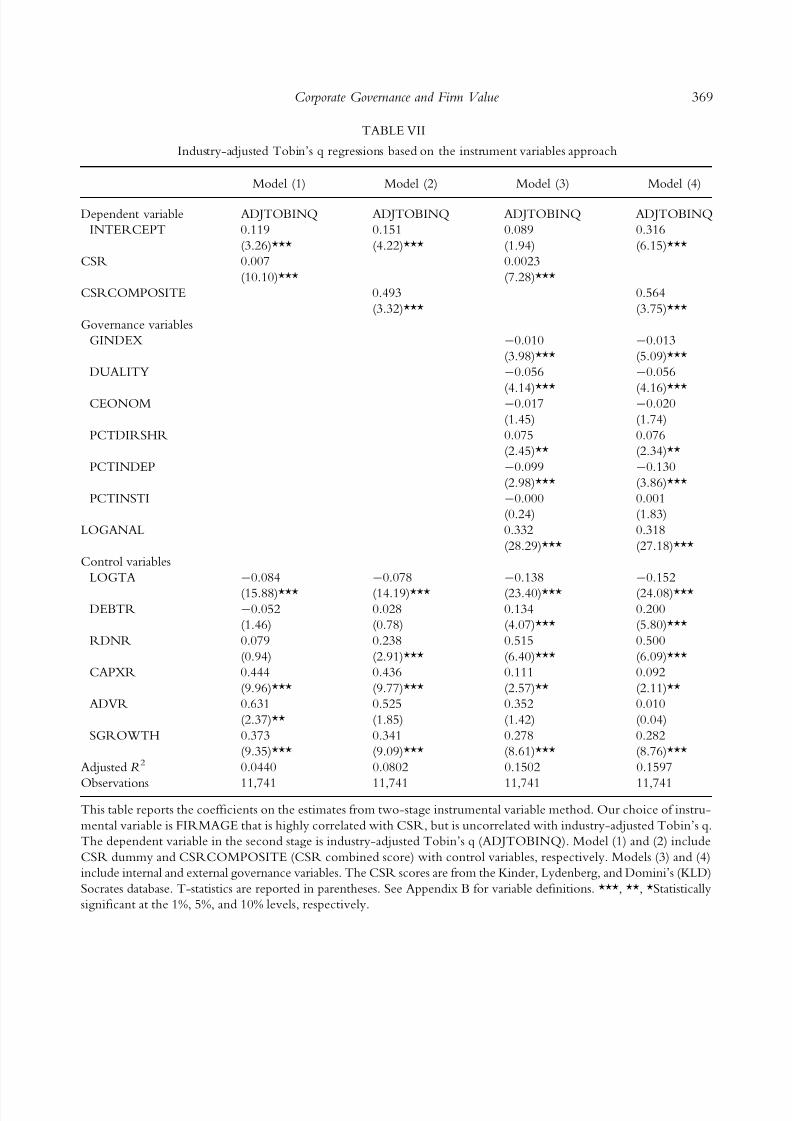
Thus, to address the selection bias problem, we
report the results based on the instrumental variables
approach in Table VII. The results, in general, clo-
sely mirror the Heckman two-stage results based on
endogeneity control. Most notably, both the coef-
ficients on the CSR dummy and the CSRCOM-
POSITE (CSR combined score) suggest that CSR
engagement is positively associated with firm value
with or without governance variables as independent
variables, supporting our hypothesis 2 (a) of CSR as
a conflict-resolution. The positive impact of analyst
following on firm value is also strongly significant in
all models. The results remain robust under various
specifications using the Heckman two-stage, OLS
(unreported), and instrumental variables approach,
strongly supporting hypothesis 2(b) for the external
monitoring role of security analysts. Notably, how-
ever, the coefficients on PCTINSTI become insig-nificant, possibly because of their dual roles of
monitors and investors.
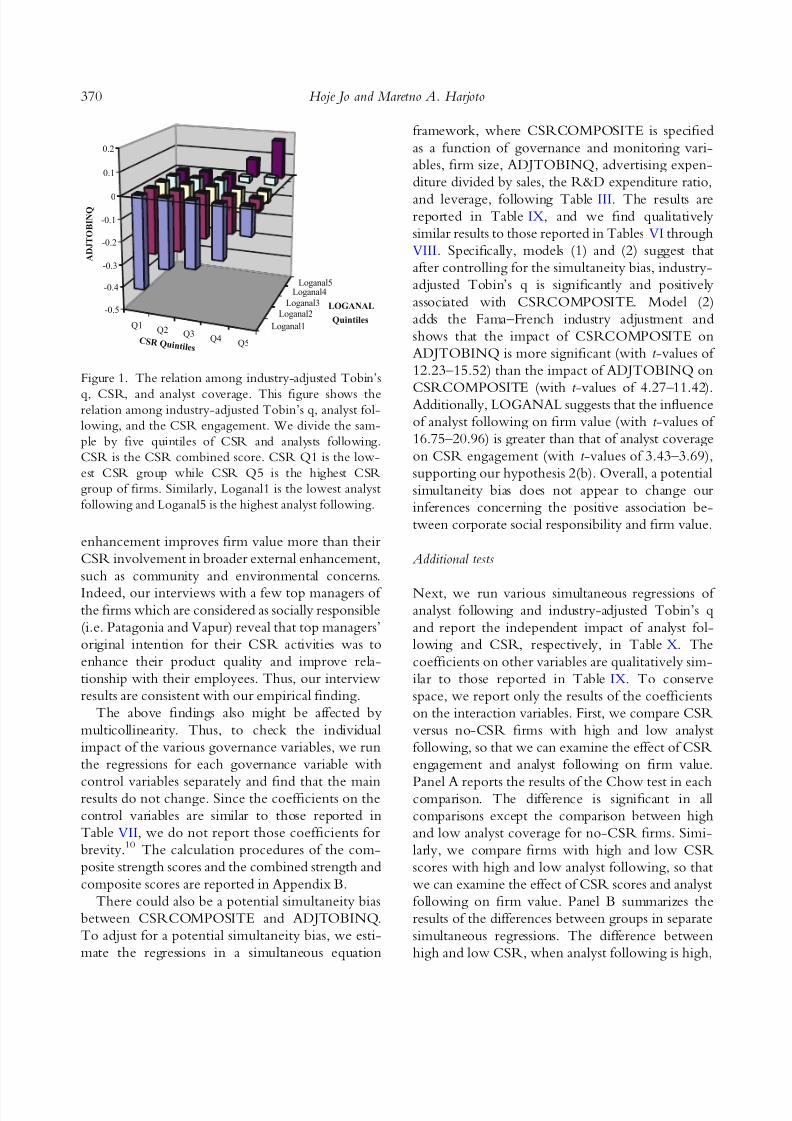
The visual effects of these relations are depicted in
Figure 1 for industry-adjusted Tobin’s q. In gen-
eral, these figures indicate that firms with higher
engagement in CSR activities are more likely to be
followed by security analysts and tend to have a
higher industry-adjusted Tobin’s q, while firms with
a higher analyst following tend to have a higher
industry-adjusted Tobin’s q.
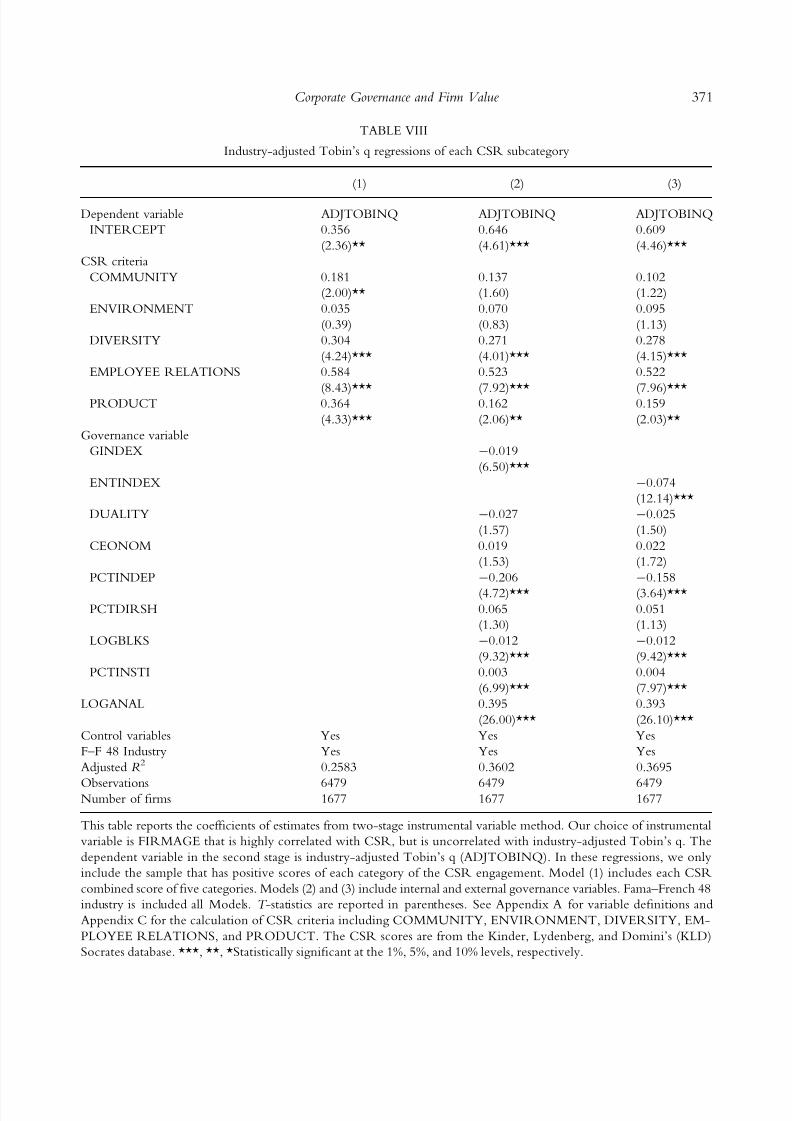
To examine the effects of individual CSR-inclusive criteria on firm value, we report the
coefficients of the estimates from the instrumental
variable method in Table VIII. Our choice of an
instrumental variable is FIRMAGE, which is highly
correlated with CSR, but is uncorrelated with
industry-adjusted Tobin’s q. The dependent variable
in the second stage is industry-adjusted Tobin’s q
(ADJTOBINQ). In these regressions, we include
only the sample that has positive scores for each
category of CSR engagement to focus on the pure
impact of CSR engagement on firm value. Model
(1) includes each CSR combined score for five
inclusive criteria. Models (2) and (3) include the
internal and external governance variables. The
results indicate that while the coefficients on DI-
VERSITY, EMPLOYEE RELATIONS, and
PRODUCT are positive and significant at least at
the five-percent level, the coefficients on COM-
MUNITY and ENVIRONMENT are, in general,
insignificant, suggesting that firms’ CSR engage-
ment directly related to their firms’ internal social
TABLE VI
continued
Heckman two-stage model Model (1) Model (2) Model (3)
Number of firms 2463 2463 2463
This table reports the coefficients of estimates from Heckman two-stage treatment effect models. In the first stage, we run
the probit model with same specification in Table III. We include Lambda (inverse Mills’ ratio) in the second stage with
control variables. The dependent variable in the second stage is industry-adjusted Tobin’s q (ADJTOBINQ). Model (1)
reports the results of control variables. Models (2) and (3) include internal and external corporate governance variables.
Fama–French 48 industry is included all Models. T-statistics are reported in parentheses. See Appendix B for variable
definitions. ***, **, *Statistically significant at the 1%, 5%, and 10% levels, respectively.
368 Hoje Jo and Maretno A. Harjoto
8/12/2019 Csr and Corporate Governace
http://slidepdf.com/reader/full/csr-and-corporate-governace 19/34
TABLE VII
Industry-adjusted Tobin’s q regressions based on the instrument variables approach
Model (1) Model (2) Model (3) Model (4)
Dependent variable ADJTOBINQ ADJTOBINQ ADJTOBINQ ADJTOBINQ
INTERCEPT 0.119
(3.26)***
0.151
(4.22)***
0.089
(1.94)
0.316
(6.15)***
CSR 0.007
(10.10)***
0.0023
(7.28)***
CSRCOMPOSITE 0.493
(3.32)***
0.564
(3.75)***
Governance variables
GINDEX -0.010
(3.98)***
-0.013
(5.09)***
DUALITY -0.056
(4.14)***
-0.056
(4.16)***CEONOM -0.017
(1.45)
-0.020
(1.74)
PCTDIRSHR 0.075
(2.45)**
0.076
(2.34)**
PCTINDEP -0.099
(2.98)***
-0.130
(3.86)***
PCTINSTI -0.000
(0.24)
0.001
(1.83)
LOGANAL 0.332
(28.29)***
0.318
(27.18)***
Control variables
LOGTA -0.084
(15.88)***
-0.078
(14.19)***
-0.138
(23.40)***
-0.152
(24.08)***DEBTR -0.052
(1.46)
0.028
(0.78)
0.134
(4.07)***
0.200
(5.80)***
RDNR 0.079
(0.94)
0.238
(2.91)***
0.515
(6.40)***
0.500
(6.09)***
CAPXR 0.444
(9.96)***
0.436
(9.77)***
0.111
(2.57)**
0.092
(2.11)**
ADVR 0.631
(2.37)**
0.525
(1.85)
0.352
(1.42)
0.010
(0.04)
SGROWTH 0.373
(9.35)***
0.341
(9.09)***
0.278
(8.61)***
0.282
(8.76)***
Adjusted R 2 0.0440 0.0802 0.1502 0.1597
Observations 11,741 11,741 11,741 11,741
This table reports the coefficients on the estimates from two-stage instrumental variable method. Our choice of instru-
mental variable is FIRMAGE that is highly correlated with CSR, but is uncorrelated with industry-adjusted Tobin’s q.
The dependent variable in the second stage is industry-adjusted Tobin’s q (ADJTOBINQ). Model (1) and (2) include
CSR dummy and CSRCOMPOSITE (CSR combined score) with control variables, respectively. Models (3) and (4)
include internal and external governance variables. The CSR scores are from the Kinder, Lydenberg, and Domini’s (KLD)
Socrates database. T-statistics are reported in parentheses. See Appendix B for variable definitions. ***, **, *Statistically
significant at the 1%, 5%, and 10% levels, respectively.
369Corporate Governance and Firm Value
8/12/2019 Csr and Corporate Governace
http://slidepdf.com/reader/full/csr-and-corporate-governace 20/34
8/12/2019 Csr and Corporate Governace
http://slidepdf.com/reader/full/csr-and-corporate-governace 21/34
TABLE VIII
Industry-adjusted Tobin’s q regressions of each CSR subcategory
(1) (2) (3)
Dependent variable ADJTOBINQ ADJTOBINQ ADJTOBINQ
INTERCEPT 0.356
(2.36)**
0.646
(4.61)***
0.609
(4.46)***
CSR criteria
COMMUNITY 0.181
(2.00)**
0.137
(1.60)
0.102
(1.22)
ENVIRONMENT 0.035
(0.39)
0.070
(0.83)
0.095
(1.13)
DIVERSITY 0.304
(4.24)***
0.271
(4.01)***
0.278
(4.15)***
EMPLOYEE RELATIONS 0.584
(8.43)***
0.523
(7.92)***
0.522
(7.96)***PRODUCT 0.364
(4.33)***
0.162
(2.06)**
0.159
(2.03)**
Governance variable
GINDEX -0.019
(6.50)***
ENTINDEX -0.074
(12.14)***
DUALITY -0.027
(1.57)
-0.025
(1.50)
CEONOM 0.019
(1.53)
0.022
(1.72)
PCTINDEP -0.206
(4.72)***
-0.158
(3.64)***PCTDIRSH 0.065
(1.30)
0.051
(1.13)
LOGBLKS -0.012
(9.32)***
-0.012
(9.42)***
PCTINSTI 0.003
(6.99)***
0.004
(7.97)***
LOGANAL 0.395
(26.00)***
0.393
(26.10)***
Control variables Yes Yes Yes
F–F 48 Industry Yes Yes Yes
Adjusted R 2 0.2583 0.3602 0.3695
Observations 6479 6479 6479Number of firms 1677 1677 1677
This table reports the coefficients of estimates from two-stage instrumental variable method. Our choice of instrumental
variable is FIRMAGE that is highly correlated with CSR, but is uncorrelated with industry-adjusted Tobin’s q. The
dependent variable in the second stage is industry-adjusted Tobin’s q (ADJTOBINQ). In these regressions, we only
include the sample that has positive scores of each category of the CSR engagement. Model (1) includes each CSR
combined score of five categories. Models (2) and (3) include internal and external governance variables. Fama–French 48
industry is included all Models. T -statistics are reported in parentheses. See Appendix A for variable definitions and
Appendix C for the calculation of CSR criteria including COMMUNITY, ENVIRONMENT, DIVERSITY, EM-
PLOYEE RELATIONS, and PRODUCT. The CSR scores are from the Kinder, Lydenberg, and Domini’s (KLD)
Socrates database. ***, **, *Statistically significant at the 1%, 5%, and 10% levels, respectively.
371Corporate Governance and Firm Value
8/12/2019 Csr and Corporate Governace
http://slidepdf.com/reader/full/csr-and-corporate-governace 22/34
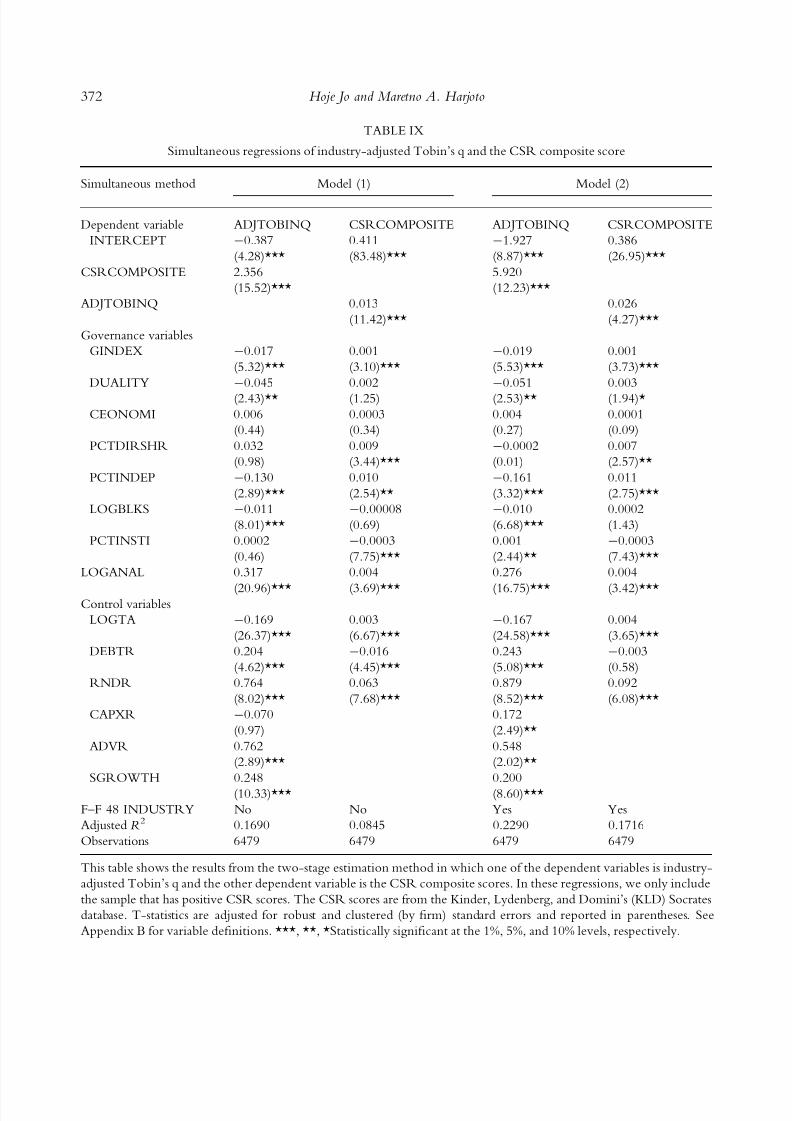
TABLE IX
Simultaneous regressions of industry-adjusted Tobin’s q and the CSR composite score
Simultaneous method Model (1) Model (2)
Dependent variable ADJTOBINQ CSRCOMPOSITE ADJTOBINQ CSRCOMPOSITE
INTERCEPT -0.387
(4.28)***
0.411
(83.48)***
-1.927
(8.87)***
0.386
(26.95)***
CSRCOMPOSITE 2.356
(15.52)***
5.920
(12.23)***
ADJTOBINQ 0.013
(11.42)***
0.026
(4.27)***
Governance variables
GINDEX -0.017
(5.32)***
0.001
(3.10)***
-0.019
(5.53)***
0.001
(3.73)***
DUALITY -0.045
(2.43)**
0.002
(1.25)
-0.051
(2.53)**
0.003
(1.94)*
CEONOMI 0.006
(0.44)
0.0003
(0.34)
0.004
(0.27)
0.0001
(0.09)
PCTDIRSHR 0.032
(0.98)
0.009
(3.44)***
-0.0002
(0.01)
0.007
(2.57)**
PCTINDEP -0.130
(2.89)***
0.010
(2.54)**
-0.161
(3.32)***
0.011
(2.75)***
LOGBLKS -0.011
(8.01)***
-0.00008
(0.69)
-0.010
(6.68)***
0.0002
(1.43)
PCTINSTI 0.0002
(0.46)
-0.0003
(7.75)***
0.001
(2.44)**
-0.0003
(7.43)***
LOGANAL 0.317
(20.96)***
0.004
(3.69)***
0.276
(16.75)***
0.004
(3.42)***Control variables
LOGTA -0.169
(26.37)***
0.003
(6.67)***
-0.167
(24.58)***
0.004
(3.65)***
DEBTR 0.204
(4.62)***
-0.016
(4.45)***
0.243
(5.08)***
-0.003
(0.58)
RNDR 0.764
(8.02)***
0.063
(7.68)***
0.879
(8.52)***
0.092
(6.08)***
CAPXR -0.070
(0.97)
0.172
(2.49)**
ADVR 0.762
(2.89)***
0.548
(2.02)**
SGROWTH 0.248
(10.33)***
0.200
(8.60)***
F–F 48 INDUSTRY No No Yes Yes
Adjusted R 2 0.1690 0.0845 0.2290 0.1716
Observations 6479 6479 6479 6479
This table shows the results from the two-stage estimation method in which one of the dependent variables is industry-
adjusted Tobin’s q and the other dependent variable is the CSR composite scores. In these regressions, we only include
the sample that has positive CSR scores. The CSR scores are from the Kinder, Lydenberg, and Domini’s (KLD) Socrates
database. T-statistics are adjusted for robust and clustered (by firm) standard errors and reported in parentheses. See
Appendix B for variable definitions. ***, **, *Statistically significant at the 1%, 5%, and 10% levels, respectively.
372 Hoje Jo and Maretno A. Harjoto
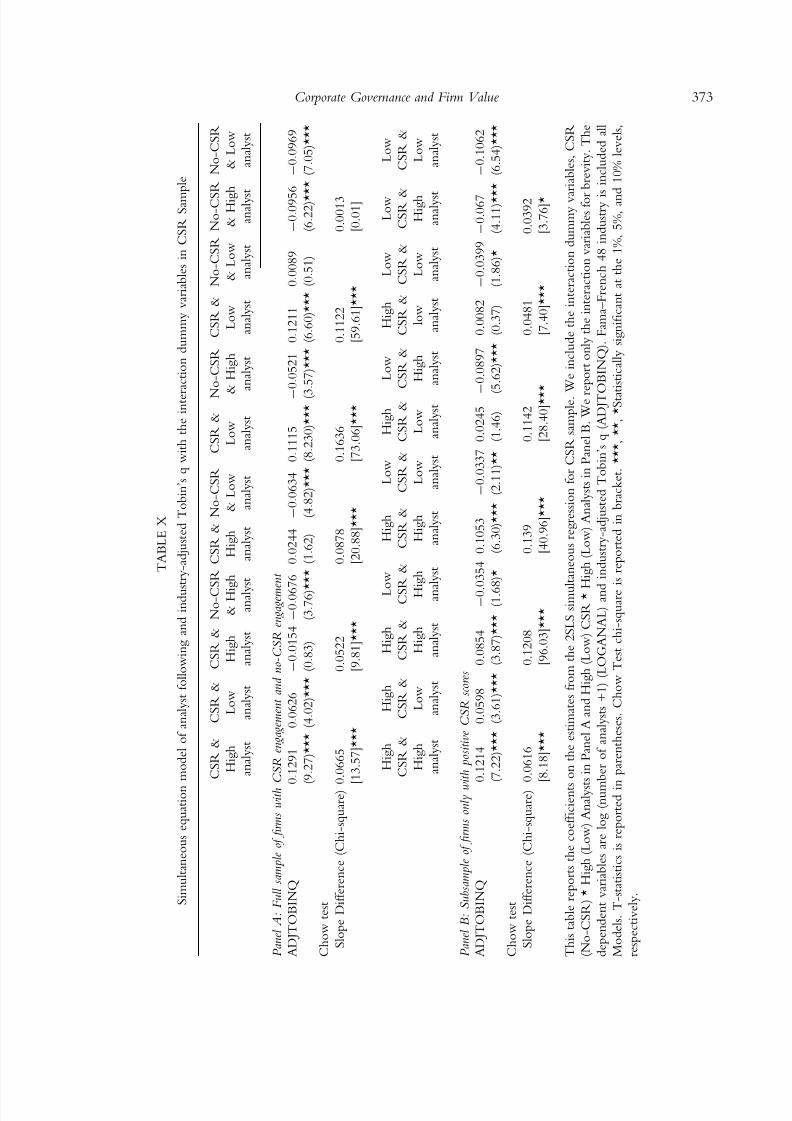
8/12/2019 Csr and Corporate Governace
http://slidepdf.com/reader/full/csr-and-corporate-governace 23/34
T A B L E X
S i m u l t a n e o u s e q u a t i o n m o d e l o f a n a l y s t f o l l o w i n g a n d i n d u s t r y - a d j u s t e d T o b i n ’ s q w i t h t h e i n t e r a c t i o n d u m m y v a r i a b l e s i n C S R S a m p l e
C S R &
H i g h
a n a l y s t
C S R &
L o w
a n a l y s t
C S R &
H i g h
a n a l y s t
N o - C S R
& H i g h
a n a l y s t
C S R &
H i g h
a n a l y s t
N o - C S R
& L o w
a n a l y s t
C S R &
L o w
a n a l y s t
N
o - C S R
&
H i g h
a n a l y s t
C S R &
L o w
a n a l y s t
N o - C S R
& L o w
a n a l y s t
N o - C S R
& H i g h
a n a l y s t
N o - C S R
& L o w
a n a l y s t
P a n e l A : F u l l s a m p l e o f fi r m s w i t h C
S R e n g a g e m e n t a n d n o - C S R e n g a g e m e
n t
A D J T O B I N Q
0 . 1 2 9 1
( 9 . 2 7 ) * * *
0 . 0 6 2 6
( 4 . 0 2 ) * * *
- 0 . 0 1 5 4
( 0 . 8 3 )
- 0 . 0 6 7 6
( 3 . 7 6 ) *
* * 0 . 0 2 4 4
( 1 . 6 2 )
- 0 . 0 6 3 4
( 4 . 8 2 ) * * *
0 . 1 1 1 5
( 8 . 2 3 0 ) * * *
-
0 . 0 5 2 1
( 3 . 5 7 ) * * *
0 . 1 2 1 1
( 6 . 6 0 ) * * *
0 . 0 0 8 9
( 0 . 5 1 )
- 0 . 0 9 5 6
( 6 . 2 2 ) * * *
- 0 . 0 9 6 9
( 7 . 0 5 ) * * *
C h o w t e s t
S l o p e D i f f e r e n c e ( C h i - s q u a r e ) 0 . 0 6 6 5
[ 1 3 . 5 7 ] * * *
0 . 0 5 2 2
[ 9 . 8 1 ] * * *
0 . 0 8 7 8
[ 2 0 . 8 8 ] * * *
0 . 1 6 3 6
[ 7 3 . 0 6 ] * * *
0 . 1 1 2 2
[ 5 9 . 6 1 ] * * *
0 . 0 0 1 3
[ 0 . 0 1 ]
H i g h
C S R &
H i g h
a n a l y s t
H i g h
C S R &
L o w
a n a l y s t
H i g h
C S R &
H i g h
a n a l y s t
L o
w
C S R
&
H i g h
a n a
l y s t
H i g h
C S R &
H i g h
a n a l y s t
L o w
C S R &
L o w
a n a l y s t
H i g h
C S R &
L o w
a n a l y s t
L o w
C S R &
H i g h
a n a l y s t
H i g h
C S R &
l o w
a n a l y s t
L o w
C S R &
L o w
a n a l y s t
L o w
C S R &
H i g h
a n a l y s t
L o w
C S R &
L o w
a n a l y s t
P a n e l B : S u b s a m p l e o f fi r m s o n l y w i t h p o s i t i v e C S R s c o r e s
A D J T O B I N Q
0 . 1 2 1 4
( 7 . 2 2 ) * * *
0 . 0 5 9 8
( 3 . 6 1 ) * * *
0 . 0 8 5 4
( 3 . 8 7 ) * * *
- 0 . 0 3 5 4
( 1 . 6 8 ) *
0 . 1 0 5 3
( 6 . 3 0 ) * * *
- 0 . 0 3 3 7
( 2 . 1 1 ) * *
0 . 0 2 4 5
( 1 . 4 6 )
- 0 . 0 8 9 7
( 5 . 6 2 ) * * *
0 . 0 0 8 2
( 0 . 3 7 )
- 0 . 0 3 9 9
( 1 . 8 6 ) *
- 0 . 0 6 7
( 4 . 1 1 ) * *
* - 0 . 1 0 6 2
( 6 . 5 4 ) * * *
C h o w t e s t
S l o p e D i f f e r e n c e ( C h i - s q u a r e ) 0 . 0 6 1 6
[ 8 . 1 8 ] * * *
0 . 1 2 0 8
[ 9 6 . 0 3 ] * * *
0 . 1 3 9
[ 4 0 . 9 6 ] * * *
0 . 1 1 4 2
[ 2 8 . 4 0 ] * * *
0 . 0 4 8 1
[ 7 . 4 0 ] * * *
0 . 0 3 9 2
[ 3 . 7 6 ] *
T h i s t a b l e r e p o r t s t h e c o e f fi c i e n t s
o n t h e e s t i m a t e s f r o m t h e 2 S L S s i m u l t a n e o u s r e g r e s s i o n f o r C S R s a m p l e . W
e i n c l u d e t h e i n t e r a c t i o n d u m m y v a
r i a b l e s , C S R
( N o - C S R ) * H i g h ( L o w ) A n a l y s t s i n P a n e l A a n d H i g h ( L o w ) C S R * H
i g h ( L o w ) A n a l y s t s i n P a n e l B . W e r e p o r t o n l y t h e i n t e r a c t i o n v a r i a b l e s f o r
b r e v i t y . T h e
d e p e n d e n t v a r i a b l e s a r e l o g ( n u m b e r o f a n a l y s t s + 1 ) ( L O G A N A L ) a n d
i n d u s t r y - a d j u s t e d T o b i n ’ s q ( A D J T O
B I N Q ) . F a m a – F r e n c h 4 8 i n d u s t r y i s i n c l u d e d a l l
M o d e l s . T - s t a t i s t i c s i s r e p o r t e d i n
p a r e n t h e s e s . C h o w T e s t c h i - s q u a r e i s r e p o r t e d i n b r a c k e t . * * * , * * , * S t a t i s t i c a l l y s i g n i fi c a n t a t t h e 1 % , 5 % , a n
d 1 0 % l e v e l s ,
r e s p e c t i v e l y .
373Corporate Governance and Firm Value
8/12/2019 Csr and Corporate Governace
http://slidepdf.com/reader/full/csr-and-corporate-governace 24/34
is the most significant with a chi-square of 96.03,
while the differences between groups in all possible
comparisons are significant. Overall, this evidence
suggests further that the individual impact of CSR
engagement on industry-adjusted Tobin’s q is sig-nificant (supporting the conflict-resolution hypoth-
esis 2(a)) and so is the individual impact of analyst
following on industry-adjusted Tobin’s q. The value
addition of CSR engagement is greatest when CSR
engagement is high with high analyst following,
supporting the important monitoring role of secu-
rities analysts in CSR activities, stated in hypothesis
2(b).11
In addition, the above results suggest that the
value addition of CSR engagement and the moni-
toring impact of analyst following on firm value
remain robust in the full sample, as well as in thesub-sample containing only the positive CSR scores.
We also conduct the Heckman two-stage regres-
sions, the instrumental variable approach, and the
OLS regressions based only on the Riskmetrics
available year observations of 1993, 1995, 1998,
2000, 2002, and 2004 to check the robustness of our
results. Our unreported results suggest that overall
results are essentially identical and that the main re-
sults of the positive associations between CSR
(CSRCOMPOSITE) and ADJTOBINQ and be-
tween analyst following and ADJTOBINQ remain
unchanged. In addition, to check the individualimpact of the various governance variables due to
potential multicollinearity, we run the regressions for
each governance variable with the control variables
separately and find that the main results remain intact.
To further examine the robustness of our results,
we also run regressions on the change of ADJTO-
BINQ as a function of the change in CSRCOM-
POSITE. Our untabulated results suggest that the
change in CSRCOMPOSITE has a positive impact
on the change in ADJTOBINQ, with a t -value
range of 2.57–4.37 (all significant, at least at the five-percent level) in various samples with and without
the governance and control variables, again sup-
porting CSR engagement as a conflict resolution.
Discussion
The goal of this paper was to investigate the empirical
association between corporate governance (CG) and
firm value through corporate social responsibility
(CSR). As a main core of the paper, we test two
competing hypotheses, the over-investment hypoth-
esis based on agency theory and the conflict-resolu-
tion hypothesis based on stakeholder theory. The
over-investment explanation posits that top manage-ment uses the CSR engagement to enhance her pri-
vate benefits of social-citizen reputation that could
hurt the market value of firm, whereas the conflict-
resolution explanation postulates that using CSR
activities to reduce potential conflicts between top
management and various stakeholders could eventu-
ally improve firmvalue by mitigating agency conflicts.
To examine the relative importance between the
two competing hypotheses, we employ two-stage
regression analyses consisting of the first-step CSR–
CG choice issue and the second-step CG–CSR-firmvalue association. Before we summarize our empir-
ical results from two-stage regressions, as a pre-
liminary step, we first report the results from various
univariate tests, which suggest that on average, the
characteristics of firms that engage in CSR are dif-
ferent from those of firms that do not engage in
CSR activities. Specifically, CSR firms are more
diversified, older, larger, more levered, more prof-
itable, higher in advertising expense ratio, and higher
in Tobin’s q. CSR firms are also associated with
more active board leadership measured by a higher
proportion of CEOs who are also chairs of theboards or chairs or members of nomination com-
mittees, and more anti-takeover provisions, respec-
tively. In addition, CSR engagement is adopted by
firms with higher total block ownership, higher
board independence, and a higher percentage of
institutional share ownership. They are also covered
by more security analysts.
Next, we discuss our major findings from two-
stage regressions, and their implications in detail
below. First, the first-stage probit regression results
indicate that CSR engagement is influenced by firmcharacteristics such as its size, profitability, financial
leverage, research and development, and product
diversification. CSR engagement is also driven by
both internal and external corporate governance and
monitoring systems, such as board leadership, board
independence, institutional ownership, analyst fol-
lowing, and anti-takeover provisions. Among all
governance system, we find analyst following and
the percentage of independent board have the most
significant and positive effect on firm decision to
374 Hoje Jo and Maretno A. Harjoto
8/12/2019 Csr and Corporate Governace
http://slidepdf.com/reader/full/csr-and-corporate-governace 25/34
engage in CSR. We also find that CSR intensity
(after the firm decided to engage in CSR) is also
influenced by internal and external corporate
governance and monitoring systems and firm char-
acteristics. Analysts following and percentage of independent board have the most significant and
positive effect on firm’s CSR intensity. This positive
empirical relationship between CSR and internal
and external corporate governance system is consis-
tent with the conflict-resolution hypothesis.
Second, to correct for both simultaneity bias and
endogeneity issue, we use the second-stage Heckman
regressions and instrumental variables approach using
simultaneous regression framework after considering
the first-stage CSR choice issue, and find that that
CSR engagement is positively associated with firmvalue measured by industry-adjusted Tobin’s q. The
second-stage results are also supportive of the con-
flict-resolution hypothesis as opposed to the CSR
over-investment argument. The impact of CSR
intensity on firm value is both statistically and eco-
nomically significant indicating that CSR intensity
plays an important role to increase the firm’s value.
We consider this finding important because previous
studies were unclear about the CG–CSR-value
relationships after controlling for both simultaneity
and endogeneity. We also find evidence that cor-
porate governance system influences the firm value,which is consistent with prior literature (Coles et al.,
2008; GIM, 2003, 2010; Jo and Kim, 2007, 2008).
Third, firms’ CSR subcategory that is directly
related to their firms’ internal social enhancement,
such as diversity, employee relations, and product
quality, enhances the value of firm more than their
CSR subcategory in broader external enhancement,
such as community and environmental concerns.
Fourth, we find that while the impact of analyst
coverage on firm value is significant and strongly
positive, other governance and monitoring mecha-nisms including board leadership, board indepen-
dence, blockholders’ ownership, and institutional
ownership play a relatively weaker role in enhancing
firm value. In general, corporate governance is a
system of checks and balances that trade-off benefits
and costs of firm decisions such as CSR engagement,
and is a system of controls, regulations, and incen-
tives to minimize conflicts of interest and to prevent
fraud. Unfortunately, however, this trade-off is
usually very complicated, and no one governance or
monitoring channel works for all firms. Although
security analysts are neither formal evaluator nor
direct monitor of potentially overconfident CEOs
who are over-investing CSR activities for their own
reputation building purpose, it turns out thatfinancial analysts do provide an effective external
monitoring services by frequently contacting top
management for the purpose of collecting and pro-
ducing information regarding firm’s future prospects
as an important mechanism of information inter-
mediary. To produce independent valuations of the
firm, analysts collect and analyze as much informa-
tion as they can so that they can make buy and sell
recommendation to their clients. Through this
information collecting, analyzing, and dissemination
process, they become an expert on the firm and itscompetitors by pouring over a firm’s financial
statements, filings, and earnings forecasts. Thus, we
interpret our empirical results as evidence that ana-
lyst coverage provides an important check-and-
balance function to ensure that firm’s engagement in
CSR activities enhances value.
Conclusion
The impact of corporate social responsibility and cor-
porate governance on firm value has become a great
interest for shareholders, practitioners, and govern-ment regulators. There are, however, only a few lim-
ited empirical studies that examine this issue. This
paper attempts to fill the void by examining what the
determinants of CSR engagement are, and whether
CSR engagement along with corporate governance
and monitoring mechanisms enhance firm value.
We contribute to the existing literature on cor-
porate social responsibility and corporate governance
in three ways. First, we extend the existing literature
by examining the determinants of CSR engagement
from a full spectrum of corporate governance sys-tem. Consistent with the prior literature and eco-
nomic intuition, we find that several governance
characteristics positively affect the choice of CSR
engagement. Second, by controlling for the endog-
enous treatment effects and simultaneity bias, we
find that CSR engagement enhances firm value.
Third, we show evidence that the impact of external
monitoring by security analysts over firms’ CSR
activities on firm value is more significant than other
internal and external governance and monitoring
375Corporate Governance and Firm Value
8/12/2019 Csr and Corporate Governace
http://slidepdf.com/reader/full/csr-and-corporate-governace 26/34
mechanisms. Furthermore, managers can direct their
attention to CSR activities within internal firm (i.e.
diversity, employee relations, and product quality)
which are proven to increase firm value.
Since our data of KLD are based on snapshot over anumber of companies’ social ratings by KLD analysts
in binary responses (yes or no), the data are subject to a
sample selection bias and it is qualitative in nature.
Future study of the CSR–CG-firm value relations
using large-scale survey data incorporating various
stakeholders’ input should be worthwhile. Despite
this limitation, our findings contribute to managerial
practice by providing some empirical evidence of the
CSR–CG association along with CSR–CG-value
relationship after controlling for both endogeneity
and simultaneity. While we find that CSR is oneimportant factor in the cross-sectional differences in
CG-firm value relationship, we do not attempt to
determine the optimal level of CSR engagement nor
the causality among CSR, CG, and firm value, which
is beyond the scope of this paper. We leave these
important questions to future research.
Notes
1 One notable exception is Harjoto and Jo (2011)
who control for the endogeneity problem. They, how-ever, do not formally correct for potential simultaneity
bias that invalidates the single-equation procedures
when there exists a simultaneous nature of economic
relations. In this paper, in contrast to Harjoto and Jo
(2011), we not only control for the simultaneity bias
using simultaneous equation system, but also address the
impact of CSR subcategories on firm value along with
deeper analysis regarding the impact of various internal
and external governance mechanisms on the choice of
CSR engagement and the market value of firm.2 Social capital is described as a resource of individu-
als that emerges from social ties (Coleman, 1990). Guiso
et al. (2004) assert that the source of social capital lies
with the people to whom a person is related.3 Some researchers interpret CSR engagement as a
signaling device. For instance, Fisman, et al. (2006) and
Goyal (2006) interpret CSR investment as a signal in
competitive industries and in foreign direct investments,
respectively. Other studies focus on corporate contribu-
tions. Schwart (1968) asserts profit maximization along
with the CEO’s psychological motivation as the
underlying rationale behind corporate philanthropic
contributions. He claims that both CSR and corporate
contributions can be viewed as an indirect investment
in society, yielding reputation building, potential reve-
nue increases and cost reductions, and therefore a firm
value increase. Navarro (1988) maintains that profit-
maximization factors and managerial discretionary fac-tors can explain corporate contributions. Brown et al.
(2006) examine the relation between corporate philan-
thropic contributions and agency costs.4 Notice that the improvement of accounting profit-
ability does not necessarily lead to higher firm value.5 Some IVs will yield more precise estimates. The
more highly correlated the IV is with the choice of
CSR engagement, the more precise the estimates of per-
formance impact will be. Thus, the challenge in an IV
estimation is to find an appropriate instrumental variable
that is highly correlated with the first-pass choice, but
uncorrelated with the second-pass performance. Unfor-
tunately, it is often hard to find variables that meet both
of these requirements, and therefore, it is difficult to find
good IVs among the many potential IVs.6 Similar methodology is also used by Harjoto and Jo
(2011) and Jo and Harjoto (2011).7 When we perform logistic regression models to exam-
ine the likelihood of a choice decision, the results are quali-
tatively the same as those of the probit models shown in
Table III. We also control risk with the standard deviation
of stock returns, and the unreported results remain intact.8 We further analyze the impact of LOGANAL on CSR
separately using two-stage least-square (2SLS) in Table V.9
Recent study by Jo and Harjoto (2011) focuses on thecausality issue between CSR and corporate governance.10 We also examine the association between the KLD
exclusionary scores and ADJTOBINQ. Our unreported
results suggest that the KLD exclusionary scores from
alcohol, tobacco, military, and nuclear-related revenues
are inversely associated with firm value when we do
not include the governance and control variables. How-
ever, when we include the governance and control
variables, only alcohol scores remain significantly nega-
tive. The coefficients on gambling scores are insignifi-
cant in all models examined.11 The results are qualitatively the same when we use
Tobin’s q instead of industry-adjusted Tobin’s q. The
results are also essentially identical when we exclude
financial and utility firms from the sample.
Acknowledgments
We thank an anonymous referee, Sanjiv Das, Carrie
Pan, and Mark Seasholes for valuable comments. Donna
Maurer provided editorial assistance. Jo acknowledges
the Leavey Research Grant for financial support.
376 Hoje Jo and Maretno A. Harjoto
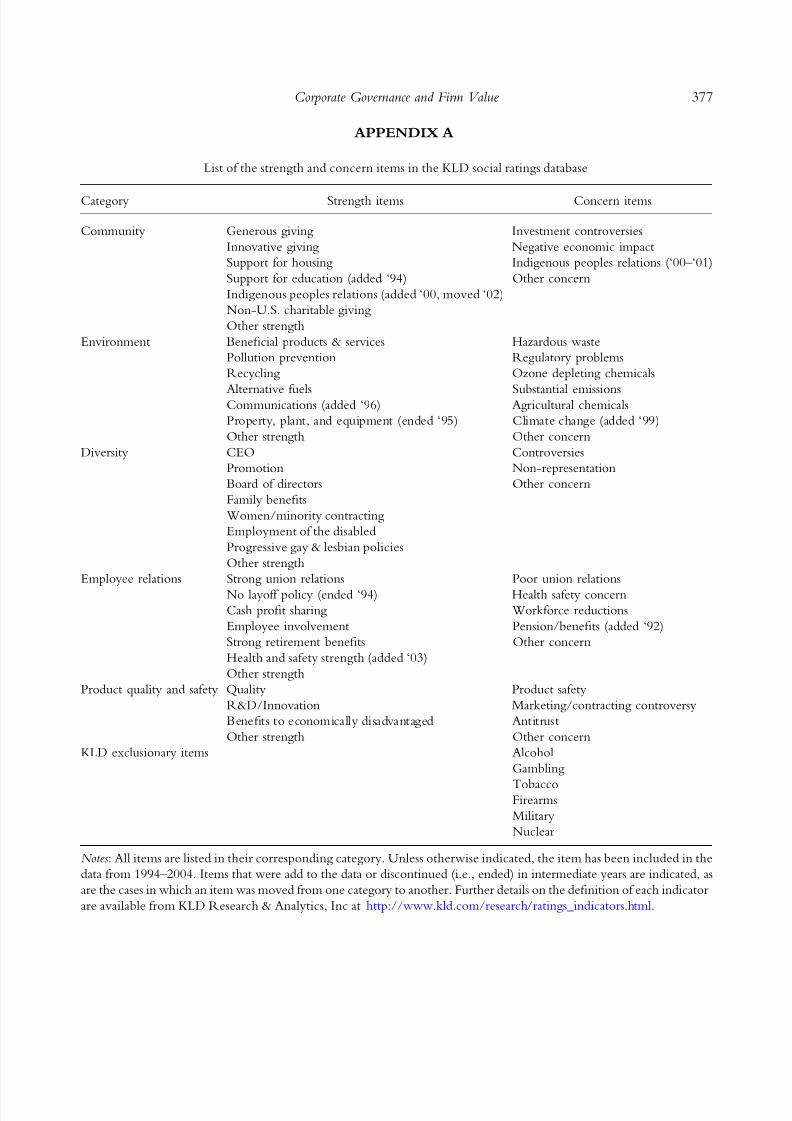
8/12/2019 Csr and Corporate Governace
http://slidepdf.com/reader/full/csr-and-corporate-governace 27/34
List of the strength and concern items in the KLD social ratings database
Category Strength items Concern items
Community Generous giving Investment controversies
Innovative giving Negative economic impact
Support for housing Indigenous peoples relations (‘00–‘01)
Support for education (added ‘94) Other concern
Indigenous peoples relations (added ‘00, moved ‘02)
Non-U.S. charitable giving
Other strength
Environment Beneficial products & services Hazardous waste
Pollution prevention Regulatory problems
Recycling Ozone depleting chemicals
Alternative fuels Substantial emissionsCommunications (added ‘96) Agricultural chemicals
Property, plant, and equipment (ended ‘95) Climate change (added ‘99)
Other strength Other concern
Diversity CEO Controversies
Promotion Non-representation
Board of directors Other concern
Family benefits
Women/minority contracting
Employment of the disabled
Progressive gay & lesbian policies
Other strength
Employee relations Strong union relations Poor union relations
No layoff policy (ended ‘94) Health safety concern
Cash profit sharing Workforce reductions
Employee involvement Pension/benefits (added ‘92)
Strong retirement benefits Other concern
Health and safety strength (added ‘03)
Other strength
Product quality and safety Quality Product safety
R&D/Innovation Marketing/contracting controversy
Benefits to economically disadvantaged Antitrust
Other strength Other concern
KLD exclusionary items Alcohol
Gambling
TobaccoFirearms
Military
Nuclear
Notes: All items are listed in their corresponding category. Unless otherwise indicated, the item has been included in the
data from 1994–2004. Items that were add to the data or discontinued (i.e., ended) in intermediate years are indicated, as
are the cases in which an item was moved from one category to another. Further details on the definition of each indicator
are available from KLD Research & Analytics, Inc at http://www.kld.com/research/ratings_indicators.html.
APPENDIX A
377Corporate Governance and Firm Value
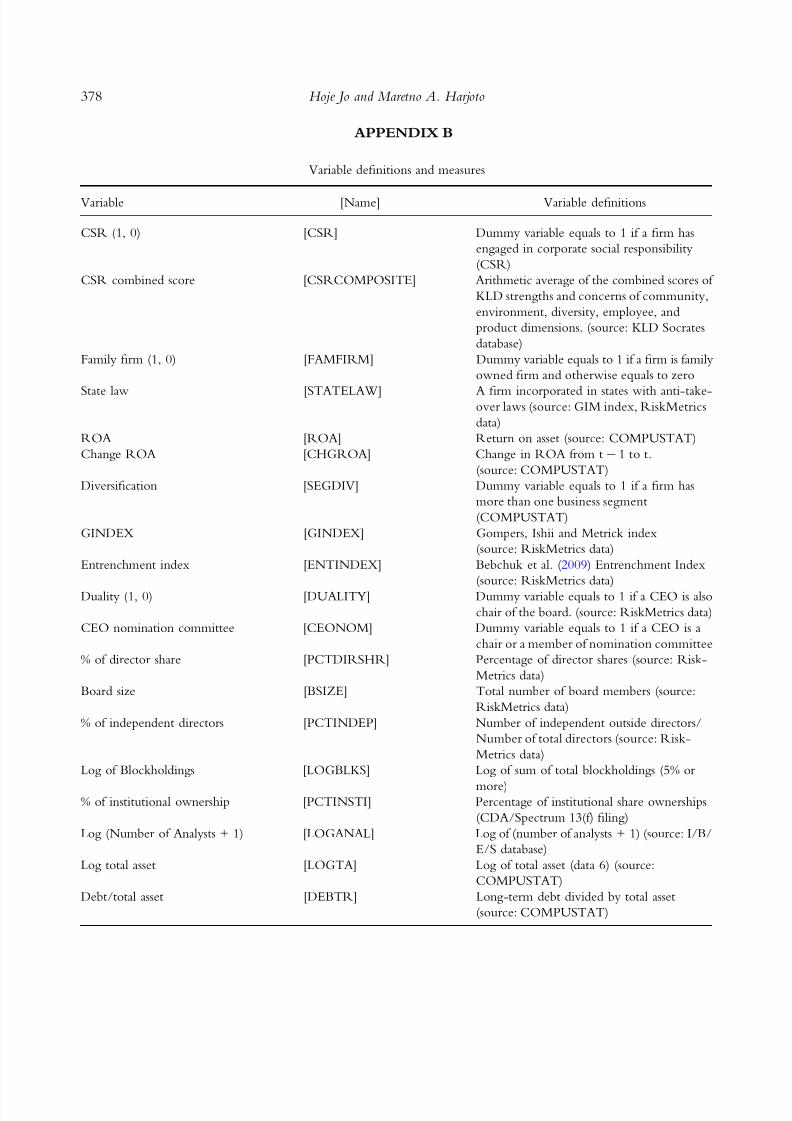
8/12/2019 Csr and Corporate Governace
http://slidepdf.com/reader/full/csr-and-corporate-governace 28/34
Variable definitions and measures
Variable [Name] Variable definitions
CSR (1, 0) [CSR] Dummy variable equals to 1 if a firm has
engaged in corporate social responsibility
(CSR)
CSR combined score [CSRCOMPOSITE] Arithmetic average of the combined scores of
KLD strengths and concerns of community,
environment, diversity, employee, and
product dimensions. (source: KLD Socrates
database)
Family firm (1, 0) [FAMFIRM] Dummy variable equals to 1 if a firm is family
owned firm and otherwise equals to zero
State law [STATELAW] A firm incorporated in states with anti-take-over laws (source: GIM index, RiskMetrics
data)
ROA [ROA] Return on asset (source: COMPUSTAT)
Change ROA [CHGROA] Change in ROA from t- 1 to t.
(source: COMPUSTAT)
Diversification [SEGDIV] Dummy variable equals to 1 if a firm has
more than one business segment
(COMPUSTAT)
GINDEX [GINDEX] Gompers, Ishii and Metrick index
(source: RiskMetrics data)
Entrenchment index [ENTINDEX] Bebchuk et al. (2009) Entrenchment Index
(source: RiskMetrics data)
Duality (1, 0) [DUALITY] Dummy variable equals to 1 if a CEO is also
chair of the board. (source: RiskMetrics data)
CEO nomination committee [CEONOM] Dummy variable equals to 1 if a CEO is a
chair or a member of nomination committee
% of director share [PCTDIRSHR] Percentage of director shares (source: Risk-
Metrics data)
Board size [BSIZE] Total number of board members (source:
RiskMetrics data)
% of independent directors [PCTINDEP] Number of independent outside directors/
Number of total directors (source: Risk-
Metrics data)
Log of Blockholdings [LOGBLKS] Log of sum of total blockholdings (5% or
more)% of institutional ownership [PCTINSTI] Percentage of institutional share ownerships
(CDA/Spectrum 13(f) filing)
Log (Number of Analysts + 1) [LOGANAL] Log of (number of analysts + 1) (source: I/B/
E/S database)
Log total asset [LOGTA] Log of total asset (data 6) (source:
COMPUSTAT)
Debt/total asset [DEBTR] Long-term debt divided by total asset
(source: COMPUSTAT)
APPENDIX B
378 Hoje Jo and Maretno A. Harjoto
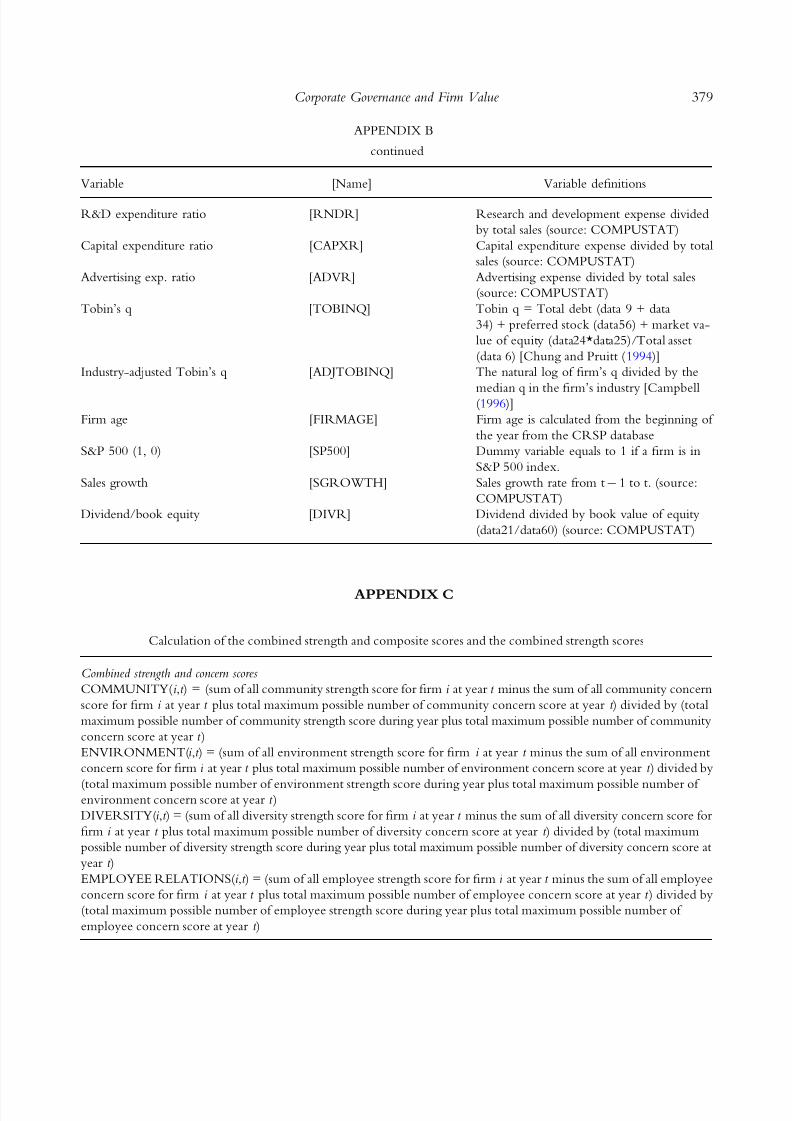
8/12/2019 Csr and Corporate Governace
http://slidepdf.com/reader/full/csr-and-corporate-governace 29/34
APPENDIX B
continued
Variable [Name] Variable definitions
R&D expenditure ratio [RNDR] Research and development expense divided
by total sales (source: COMPUSTAT)
Capital expenditure ratio [CAPXR] Capital expenditure expense divided by total
sales (source: COMPUSTAT)
Advertising exp. ratio [ADVR] Advertising expense divided by total sales
(source: COMPUSTAT)
Tobin’s q [TOBINQ] Tobin q = Total debt (data 9 + data
34) + preferred stock (data56) + market va-
lue of equity (data24*data25)/Total asset
(data 6) [Chung and Pruitt (1994)]
Industry-adjusted Tobin’s q [ADJTOBINQ] The natural log of firm’s q divided by the
median q in the firm’s industry [Campbell(1996)]
Firm age [FIRMAGE] Firm age is calculated from the beginning of
the year from the CRSP database
S&P 500 (1, 0) [SP500] Dummy variable equals to 1 if a firm is in
S&P 500 index.
Sales growth [SGROWTH] Sales growth rate from t- 1 to t. (source:
COMPUSTAT)
Dividend/book equity [DIVR] Dividend divided by book value of equity
(data21/data60) (source: COMPUSTAT)
Calculation of the combined strength and composite scores and the combined strength scores
Combined strength and concern scores
COMMUNITY(i ,t ) = (sum of all community strength score for firm i at year t minus the sum of all community concern
score for firm i at year t plus total maximum possible number of community concern score at year t ) divided by (total
maximum possible number of community strength score during year plus total maximum possible number of community
concern score at year t )
ENVIRONMENT(i ,t ) = (sum of all environment strength score for firm i at year t minus the sum of all environment
concern score for firm i at year t plus total maximum possible number of environment concern score at year t ) divided by
(total maximum possible number of environment strength score during year plus total maximum possible number of environment concern score at year t )
DIVERSITY(i ,t ) = (sum of all diversity strength score for firm i at year t minus the sum of all diversity concern score for
firm i at year t plus total maximum possible number of diversity concern score at year t ) divided by (total maximum
possible number of diversity strength score during year plus total maximum possible number of diversity concern score at
year t )
EMPLOYEE RELATIONS(i ,t ) = (sum of all employee strength score for firm i at year t minus the sum of all employee
concern score for firm i at year t plus total maximum possible number of employee concern score at year t ) divided by
(total maximum possible number of employee strength score during year plus total maximum possible number of
employee concern score at year t )
APPENDIX C
379Corporate Governance and Firm Value
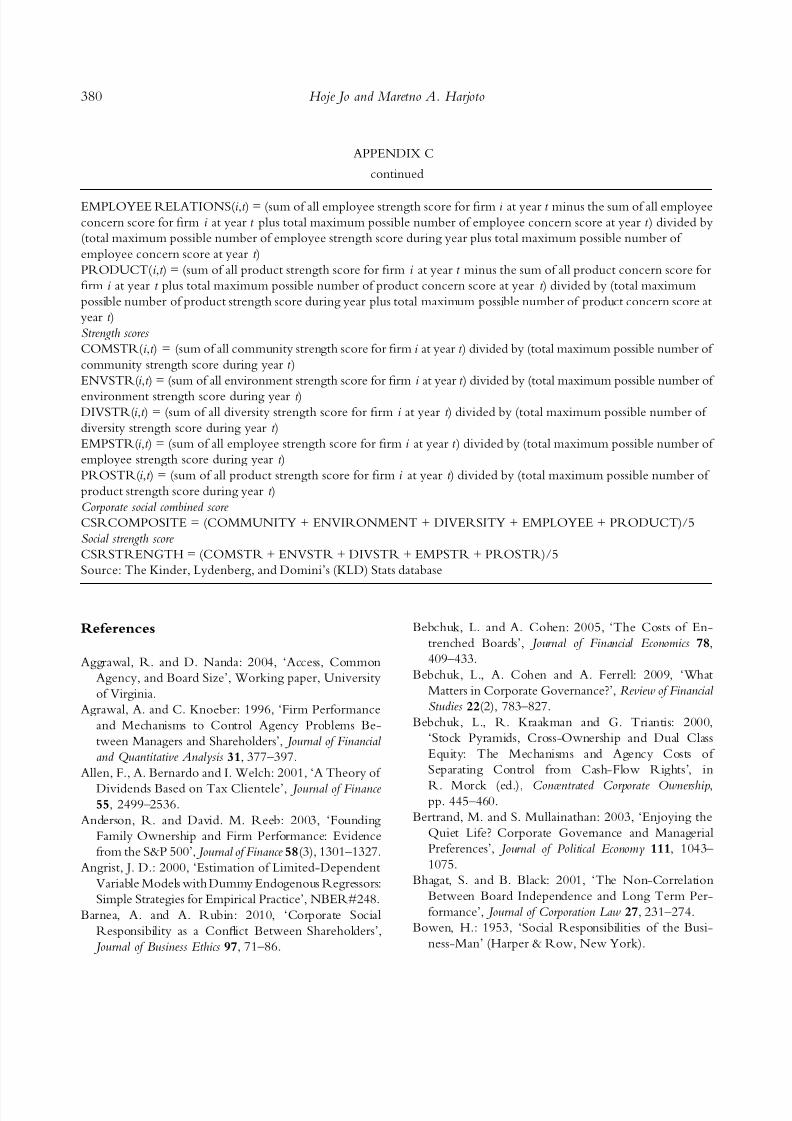
8/12/2019 Csr and Corporate Governace
http://slidepdf.com/reader/full/csr-and-corporate-governace 30/34
References
Aggrawal, R. and D. Nanda: 2004, ‘Access, Common
Agency, and Board Size’, Working paper, University
of Virginia.
Agrawal, A. and C. Knoeber: 1996, ‘Firm Performance
and Mechanisms to Control Agency Problems Be-
tween Managers and Shareholders’, Journal of Financial
and Quantitative Analysis 31, 377–397.
Allen, F., A. Bernardo and I. Welch: 2001, ‘A Theory of
Dividends Based on Tax Clientele’, Journal of Finance 55, 2499–2536.
Anderson, R. and David. M. Reeb: 2003, ‘Founding
Family Ownership and Firm Performance: Evidence
from the S&P 500’, Journal of Finance 58(3), 1301–1327.
Angrist, J. D.: 2000, ‘Estimation of Limited-Dependent
Variable Models with Dummy Endogenous Regressors:
Simple Strategies for Empirical Practice’, NBER#248.
Barnea, A. and A. Rubin: 2010, ‘Corporate Social
Responsibility as a Conflict Between Shareholders’,
Journal of Business Ethics 97, 71–86.
Bebchuk, L. and A. Cohen: 2005, ‘The Costs of En-
trenched Boards’, Journal of Financial Economics 78,
409–433.
Bebchuk, L., A. Cohen and A. Ferrell: 2009, ‘What
Matters in Corporate Governance?’, Review of Financial
Studies 22(2), 783–827.
Bebchuk, L., R. Kraakman and G. Triantis: 2000,
‘Stock Pyramids, Cross-Ownership and Dual Class
Equity: The Mechanisms and Agency Costs of
Separating Control from Cash-Flow Rights’, in
R. Morck (ed.), Concentrated Corporate Ownership,pp. 445–460.
Bertrand, M. and S. Mullainathan: 2003, ‘Enjoying the
Quiet Life? Corporate Governance and Managerial
Preferences’, Journal of Political Economy 111, 1043–
1075.
Bhagat, S. and B. Black: 2001, ‘The Non-Correlation
Between Board Independence and Long Term Per-
formance’, Journal of Corporation Law 27, 231–274.
Bowen, H.: 1953, ‘Social Responsibilities of the Busi-
ness-Man’ (Harper & Row, New York).
APPENDIX C
continued
EMPLOYEE RELATIONS(i ,t ) = (sum of all employee strength score for firm i at year t minus the sum of all employee
concern score for firm i at year t plus total maximum possible number of employee concern score at year t ) divided by
(total maximum possible number of employee strength score during year plus total maximum possible number of
employee concern score at year t )
PRODUCT(i ,t ) = (sum of all product strength score for firm i at year t minus the sum of all product concern score for
firm i at year t plus total maximum possible number of product concern score at year t ) divided by (total maximum
possible number of product strength score during year plus total maximum possible number of product concern score at
year t )
Strength scores
COMSTR(i ,t ) = (sum of all community strength score for firm i at year t ) divided by (total maximum possible number of
community strength score during year t )
ENVSTR(i ,t ) = (sum of all environment strength score for firm i at year t ) divided by (total maximum possible number of
environment strength score during year t )DIVSTR(i ,t ) = (sum of all diversity strength score for firm i at year t ) divided by (total maximum possible number of
diversity strength score during year t )
EMPSTR(i ,t ) = (sum of all employee strength score for firm i at year t ) divided by (total maximum possible number of
employee strength score during year t )
PROSTR(i ,t ) = (sum of all product strength score for firm i at year t ) divided by (total maximum possible number of
product strength score during year t )
Corporate social combined score
CSRCOMPOSITE = (COMMUNITY + ENVIRONMENT + DIVERSITY + EMPLOYEE + PRODUCT)/5
Social strength score
CSRSTRENGTH = (COMSTR + ENVSTR + DIVSTR + EMPSTR + PROSTR)/5
Source: The Kinder, Lydenberg, and Domini’s (KLD) Stats database
380 Hoje Jo and Maretno A. Harjoto
8/12/2019 Csr and Corporate Governace
http://slidepdf.com/reader/full/csr-and-corporate-governace 31/34
Brown, W., E. Helland and J. Smith: 2006, ‘Corporate
Philanthropic Practices’, Journal of Corporate Finance 12,
855–877.
Bushman, R., J. Piotroski and A. Smith: 2005, ‘Insider
Trading Restrictions and Analysts’ Incentives to Fol-low Firms’, Journal of Finance 60, 35–66.
Calton, J. and S. Payne: 2003, ‘Coping with Paradox’,
Business and Society 42, 7–42.
Campbell, H.: 1996, ‘Understanding Risk and Return’,
Journal of Political Economy 104, 298–345.
Carroll, A. B.: 1979, ‘A Three Dimensional Conceptual
Model of Corporate Social Performance’, Academy of
Management Review 4, 497–505.
Chung, K. and H. Jo: 1996, ‘The Impact of Security
Analysts’ Monitoring and Marketing Functions on the
Market Value of Firms’, Journal of Financial and Quan-
titative Analysis 31, 493–512.
Chung, K. and S. A. Pruitt: 1994, ‘A Simple Approxima-
tion of Tobin’s Q.’, Financial Management 23, 70–74.
Coleman, J.: 1990, Foundations of Social Theory (Harvard
University Press, Cambridge, MA).
Coles,J., N. DanielandL. Naveen:2008,‘Boards: Does One
Size Fit All’, Journal of Financial Economics 87, 329–356.
Cremers, M. and V. B. Nair: 2005, ‘Governance Mecha-
nisms andEquity Prices’, Journal of Finance 60, 2859–2894.
Dechow, P., A. Hutton and R. Sloan: 2000, ‘The
Relation Between Analysts’ Forecasts of Long-Term
Earnings Growth and Stock Price Performance Fol-
lowing Equity Offerings’, Contemporary Accounting
Research 17, 1–32.Demsetz, H. and K. Lehn: 1985, ‘The Structure of
Corporate Ownership: Causes and Consequences’,
Journal of Political Economy 93, 1155–1177.
Donham, W.: 1927, ‘The Social Significance of Business’,
Harvard Business Review 4, 406–419.
Fama, E. F. and M. C. Jensen: 1983, ‘Separation of
Ownership and Control’, Journal of Law and Economics
26, 301–325.
Fisman, R., G. Heal and V. Nair: 2005, ‘Corporate Social
Responsibility: Doing Well by Doing Good?’ Working
paper, Wharton School, University of Pennsylvania.
Fisman, R., G. Heal and V. Nair: 2006, ‘A Model of
Corporate Philanthropy’, Working paper, Wharton
School, University of Pennsylvania.
Friedman, M.: 1970, ‘Money and Income: Comment on
Tobin’, Quarterly Journal of Economics 84, 318–327.
Goel, A. and A. Thakor: 2008, ‘Overconfidence, CEO
Selection, and Corporate Governance’, Journal of
Finance 63(6), 2737–2784.
Gompers, P., J. Ishii and A. Metrick: 2003, ‘Corporate
Governance and Equity Prices’, Quarterly Journal of
Economics 118, 107–155.
Gompers, P., J. Ishii and A. Metrick: 2010, ‘Extreme
Governance: An Analysis of Dual-Class Firms in Uni-
ted States’, Review of Financial Studies 23(3), 1051–1088.
Goss, A. and G. Roberts: 2007, ‘Corporate Social
Responsibility and the Cost of Debt Financing’,Working paper, York University.
Goyal, A.: 2006, ‘Corporate Social Responsibility as a
Signaling Device for FDI’, International Journal of the
Economics of Business 13, 145–163.
Greene, W.: 1993, Econometric Analysis, 5th Edition
(Prentice-Hall, Upper Saddle River).
Guiso, L., P. Sapienza and L. Zingales: 2004, ‘The Role
of Social Capital in Financial Development’, American
Economic Review 94, 526–556.
Harjoto, M. and H. Jo: 2011, ‘Corporate Governance and
CSR Nexus’, Journal of Business Ethics (forthcoming).
Published Online at http://www.springerlink.com/
content/g57k226m54w2036g/fulltext.pdf .
Harris, M. and A. Raviv: 2008, ‘A Theory of Board
Control and Size’, Review of Financial Studies 21(4),
1797–1832.
Heckman, J.: 1976, ‘The Common Structure of Statistical
Models of Truncation, Sample Selection and Limited
Dependent Variables and a Simple Estimator for such
Models’, Annals of Economic and Social Measurement 5,
475–492.
Heckman, J.: 1979, ‘Sample Selection as a Specification
Error’, Econometrica 47, 153–161.
Heckman, J. and R. Robb, Jr.: 1985, ‘Alternative
Methods for Evaluating the Impact of Interventions’,Ch. 4, in J. Heckman and B. Singer (ed.), Longitudinal
Analysis of Labor Market Data (Cambridge University
Press, New York).
Hermalin, B.: 2005, ‘Trends in Corporate Governance’,
Journal of Finance 60, 2351–2384.
Hermalin, B. and M. Weisbach: 1991, ‘The Effects of
Board Composition and Direct Incentives on Firm
Value’, Financial Management 20, 101–112.
Hermalin, B. and M. Weisbach: 1998, ‘Endogenously
Chosen Boards of Directors and their Monitoring of
the CEO’, American Economic Review 88, 96–118.
Hermalin, B. and M. Weisbach: 2003, ‘Boards of
Directors as an Endogenously Determined Institution:
A Survey of the Economic Literature’, FRBNY Eco-
nomic Policy Review , 7–26.
Hill, R. P., T. Ainscough, T. Shank and D. Manullang:
2007, ‘Corporate Social Responsibility and Socially
Responsible Investing: A Global Perspective’, Journal of
Business Ethics 70, 165–174.
Hong, H. and M. Kacperczyk: 2009, ‘The Price of Sin:
The Effects of Social Norms on Markets’, Journal of
Financial Economics 93, 15–36.
381Corporate Governance and Firm Value
8/12/2019 Csr and Corporate Governace
http://slidepdf.com/reader/full/csr-and-corporate-governace 32/34
Jensen, M.: 1986, ‘Agency Costs of Free Cash Flow,
Corporate Finance, and Takeovers’, American Economic
Review 76, 323–329.
Jensen, M.: 1993, ‘The Modern Industrial Revolution,
Exit, and the Failure of Internal Control Systems’, Journal of Finance 48, 831–880.
Jensen, M.: 2002, ‘Value Maximization, Stakeholder
Theory, and the Corporate Objective Function’,
Business Ethics Quarterly 12, 235–256.
Jensen, M. C. and W. Meckling: 1976, ‘Theory of Firm:
Managerial Behavior, Agency Costs, and Capital
Structure’, Journal of Financial Economics 3, 305–360.
Jo, H. and M. Harjoto: 2011, ‘The Causal Effect of
Corporate Governance on Corporate Social Respon-
sibility’, Working paper, Santa Clara University.
Jo, H. and Y. Kim: 2007, ‘Disclosure Frequency and
Earnings Management’, Journal of Financial Economics
84, 561–590.
Jo, H. and Y. Kim: 2008, ‘Ethics and Disclosure: A Study of the
Financial Performance of Firms in the Seasoned Equity
Offerings Market’, Journal of Business Ethics 80, 855–878.
Knack, S. and P. Keefer: 1997, ‘Does Social Capital have
an Economic Payoff? A Cross-Country Investigation’,
Quarterly Journal of Economics 112, 295–321.
Knyazeva, D.: 2007, ‘Corporate Governance, Analyst
Following, and Firm Behavior’, Working paper, New
York University.
La Porta, R., F. Lopez-de-Silanes, A. Shleifer and
R. Vishny: 1997a, ‘Legal Determinants of External
Finance’, Journal of Finance 52, 1131–1150.La Porta, R., F. Lopez-de-Silanes, A. Shleifer, and
R. Vishny: 1997b, ‘Trustin large organizations’, American
Economic Review 87 (papers and proceedings), 333-338.
La Porta, R., F. Lopez-de-Silanes and A. Shleifer: 1999,
‘Corporate Ownership Around the World’, Journal of
Finance 54, 471–517.
Lim, T.: 2001, ‘Rationality and Analysts’ Forecast Bias’,
Journal of Finance 56, 369–385.
Lin, H. and M. McNichols: 1998, ‘Underwriting Rela-
tionships and Analysts’ Forecasts and Investment Rec-
ommendations’, Journal of Accounting and Economics 25,
101–127.
Linck, J., J. Netter and T. Yang: 2008, ‘The Determi-
nants of Board Structure’, Journal of Financial Economics
87(2), 308–328.
Maddala, G.: 1983, Limited Dependent and Quantitative
Variables in Econometrics (Cambridge University Press,
Cambridge, England).
Malmendier, U. and G. Tate: 2005, ‘CEO Overconfi-
dence and Corporate Investment’, Journal of Finance 60,
2661–2700.
Margolis, J. D. and J. P. Walsh: 2003, ‘Misery Loves
Companies: Rethinking Social Initiatives by Business’,
Administrative Science Quarterly 48, 268–305.
Mehran, H.: 1995, ‘Executive Compensation Structure,
Ownership, and Firm Performance’, Journal of Financial Economics 38, 163–184.
Miller, M.: 2005, ‘Is American corporate governance
fatally flawed?’, in D. Chew and S. Gillan (eds.),
Corporate Governance at the Crossroads: A Book of Read-
ings (Irwin Mcgraw-Hill, Boston, MA).
Moffitt, R.: 1999, ‘New Developments In Econometric
Methods for Labor Market Analysis’, Ch. 24, in O.
Ashenfelter and D. Card (eds.), The Handbook of Labor
Economics, Vol. IIIA (North-Holland, Amsterdam).
Morck, R. and F. Yang: 2001, ‘The Mysterious Growing
Value of the S&P 500 Membership’, Working paper,
University of Alberta.
Morck, R., A. Shleifer and R. Vishny: 1988, ‘Manage-
ment Ownership and Market Valuation: An Empirical
Analysis’, Journal of Financial Economics 20, 293–316.
Navarro, P.: 1988, ‘Why Do Corporations Give to
Charity?’, Journal of Business 61, 65–93.
Putnam, R.: 1993, Making Democracy Work: Civic Tradi-
tions in Modern Italy (Princeton University Press,
Princeton, NJ).
Raheja, C.: 2005, ‘Determinants of Board Size and
Composition: A Theory of Corporate Boards’, Journal
of Financial and Quantitative Analysis 40, 283–306.
Schwart, R.: 1968, ‘Corporate Philanthropic Contribu-
tions’, Journal of Finance 23, 479–497.Sherere, A., G. Palazzo and D. Baumann: 2006, ‘Global
Rules and Private Actors, Toward a New Role of the
TNC in Global Governance’, Business Ethics Quarterly
16, 502–532.
Shin, H. and R. Stulz: 2000, ‘FirmValue, Risk, and Growth
Opportunities’, NBER working paper #7808.
Shleifer, A. and R. Vishny: 1986, ‘Large Shareholders and
Corporate Control’, Journal of Political Economy 94,
461–488.
Tobin, J.: 1958, ‘Estimation of Relationships for Limited
Dependent Variables’, Econometrica 26, 24–36.
Villalonga, B. and R. Amit: 2006, ‘How Do Family
Ownership, Control, and Management Affect Firm
Value?’, Journal of Financial Economics 80, 385–417.
Whetten, D., G. Rands and P. Godfrey: 2002, ‘What are
The Responsibilities of Business to Society?’, in A.
Pettigrew, A. Thomas and R. Whittingen (eds.),
Handbook of Strategy and Management (Sage, London),
pp. 373–408.
Yu, F.: 2008, ‘Analyst Coverage and Earnings Manage-
ment’, Journal of Financial Economics 88, 245–271.
382 Hoje Jo and Maretno A. Harjoto

8/12/2019 Csr and Corporate Governace
http://slidepdf.com/reader/full/csr-and-corporate-governace 33/34
Hoje Jo
Leavey School of Business,
Santa Clara University,
500 El Camino Real, Santa Clara,CA 95053-0388, U.S.A.
E-mail: [email protected]
Maretno A. Harjoto
Graziadio School of Business and Management,Pepperdine University,
24255 Pacific Coast Highway, Malibu,CA 90263, U.S.A.
E-mail: [email protected]
383Corporate Governance and Firm Value

8/12/2019 Csr and Corporate Governace
http://slidepdf.com/reader/full/csr-and-corporate-governace 34/34
Copyright of Journal of Business Ethics is the property of Springer Science & Business Media B.V. and its
content may not be copied or emailed to multiple sites or posted to a listserv without the copyright holder's
express written permission. However, users may print, download, or email articles for individual use.