CSLAP 2015 Lake Water Quality Summary: Mirror … Lake General Lake Information ... and the public...
28
CSLAP 2015 Lake Water Quality Summary: Mirror Lake General Lake Information Location Town of Lake Placid County Essex Basin Lake Champlain Size 49.4 hectares (122.0 acres) Lake Origins Natural Watershed Area 303 hectares (739 acres) Retention Time 1.3 years Mean Depth 4.2 meters Sounding Depth 9 meters Public Access? hand launch Major Tributaries no named tribs Lake Tributary To… unnamed outlet to Chubb River to West Branch Ausable River to Ausable River to Lake Champlain WQ Classification B(T) (contact recreation = swimming) Lake Outlet Latitude 44.284 Lake Outlet Longitude -73.982 Sampling Years 1998-2001, 2003-2011, 2013-2015 2015 Samplers Mark Wilcox Main Contact Mark Wilcox Lake Map pg. 1
Transcript of CSLAP 2015 Lake Water Quality Summary: Mirror … Lake General Lake Information ... and the public...

CSLAP 2015 Lake Water Quality Summary: Mirror Lake
General Lake Information Location Town of Lake Placid County Essex Basin Lake Champlain Size 49.4 hectares (122.0 acres) Lake Origins Natural Watershed Area 303 hectares (739 acres) Retention Time 1.3 years Mean Depth 4.2 meters Sounding Depth 9 meters Public Access? hand launch Major Tributaries no named tribs Lake Tributary To… unnamed outlet to Chubb River to West Branch Ausable River
to Ausable River to Lake Champlain WQ Classification B(T) (contact recreation = swimming) Lake Outlet Latitude 44.284 Lake Outlet Longitude -73.982 Sampling Years 1998-2001, 2003-2011, 2013-2015 2015 Samplers Mark Wilcox Main Contact Mark Wilcox
Lake Map
pg. 1

Background Mirror Lake is a 122 acre, class B(T) lake found in the Town of North Elba in Essex County, in the northern Adirondack region of New York State. It was first sampled as part of CSLAP in 1998. It is one of nine CSLAP lakes among the more than 510 lakes and ponds found in Essex County, and one of 17 CSLAP lakes among the nearly 650 lakes and ponds in the Lake Champlain drainage basin.
Lake Uses Mirror Lake is a Class B(T) lake; this means that the best intended use for the lake is for contact recreation—swimming and bathing, non-contact recreation—fishing and boating, aquatic life, and aesthetics (the (T) designation indicates support of trout). The lake is used by lake residents and the public for boating and other recreation via shoreline properties and a cartop launch. Lake residents also use the lake for swimming and bathing. Mirror Lake has been stocked by annually by the state. In 2006, 1300 nine inch rainbow trout, 600 14 inch rainbow trout, and 100 19 inch rainbow trout were stocked. In addition, about 550 seven inch lake trout were stocked. Fish species in the lake include brown bullhead, lake trout, pumpkinseed sunfish, rainbow trout, rock bass, smallmouth bass, and yellow perch. General statewide fishing regulations are applicable in Mirror Lake. Open season for lake trout is from April 1st through October 15th, with a size limit of 15 inches and a daily take limit of three fish. Sunfish and yellow perch have an open season throughout the year, with no take or size limits. Statewide fish consumption advisories apply to Mirror Lake—no site-specific advisories have been issued for the lake.
Historical Water Quality Data CSLAP sampling was conducted on Mirror Lake from 1998 to 2001, 2003 to 2011, and 2013 to 2015. The CSLAP reports for each of the past several years can be found on the NYSFOLA website at http://nysfola.mylaketown.com. The most recent CSLAP reports for Mirror Lake will also be found on the NYSDEC web page at http://www.dec.ny.gov/lands/77872.html. The lake was sampled as part of the state Lake Biomonitoring pilot project (as part of the state Lake Classification and Inventory study, or LCI) conducted by the NYSDEC in 2008. With the exception of the elevated chlorophyll reading in the LCI sample (which does not appear to be representative of normal conditions in the lake), these data are very comparable. The depth profiles collected in this dataset show an oxygen depression starting at the thermocline (at a depth of about 8 meters) and increasing with depth to the lake bottom, but anoxic (oxygen-depleted) conditions were not apparent. Chloride and sodium levels were higher than in many other lakes sampled as part of this program, and may indicate some influence of road salt runoff, although these readings are well below the state water quality standards.
pg. 2

The report on the sediment sampling conducted as part of this program including the following information: “The (Mirror Lake) sample was collected in seven meters of water with a petite ponar. The sample represents the top 10 cm. The sample was characterized as a dark gray, gelatinous material with low solids and high carbon content. Total organic carbon was 10.2 percent. Low levels of DDD and DDE were found. No PCBs were detected. PAHs were detected in thirteen of the sixteen chemicals within this class. Total PAHs were above the TEC guidelines. Of the metals measured, lead was found at three times the above the PEC guidelines, suggesting potential toxicity. Both lead and zinc were measured at the highest concentration of any sediment sampled in 2008. The Microtox results indicated slight toxicity” None of the Mirror Lake tributaries are named or have been monitored through the NYSDEC Rotating Intensive Basins (RIBS) program. No sites have been sampled through the state stream macroinvertebrate monitoring program. Limited water quality data have been collected by DEC fisheries staff and are included in the state fisheries (water quality) database. These data show conditions very similar to those measured through CSLAP.
Lake Association and Management History Mirror Lake is represented by the Mirror Lake Association. The lake association is involved in a number of lake management activities, including:
• Clean up and water quality monitoring activities- water quality sampling, storm drain stenciling, water quality dip measurements, doggie bag dispensers, trash cans
• Educational activities- monthly newspaper articles, education about pet litter, lake education posters, lake education, brochures, education about storm drains, web site
• Lake advocacy activities- storm water management, storm drain inventory/action plan, trash can inventory/action plan
• Fund raising The Mirror Lake Association maintains a website at http://www.mirrorlake.net/ .
Summary of 2015 CSLAP Sampling Results
Evaluation of 2015 Annual and Monthly Results Relative to 1998-2014 The summer (mid-June through mid-September) average readings are compared to historical averages for all CSLAP sampling seasons in the “Lake Condition Summary” table, and are compared to individual historical CSLAP sampling seasons in the “Long Term Data Plots –Mirror Lake” section in Appendix C.
Evaluation of Eutrophication Indicators It does not appear that overall lake conditions were affected by the major fire in early August. Secchi disk transparency readings were slightly lower than normal in 2014 and 2015, but both of the other trophic indicators (phosphorus and chlorophyll a) were close to normal. The slight drop in water clarity did not appear to be associated with the fire. Phosphorus readings have increased
pg. 3

slightly since the mid-2000s, consistent with a slight drop in water clarity since the early 2000s. However, algae levels also dropped slightly over the same period, suggesting that these changes are within the normal range of variability for the lake. The productivity of Mirror Lake does not usually exhibit any clear seasonal trends, although phosphorus readings are often slightly lower after July. No clear seasonal trends were apparent in 2015, although phosphorus readings were again lower in later in the summer. The lake continues to be characterized as oligotrophic, based on water clarity, chlorophyll a and total phosphorus readings (all typical of oligotrophic lakes). The trophic state indices (TSI) evaluation suggests that each of the trophic indicators were “internally consistent”—that is, each trophic indicator was in the expected range given the readings for the other trophic indicators. Overall trophic conditions are summarized on the Lake Scorecard and Lake Condition Summary Table.
Evaluation of Potable Water Indicators Surface algae levels are not high enough to trigger slight impacts from taste and odor compounds or dangerous chlorinated compounds associated with excessive algae, although the lake is not classified for potable water use. Hypolimnetic phosphorus and ammonia readings in Mirror Lake are low and similar to those at the lake surface, although deepwater phosphorus readings were slightly lower than normal in 2015 after a slight rise in 2014. This suggests that any “unofficial” deepwater intakes may be supported. Potable water conditions, at least as measurable through CSLAP, are summarized in the Lake Scorecard and Lake Condition Summary Table.
Evaluation of Limnological Indicators Ammonia readings were slightly higher than normal in each of the last three years, and ammonia (and total nitrogen) levels have increased slightly over the last decade (although these readings are still fairly low). NOx readings have decreased over the same period, and NOx was also lower than normal in 2014 and 2015. pH was slightly higher than usual in 2015, and these readings have increased slightly since the early 2000s. Chloride levels in the 2015 sample, collected for the first time through CSLAP and cited in Appendix A, was 39 mg/l. These values fall within the “moderate” to “major” road salt runoff levels cited by the New Hampshire DES. These readings are well below the state potable water quality standard of 250 mg/l and within the range of values found in most NYS lakes. These readings suggest a moderate likelihood of biological impacts from road salt. Additional data will help to determine if these represent normal readings for the lake; it is not known if any impacts have been apparent. Overall limnological conditions are summarized in the Scorecard and Lake Condition Summary Table.
Evaluation of Biological Condition The macrophyte data collected by the NYSDEC through the biomonitoring survey found few aquatic plants, although none of these were exotic or protected plant species. It is likely that there
pg. 4

are other native plant species in the lake. There is insufficient information from these plant surveys to evaluate the floristic quality of the lake. The 2008 DEC macroinvertebrate survey results from Mirror Lake continue to be evaluated. The preliminary data show a small number of macroinvertebrate species, a low percentage of ETO (Ephemeroptera, Trichoptera, and Odonata) species (indicating moderate to poor water quality). However, the diversity index was high and percentage of tolerant species was low, indicating a macroinvertebrate community sensitive to pollution (often indicative of healthy lakes). The stream nutrient biotic index suggested low lake productivity, as expected given the nutrient and algae levels in the lake. These apparently contradictory results preclude a definitive assessment of the macroinvertebrate community in the lake, although this may become more apparent with additional analysis of the data. The fish community in the lake is comprised of a mix of coldwater (at least two species), coolwater (at least two species) and warmwater (at least three species) fish, suggesting a two-story fishery. Zooplankton surveys have been conducted through CSLAP in Mirror Lake. The fluoroprobe screening results over the last few years showed very low blue green algae levels and a low susceptibility for blue green algae blooms. Open water algae communities in the last few years has been comprised of diatoms, green algae and other forms of algae. Biological conditions in the lake are summarized in the Lake Scorecard and Lake Condition Summary Table.
Evaluation of Lake Perception Recreational assessments were slightly less favorable than normal in the last few years, due primarily to surface debris, swimmers itch, and excessive use of the lake, although these assessments continued to be “excellent”. Water quality assessments were slightly less favorable than usual in 2015, consistent with slightly lower water clarity and despite no significant differences in algae levels or water color. These assessments have degraded slightly over time, although they are usually (still) favorable. Aquatic plant coverage increases from June through August in the typical year, and seasonal increases were also apparent in 2015. Water quality and recreational assessments do not exhibit strong seasonal patterns. Overall lake perception is summarized on the Lake Scorecard and Lake Condition Summary Table.
Evaluation of Local Climate Change Water temperatures have decreased since the early 2000s, although these readings were higher than usual in 2015. It is not known if any of the small changes in air or water temperature readings are indicative of local climate change in the lake.
Evaluation of Algal Toxins Algal toxin levels can vary significantly within blooms and from shoreline to lake, and the absence of toxins in a sample does not indicate safe swimming conditions. Fluoroprobe readings have been well below the criteria associated with harmful algal blooms (HABs), due to very low
pg. 5

open water blue green algae levels. Algal toxin levels were not detectable in any open water samples in the last several years; no shoreline blooms have been reported or sampled.
Lake Condition Summary Category Indicator Min Overall
Avg Max 2015
Avg Classification 2015 Change? Long-term
Change? Eutrophication Indicators
Water Clarity 3.05 5.73 9.50 5.36 Oligotrophic Within Normal Range No Change
Chlorophyll a 0.10 1.21 4.94 1.04 Oligotrophic Within Normal Range No Change
Total Phosphorus 0.002 0.008 0.021 0.007 Oligotrophic Within Normal Range Increasing Slightly
Potable Water Indicators Hypolimnetic Ammonia 0.01 0.05 0.53 0.04 Close to Surface NH4
Readings Within Normal Range Not known
Hypolimnetic Arsenic Not known
Hypolimnetic Iron Not known
Hypolimnetic Manganese Not known Limnological Indicators Hypolimnetic Phosphorus 0.004 0.012 0.055 0.008 Close to Surface TP Readings Lower Than Normal Not known
Nitrate + Nitrite 0.00 0.02 0.11 0.00 Low NOx Lower Than Normal No Change
Ammonia 0.01 0.03 0.27 0.04 Low Ammonia Higher than Normal Increasing Significantly
Total Nitrogen 0.09 0.34 0.67 0.55 Low Total Nitrogen Higher than Normal No Change
pH 6.27 7.44 8.85 7.93 Circumneutral Higher than Normal No Change
Specific Conductance 112 176 241 169 Intermediate Hardness Within Normal Range No Change
True Color 1 9 31 10 Uncolored Within Normal Range No Change
Calcium 7.1 8.7 10.2 8.8 Not Susceptible to Zebra Mussels Within Normal Range No Change
Lake Perception WQ Assessment 1 1.9 3 2.4 Not Quite Crystal Clear Less Favorable than
Normal No Change
Aquatic Plant Coverage 1 2.4 3 2.6 Subsurface Plant Growth Within Normal Range No Change
Recreational Assessment 0 1.9 4 2.8 Excellent Less Favorable than Normal
Highly Degrading
Biological Condition Phytoplankton Open water-low blue green
algae biomass Not known Not known
Macrophytes Low plant diversity Not known Not known
Zooplankton Not measured through CSLAP Not known Not known
Macroinvertebrates Inconclusive results- will require analyses from additional lakes
Not known Not known
Fish Two story fishery Not known Not known
Invasive Species Variable leaf milfoil, curly leafed pondweed Not known Not known
Local Climate Change Air Temperature 0 17.4 30 18.0 Within Normal Range Decreasing
Slightly
Water Temperature 4 17.8 26 19.0 Within Normal Range Decreasing Slightly
pg. 6

Category Indicator Min Overall Avg
Max 2015 Avg
Classification 2015 Change? Long-term Change?
Harmful Algal Blooms Open Water Phycocyanin 1 8 54 5 No readings indicate high risk
of BGA Not known Not known
Open Water FP Chl.a 0 1 2 1 No readings indicate high algae levels Not known Not known
Open Water FP BG Chl.a 0 0 0 0 No readings indicate high BGA levels Not known Not known
Open Water Microcystis <DL <DL 0.5 <DL Very high open water MC-LR Not known Not known
Open Water Anatoxin a <DL <DL <DL <DL Open water Anatoxin-a consistently not detectable Not known Not known
Shoreline Phycocyanin No shoreline blooms sampled for PC Not known Not known
Shoreline FP Chl.a No shoreline blooms sampled for FP Not known Not known
Shoreline FP BG Chl.a No shoreline blooms sampled for FP Not known Not known
Shoreline Microcystis No shoreline bloom MC-LR data Not known Not known
Shoreline Anatoxin a No shoreline bloom anatoxin data Not known Not known
Evaluation of Lake Condition Impacts to Lake Uses The 2009 NYSDEC Priority Waterbody Listings (PWL) for the Lake Champlain drainage basin indicate “no use impairments” on Mirror Lake. The PWL listing for the lake is shown in Appendix B.
Potable Water (Drinking Water) The CSLAP dataset at Mirror Lake, including water chemistry data, physical measurements, and volunteer samplers’ perception data, is inadequate to evaluate the use of the lake for potable water, and the lake is not used for this purpose.
Public Bathing The CSLAP dataset at Mirror Lake, including water chemistry data, physical measurements, and volunteer samplers’ perception data, suggests that public bathing, if supported at a public swimming beach, should be fully supported, although additional information about bacterial levels is needed to evaluate the safety of the water for swimming.
Recreation (Swimming and Non-Contact Uses) The CSLAP dataset on Mirror Lake, including water chemistry data, physical measurements, and volunteer samplers’ perception data, suggest that recreation should be fully supported, although this use may be threatened by excessive weeds.
Aquatic Life The CSLAP dataset on Mirror Lake, including water chemistry data, physical measurements, and volunteer samplers’ perception data, suggest that aquatic life appears to be supported, although this use may be threatened by elevated chloride levels and periodically elevated pH. Additional data are needed to evaluate the food and habitat conditions for aquatic organisms in the lake.
Aesthetics and Habitat The CSLAP dataset on Mirror Lake, including water chemistry data, physical measurements, and volunteer samplers’ perception data, suggest that aesthetics should be good, although this
pg. 7

condition may be threatened by excessive weeds. Habitat may be impacted by invasive weeds (variable leaf watermilfoil or curly leafed pondweed).
Fish Consumption There are no fish consumption advisories posted for Mirror Lake.
Additional Comments and Recommendations Additional aquatic plant survey information would help to better evaluate the floristic quality of the lake. Lake residents are advised to report (and avoid exposure to) any shoreline algae blooms. Any sources of nutrients entering the lake from eroding shorelines, road runoff, or other sources should be identified and addressed in working with local agencies. This might help to reverse the increase in phosphorus levels over the last decade.
Aquatic Plant IDs-2015 None submitted for identification in 2015.
pg. 8

Time Series: Trophic Indicators, 2015
Time Series: Trophic Indicators, Typical Year (1998-2015)
0
1
2
3
4
5
6
70
2
4
6
8
10
12
06/05/2015 07/15/2015 08/24/2015 10/03/2015
Zsd,
m
TP a
nd C
hl.a
, µg/
l
TotalPChl.aZsd
0
1
2
3
4
5
6
70
1
2
3
4
5
6
7
8
9
10
Zsd
(m)
TP a
nd C
hl.a
(µg/
l)
TP
Chl.a
Zsd
June July Aug Sept Oct Nov
pg. 9

Time Series: Lake Perception Indicators, 2015
Time Series: Lake Perception Indicators, Typical Year (1998-2015)
1
2
3
4
5
06/05/2015 07/15/2015 08/24/2015 10/03/2015
Perc
eptio
n
Clarity
Weeds
Recreation
Most Favorable
Least Favorable
1
2
3
4
5
ClarityWeedsRecreation
Most Favorable
Least Favorable
June July Aug Sept Oct
Perc
eptio
n
Nov
pg. 10

Appendix B- CSLAP Water Quality Sampling Results for Mirror Lake
LNum PName Date Zbot Zsd Zsamp Tot.P NO3 NH4 TDN TN/TP TColor pH Cond25 Ca Chl.a Cl 149 Mirror L 6/23/1998 19.0 5.00 1.5 0.04 5 6.38 4.72 149 Mirror L 7/6/1998 17.1 5.00 1.5 0.01 3 7.91 4.94 149 Mirror L 7/21/1998 18.0 4.80 1.5 0.01 6 7.44 136 0.64 149 Mirror L 8/11/1998 17.7 4.70 1.5 0.01 4 7.23 137 1.55 149 Mirror L 8/23/1998 17.7 5.20 1.5 11 7.37 140 1.76 149 Mirror L 9/13/1998 18.2 6.60 1.5 0.006 5 7.61 144 2.98 149 Mirror L 9/26/1998 17.2 5.30 1.5 0.005 0.01 6 7.17 145 2.76 149 Mirror L 10/13/1998 17.1 5.30 0.006 0.01 6 7.58 149 2.67 149 Mirror L 6/20/1999 17.0 8.40 1.5 0.004 0.01 4 8.00 182 0.46 149 Mirror L 7/26/1999 16.8 7.20 1.5 0.005 0.01 6 6.72 181 0.86 149 Mirror L 8/12/1999 16.3 7.10 1.5 0.005 0.01 3 7.30 180 1.50 149 Mirror L 8/28/1999 16.8 6.80 1.5 0.006 0.01 6 6.27 179 1.24 149 Mirror L 9/27/1999 17.6 7.70 1.5 0.006 0.01 7 7.71 179 1.88 149 Mirror L 6/17/2000 16.5 4.30 2.0 0.005 0.01 7 6.98 173 2.51 149 Mirror L 7/12/2000 16.7 4.40 0.014 0.01 4 6.34 176 1.56 149 Mirror L 8/4/2000 16.0 4.50 0.005 0.01 7 6.51 176 1.54 149 Mirror L 8/28/2000 16.5 4.50 1.5 0.005 0.01 7 7.25 179 0.81 149 Mirror L 6/28/2001 14.7 5.10 2.0 0.007 0.08 5 7.78 178 1.26 149 Mirror L 7/17/2001 15.0 2.0 0.004 0.01 4 6.49 176 1.76 149 Mirror L 7/31/2001 14.4 5.40 2.0 0.009 0.01 4 6.41 178 1.06 149 Mirror L 8/27/2001 17.0 5.90 2.0 0.006 0.01 6 7.79 185 0.74 149 Mirror L 9/5/2001 14.7 5.30 2.0 0.010 0.01 5 8.22 181 149 Mirror L 9/24/2001 15.1 4.90 2.0 0.007 0.01 4 6.67 191 149 Mirror L 7/25/2003 1.0 0.006 0.01 0.01 0.13 23.44 12 7.39 206 149 Mirror L 8/14/2003 14.7 6.55 1.0 0.004 0.00 0.01 0.39 88.40 16 7.36 200 0.69 149 Mirror L 9/6/2003 17.1 5.60 1.0 0.007 0.02 0.01 7 7.40 219 1.58 149 Mirror L 9/22/2003 15.1 5.00 0.006 0.00 0.02 0.15 23.41 5 7.32 225 8.9 1.50 149 Mirror L 6/28/2004 14.3 4.95 1.5 0.004 0.01 0.01 0.28 65.56 19 6.84 241 0.40 149 Mirror L 7/20/2004 13.8 5.65 1.5 0.01 0.01 0.33 3 8.31 240 0.28 149 Mirror L 8/5/2004 13.9 5.30 1.5 0.005 0.02 0.03 0.22 49.10 5 7.81 197 0.80 149 Mirror L 8/24/2004 13.9 6.80 1.5 0.006 0.05 0.03 0.32 57.07 10 7.76 237 1.90 149 Mirror L 9/13/2004 14.6 7.63 1.5 0.006 0.02 0.01 0.32 58.08 8 7.51 174 9.0 0.60 149 Mirror L 10/5/2004 14.7 7.45 1.5 0.003 0.01 0.01 0.24 73.28 10 6.61 173 149 Mirror L 11/1/2004 14.8 5.55 1.5 0.006 0.01 0.01 5 7.58 211 1.80 149 Mirror L 11/17/2004 12.5 7.50 1.5 0.005 0.03 0.09 6 6.72 202 1.10 149 Mirror L 6/27/2005 13.40 5.50 1.5 0.007 0.01 0.02 0.10 13.85 7.03 208 8.5 1.21 149 Mirror L 7/13/2005 14.10 5.50 1.5 0.004 0.02 0.01 0.17 39.91 12 6.56 169 149 Mirror L 8/1/2005 14.10 4.75 0.010 0.02 0.01 0.25 25.59 17 7.63 213 1.00 149 Mirror L 8/18/2005 11.40 6.00 1.5 0.004 0.01 0.01 0.09 24.93 9 7.58 171 1.01 149 Mirror L 9/1/2005 12.50 5.60 1.5 0.005 0.03 0.01 0.18 38.86 8 7.42 210 8.5 1.12 149 Mirror L 9/21/2005 10.90 7.25 1.5 0.003 0.01 0.10 0.21 63.68 9 7.47 216 0.32 149 Mirror L 10/5/2005 9.90 7.55 1.5 0.002 0.02 0.03 0.17 72.98 5 6.76 199 0.89 149 Mirror L 10/24/05 10.50 6.50 1.5 0.015 0.03 0.02 0.21 14.65 7 8.02 209 1.30 149 Mirror L 6/24/2006 12.5 5.95 1.5 0.005 0.02 0.02 0.44 95.41 31 7.63 184 7.9 0.27 149 Mirror L 7/14/2006 12.5 5.35 1.5 0.009 0.09 0.06 0.62 66.33 7.83 168 0.75 149 Mirror L 8/1/2006 12.0 4.65 1.5 0.005 0.02 0.02 0.51 110.20 8.08 181 1.50 149 Mirror L 8/14/2006 11.0 4.40 1.5 0.007 0.01 0.02 0.52 79.36 5 8.30 187 2.11 149 Mirror L 8/25/2006 11.0 4.35 1.5 0.006 0.00 0.01 0.46 83.69 3 7.36 131 8.2 0.10 149 Mirror L 9/20/2006 12.0 8.60 1.5 0.007 0.45 67.47 7 7.14 188 1.35 149 Mirror L 10/10/2006 12.0 5.40 1.5 0.006 0.00 0.02 0.45 74.48 7 6.74 116 1.48 149 Mirror L 10/27/2006 13.0 5.45 1.5 0.005 0.04 0.04 0.38 85.33 6 8.16 164 149 Mirror L 7/7/2007 11.5 5.15 1.5 0.005 0.04 0.03 0.58 267.8 14 7.9 170 9.1 0.55 149 Mirror L 7/22/2007 14.0 9.50 0.005 0.01 0.01 0.34 168.7 9 8.1 179 1.70 149 Mirror L 8/16/2007 10.0 5.45 0.01 0.02 0.46 27.8 8 8.1 149 3.74 149 Mirror L 8/31/2007 9.0 6.15 0.008 0.00 0.01 0.61 169.9 5 7.4 155 1.30 149 Mirror L 9/21/2007 8.0 6.05 1.5 0.006 0.05 0.10 0.61 242.9 8 7.8 176 8.4 0.10 149 Mirror L 10/1/2007 9.0 6.15 1.5 0.006 0.01 0.27 0.48 190.4 1 7.7 164 1.21 149 Mirror L 10/10/2007 9.0 7.35 1.5 0.010 0.02 0.01 0.53 121.6 5 1.15 149 Mirror L 10/24/2007 9.0 8.15 1.5 0.009 0.02 0.05 0.22 52.8 3 7.1 217 1.23 149 Mirror L 6/22/2008 8.0 7.25 1.5 0.005 0.01 0.01 0.29 128.84 11 7.91 152 8.6 0.10 149 Mirror L 7/12/2008 9.5 5.55 1.5 0.007 0.11 0.03 0.19 59.48 6 7.45 168 0.34 149 Mirror L 8/4/2008 8.0 4.15 1.5 0.004 9 7.99 153 1.40 149 Mirror L 8/19/2008 9.0 3.68 1.5 0.007 0.07 0.02 0.26 78.16 8.05 203 1.46
pg. 11

LNum PName Date Zbot Zsd Zsamp Tot.P NO3 NH4 TDN TN/TP TColor pH Cond25 Ca Chl.a Cl 149 Mirror L 8/28/2008 8.5 5.55 1.5 0.008 0.00 0.01 0.18 48.30 9 6.83 177 8.5 1.18 149 Mirror L 9/8/2008 8.0 5.05 1.5 0.016 0.01 0.02 0.24 33.54 8 6.87 182 0.36 149 Mirror L 9/23/2008 8.0 5.03 1.5 0.011 0.01 0.03 0.26 53.70 4 7.42 177 0.23 149 Mirror L 10/15/2008 8.0 5.85 1.5 8 7.05 159 0.45 149 Mirror L 07/26/2009 8.5 6.60 1.5 0.009 0.01 0.02 0.16 42.19 18 7.54 139 9.0 0.30 149 Mirror L 08/05/2009 8.5 5.95 1.5 0.013 0.03 0.05 0.44 76.65 10 6.53 122 1.13 149 Mirror L 08/16/2009 8.0 7.40 1.5 0.006 0.01 0.01 0.20 77.38 17 7.89 140 0.80 149 Mirror L 08/30/2009 8.5 5.50 1.5 0.009 0.01 0.03 0.23 54.88 16 7.35 159 2.30 149 Mirror L 09/13/2009 8.5 5.55 1.5 0.008 0.01 0.05 0.20 59.25 16 7.82 207 7.1 1.20 149 Mirror L 09/20/2009 8.5 7.50 1.5 0.006 0.02 0.02 0.20 72.13 12 7.42 158 1.30 149 Mirror L 10/14/2009 8.0 6.80 1.5 0.012 0.02 0.30 53.12 8 7.52 157 1.00 149 Mirror L 07/06/2010 13.0 6.78 1.5 0.011 0.01 0.04 0.44 87.21 5 7.26 187 9.8 0.20 149 Mirror L 07/16/2010 13.0 5.45 1.5 0.005 0.02 0.02 0.22 101.57 11 8.59 197 0.90 149 Mirror L 08/05/2010 8.5 5.30 1.5 0.006 0.01 0.02 0.22 83.75 7 8.17 185 0.20 149 Mirror L 08/17/2010 9.0 5.35 1.5 0.021 0.01 0.03 0.37 38.11 6 7.61 186 0.30 149 Mirror L 08/31/2010 13.5 7.83 0.007 0.04 0.03 0.31 92.22 15 7.50 184 9.5 0.20 149 Mirror L 09/16/2010 8.5 6.45 1.5 0.007 0.02 0.03 0.29 91.83 8 7.12 188 0.20 149 Mirror L 10/06/2010 9.0 6.45 1.5 0.010 0.03 0.03 8 6.84 194 0.30 149 Mirror L 10/11/2010 8.5 6.15 1.5 0.012 0.03 0.03 0.32 58.25 11 6.69 180 0.40 149 Mirror L 07/07/2011 9.5 6.15 1.5 0.011 0.01 0.02 0.24 46.12 19 7.53 149 7.5 0.40 149 Mirror L 07/29/2011 8.5 6.20 1.5 0.007 0.02 0.03 0.38 129.97 22 7.50 152 0.30 149 Mirror L 08/18/2011 7.5 5.30 1.5 0.006 0.01 0.02 0.19 67.42 13 6.60 158 0.30 149 Mirror L 09/02/2011 7.3 5.35 1.5 0.012 0.02 0.03 0.46 87.05 12 8.83 156 1.70 149 Mirror L 09/13/2011 7.5 3.05 1.5 0.004 0.01 0.02 0.27 161.73 19 8.37 164 9.5 1.00 149 Mirror L 09/27/2011 7.5 6.15 1.5 0.004 0.01 0.02 0.26 131.00 14 7.76 153 0.80 149 Mirror L 10/10/2011 7.0 5.25 1.5 0.007 0.01 0.01 0.33 108.06 20 7.80 169 1.80 149 Mirror L 10/20/2011 8.0 4.85 1.5 0.008 0.02 0.02 0.34 92.40 15 7.70 173 3.00 149 Mirror L 07/11/2013 9.0 5.05 1.5 0.011 0.01 0.01 0.32 65.58 23 7.21 144 1.70 149 Mirror L 07/22/2013 8.5 4.05 1.5 0.009 0.49 126.25 16 7.53 154 1.40 149 Mirror L 08/08/2013 8.5 5.05 1.5 0.011 0.03 0.09 0.23 46.44 11 6.88 189 149 Mirror L 08/22/2013 8.0 5.35 1.5 0.006 0.44 158.66 13 7.25 156 0.60 149 Mirror L 09/08/2013 8.5 4.05 1.5 0.008 0.01 0.01 0.35 95.81 12 7.70 157 1.40 149 Mirror L 09/28/2013 9.0 4.25 1.5 0.007 0.38 111.96 12 7.55 167 1.00 149 Mirror L 10/10/2013 8.5 4.05 1.5 0.006 0.01 0.01 0.33 128.36 9 7.56 169 1.40 149 Mirror L 10/29/2013 7.5 4.55 1.5 0.013 0.56 96.66 12 7.09 193 1.30 149 Mirror L 6/23/2014 8.5 6.35 1.5 0.013 0.00 0.04 0.33 56.38 6 7.09 175 8.4 1.00 149 Mirror L 7/10/2014 9.0 5.45 1.5 0.014 0.25 38.97 9 6.44 112 1.50 149 Mirror L 7/20/2014 9.0 5.35 1.5 0.017 0.01 0.05 0.44 57.28 11 7.80 172 1.50 149 Mirror L 8/14/2014 5.45 1.5 0.013 0.28 47.98 4 7.63 183 1.90 149 Mirror L 9/8/2014 8.5 5.35 1.5 0.008 0.01 0.03 0.35 93.63 7 8.13 181 1.10 149 Mirror L 9/21/2014 5.15 1.5 0.017 0.01 0.03 0.44 57.12 7 7.88 179 10.2 1.00 149 Mirror L 10/5/2014 9.0 5.15 1.5 0.011 0.31 61.13 4 6.99 178 1.30 149 Mirror L 10/20/2014 9.0 5.15 1.5 0.009 0.43 106.09 7 7.36 193 1.40 149 Mirror L 6/29/2015 7.5 5.20 1.5 0.010 0.00 0.03 0.58 57.50 10 7.29 169 8.3 1.60 149 Mirror L 7/9/2015 7.5 5.00 1.5 0.007 0.67 96.38 16 7.00 166 0.80 149 Mirror L 8/17/2015 8.5 5.90 1.5 0.005 0.00 0.05 0.60 111.11 6 8.85 174 1.10 39.0 149 Mirror L 8/25/2015 7.5 5.50 1.5 0.008 0.64 79.38 10 7.84 169 0.80 149 Mirror L 9/2/2015 7.0 5.20 1.5 0.006 0.01 0.05 0.29 46.77 6 8.66 169 9.3 0.90 149 Mirror L 8/14/2003 0.023 0.00 0.01 0.29 13.05 149 Mirror L 9/6/2003 0.055 0.05 0.53 149 Mirror L 9/22/2003 1.5 0.016 0.03 0.13 0.29 18.10 149 Mirror L 8/24/2004 0.020 0.21 0.08 0.53 26.72 149 Mirror L 9/13/2004 0.006 0.03 0.03 0.24 39.21 149 Mirror L 10/5/2004 0.013 0.09 0.03 0.28 21.50 149 Mirror L 11/1/2004 0.006 0.02 0.10 149 Mirror L 11/17/2004 0.009 0.02 0.04 149 Mirror L 6/27/2005 9.5 0.006 149 Mirror L 7/13/2005 9.0 0.005 149 Mirror L 8/1/2005 9.5 0.006 149 Mirror L 8/18/2005 10.0 0.005 149 Mirror L 9/1/2005 9.5 0.006 149 Mirror L 9/21/2005 9.5 0.012 149 Mirror L 10/5/2005 9.5 0.008 149 Mirror L 10/24/05 9.0 0.006 149 Mirror L 6/24/2006 12.5 9.0 0.004 149 Mirror L 7/14/2006 12.5 9.5 0.006
pg. 12

LNum PName Date Zbot Zsd Zsamp Tot.P NO3 NH4 TDN TN/TP TColor pH Cond25 Ca Chl.a Cl 149 Mirror L 8/1/2006 12.0 9.5 0.006 149 Mirror L 8/14/2006 11.0 9.5 0.048 149 Mirror L 8/25/2006 11.0 9.5 0.006 149 Mirror L 9/20/2006 12.0 9.5 0.009 149 Mirror L 10/10/2006 12.0 9.5 0.006 149 Mirror L 10/27/2006 13.0 9.5 0.005 149 Mirror L 7/7/2007 11.5 9.5 0.006 149 Mirror L 7/22/2007 14.0 0.008 149 Mirror L 8/16/2007 10.0 0.012 149 Mirror L 8/31/2007 0.009 149 Mirror L 9/21/2007 8.0 7.0 0.005 149 Mirror L 10/1/2007 9.0 7.0 0.011 149 Mirror L 10/10/2007 9.0 8.0 0.009 149 Mirror L 10/24/2007 9.0 7.5 0.012 149 Mirror L 6/22/2008 7.0 0.008 149 Mirror L 7/12/2008 7.5 0.018 149 Mirror L 8/4/2008 7.0 0.007 149 Mirror L 8/19/2008 7.5 0.007 149 Mirror L 8/28/2008 7.0 0.010 149 Mirror L 9/8/2008 7.0 0.036 149 Mirror L 9/23/2008 7.0 0.020 149 Mirror L 10/15/2008 7.0 0.011 149 Mirror L 07/26/2009 8.5 7.5 0.010 0.03 149 Mirror L 08/05/2009 8.5 7.0 0.017 149 Mirror L 08/16/2009 8.0 7.0 0.011 0.01 149 Mirror L 08/30/2009 8.5 7.5 0.008 149 Mirror L 09/13/2009 8.5 7.0 0.012 0.01 149 Mirror L 09/20/2009 8.5 7.0 0.005 149 Mirror L 10/14/2009 8.0 7.0 0.008 0.03 149 Mirror L 7/6/2010 13.0 7.5 0.010 0.07 149 Mirror L 8/5/2010 8.5 7.0 0.007 0.02 149 Mirror L 8/31/2010 13.5 0.005 0.02 149 Mirror L 10/6/2010 9.0 7.0 0.013 0.04 149 Mirror L 7/7/2011 9.5 6.15 7.5 0.008 0.05 149 Mirror L 8/18/2011 7.5 5.30 7.0 0.016 0.03 149 Mirror L 9/13/2011 7.5 3.05 7.0 0.006 0.02 149 Mirror L 10/10/2011 7.0 5.25 6.0 0.006 0.01 149 Mirror L 7/11/2013 0.008 0.02 149 Mirror L 8/8/2013 0.019 0.02 149 Mirror L 9/8/2013 0.016 0.02 149 Mirror L 10/10/2013 0.006 0.01 149 Mirror L 6/23/2014 7.0 0.014 0.09 149 Mirror L 7/10/2014 7.0 0.028 149 Mirror L 7/20/2014 7.0 0.015 0.04 149 Mirror L 8/14/2014 7.0 0.009 149 Mirror L 9/8/2014 7.0 0.032 0.02 149 Mirror L 9/21/2014 7.0 0.008 0.02 149 Mirror L 10/5/2014 7.0 0.012 149 Mirror L 10/20/2014 7.0 0.010 149 Mirror L 6/29/2015 6.5 0.011 0.04 149 Mirror L 7/9/2015 6.5 0.006 149 Mirror L 8/17/2015 6.5 0.009 0.05 149 Mirror L 8/25/2015 6.0 0.006 149 Mirror L 9/2/2015 6.0 0.007 0.04
LNum PName Date Site TAir TH20 QA QB QC QD QF QG AQ-PC
AQ-Chla
MC-LR Ana-a Cyl
FP-Chl
FP-BG
HAB form
Shore HAB
149 Mirror L 6/23/1998 epi 20 9 2 1 1 149 Mirror L 7/6/1998 epi 21 20 2 1 1 149 Mirror L 7/21/1998 epi 27 24 149 Mirror L 8/11/1998 epi 24 22 2 1 1 5 149 Mirror L 8/23/1998 epi 23 22 2 1 2 149 Mirror L 9/13/1998 epi 16 18 1 1 1 149 Mirror L 9/26/1998 epi 15 17 1 1 1 149 Mirror L 10/13/1998 epi 14 13 1 1 1
pg. 13

LNum PName Date Site TAir TH20 QA QB QC QD QF QG AQ-PC
AQ-Chla
MC-LR Ana-a Cyl
FP-Chl
FP-BG
HAB form
Shore HAB
149 Mirror L 6/20/1999 epi 20 21 1 1 2 149 Mirror L 7/26/1999 epi 26 25 1 2 1 149 Mirror L 8/12/1999 epi 23 20 1 2 1 149 Mirror L 8/28/1999 epi 24 21 2 3 1 149 Mirror L 9/27/1999 epi 23 18 2 3 2 149 Mirror L 6/17/2000 epi 23 20 1 1 1 5 149 Mirror L 7/12/2000 epi 21 20 1 1 1 149 Mirror L 8/4/2000 epi 18 21 1 2 1 149 Mirror L 8/28/2000 epi 19 20 2 3 2 149 Mirror L 6/28/2001 epi 24 22 2 1 1 149 Mirror L 7/17/2001 epi 22 20 2 3 1 149 Mirror L 7/31/2001 epi 22 21 2 3 2 149 Mirror L 8/27/2001 epi 24 22 2 3 1 149 Mirror L 9/5/2001 epi 16 20 2 2 2 149 Mirror L 9/24/2001 epi 20 17 2 2 2 149 Mirror L 7/25/2003 epi 20 21 2 3 1 0 149 Mirror L 8/14/2003 epi 23 23 1 3 2 0 149 Mirror L 9/6/2003 epi 19 22 2 3 2 0 149 Mirror L 9/22/2003 epi 20 18 2 3 2 0 149 Mirror L 6/28/2004 epi 17 19 149 Mirror L 7/20/2004 epi 23 21 2 3 2 0 149 Mirror L 8/5/2004 epi 17 22 2 2 2 8 149 Mirror L 8/24/2004 epi 16 19 2 3 2 0 149 Mirror L 9/13/2004 epi 17 19 2 3 2 0 149 Mirror L 10/5/2004 epi 9 15 2 2 2 0 149 Mirror L 11/1/2004 epi 2 8 2 2 2 5 149 Mirror L 11/17/2004 epi 10 4 2 3 2 5 149 Mirror L 6/27/2005 epi 24 20 2 2 2 0 149 Mirror L 7/13/2005 epi 27 21 2 3 2 6 149 Mirror L 8/1/2005 epi 21 18 2 3 2 6 149 Mirror L 8/18/2005 epi 26 22 2 3 2 0 149 Mirror L 9/1/2005 epi 26 20 2 3 2 0 149 Mirror L 9/21/2005 epi 19 19 2 3 2 0 149 Mirror L 10/5/2005 epi 21 21 1 2 1 0 149 Mirror L 10/24/05 epi 16 20 2 2 4 45 149 Mirror L 6/24/2006 epi 22 20 3 2 3 56 149 Mirror L 7/14/2006 epi 28 21 2 3 2 0 149 Mirror L 8/1/2006 epi 30 26 2 3 3 56 149 Mirror L 8/14/2006 epi 20 21 2 3 2 56 149 Mirror L 8/25/2006 epi 16 20 2 3 2 0 149 Mirror L 9/20/2006 epi 14 16 2 3 2 0 149 Mirror L 10/10/2006 epi 9 11 2 2 2 5 149 Mirror L 10/27/2006 epi 6 7 2 2 2 5 149 Mirror L 7/7/2007 epi 21 19 2 3 2 0 149 Mirror L 7/22/2007 epi 17 21 2 2 2 57 149 Mirror L 8/16/2007 epi 18 21 2 3 3 6 149 Mirror L 8/31/2007 epi 15 20 2 3 2 149 Mirror L 9/21/2007 epi 15 17 2 2 2 0 149 Mirror L 10/1/2007 epi 15 17 2 2 2 8 149 Mirror L 10/10/2007 epi 12 15 2 3 2 0 149 Mirror L 10/24/2007 epi 9 12 2 2 2 0 149 Mirror L 6/22/2008 epi 17 19 2 2 2 5 149 Mirror L 7/12/2008 epi 20 21 2 3 2 6 149 Mirror L 8/4/2008 epi 18 21 2 3 2 5 149 Mirror L 8/19/2008 epi 15 20 2 2 2 5 149 Mirror L 8/28/2008 epi 21 20 2 2 2 5 149 Mirror L 9/8/2008 epi 19 19 2 2 2 0 149 Mirror L 9/23/2008 epi 11 16 2 2 2 0 149 Mirror L 10/15/2008 epi 10 12 2 2 2 8 149 Mirror L 07/26/2009 epi 20 21 2 3 2 7 149 Mirror L 08/05/2009 epi 21 21 2 2 2 0
pg. 14

LNum PName Date Site TAir TH20 QA QB QC QD QF QG AQ-PC
AQ-Chla
MC-LR Ana-a Cyl
FP-Chl
FP-BG
HAB form
Shore HAB
149 Mirror L 08/16/2009 epi 24 22 1 2 2 0 149 Mirror L 08/30/2009 epi 16 20 2 3 2 0 149 Mirror L 09/13/2009 epi 16 18 2 3 2 0 5.0 149 Mirror L 09/20/2009 epi 13 15 2 3 2 0 8.2 149 Mirror L 10/14/2009 epi 3 8 2 2 2 5 149 Mirror L 07/06/2010 epi 21 21 1 1 1 0 0 0 149 Mirror L 07/16/2010 epi 19 23 2 2 2 0 0 0 149 Mirror L 08/05/2010 epi 20 22 2 3 2 8 0 0 53.6 149 Mirror L 08/17/2010 epi 22 20 2 3 2 0 0 0 48.0 149 Mirror L 08/31/2010 epi 20 19 2 3 2 0 0 0 31.4 149 Mirror L 09/16/2010 epi 11 14 2 3 2 0 0 0 149 Mirror L 10/06/2010 epi 7 5 2 2 2 8 0 0 149 Mirror L 10/11/2010 epi 3 9 2 3 2 0 0 0 149 Mirror L 07/07/2011 epi 26 24 1 2 0 0 0 2.6 2.00 149 Mirror L 07/29/2011 epi 19 21 1 1 1 0 0 0 1.5 1.50 149 Mirror L 08/18/2011 epi 19 19 2 2 2 0 0 0 149 Mirror L 09/02/2011 epi 18 17 2 3 2 56 0 0 6.7 1.60 149 Mirror L 09/13/2011 epi 17 16 2 2 2 0 0 0 3.0 1.30 149 Mirror L 09/27/2011 epi 16 16 2 3 2 0 0 0 1.8 1.10 149 Mirror L 10/10/2011 epi 14 11 2 3 1 0 0 0 4.3 1.30 149 Mirror L 10/20/2011 epi 9 10 2 3 2 0 0 0 4.2 1.30 149 Mirror L 07/11/2013 epi 19 21 2 2 3 56 7 7 2.6 0.60 <0.30 <0.370 0.50 0.00 I 149 Mirror L 07/22/2013 epi 27 22 2 2 3 67 3 3 5.2 0.90 <0.30 <0.370 0.90 0.10 I I 149 Mirror L 08/08/2013 epi 17 18 2 2 3 67 3 3 4.7 1.80 <0.30 <0.340 149 Mirror L 08/22/2013 epi 18 17 2 3 3 67 3 2.7 0.70 <0.30 <0.650 i 149 Mirror L 09/08/2013 epi 10 12 2 3 2 6 3.4 1.30 1.50 0.00 149 Mirror L 09/28/2013 epi 10 10 2 3 3 6 3 3 3.5 0.60 <0.30 <0.100 0.60 0.10 I 149 Mirror L 10/10/2013 epi 14 11 2 3 2 6 0 0 4.0 0.80 <0.30 <0.090 0.60 0.00 I 149 Mirror L 10/29/2013 epi 0 5 2 3 2 6 0 0 3.9 0.80 <0.30 <0.090 0.60 0.00 I 149 Mirror L 6/23/2014 epi 19 18 2 2 2 6 7 7 1.40 0.20 <0.58 <0.44 <0.002 0.64 0.00 i 149 Mirror L 7/10/2014 epi 14 18 2 2 2 7 0 0 2.50 0.20 <0.40 <0.21 <0.003 0.55 0.00 i i 149 Mirror L 7/20/2014 epi 19 19 2 3 2 6 0 0 2.20 0.20 <0.39 <0.21 <0.003 1.07 0.45 i i 149 Mirror L 8/14/2014 epi 10 17 2 3 3 67 7 7 3.00 0.20 <0.39 <0.03 <0.001 0.65 0.10 i i 149 Mirror L 9/8/2014 epi 15 17 2 3 2 6 0 0 5.00 0.20 <0.29 <0.14 <0.002 0.93 0.34 149 Mirror L 9/21/2014 epi 14 12 2 3 2 6 0 0 2.70 0.10 <0.48 <0.04 <0.001 0.86 0.22 149 Mirror L 10/5/2014 epi 9 12 2 3 2 6 0 0 2.40 0.20 <0.59 <0.12 <0.001 0.92 0.01 i i 149 Mirror L 10/20/2014 epi 4 8 2 3 2 5 0 0 2.40 0.20 <0.95 <0.09 <0.006 1.57 0.48 149 Mirror L 6/29/2015 epi 12 16 2 2 3 56 0 0 4.80 0.20 <0.63 <0.007 <0.040 0.90 0.30 I I 149 Mirror L 7/9/2015 epi 16 18 2 2 2 5 0 0 7.00 0.10 <0.30 <0.005 <0.028 0.60 0.20 I I 149 Mirror L 8/17/2015 epi 22 21 3 3 3 678 7 7 5.20 0.90 <0.33 <0.006 <0.024 0.80 0.40 I 149 Mirror L 8/25/2015 epi 20 21 3 3 3 67 7 7 <0.49 <0.023 <0.086 0.20 0.00 149 Mirror L 9/2/2015 epi 20 19 2 3 3 6 7 7 1.90 0.10 <0.27 <0.009 <0.022 0.60 0.40 149 Mirror L 7/10/2014 hypo 8 149 Mirror L 7/20/2014 hypo 10 149 Mirror L 8/14/2014 hypo 12 149 Mirror L 9/8/2014 hypo 13 149 Mirror L 9/21/2014 hypo 12 149 Mirror L 10/5/2014 hypo 11 149 Mirror L 10/20/2014 hypo 9 149 Mirror L 6/29/2015 hypo 11 149 Mirror L 7/9/2015 hypo 11 149 Mirror L 8/17/2015 hypo 19 149 Mirror L 8/25/2015 hypo 19 149 Mirror L 9/2/2015 hypo 17
pg. 15

Legend Information Indicator Description Detection
Limit Standard (S) / Criteria (C)
General Information Lnum lake number (unique to CSLAP) Lname name of lake (as it appears in the Gazetteer of NYS Lakes) Date sampling date
Field Parameters Zbot lake depth at sampling point, meters (m) Zsd Secchi disk transparency or clarity 0.1m 1.2m ( C) Zsamp water sample depth (m) (epi = epilimnion or surface; bot = bottom) 0.1m none Tair air temperature ( C) -10C none TH20 water temperature ( C) -10C none
Laboratory Parameters Tot.P total phosphorus (mg/l) 0.003 mg/l 0.020 mg/l ( C) NOx nitrate + nitrite (mg/l) 0.01 mg/l 10 mg/l NO3 (S),
2 mg/l NO2 (S) NH4 total ammonia (mg/l) 0.01 mg/l 2 mg/l NH4 (S) TN total nitrogen (mg/l) 0.01 mg/l none TN/TP nitrogen to phosphorus (molar) ratio, = (TKN + NOx)*2.2/TP none TCOLOR true (filtered) color (ptu, platinum color units) 1 ptu none pH powers of hydrogen (S.U., standard pH units) 0.1 S.U. 6.5, 8.5 S.U. (S) Cond25 specific conductance, corrected to 25C (umho/cm) 1 umho/cm none Ca, Cl calcium, chloride (mg/l) 1 mg/l none Chl.a chlorophyll a (ug/l) 0.01 ug/l none Fe iron (mg/l) 0.1 mg/1 1.0 mg/l (S) Mn manganese (mg/l) 0.01 mg/l 0.3 mg/l (S) As arsenic (ug/l) 1 ug/l 10 ug/l (S) AQ-PC Phycocyanin (aquaflor) (unitless) 1 unit none AQ-Chl Chlorophyll a (aquaflor) (ug/l) 1 ug/l none MC-LR Microcystis-LR (ug/l) 0.01 ug/l 1 ug/l potable (C)
20 ug/l swimming (C) Ana Anatoxin-a (ug/l) variable none Cyl Cylindrospermposin (ug/l) 0.1 ug/l none FP-Chl, FP-BG Fluoroprobe total chlorophyll, fluoroprobe blue-green chlorophyll (ug/l) 0.1 ug/l none
Lake Assessment QA water quality assessment; 1 = crystal clear, 2 = not quite crystal clear, 3 =
definite algae greenness, 4 = high algae levels, 5 = severely high algae levels
QB aquatic plant assessment; 1 = no plants visible, 2 = plants below surface, 3 = plants at surface, 4 = plants dense at surface, 5 = surface plant coverage
QC recreational assessment; 1 = could not be nicer, 2 = excellent, 3 = slightly impaired, 4 = substantially impaired, 5 = lake not usable
QD reasons for recreational assessment; 1 = poor water clarity, 2 = excessive weeds, 3 = too much algae, 4 = lake looks bad, 5 = poor weather, 6 = litter/surface debris, 7 = too many lake users, 8 = other
QF, QG Health and safety issues today (QF) and past week (QG); 0 = none, 1 = taste/odor, 2 = GI illness humans/animals, 3 = swimmers itch, 4 = algae blooms, 5 = dead fish, 6 = unusual animals, 7 = other
HAB form, Shore HAB
HAB evaluation; A = spilled paint, B = pea soup, C = streaks, D = green dots, E = bubbling scum, F = green/brown tint, G = duckweed, H = other, I = no bloom
pg. 16

Appendix B: Priority Waterbody Listing for Mirror Lake
pg. 17

pg. 18

Appendix C- Long Term Trends: Mirror Lake Long Term Trends: Water Clarity
• Apparent slight long term ↓ • Most readings typical of mesoligotrophic
lakes, consistent with TP and chlorophyll a
Long Term Trends: Phosphorus • ↑ TP since late 2000s, but drop in 2015 • Most readings typical of mesoligotrophic
lakes, similar to algae and clarity data
Long Term Trends: Chlorophyll a
• No trends apparent; perhaps slight decrease • Most readings typical of oligotrophic lakes,
mostly consistent with TP and clarity data
Long Term Trends: Lake Perception
• All indicators degrading; unrelated changes • Changes in recreational perception linked to
factors other than weeds or water quality
Long Term Trends: Bottom Phosphorus • Bottom TP similar but also ↑ since late 00s • Similar surface/bottom TP readings but
colder deep T suggests little internal P release
Long Term Trends: N:P Ratio
• No trends apparent • Most readings indicate phosphorus limits
algae growth
0
1
2
3
4
5
6
7
8
1985 1990 1995 2000 2005 2010 2015
Avg
Sum
mer
Wat
er C
larit
y (m
)
Eutrophic
Oligotrophic
Mesotrophic
0.000
0.005
0.010
0.015
0.020
0.025
0.030
1985 1990 1995 2000 2005 2010 2015
Avg
Sum
mer
TP
(mg/
l) Eutrophic
Mesotrophic
Oligotrophic
0
2
4
6
8
10
1985 1990 1995 2000 2005 2010 2015
Avg
Sum
mer
Chl
.a (
ug/l
) Eutrophic
Mesotrophic
Oligotrophic
1985 1990 1995 2000 2005 2010 2015
Avg
Sum
mer
Lake
Per
cept
ion
ClarityPlant CoverageRecreation
Favorable/Subsurface
Weeds
Unfavorable / Dense Weeds
Slightly Impaired/ Surface Weeds
0.000
0.005
0.010
0.015
0.020
0.025
0.030
0.035
1985 1990 1995 2000 2005 2010 2015
Avg
Sum
mer
TP
(mg/
l)
SurfaceBottom
1
10
100
1000
1985 1990 1995 2000 2005 2010 2015
Avg
Sum
mer
TN
/TP
Phosphorus Limited
Nitrogen Limited
N or P Limited
pg. 19

Long Term Trends: Nitrogen • NH4, TN ↑ and NOx ↓ slightly since mid-00s • All nitrogen indicators low and typical of
lakes with low algae levels
Long Term Trends: pH • No trends apparent; highly variable • Most readings typical of slightly alkaline to
circumneutral lakes, with some low readings
Long Term Trends: Conductivity
• No trends apparent; ↓ since early 2000s • Most readings typical of lakes with softwater
to intermediate hardness
Long Term Trends: Color • Higher after 2002 lab change • Most readings still typical of uncolored lakes
Long Term Trends: Calcium
• No trends apparent • Data indicates low susceptibility to zebra
mussels, which are not found in lake
Long Term Trends: Water Temperature
• Surface T ↓, deep T lower than surface • Deepwater water quality data indicates weak
thermal stratification
0.00
0.01
0.10
1.00
1985 1990 1995 2000 2005 2010 2015
Avg
Sum
mer
Nitr
ogen
(mg/
l)
NOx NH4
TN
5
6
7
8
9
1985 1990 1995 2000 2005 2010 2015
Avg
Sum
mer
pH
Highly Alkaline (Above NYS WQ standard)
Circumneutral (Acceptable)
Acidic (Below NYS WQ standard)
Slightly Alkaline (Acceptable)
0
50
100
150
200
250
300
1985 1990 1995 2000 2005 2010 2015
Avg
Sum
mer
Con
d (u
mho
/cm
) Hardwater
Softwater
05
101520253035404550
1985 1990 1995 2000 2005 2010 2015
Avg
Sum
mer
Col
or (p
tu) Colored
Weakly Colored
Uncolored
0
5
10
15
20
25
30
35
40
1985 1990 1995 2000 2005 2010 2015
Avg
Sum
mer
Cal
cium
(mg/
l)Highly Susceptible to Zebra Mussels
Not Susceptible to Zebra Mussels
May Be Susceptible to Zebra Mussels
0
5
10
15
20
25
1985 1990 1995 2000 2005 2010 2015
Avg
Sum
mer
Wat
er Te
mp
(C)
SurfaceBottom
pg. 20
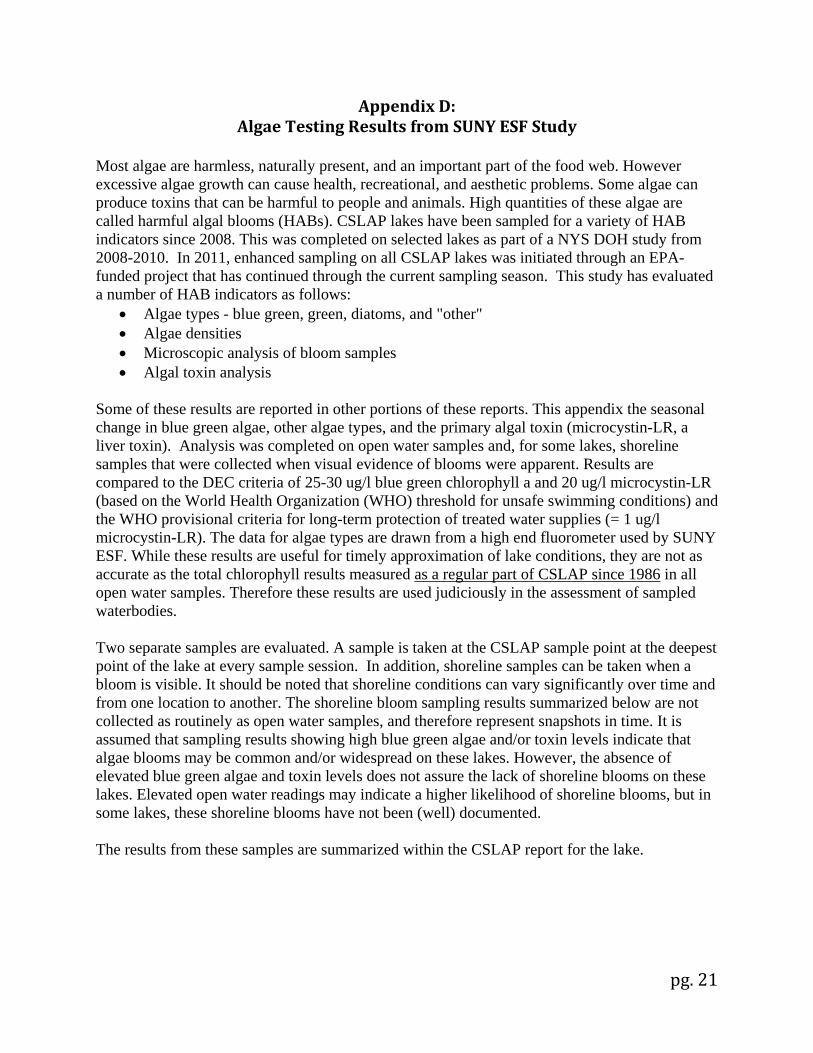
Appendix D: Algae Testing Results from SUNY ESF Study
Most algae are harmless, naturally present, and an important part of the food web. However excessive algae growth can cause health, recreational, and aesthetic problems. Some algae can produce toxins that can be harmful to people and animals. High quantities of these algae are called harmful algal blooms (HABs). CSLAP lakes have been sampled for a variety of HAB indicators since 2008. This was completed on selected lakes as part of a NYS DOH study from 2008-2010. In 2011, enhanced sampling on all CSLAP lakes was initiated through an EPA-funded project that has continued through the current sampling season. This study has evaluated a number of HAB indicators as follows:
• Algae types - blue green, green, diatoms, and "other" • Algae densities • Microscopic analysis of bloom samples • Algal toxin analysis
Some of these results are reported in other portions of these reports. This appendix the seasonal change in blue green algae, other algae types, and the primary algal toxin (microcystin-LR, a liver toxin). Analysis was completed on open water samples and, for some lakes, shoreline samples that were collected when visual evidence of blooms were apparent. Results are compared to the DEC criteria of 25-30 ug/l blue green chlorophyll a and 20 ug/l microcystin-LR (based on the World Health Organization (WHO) threshold for unsafe swimming conditions) and the WHO provisional criteria for long-term protection of treated water supplies (= 1 ug/l microcystin-LR). The data for algae types are drawn from a high end fluorometer used by SUNY ESF. While these results are useful for timely approximation of lake conditions, they are not as accurate as the total chlorophyll results measured as a regular part of CSLAP since 1986 in all open water samples. Therefore these results are used judiciously in the assessment of sampled waterbodies. Two separate samples are evaluated. A sample is taken at the CSLAP sample point at the deepest point of the lake at every sample session. In addition, shoreline samples can be taken when a bloom is visible. It should be noted that shoreline conditions can vary significantly over time and from one location to another. The shoreline bloom sampling results summarized below are not collected as routinely as open water samples, and therefore represent snapshots in time. It is assumed that sampling results showing high blue green algae and/or toxin levels indicate that algae blooms may be common and/or widespread on these lakes. However, the absence of elevated blue green algae and toxin levels does not assure the lack of shoreline blooms on these lakes. Elevated open water readings may indicate a higher likelihood of shoreline blooms, but in some lakes, these shoreline blooms have not been (well) documented. The results from these samples are summarized within the CSLAP report for the lake.
pg. 21

Figure D1:
2013 Open Water Total and BGA Chl.a
Figure D3:
2013 Shoreline Total and BGA Chl.a
Figure D5:
2013 Open Water Algae Types
Figure D2:
2013 Open Water Microcystin-LR
Figure D4:
2013 Shoreline Microcystin-LR
Figure D6:
2013 Shoreline Algae Types
0
5
10
15
20
25
30
35
40
45
50
6/1 6/16 7/1 7/16 7/31 8/15 8/30 9/14 9/29 10/14 10/29
Chlo
roph
yll a
(ug/
l)2013 Open Water Algae Levels
Open Total Chl.aOpen BG Chl.a BGA Bloom Criteria
1
10
100
6/1 6/16 7/1 7/16 7/31 8/15 8/30 9/14 9/29
Chlo
roph
yll a
(ug/
l)
2013 Shoreline Algae Levels
Shore Total Chl.a
Shore BG Chl.a
BGA Bloom Criteria
0
1
2
3
4
5
7/11 7/22 8/8 8/22 9/8 9/28 10/10 10/29
Chlo
roph
yll a
(ug/
l)
2013 Open Water Algae Samples
BG AlgaeGreen AlgaeDiatomsOther Algae
0.1
1
10
100
6/1 6/21 7/11 7/31 8/20 9/9 9/29 10/19
Mic
rocy
stis
-LR
(ug/
l)
2013 Open Water Toxin Levels
Open MC-LR
WHO Hi Risk Swimming Criteria
WHO Lo Risk Drinking Criteria
0.1
1
10
100
6/1 6/16 7/1 7/16 7/31 8/15 8/30 9/14 9/29
Mic
rocy
stis
-LR
(ug/
l)
2013 Shoreline Toxin Levels
Shore MC-LR
WHO Hi Risk Swimming Criteria
WHO Lo Risk Drinking Criteria
0
1
10
7/11 7/22 8/8 8/22 9/8 9/28 10/10 10/29
Chlo
roph
yll a
(ug/
l)
2013 Shoreline Algae Samples
BG AlgaeGreen AlgaeDiatomsOther Algae
pg. 22

Figure D7:
2014 Open Water Total and BGA Chl.a
Figure D9:
2014 Shoreline Total and BGA Chl.a
Figure D11:
2014 Open Water Algae Types
Figure D8:
2014 Open Water Microcystin-LR
Figure D10:
2014 Shoreline Microcystin-LR
Figure D12:
2014 Shoreline Algae Types
0
5
10
15
20
25
30
35
40
45
50
5/15 6/14 7/14 8/13 9/12 10/12
Chlo
roph
yll a
(ug/
l)2014 Open Water Algae Levels
Open Total Chl.aOpen BG Chl.a BGA Bloom Criteria
1
10
100
5/15 6/4 6/24 7/14 8/3 8/23 9/12 10/2
Chlo
roph
yll a
(ug/
l)
2014 Shoreline Algae Levels
Shore Total Chl.a
Shore BG Chl.a
BGA Bloom Criteria
0
2
6/23 7/10 7/20 8/14 9/8 9/21 10/5 10/20
Chlo
roph
yll a
(ug/
l)
2014 Open Water Algae SamplesBG AlgaeGreen AlgaeDiatomsOther Algae
0.1
1
10
100
5/15 6/4 6/24 7/14 8/3 8/23 9/12 10/2 10/22
Mic
rocy
stis
-LR
(ug/
l)
2014 Open Water Toxin Levels
Open MC-LR
WHO Hi Risk Swimming Criteria
WHO Lo Risk Drinking Criteria
0.1
1
10
100
5/15 6/4 6/24 7/14 8/3 8/23 9/12 10/2
Mic
rocy
stis
-LR
(ug/
l)
2014 Shoreline Toxin Levels
Shore MC-LR
WHO Hi Risk Swimming Criteria
WHO Lo Risk Drinking Criteria
0
1
10
6/23 7/10 7/20 8/14 9/8 9/21 10/5 10/20
Chlo
roph
yll a
(ug/
l)
2014 Shoreline Algae Samples
BG AlgaeGreen AlgaeDiatomsOther Algae
pg. 23

Figure D13:
2015 Open Water Total and BGA Chl.a
Figure D15:
2015 Shoreline Total and BGA Chl.a
Figure D17:
2015 Open Water Algae Types
Figure D14:
2015 Open Water Microcystin-LR
Figure D16:
2015 Shoreline Microcystin-LR
Figure D18:
2015 Shoreline Algae Types
0
5
10
15
20
25
30
35
40
45
50
5/1 5/26 6/20 7/15 8/9 9/3 9/28 10/23
Chlo
roph
yll a
(ug/
l)2015 Open Water Algae Levels
Open Total Chl.aOpen BG Chl.a
BGA Bloom Criteria
1
10
100
5/1 5/26 6/20 7/15 8/9 9/3 9/28 10/23
Chlo
roph
yll a
(ug/
l)
2015 Shoreline Algae Levels
Shore Total Chl.a
Shore BG Chl.a
BGA Bloom Criteria
0
2
4
6
8
10
6/29 7/9 8/17 8/25 9/2
Chlo
roph
yll a
(ug/
l)
2015 Open Water Algae SamplesBG AlgaeGreen AlgaeDiatomsOther Algae
0.1
1
10
100
5/1 5/26 6/20 7/15 8/9 9/3 9/28 10/23
Mic
rocy
stis
-LR
(ug/
l)
2015 Open Water Toxin Levels
Open MC-LR
WHO Hi Risk Swimming Criteria
WHO Lo Risk Drinking Criteria
0.1
1
10
100
5/1 5/26 6/20 7/15 8/9 9/3 9/28 10/23
Mic
rocy
stis
-LR
(ug/
l)
2015 Shoreline Toxin Levels
Shore MC-LR
WHO Hi Risk Swimming Criteria
WHO Lo Risk Drinking Criteria
0
1
10
6/29 7/9 8/17 8/25 9/2
Chlo
roph
yll a
(ug/
l)
2015 Shoreline Algae Samples
BG AlgaeGreen AlgaeDiatomsOther Algae
pg. 24

Appendix E:
AIS Species in Essex County
The table below shows the invasive aquatic plants and animals that have been documented in Essex County, as cited in either the iMapInvasives database (http://www.imapinvasives.org/) or in the NYSDEC Division of Water database. These databases may include some, but not all, non-native plants or animals that have not been identified as “Prohibited and Regulated Invasive Species” in New York state regulations (6 NYCRR Part 575; http://www.dec.ny.gov/docs/lands_forests_pdf/islist.pdf). This list is not complete, but instead represents only those species that have been reported and verified within the county. If any additional aquatic invasive species (AIS) are known or suspected in these or other waterbodies in the county, this information should be reported through iMap invasives or by contacting NYSDEC at [email protected].
Aquatic Invasive Species - Essex County Waterbody Kingdom Common name Scientific name Augur Lake Plant Eurasian watermilfoil Myriophyllum spicatum Bartlett Pond Plant Eurasian watermilfoil Myriophyllum spicatum Butternut Pond Plant Eurasian watermilfoil Myriophyllum spicatum Chapel Pond Animal Allegheny crayfish Orconectes obscurus Eagle Lake Plant Eurasian watermilfoil Myriophyllum spicatum Franklin Falls Pond Plant Eurasian watermilfoil Myriophyllum spicatum Franklin Falls Pond Plant Curly leafed pondweed Potamogeton crispus Franklin Falls Pond Plant Curly leafed pondweed Potamogeton crispus Goodnow Flowage Plant Brittle naiad Najas minor Highlands Forge Lake Plant Eurasian watermilfoil Myriophyllum spicatum Lake Champlain Animal Spiny waterflea Bythotrephes longimanus Lake Champlain Animal Zebra mussel Dreissena polymorpha Lake Champlain Plant Variable watermilfoil Myriophyllum heterophyllum Lake Champlain Plant Eurasian watermilfoil Myriophyllum spicatum Lake Champlain Plant Water chestnut Trapa natans Lake Eaton Plant European frogbit Hydrocharis morsus-ranae Lake Flower Plant Variable watermilfoil Myriophyllum heterophyllum Lake George Animal Zebra mussel Dreissena polymorpha Lake George Plant Eurasian watermilfoil Myriophyllum spicatum Lake George Animal Virile crayfish Orconectes virilis Lake George Plant Curly leafed pondweed Potamogeton crispus Lake Placid Plant Variable watermilfoil Myriophyllum heterophyllum Lake Placid Plant Variable watermilfoil Myriophyllum heterophyllum Lincoln Pond Plant Eurasian watermilfoil Myriophyllum spicatum
pg. 25
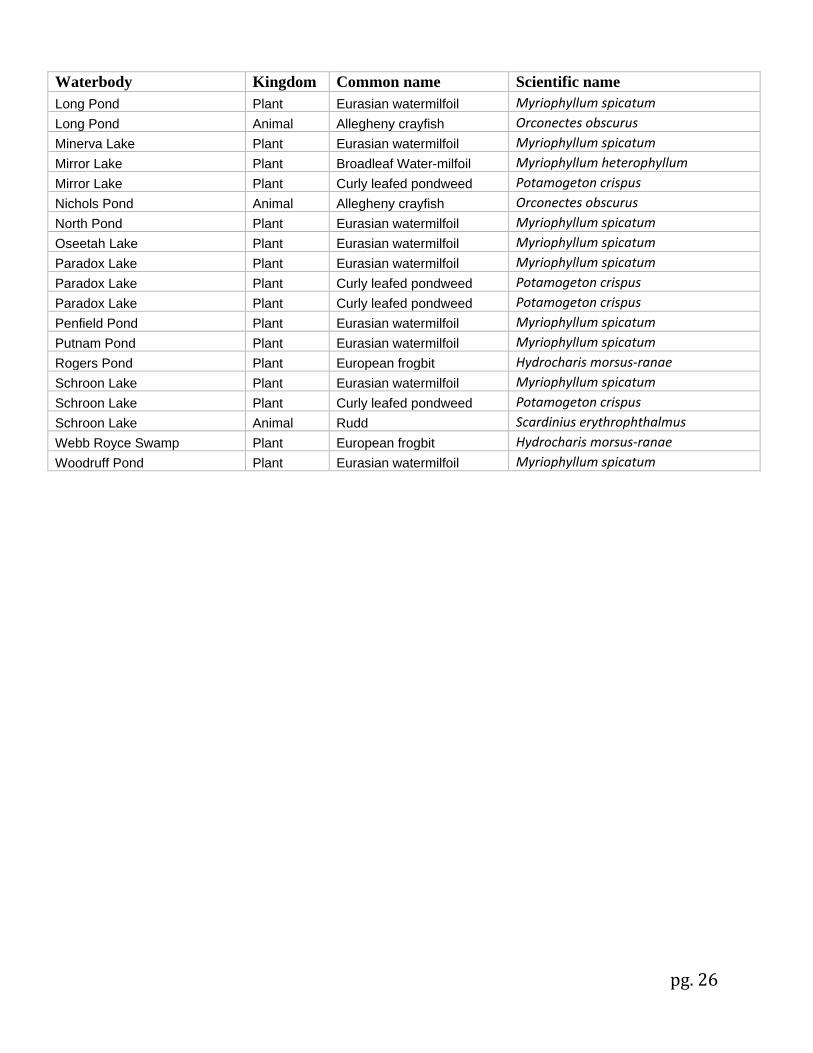
Waterbody Kingdom Common name Scientific name Long Pond Plant Eurasian watermilfoil Myriophyllum spicatum Long Pond Animal Allegheny crayfish Orconectes obscurus Minerva Lake Plant Eurasian watermilfoil Myriophyllum spicatum Mirror Lake Plant Broadleaf Water-milfoil Myriophyllum heterophyllum Mirror Lake Plant Curly leafed pondweed Potamogeton crispus Nichols Pond Animal Allegheny crayfish Orconectes obscurus North Pond Plant Eurasian watermilfoil Myriophyllum spicatum Oseetah Lake Plant Eurasian watermilfoil Myriophyllum spicatum Paradox Lake Plant Eurasian watermilfoil Myriophyllum spicatum Paradox Lake Plant Curly leafed pondweed Potamogeton crispus Paradox Lake Plant Curly leafed pondweed Potamogeton crispus Penfield Pond Plant Eurasian watermilfoil Myriophyllum spicatum Putnam Pond Plant Eurasian watermilfoil Myriophyllum spicatum Rogers Pond Plant European frogbit Hydrocharis morsus-ranae Schroon Lake Plant Eurasian watermilfoil Myriophyllum spicatum Schroon Lake Plant Curly leafed pondweed Potamogeton crispus Schroon Lake Animal Rudd Scardinius erythrophthalmus Webb Royce Swamp Plant European frogbit Hydrocharis morsus-ranae Woodruff Pond Plant Eurasian watermilfoil Myriophyllum spicatum
pg. 26

Appendix F: Current Year vs. Prior Averages for Mirror Lake
Current Year Water Temperatures vs. Prior Average
This year's shallow water sample temperatures are tending to be lower than normal when compared to the average of readings collected from 1998 to 2014. There are not enough deep water sample temperatures to determine a trend for the current year when compared to the average of readings collected during 2014.
Current Year Secchi Readings vs. Prior Average
This year's session Secchi readings are about the same as the average of readings collected from 1998 to 2014
pg. 27

Appendix G: Watershed and Land Use Map for Mirror Lake This watershed and land use map was developed using USGS StreamStats and ESRI ArcGIS using the 2006 land use satellite imagery. The actual watershed map and present land uses within this watershed may be slightly different due to the age of the underlying data and some limits to the use of these tools in some geographic regions and under varying flow conditions. However, these maps are intended to show the approximate extent of the lake drainage basin and the major land uses found within the boundaries of the basin.
pg. 28