CSLAP 2013 Lake Water Quality Summary: Limee...
19
pg. 1 CSLAP 2013 Lake Water Quality Summary: Lime Lake General Lake Information Location Town of Machias County Cattaraugus Basin Niagara River/Lake Erie Size 64. 3 hectares (158.9 acres) Lake Origins Augmented by 12’ by 200’ earthen dam built in 1850 Watershed Area 388.5 hectares (960 acres) Retention Time 1.4 years Mean Depth 4.6 meters Sounding Depth 10.7 meters Public Access state (DEC) cartop launch Major Tributaries None Lake Tributary To… Lime Lake Outlet and tribs WQ Classification B Lake Outlet Latitude 42.435 Lake Outlet Longitude -78.475833 Sampling Years 1997-1999, 2001-2002, 2005, 2011-2013 2013 Samplers Gail &Tom Reese, Wendy Thompson, Marcia Bender Main Contact Bob McNamara Lake Map
Transcript of CSLAP 2013 Lake Water Quality Summary: Limee...

pg. 1
CSLAP 2013 Lake Water Quality Summary: Lime Lake
General Lake Information Location Town of Machias County Cattaraugus Basin Niagara River/Lake Erie Size 64. 3 hectares (158.9 acres) Lake Origins Augmented by 12’ by 200’ earthen dam built in 1850 Watershed Area 388.5 hectares (960 acres) Retention Time 1.4 years Mean Depth 4.6 meters Sounding Depth 10.7 meters Public Access state (DEC) cartop launch Major Tributaries None Lake Tributary To… Lime Lake Outlet and tribs WQ Classification B Lake Outlet Latitude 42.435 Lake Outlet Longitude -78.475833 Sampling Years 1997-1999, 2001-2002, 2005, 2011-2013 2013 Samplers Gail &Tom Reese, Wendy Thompson, Marcia Bender Main Contact Bob McNamara
Lake Map

pg. 2
Background Lime Lake is a 159 acre, class B(T) lake found in the Town of Machias in Cattaraugus County, in western New York State. It was first sampled as part of CSLAP in 1997. It is one of 12 CSLAP lakes among the more than 20 lakes found in Cattaraugus County, and one of 2 CSLAP lakes among the more than 120 lakes and ponds in the Lake Erie-Niagara River drainage basin.
Lake Uses Lime Lake is a Class B lake; this means that the best intended use for the lake is for contact recreation—swimming and bathing, non-contact recreation—fishing and boating, aquatic life, and aesthetics. The lake is used by lake residents and invited guests for swimming and passive boating, and the lake has a state cartop launch site (with a parking lot supporting 12 cars) to support the use of the lake by visitors. The village of Lime Lake supports a number of activities associated with the lake. Approximately 550 12” muskellunge are stocked in Lime Lake by the state of New York. Walleye have also historically been stocked in the lake. General statewide fishing regulations are applicable in Lime Lake. In addition, the open season for walleye lasts from the first Saturday in May through March 15th, with a minimum take length of 18” and a daily take limit of 3. Ice fishing is allowed.
Historical Water Quality Data CSLAP sampling was conducted on Lime Lake each year from 1988-1994, 1997-2001, 2004-2005, and 2011-2013. Most of the previous years’ CSLAP reports can be found on the NYSFOLA website at http://nysfola.mylaketown.com. The most recent CSLAP report and scorecard for Lime Lake is also found on the NYSDEC web page at http://www.dec.ny.gov/lands/77883.html. Lime Lake was sampled as part of the DEC Lake Classification and Inventory (LCI) survey in 1985. These data indicate that pH and conductivity were slightly lower, and phosphorus readings were slightly higher, than in the present CSLAP studies, although overall water quality conditions appear to be comparable. It is not known if local monitoring has been conducted as a fisheries management tool, or to evaluate swimming conditions in the lake.
Lake Association and Management History Lime Lake is served by the Lime Lake Cottage Owners Association. The lake association is involved in a number of lake management activities, including: • the use of barley straw to control harmful algal blooms • the establishment of a launch key policy to reduce boat congestion • sewer project activities • offering safe boating courses • educational activities through newsletters and lake association meetings

pg. 3
• nuisance weed control through the use of aquatic herbicides • water level control The lake association maintains a web site at http://www.llcoa.org/.
Summary of 2013 CSLAP Sampling Results
Evaluation of 2013 Annual and Monthly Results Relative to 20062012 The summer (mid-June through mid-September) average readings are compared to historical averages for all CSLAP sampling seasons in the “Lake Condition Summary” table, and are compared to individual historical CSLAP sampling seasons in the “Long Term Data Plots –Lime Lake” section in Appendix D.
Evaluation of Eutrophication Indicators Water clarity readings in Lime Lake were higher than normal in 2013, particularly in early summer. This was consistent with slightly lower than normal algae levels, although phosphorus readings were higher than normal in mid summer. None of these trophic indicators has exhibited any clear long-term trends. Although algal blooms have been common in recent years, and very intense in some of these years, the lake suffered few blooms in 2013. Lake productivity typically increases after mid summer, a seasonal pattern that was generally apparent in 2013, although water clarity readings were highly variable during the summer. The lake can be characterized as mesotrophic, based on water clarity, chlorophyll a, and total phosphorus readings (all typical of mesotrophic lakes)- this was also true in 2013. The trophic state indices (TSI) evaluation suggests that each of the trophic indicators is “internally consistent” and could be predicted from the values of the other indicators. This does not appear to be consistent with the blue green algae blooms common in previous years. Overall trophic conditions are summarized on the Lake Scorecard and Lake Condition Summary Table.
Evaluation of Potable Water Indicators Algae levels at times (or in some locations) may be high enough to render the lake susceptible to taste and odor compounds, algal toxins or elevated DBP (disinfection by product) compounds that could affect the potability of the water, although the lake is not classified for this use. Any “unofficial” potable water intakes could be compromised within algal blooms, or at times when lakewide algae levels are elevated. Potable water conditions, at least as measurable through CSLAP, are summarized in the Lake Scorecard and Lake Condition Summary Table.
Evaluation of Limnological Indicators pH readings were lower than normal in 2012 and 2013, and pH readings have decreased significantly over the last fifteen years. However, pH readings are still typical of alkaline lakes, and should still be within normal ranges for most organisms. Water color was higher than normal in 2013, and has increased significantly since first evaluated in the late 1990s. This phenomenon has also been observed in other CSLAP lakes, and may be due to higher color readings in samples submitted since 2002, corresponding to the change in laboratories. Each of the other limnological indicators (NOx, ammonia, total nitrogen, conductivity and calcium) were close to normal in 2013, and it is likely that the small changes in these indicators from year to

pg. 4
year represent normal variability. Overall limnological conditions are summarized in the Lake Scorecard and Lake Condition Summary Table.
Evaluation of Biological Condition Extensive aquatic plant surveys have not been conducted on Lime Lake through CSLAP. The limited data indicate the presence of Eurasian watermilfoil (Myriophyllum spicatum) and a variety of native plants. It is likely that a modified floristic quality index (FQI) for the lake would likely indicate “fair” quality of the aquatic plant community. Fisheries data indicate the presence of at least nine different fish species, including at least four coolwater species, and five warmwater species. The lake can likely best be classified as a coolwater fishery. Zooplankton and macroinvertebrate information has not been collected through CSLAP at Lime Lake. Zebra mussels have been confirmed in the lake, and harmful algal blooms (HABs) have often been reported in the lake. The fluoroprobe screening samples analyzed by SUNY ESF in 2012 and 2013 indicated that shoreline algae blooms are dominated by blue green algae, although bloom intensity and frequency was much lower in 2013 than in 2012. Open water blue green algae levels were also much lower in 2013. Biological conditions in the lake are summarized in the Lake Scorecard and Lake Condition Summary Table.
Evaluation of Lake Perception Recreational and water quality assessments were more favorable than normal in 2013, consistent with higher than normal water clarity and slightly lower than normal algae levels. Aquatic plant coverage has increased slightly in recent years, perhaps due to more extensive growth of Eurasian watermilfoil, although this was not apparent in 2013. Lake perception usually does not exhibit any clear seasonal patterns, and lake perception was even more stable than normal in 2013, despite strong seasonal increases in lake productivity. Overall lake perception is summarized on the Lake Scorecard and Lake Condition Summary Table.
Evaluation of Local Climate Change Water and air temperature readings were lower than normal during the summer index period in each of the last three years, part of an apparent long-term decrease in air and water temperatures. It is not yet known if these temperature changes represent local climate change.
Evaluation of Algal Toxins Algal toxin levels can vary significantly within blooms and from shoreline to lake, and the absence of toxins in a sample does not indicate safe swimming conditions. Open water phycocyanin readings were below the levels indicating susceptibility for harmful algal blooms (HABs), although the fluoroprobe screening samples from 2012 indicate very high blue green algae levels in shoreline blooms and some susceptibility to blooms in the open water. Lower blue green algae levels were apparent in both the open water and in shoreline blooms in 2013; it is not known why this occurred. Algal toxins data indicate levels well above the criteria established to protect swimming within blooms, and near these thresholds in open water, in most years. This is

pg. 5
consistent with historical information indicating a high susceptibility to HABs. However, lower algal toxin levels were also apparent in 2013, consistent with lower open water and shoreline blue green algae levels.
Lake Condition Summary Category Indicator Min 97‐13
Avg Max 2013
Avg Classification 2013 Change? Long‐term
Change? Eutrophication Indicators
Water Clarity 0.95 2.96 6.98 3.85 Mesotrophic Higher than Normal No Change
Chlorophyll a 0.27 5.39 25.50 3.20 Mesotrophic Within Normal Range No Change
Total Phosphorus 0.007 0.017 0.042 0.017 Mesotrophic Within Normal Range No Change
Potable Water Indicators
Hypolimnetic Ammonia 0.43 0.45 0.47 Close to Surface NH4 Readings
Higher than Normal Not known
Hypolimnetic Arsenic
Hypolimnetic Iron
Hypolimnetic Manganese
Limnological Indicators
Hypolimnetic Phosphorus 0.012 0.214 1.124 Elevated Deepwater TP Not known
Nitrate + Nitrite 0.01 0.54 1.72 0.35 High NOx Within Normal Range No Change
Ammonia 0.02 0.13 0.94 0.07 Intermediate Ammonia Within Normal Range No Change
Total Nitrogen 0.30 0.86 1.59 0.77 Intermediate Total Nitrogen Within Normal Range No Change
pH 7.10 7.80 8.34 7.43 Alkaline Lower Than Normal Decreasing Significantly
Specific Conductance 317 383 442 396 Hardwater Within Normal Range No Change
True Color 1 15 45 27 Intermediate Color Higher than Normal Increasing Significantly
Calcium 13.3 42.6 57.1 Highly Susceptible to Zebra Mussels
No Change
Lake Perception
WQ Assessment 1 2.4 5 1.9 Not Quite Crystal Clear More Favorable Than Normal
No Change
Aquatic Plant Coverage 1 2.1 4 2.0 Subsurface Plant Growth Within Normal Range Slightly Increasing
Recreational Assessment 1 2.0 4 1.6 Excellent More Favorable Than Normal
No Change
Biological Condition
Phytoplankton
Open water‐low blue green algae biomass; Shoreline‐high blue green algae in bloom
Not known Not known
Macrophytes Fair quality of the aquatic plant community
Not known Not known
Zooplankton Not measured through CSLAP Not known Not known
Macroinvertebrates Not measured through CSLAP Not known Not known
Fish Coolwater fishery Not known Not known
Invasive Species Zebra mussels, Eurasian watermilfoil
Not known Not known
Local Climate Change
Air Temperature 9 21.8 35 17.4 Lower Than Normal Decreasing Significantly
Water Temperature 14 22.8 27 21.7 Lower Than Normal Decreasing Significantly

pg. 6
Category Indicator Min 97‐13 Avg
Max 2013 Avg
Classification 2013 Change? Long‐term Change?
Harmful Algal Blooms
Open Water Phycocyanin 2 26 106 7 Most readings indicate low risk of BGA
Not known Not known
Open Water FP Chl.a 0 5 19 2 Few readings indicate high algae levels
Not known Not known
Open Water FP BG Chl.a 0 3 14 1 Few readings indicate high BGA levels
Not known Not known
Open Water Microcystis 0.4 2.9 15.3 0.3 At times measurable open water MC‐LR
Not known Not known
Open Water Anatoxin a <DL <DL <DL <DL Open water Anatoxin‐a consistently not detectable
Not known Not known
Shoreline Phycocyanin 63.9 63.9 63.9 Some readings indicate high risk of BGA
Not known Not known
Shoreline FP Chl.a 3 97 538 12 Most readings indicate high algae levels
Not known Not known
Shoreline FP BG Chl.a 1 92 523 10 Most readings indicate high BGA levels
Not known Not known
Shoreline Microcystis <DL 174.5 1709.8 3.5 Very high shoreline bloom MC‐LR
Not known Not known
Shoreline Anatoxin a <DL <DL <DL <DL Shoreline bloom Anatoxin‐a consistently not detectable
Not known Not known
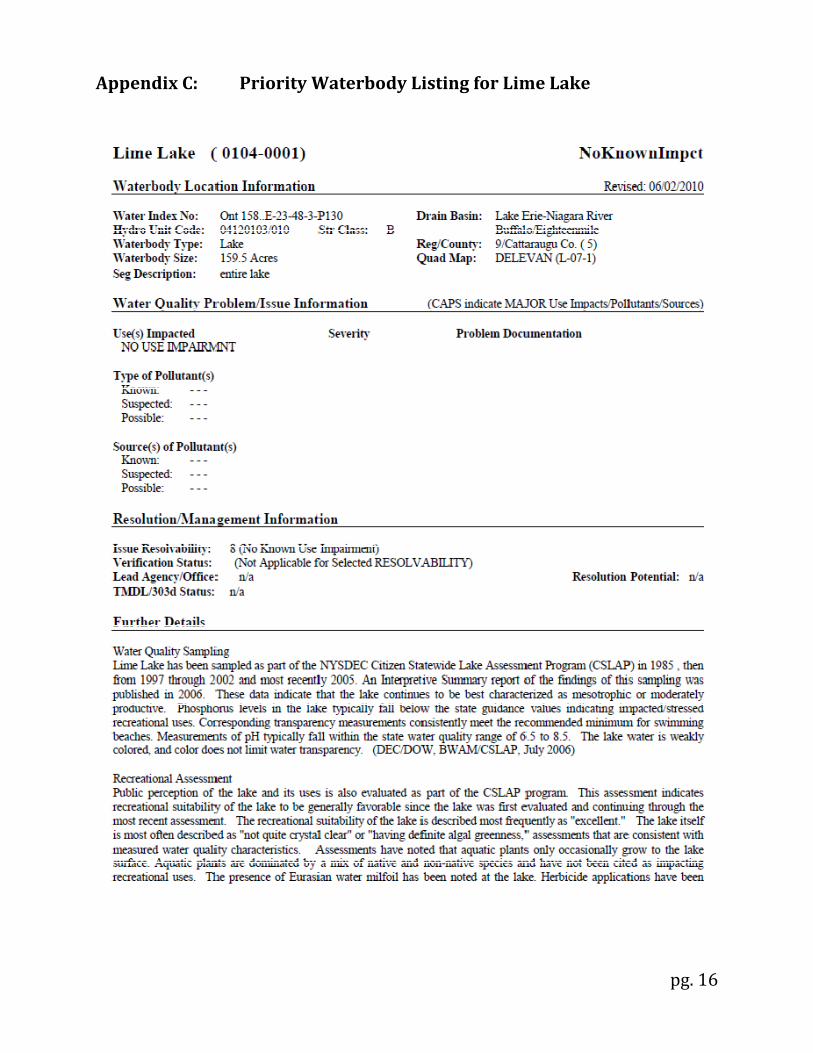
Evaluation of Lake Condition Impacts to Lake Uses Lime Lake is presently listed among the lakes listed on the Lake Erie-Niagara River drainage basin PWL (2010) as having no known impacts. The PWL listing for the lake can be found in Appendix C.
Potable Water (Drinking Water) The CSLAP dataset at Lime Lake, including water chemistry data, physical measurements, and volunteer samplers’ perception data, is inadequate to evaluate the use of the lake for potable water, and the lake is not classified for this use. The limited CSLAP data suggest that “unofficial” potable water use may be stressed at times by harmful algal blooms (HABs), particularly for nearshore intakes in areas susceptible to these blooms.
Contact Recreation (Swimming) The CSLAP dataset at Lime Lake, including water chemistry data, physical measurements, and volunteer samplers’ perception data, suggests that swimming and contact recreation may be impaired by algal toxins associated with harmful algal blooms, particularly near the shoreline. Stressed recreational conditions were more apparent in 2013, consistent with lower blue green algae levels and lower toxin levels. Bacterial data would need to be collected to evaluate the safety of the water for swimming.
NonContact Recreation (Boating and Fishing) The CSLAP dataset on Lime Lake, including water chemistry data, physical measurements, and volunteer samplers’ perception data, suggest that non-contact recreation may be threatened by excessive weeds, particularly Eurasian watermilfoil, although these impacts are not apparent every year (perhaps due to the active management of the plant beds), and were not apparent in 2012 or 2013.
Aquatic Life The CSLAP dataset on Lime Lake, including water chemistry data, physical measurements, and volunteer samplers’ perception data, suggest that aquatic life may be stressed by the presence of zebra mussels, and threatened by invasive plants, toxic algae blooms, and occasionally depressed

pg. 7
deepwater oxygen levels, although additional data are needed to evaluate the food and habitat conditions for aquatic organisms in the lake.
Aesthetics The CSLAP dataset on Lime Lake, including water chemistry data, physical measurements, and volunteer samplers’ perception data, suggest that aesthetics may be stressed by shoreline blue green algae blooms, although similar impacts were not apparent in 2013.
Fish Consumption There are no fish consumption advisories posted for Lime Lake.
Additional Comments and Recommendations The lake association should continue to monitor for the presence and persistence of harmful algal blooms (HABs), and report the extent and duration of these blooms throughout the lake. Lake residents and pets should continue to avoid direct exposure to surface scums or heavily discolored water.
Aquatic Plant IDs2013 None submitted for identification in 2013.

pg. 8
Time Series: Trophic Indicators, 2013
Time Series: Trophic Indicators, Typical Year (19972013)
0
1
2
3
4
5
60
5
10
15
20
25
5/11/2013 6/15/2013 7/20/2013 8/24/2013 9/28/2013 11/2/2013
Zsd,
m
TP a
nd C
hl.a
, µg/
l
TotalP
Chl.a
Zsd
0
1
2
3
4
50
5
10
15
20
25Zs
d (m
)
TP a
nd C
hl.a
(µg/
l)
TP
Chl.a
Zsd
May June July Aug Sept

pg. 9
Time Series: Lake Perception Indicators, 2013
Time Series: Lake Perception Indicators, Typical Year (19972013)
1
2
3
4
5
5/31/2013 6/25/2013 7/20/2013 8/14/2013 9/8/2013 10/3/2013 10/28/2013
Perc
eptio
n Clarity
Weeds
Recreation
Most Favorable
Least Favorable
1
2
3
4
5
Clarity
Weeds
Recreation
May June July Aug SeptMost
Favorable
Least Favorable
Perc
eptio
n

pg. 10
Appendix A CSLAP Water Quality Sampling Results for Lime Lake
LNum PName Date Zbot Zsd Zsamp Tot.P NO3 NH4 TDN TN/TP TColor pH Cond25 Ca Chl.a134 Lime L 5/18/1997 9.3 2.05 1.5 0.011 1.72 5 8.07 397 1.16134 Lime L 5/31/1997 8.5 1.83 1.5 0.017 1.59 5 7.91 324 5.69134 Lime L 6/14/1997 8.8 4.85 1.5 0.010 1.47 5 8.21 386 1.79134 Lime L 6/28/1997 10.4 3.75 1.5 0.012 1.15 5 8.17 391 6.25134 Lime L 7/11/1997 9.9 1.60 1.5 0.015 0.91 5 8.05 395 14.00134 Lime L 7/26/1997 10.5 2.73 1.5 0.019 0.84 5 8.10 400 5.73134 Lime L 8/10/1997 10.6 1.86 1.5 0.014 0.71 3 8.02 404 6.41134 Lime L 8/25/1997 10.0 1.30 1.5 0.015 0.60 6 8.22 405 14.60134 Lime L 6/9/1998 10.2 2.99 1.5 0.010 1.31 2 8.34 357 0.51134 Lime L 6/20/1998 10.3 4.30 1.5 1.11 2 8.28 333 2.80134 Lime L 7/3/1998 10.4 3.73 1.5 0.84 2 8.04 341 2.36134 Lime L 7/20/1998 10.2 2.13 1.5 0.62 1 7.81 362 6.12134 Lime L 8/31/1998 9.1 2.88 1.5 0.011 1 8.10 366 3.01134 Lime L 9/13/1998 9.9 2.70 1.5 0.016 1 8.17 361 5.56134 Lime L 6/22/1999 9.8 4.58 1.5 0.012 0.48 3 8.09 345 3.30134 Lime L 7/13/1999 10.7 3.85 1.5 0.007 0.28 15 8.17 359 13.00134 Lime L 6/10/2001 10.6 3.90 1.5 0.010 1.10 5 8.22 429 1.02134 Lime L 7/10/2001 9.7 1.95 1.5 0.013 0.59 4 8.11 420 4.81134 Lime L 7/29/2001 10.0 2.70 1.5 0.021 0.32 3 7.98 427 1.99134 Lime L 8/19/2001 11.0 2.10 1.5 0.015 0.26 2 8.09 434 4.24136 Lime L 9/3/2001 10.1 2.05 1.5 0.023 0.20 3 7.37 417 0.27134 Lime L 9/16/2001 9.5 2.13 1.5 0.013 0.11 7 7.66 420 0.57134 Lime L 8/1/2002 10.1 1.95 1.5 0.013 0.47 0.05 0.98 77.23 12 8.24 413 13.3 7.86134 Lime L 8/18/2002 10.0 1.80 1.5 0.016 0.48 0.07 1.04 66.37 4 8.14 414 7.18134 Lime L 8/25/2002 10.8 2.00 1.5 0.014 0.84 62.43 9 8.08 407 7.33134 Lime L 6/27/2005 10.2 3.35 1.5 0.012 0.03 0.94 1.10 95.34 1 7.88 403 56.1 4.43134 Lime L 7/11/2005 9.9 2.00 1.5 0.012 0.03 0.55 0.88 74.78 23 7.80 442 5.42134 Lime L 8/2/2005 9.2 1.55 1.5 0.011 0.14 0.27 0.38 35.17 31 7.60 387 8.16134 Lime L 8/16/2005 10.9 2.50 1.5 0.015 0.13 0.08 0.49 33.46 6 7.90 339 13.62134 Lime L 9/5/2005 11.1 2.65 1.5 0.024 0.03 0.11 0.30 12.48 7.81 369 49.1 134 Lime L 9/25/2005 11.0 1.90 1.5 0.021 0.04 0.07 0.32 15.06 8 10.84134 Lime L 6/18/2011 10.7 3.75 1.5 0.011 1.17 0.07 1.41 274.51 43 7.11 419 57.1 0.90134 Lime L 7/4/2011 5.00 1.5 0.018 0.94 0.07 1.59 198.25 32 7.29 390 1.00134 Lime L 7/16/2011 10.7 5.40 1.5 0.012 0.90 0.05 1.20 220.00 35 7.29 382 0.40134 Lime L 7/30/2011 10.7 4.93 1.5 0.012 0.68 0.05 1.20 213.26 45 7.47 344 3.10134 Lime L 7/30/2011 grab bloom 134 Lime L 8/13/2011 10.7 2.71 1.5 0.015 0.50 0.06 1.05 154.59 30 8.11 317 37.8 4.10134 Lime L 8/27/2011 10.7 1.60 1.5 0.018 0.23 0.03 1.00 121.86 19 7.60 347 7.50134 Lime L 8/27/2011 grab bloom 134 Lime L 9/11/2011 grab bloom 134 Lime L 9/11/2011 10.7 2.43 1.5 0.015 0.17 0.07 0.69 100.45 23 7.70 343 5.10134 Lime L 6/10/2012 9.1 6.98 1.5 0.013 0.80 0.02 1.15 195.27 33 7.27 393 44.9 2.90134 Lime L 6/23/2012 10.7 5.33 1.5 0.014 0.50 0.19 0.83 131.06 28 7.50 348 3.20134 Lime L 7/7/2012 4.05 1.5 0.028 0.18 0.08 0.83 64.90 37 7.68 356 0.90134 Lime L 7/7/2012 Bloom 134 Lime L Bloom 134 Lime L 7/21/2012 10.7 0.95 0.041 0.03 0.06 0.93 49.86 19 7.42 368 25.50134 Lime L 7/21/2012 Bloom 134 Lime L 8/4/2012 10.7 0.95 1.5 0.034 0.01 0.03 0.84 54.77 9 8.07 382 39.8 2.70134 Lime L 8/5/2012 Bloom 134 Lime L 8/19/2012 10.7 1.35 1.5 0.042 0.07 0.11 0.85 44.69 8 7.72 370 16.00134 Lime L 8/19/2012 Bloom 134 Lime L 9/2/2012 9.1 1.48 1.5 0.028 0.01 0.10 0.58 45.40 13 7.10 377 7.50134 Lime L 9/2/2012 Bloom 134 Lime L 9/16/2012 9.1 1.15 1.5 0.025 0.03 0.17 0.68 58.96 7 370 6.90134 Lime L 6/9/2013 4.85 1.5 0.014 0.59 0.07 0.88 136.34 24 7.20 408 1.50134 Lime L 6/23/2013 5.65 1.5 0.016 1.17 156.68 37 7.63 341 2.60134 Lime L 7/7/2013 2.78 1.5 0.48 0.10 0.81 32.34 22 7.26 417 2.80134 Lime L 7/20/2013 3.25 1.5 0.017 0.65 86.08 23 7.30 394 2.70134 Lime L 8/2/2013 3.05 1.5 0.21 0.03 0.68 17.18 30 7.39 400 3.20134 Lime L 8/17/2013 5.45 1.5 0.022 0.71 72.45 26 7.34 399 4.40134 Lime L 8/29/2013 Bloom 134 Lime L 8/29/2013 bloom

pg. 11
LNum PName Date Zbot Zsd Zsamp Tot.P NO3 NH4 TDN TN/TP TColor pH Cond25 Ca Chl.a134 Lime L 9/2/2013 1.95 1.5 0.018 0.12 0.06 0.51 63.60 29 7.87 412 5.20134 Lime L 9/5/2013 Bloom 134 Lime L 9/5/2013 bloom 134 Lime L 9/28/2013 2.70 1.5 0.020 0.61 66.88 35 7.38 394 3.80134 Lime L 6/9/1998 7.5 0.013 134 Lime L 7/3/1998 9.0 0.157 134 Lime L 8/31/1998 0.310 134 Lime L 7/13/1999 10.7 9.9 0.037 134 Lime L 8/1/2002 10.1 8.0 0.012 0.13 0.46 0.89 77.64 134 Lime L 8/18/2002 10.0 8.0 0.022 0.14 0.47 134 Lime L 8/25/2002 10.8 8.0 0.020 0.43 0.78 39.28 134 Lime L 6/27/2005 0.012 134 Lime L 7/11/2005 0.039 134 Lime L 8/2/2005 0.027 134 Lime L 8/16/2005 1.124 134 Lime L 9/5/2005 0.201 134 Lime L 9/25/2005 0.815
LNum PName Date Site TAir TH20 QA QB QC QD QFQGAQ-PC
AQ-Chla
MC-LR Ana-a Cyl
FP-Chl
FP- BG
HAB form
Shore HAB
134 Lime L 5/18/1997 epi 20 14 2 1 3 5 134 Lime L 5/31/1997 epi 19 16 3 2 4 5 134 Lime L 6/14/1997 epi 21 22 3 2 2 1 134 Lime L 6/28/1997 epi 32 25 3 1 2 134 Lime L 7/11/1997 epi 26 24 5 1 3 3 134 Lime L 7/26/1997 epi 23 24 2 1 1 134 Lime L 8/10/1997 epi 28 25 3 1 1 134 Lime L 8/25/1997 epi 25 21 3 1 2 134 Lime L 6/9/1998 epi 35 27 2 3 2 5 134 Lime L 6/20/1998 epi 25 24 2 2 1 6 134 Lime L 7/3/1998 epi 22 25 2 1 2 134 Lime L 7/20/1998 epi 28 27 3 1 2 134 Lime L 8/31/1998 epi 22 25 1 2 1 134 Lime L 9/13/1998 epi 28 23 2 1 2 6 134 Lime L 6/22/1999 epi 30 25 2 3 1 134 Lime L 7/13/1999 epi 23 24 3 1 2 134 Lime L 6/10/2001 epi 22 19 3 2 2 6 134 Lime L 7/10/2001 epi 31 24 2 2 2 0 134 Lime L 7/29/2001 epi 21 25 3 2 1 134 Lime L 8/19/2001 epi 24 25 2 1 2 136 Lime L 9/3/2001 epi 22 22 3 1 2 134 Lime L 9/16/2001 epi 19 22 2 1 3 6 134 Lime L 8/1/2002 epi 24 25 3 3 2 1 134 Lime L 8/18/2002 epi 27 25 3 3 2 7 134 Lime L 8/25/2002 epi 20 22 3 1 2 7 134 Lime L 6/27/2005 epi 22 24 2 3 3 2 134 Lime L 7/11/2005 epi 32 25 2 2 2 27 134 Lime L 8/2/2005 epi 23 25 3 3 2 12 134 Lime L 8/16/2005 epi 32 24 3 3 2 27 134 Lime L 9/5/2005 epi 19 21 2 2 1 7 134 Lime L 9/25/2005 epi 30 27 3 2 2 3 134 Lime L 6/18/2011 epi 15 20 1 2 1 0 5 10.60 1.40 134 Lime L 7/4/2011 epi 21 22 1 2 1 0 0 0 8.90 1.50 134 Lime L 7/16/2011 epi 18 24 2 2 2 2 4 4 7.50 0.90 134 Lime L 7/30/2011 epi 22 25 2 1 1 0 0 0 18.50 1.90 134 Lime L 7/30/2011 bloom 20.37 134 Lime L 8/13/2011 epi 15 24 3 3 3 2 0 0 30.40 2.50 8.31 134 Lime L 8/26/2011 epi 6.16 134 Lime L 8/26/2011 bloom 124.95 134 Lime L 8/27/2011 epi 16 21 3 3 3 23 4 4 55.10 6.90 134 Lime L 8/27/2011 epi 134 Lime L 9/9/2011 epi 15.28 134 Lime L 9/9/2011 bloom 344.77

pg. 12
LNum PName Date Site TAir TH20 QA QB QC QD QFQGAQ-PC
AQ-Chla
MC-LR Ana-a Cyl
FP-Chl
FP- BG
HAB form
Shore HAB
134 Lime L 9/9/2011 bloom 1710 134 Lime L 9/11/2011 epi 109.76 134 Lime L 9/11/2011 epi 15 19 2 4 2 2 0 0 53.70 3.60 134 Lime L 6/10/2012 epi 25 20 1 3 3 5 5.00 0.20 0.49 <0.417 0.77 0.56 134 Lime L 6/23/2012 epi 15 24 2 4 3 25 5 9.80 0.40 1.55 <0.410 3.16 2.93 F 134 Lime L 7/7/2012 epi 22 25 3 3 3 1 4 4 47.00 1.40 6.79 <0.392 11.07 6.86 FG 134 Lime L 7/7/2012 188.97<0.820 328.00324.00 134 Lime L 403.45<0.846 538.00523.00 134 Lime L 7/21/2012 17 22 3 3 3 15 4 4 105.50 2.00 5.57 <0.292 18.62 13.59 F 134 Lime L 7/21/2012 15.28 <0.657 21.20 15.20 134 Lime L 8/4/2012 epi 20 25 3 2 3 13 0 0 54.00 2.10 3.19 <0.330 14.90 7.07 I 134 Lime L 8/5/2012 8.09 <1.318 15.96 10.63 134 Lime L 8/19/2012 epi 12 21 3 3 3 13 0 0 90.70 2.30 1.73 <0.223 2.59 1.69 CF 134 Lime L 8/19/2012 2.76 <1.314 6.49 1.75 ABEF 134 Lime L 9/2/2012 epi 16 21 2 3 2 1 4 4 22.60 1.40 1.41 <0.725 7.13 3.11 C 134 Lime L 9/2/2012 8.96 <1.038 15.59 7.97 134 Lime L 9/16/2012 epi 9 18 2 3 3 58 47 18.60 1.30 1.86 <6.409 5.73 2.60 FI 134 Lime L 6/9/2013 epi 11 17 2 2 2 0 0 0 2.10 0.70 <0.30 <0.420 0.30 0.00 134 Lime L 6/23/2013 epi 21 22 2 2 2 0 0 0 2.20 1.30 <0.30 <0.370 1.00 0.20 I 134 Lime L 7/7/2013 epi 21 24 2 2 1 0 0 0 3.60 1.70 <0.30 <0.510 2.30 0.40 I I 134 Lime L 7/20/2013 epi 19 25 2 2 2 5 0 0 9.60 2.20 <0.30 <0.910 2.50 0.00 I I 134 Lime L 8/2/2013 epi 16 21 2 2 1 0 0 0 9.60 0.90 <0.30 <0.650 1.70 0.40 I I 134 Lime L 8/17/2013 epi 14 21 1 2 1 0 0 0 11.00 1.80 0.41 <0.390 2.20 0.30 I I 134 Lime L 8/29/2013 Bloom <0.60 <1.000 5.00 3.70 d 134 Lime L 8/29/2013 bloom 12.97 <1.000 33.50 31.20 d 134 Lime L 9/2/2013 epi 20 22 2 2 2 0 0 0 14.20 2.00 0.99 <1.100 4.40 2.20 I B 134 Lime L 9/5/2013 bloom <0.60 <1.000 3.20 1.10 d 134 Lime L 9/5/2013 Bloom <0.60 <1.000 4.60 2.40 d 134 Lime L 9/28/2013 epi 20 17 1 2 1 0 0 0 134 Lime L 6/9/1998 hypo 18 1 2 1 0 5 10.60 1.40 134 Lime L 8/31/1998 hypo 13 1 2 1 0 0 0 8.90 1.50 134 Lime L 8/1/2002 hypo 24 10 2 2 2 2 4 4 7.50 0.90 134 Lime L 8/18/2002 hypo 27 11 2 1 1 0 0 0 18.50 1.90 134 Lime L 8/25/2002 hypo 20 14 20.37
pg. 13
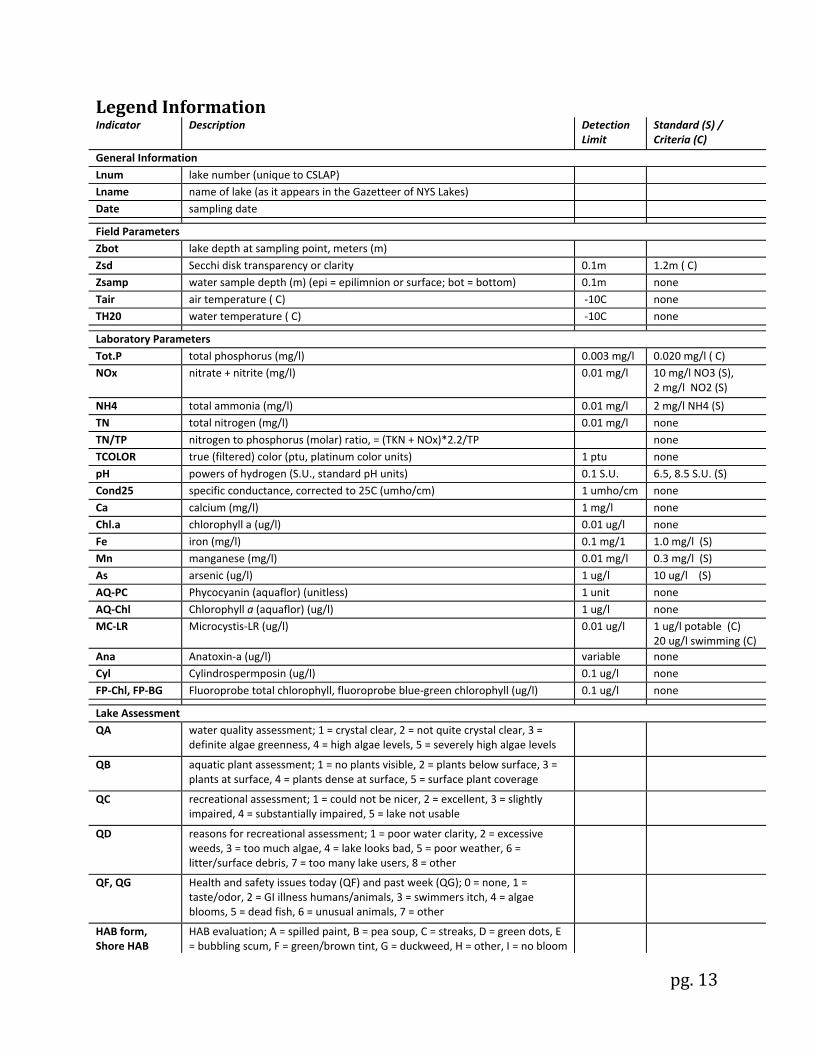
Legend Information Indicator Description Detection
Limit Standard (S) / Criteria (C)
General Information Lnum lake number (unique to CSLAP) Lname name of lake (as it appears in the Gazetteer of NYS Lakes) Date sampling date
Field Parameters Zbot lake depth at sampling point, meters (m) Zsd Secchi disk transparency or clarity 0.1m 1.2m ( C) Zsamp water sample depth (m) (epi = epilimnion or surface; bot = bottom) 0.1m none Tair air temperature ( C) ‐10C none TH20 water temperature ( C) ‐10C none
Laboratory Parameters Tot.P total phosphorus (mg/l) 0.003 mg/l 0.020 mg/l ( C) NOx nitrate + nitrite (mg/l) 0.01 mg/l 10 mg/l NO3 (S),
2 mg/l NO2 (S)
NH4 total ammonia (mg/l) 0.01 mg/l 2 mg/l NH4 (S) TN total nitrogen (mg/l) 0.01 mg/l none TN/TP nitrogen to phosphorus (molar) ratio, = (TKN + NOx)*2.2/TP none TCOLOR true (filtered) color (ptu, platinum color units) 1 ptu none pH powers of hydrogen (S.U., standard pH units) 0.1 S.U. 6.5, 8.5 S.U. (S) Cond25 specific conductance, corrected to 25C (umho/cm) 1 umho/cm none Ca calcium (mg/l) 1 mg/l none Chl.a chlorophyll a (ug/l) 0.01 ug/l none Fe iron (mg/l) 0.1 mg/1 1.0 mg/l (S) Mn manganese (mg/l) 0.01 mg/l 0.3 mg/l (S) As arsenic (ug/l) 1 ug/l 10 ug/l (S) AQ‐PC Phycocyanin (aquaflor) (unitless) 1 unit none AQ‐Chl Chlorophyll a (aquaflor) (ug/l) 1 ug/l none MC‐LR Microcystis‐LR (ug/l) 0.01 ug/l 1 ug/l potable (C)
20 ug/l swimming (C) Ana Anatoxin‐a (ug/l) variable none Cyl Cylindrospermposin (ug/l) 0.1 ug/l none FP‐Chl, FP‐BG Fluoroprobe total chlorophyll, fluoroprobe blue‐green chlorophyll (ug/l) 0.1 ug/l none
Lake Assessment QA water quality assessment; 1 = crystal clear, 2 = not quite crystal clear, 3 =
definite algae greenness, 4 = high algae levels, 5 = severely high algae levels
QB aquatic plant assessment; 1 = no plants visible, 2 = plants below surface, 3 = plants at surface, 4 = plants dense at surface, 5 = surface plant coverage
QC recreational assessment; 1 = could not be nicer, 2 = excellent, 3 = slightly impaired, 4 = substantially impaired, 5 = lake not usable
QD reasons for recreational assessment; 1 = poor water clarity, 2 = excessive weeds, 3 = too much algae, 4 = lake looks bad, 5 = poor weather, 6 = litter/surface debris, 7 = too many lake users, 8 = other
QF, QG Health and safety issues today (QF) and past week (QG); 0 = none, 1 = taste/odor, 2 = GI illness humans/animals, 3 = swimmers itch, 4 = algae blooms, 5 = dead fish, 6 = unusual animals, 7 = other
HAB form, Shore HAB
HAB evaluation; A = spilled paint, B = pea soup, C = streaks, D = green dots, E = bubbling scum, F = green/brown tint, G = duckweed, H = other, I = no bloom

pg. 14
Appendix B Monthly Evaluation of Lime Lake Data, 20062013
June Data 2006 2007 2008 2009 2010 2011 2012 2013 Zsd NORMAL HIGH HIGH TP LOW NORMAL NORMAL Chl.a NORMAL NORMAL NORMAL NOx HIGH NORMAL NORMAL NH4 NORMAL NORMAL NORMAL TN HIGH NORMAL NORMAL pH LOW NORMAL NORMAL SpCond NORMAL NORMAL NORMAL Color HIGH NORMAL NORMAL Ca HIGH NORMAL QA LOW LOW NORMAL QB NORMAL HIGH NORMAL QC NORMAL NORMAL NORMAL TH20 LOW NORMAL LOW High = average monthly reading > 90th percentile reading for lake, 2000-2010 Low = average monthly reading < 10th percentile reading for lake, 2000-2010 Normal = average monthly reading between 10th and 90th percentile reading for lake, 2000-2010
July Data 2006 2007 2008 2009 2010 2011 2012 2013 Zsd HIGH NORMAL NORMAL TP NORMAL HIGH HIGH Chl.a NORMAL HIGH NORMAL NOx NORMAL NORMAL NORMAL NH4 NORMAL NORMAL NORMAL TN HIGH NORMAL NORMAL pH NORMAL NORMAL LOW SpCond NORMAL NORMAL NORMAL Color HIGH NORMAL NORMAL Ca QA LOW NORMAL NORMAL QB NORMAL NORMAL NORMAL QC NORMAL NORMAL NORMAL TH20 NORMAL NORMAL NORMAL High = average monthly reading > 90th percentile reading for lake, 2000-2010 Low = average monthly reading < 10th percentile reading for lake, 2000-2010 Normal = average monthly reading between 10th and 90th percentile reading for lake, 2000-2010

pg. 15
August Data 2006 2007 2008 2009 2010 2011 2012 2013 Zsd NORMAL LOW NORMAL TP NORMAL HIGH HIGH Chl.a NORMAL HIGH NORMAL NOx NORMAL NORMAL NORMAL NH4 LOW NORMAL LOW TN NORMAL NORMAL NORMAL pH NORMAL NORMAL NORMAL SpCond LOW NORMAL NORMAL Color NORMAL NORMAL NORMAL Ca NORMAL NORMAL QA NORMAL NORMAL LOW QB NORMAL NORMAL NORMAL QC NORMAL NORMAL NORMAL TH20 NORMAL LOW NORMAL High = average monthly reading > 90th percentile reading for lake, 2000-2010 Low = average monthly reading < 10th percentile reading for lake, 2000-2010 Normal = average monthly reading between 10th and 90th percentile reading for lake, 2000-2010
September Data 2006 2007 2008 2009 2010 2011 2012 2013 Zsd NORMAL LOW NORMAL TP NORMAL HIGH NORMAL Chl.a NORMAL NORMAL NORMAL NOx NORMAL LOW NORMAL NH4 NORMAL NORMAL NORMAL TN NORMAL NORMAL NORMAL pH NORMAL LOW NORMAL SpCond NORMAL NORMAL NORMAL Color NORMAL NORMAL NORMAL Ca QA NORMAL LOW QB HIGH NORMAL QC NORMAL NORMAL TH20 LOW LOW High = average monthly reading > 90th percentile reading for lake, 2000-2010 Low = average monthly reading < 10th percentile reading for lake, 2000-2010 Normal = average monthly reading between 10th and 90th percentile reading for lake, 2000-2010
pg. 16
Appendix C: Priority Waterbody Listing for Lime Lake
pg. 17
pg. 18
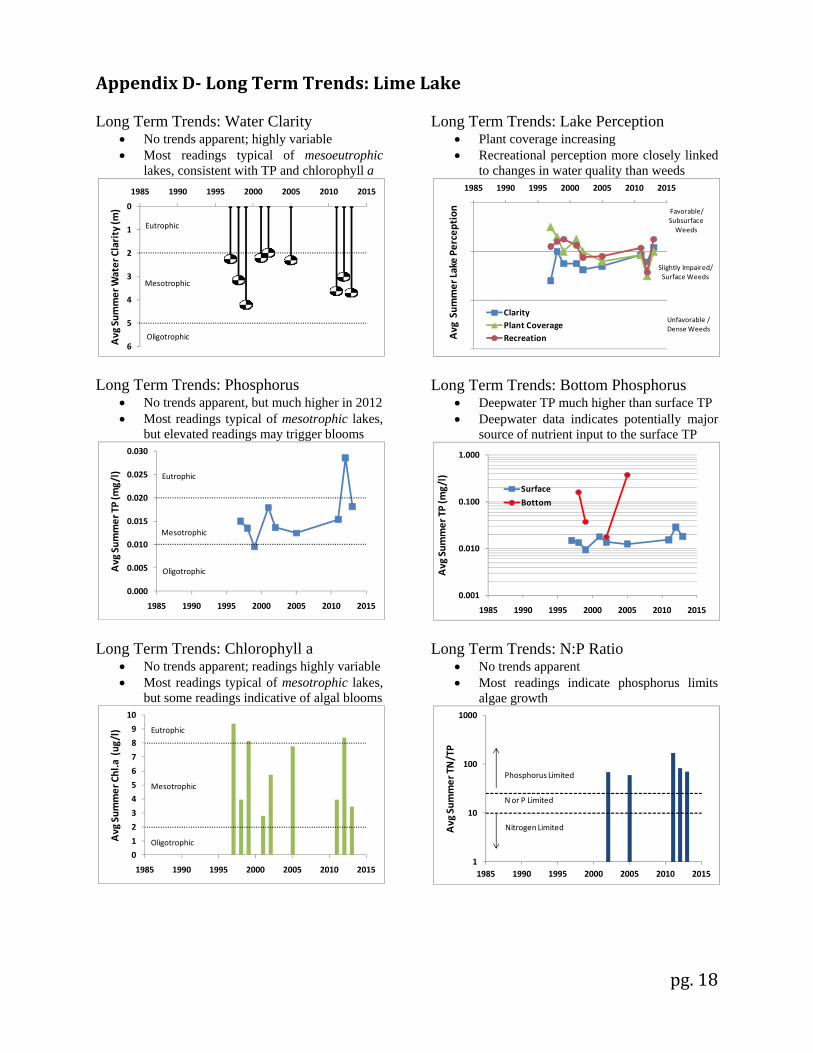
Appendix D Long Term Trends: Lime Lake Long Term Trends: Water Clarity
• No trends apparent; highly variable • Most readings typical of mesoeutrophic
lakes, consistent with TP and chlorophyll a
Long Term Trends: Phosphorus • No trends apparent, but much higher in 2012 • Most readings typical of mesotrophic lakes,
but elevated readings may trigger blooms
Long Term Trends: Chlorophyll a
• No trends apparent; readings highly variable • Most readings typical of mesotrophic lakes,
but some readings indicative of algal blooms
Long Term Trends: Lake Perception
• Plant coverage increasing • Recreational perception more closely linked
to changes in water quality than weeds
Long Term Trends: Bottom Phosphorus • Deepwater TP much higher than surface TP • Deepwater data indicates potentially major
source of nutrient input to the surface TP
Long Term Trends: N:P Ratio
• No trends apparent • Most readings indicate phosphorus limits
algae growth
0
1
2
3
4
5
6
1985 1990 1995 2000 2005 2010 2015
Avg Sum
mer Water Clarity (m
)
Eutrophic
Oligotrophic
Mesotrophic
0.000
0.005
0.010
0.015
0.020
0.025
0.030
1985 1990 1995 2000 2005 2010 2015
Avg Sum
mer TP (m
g/l) Eutrophic
Mesotrophic
Oligotrophic
0
1
2
3
4
5
6
7
8
9
10
1985 1990 1995 2000 2005 2010 2015
Avg Sum
mer Chl.a (ug
/l) Eutrophic
Mesotrophic
Oligotrophic
1985 1990 1995 2000 2005 2010 2015
Avg Sum
mer Lake Pe
rcep
tion
ClarityPlant CoverageRecreation
Favorable/SubsurfaceWeeds
Unfavorable / DenseWeeds
Slightly Impaired/ Surface Weeds
0.001
0.010
0.100
1.000
1985 1990 1995 2000 2005 2010 2015
Avg Sum
mer TP (m
g/l)
Surface
Bottom
1
10
100
1000
1985 1990 1995 2000 2005 2010 2015
Avg Sum
mer TN/TP
Phosphorus Limited
Nitrogen Limited
N or P Limited

pg. 19
Long Term Trends: Nitrogen • No trends apparent • Occasionally elevated NOx appears to be
geographically (naturally) driven
Long Term Trends: pH • Decreasing significantly • Most readings typical of slightly alkaline to
circumneutral lakes
Long Term Trends: Conductivity
• Conductivity decreasing slightly • Most readings typical of hardwater lakes
Long Term Trends: Color • Higher readings since 2002 part of a
statistically significant increase • Readings typical of weakly colored lakes
Long Term Trends: Calcium
• No trends apparent • Data confirming high susceptibility to zebra
mussels, which are found in lake
Long Term Trends: Water Temperature
• Surface readings decreasing slightly • Bottom temperatures well below surface
readings, indicating strong thermal layer
0.01
0.10
1.00
10.00
1985 1990 1995 2000 2005 2010 2015
Avg Sum
mer Nitrogen (m
g/l)
NOx NH4
TN
5
6
7
8
9
1985 1990 1995 2000 2005 2010 2015
Avg Sum
mer pH
Highly Alkaline (Above NYS WQ standard)
Circumneutral (Acceptable)
Acidic (Below NYS WQ standard)
Slightly Alkaline (Acceptable)
0
50
100
150
200
250
300
350
400
450
1985 1990 1995 2000 2005 2010 2015
Avg Sum
mer Con
d (umho
/cm)
Hardwater
Softwater
0
5
10
15
20
25
30
35
40
45
50
1985 1990 1995 2000 2005 2010 2015
Avg Sum
mer Color (ptu)
Colored
Weakly Colored
Uncolored
0
10
20
30
40
50
60
1985 1990 1995 2000 2005 2010 2015
Avg Sum
mer Calcium
(mg/l)
Highly Susceptible to Zebra Mussels
Not Susceptible to Zebra Mussels
May Be Susceptible to Zebra Mussels
0
5
10
15
20
25
30
1985 1990 1995 2000 2005 2010 2015
Avg Sum
mer Water Te
mp (C)
Surface
Bottom