
DEPOCEN WPS frontpage Default - Depocen Working Paper Series
Centre for the Study of African EconomiesDepartment of Economics . University of Oxford . Manor Road Building . Oxford OX1 3UQT: +44 (0)1865 271084 . F: +44 (0)1865 281447 . E: [email protected] . W: www.csae.ox.ac.uk
ECOLOGY, TRADE AND STATES IN PRE-COLONIAL AFRICA
JAMES FENSKE†
ABSTRACT. State capacity matters for growth. I test Bates’ explanation of pre-colonialAfrican states. He argues that trade across ecological boundaries promoted states. I findthat African societies in ecologically diverse environments had more centralized states.This is robust to reverse causation, omitted heterogeneity, and alternative interpretationsof the link between diversity and states. Ecological diversity also predicts states outsideof Africa. I test mechanisms connecting trade to states, and find that trade supportedclass stratification between rulers and ruled. I underscore the importance of ethnic insti-tutions and inform our knowledge of the effects of geography and trade on institutions.
1. INTRODUCTION
States that can collect taxes, protect property, and sustain markets matter for devel-opment. State capacity positively predicts economic growth (Rauch and Evans, 2000).Many variables that explain cross-country income differences require a state strongenough to provide them. These include social infrastructure (Hall and Jones, 1999), in-stitutional quality (Acemoglu et al., 2001), and investor protection (La Porta et al., 2000).Weak states under-invest in public goods (Acemoglu, 2005). It is not only modern statesthat matter; state antiquity predicts economic growth, political stability, and institu-tional quality in the present day (Bockstette et al., 2002). The determinants of state ca-pacity, then, are important components of modern growth.
In this paper, I test a “Ricardian” theory of states in sub-Saharan Africa originally pre-sented by Bates (1983). Building on earlier views,1 he argues that long-distance tradegave rise to states in Africa. His model is verbal:
[T]he contribution of the state is to provide order and peace and therebyto render production and exchange possible for members of society. Theorigins of the state, then, lie in the welfare gains that can be reaped throughthe promotion of markets.
†DEPARTMENT OF ECONOMICS, UNIVERSITY OF OXFORD
E-mail address: [email protected]: August 30, 2012.I am grateful to Achyuta Adhvaryu, Robert Bates, William Beinart, Prashant Bharadwaj, Rahul Deb, NicolaGennaioli, Timothy Guinnane, Namrata Kala, Elias Papaioannou, Aloysius Siow, Christopher Udry andKelly Zhang for their comments. Many thanks to Stelios Michalopoulos and Nathan Sussman for gen-erously sharing data with me. I am also thankful for feedback received in seminars at the University ofOxford, Hebrew University, Tel Aviv University, the Pacific Conference for Development Economics, theUniversity of Michigan, the Economic History Society Annual Meeting, and Universitat Pompeu Fabra.1See Bisson (1982), Oliver and Fage (1962), and Vansina (1966), for example.
1
CSAE Working Paper WPS/2012-18

2 JAMES FENSKE
He suggests that gains from trade are greatest where products from one ecological zonecan be traded for products from another. It is near ecological boundaries, then, thatwe should expect to see states. To support his view, he takes 34 pre-colonial Africansocieties, and shows that the proportion of societies with central monarchs is greater onan ecological boundary.2
Bates’ view has been overlooked because his small sample and lack of controls pre-vent him from making a credible econometric argument that this correlation is causal.In this paper, I use ethnographic and geographic data to overcome this limitation. Imerge data on state centralization for 440 ethnic groups in pre-colonial sub-SaharanAfrica with a map of African ecological zones. I use ethnic-level ecological diversity toproxy for the gains from trade. I show that ecological diversity is strongly related to thepresence of pre-colonial states. For example, within the societies classified as “Equato-rial Bantu,” the Luba score .69 on the diversity index and 3 out of 4 on the centralizationindex. The Kela and Ndonko, by contrast, have no diversity and no centralization. Onthe “Guinea Coast,” the Yoruba score 3 on centralization and .58 on diversity, while theYako score zero on both.
I show that this result is robust. I use spatial variation in rainfall to control for pos-sible reverse causation. The result survives additional controls, checks for unobservedheterogeneity, alternative estimation strategies, removing influential observations, andalternative measures of trade and states. I show that the “Ricardian” view better explainsthe relationship between states and diverse ecology than six alternative interpretations.These are: first, larger territories are more diverse and require more levels of administra-tion; second, societies that independently develop states conquer trading regions; third,dense population in diverse regions explains statehood; fourth, defense of “islands” ofland quality accounts for states; fifth, the diversity of available economic activities cre-ates states, and; sixth, competition between ethnic groups in more diverse areas leads tostate formation. I rule out these alternative explanations by controlling for these mech-anisms directly, by re-estimating the results using artificial countries of a uniform shapeand size as the unit of observation, and by presenting narrative evidence from the mostinfluential observations in the data.
Unlike Bates, I am agnostic about whether it is long-distance or local trade that mat-ters most to state formation, and about whether trade gives rise to states by increasingthe returns to investment in public goods, by cheapening the cost of extending author-ity over space, or by making rulers more effective in public goods provision. The publicgoods provided by states can lower the costs of both inter-state and intra-state trade. Inthe appendix, I present a simple model of the mechanisms by which trade may lead tostate centralization. I find that class stratification is the channel best supported by thedata, though trade is associated with a wide range of state functions. No one type oftrade emerges as most important.
2I present a condensed version of his results in the web appendix.
ECOLOGY, TRADE AND STATES IN PRE-COLONIAL AFRICA 3
Although I focus on Africa, I show that the relationship between diversity and statesholds outside of Africa. While many historians of Europe link states to the growth ofmarkets (e.g. Jones (1981)), historians of Africa put particular emphasis on trade (Bates,1983). The importance of ecologically-driven trade in Africa is well documented in thehistorical literature (e.g. Lovejoy and Baier (1975)). There is also particular institu-tional continuity in Africa. Traditional authorities were often coopted by colonial states,and their successors possess significant powers today (Acemoglu et al., 2012; Mamdani,1996). The historical territories of ethnic groups can be measured with more precisionin Africa than in many other areas. It is in Africa that empirical studies have establishedthe importance of “ethnic” institutions.
My results contribute to our understanding of the importance of ethnic institutions,of the origins of institutions, and of the relationship between trade and institutionalquality.
Institutions predating modern nation states matter for income today. These includeforms of colonial rule, land tenure, and forced labor (Banerjee and Iyer, 2005; Dell, 2010;Iyer, 2010). In particular, “ethnic” institutions shape modern development. These areespecially important for Africa. Michalopoulos and Papaioannou (2012) show that pre-colonial African states better explain economic activity today than several measures ofnational institutions. African countries that possessed more centralized states prior tocolonial rule have greater levels of public goods provision today (Gennaioli and Rainer,2007). The congruence of modern African states with those that preceded colonial rulebenefits governance today (Acemoglu et al., 2003; Englebert, 2000).
States are not the only ethnic institution that matters. Local institutions of propertyrights and polygamy pass smoothly over modern borders (Bubb, 2009; Fenske, 2011a),and affect Africans’ investment incentives (Goldstein and Udry, 2008; Tertilt, 2005). So-cial sanctions within ethnic communities help overcome collective action problems(Glennerster et al., 2010; Miguel and Gugerty, 2005). The origins of these ethnic institu-tions have gone largely unexplored in the literature. I contribute by linking them to thegains from trade. This origin does not make historical states uninteresting today; thepublic goods that they provide in the present differ from those offered in the past. Fur-ther, the basis of trade in Africa has been fundamentally re-oriented, both on the eve ofcolonization (Eltis and Jennings, 1988) and again after independence (Head et al., 2010).Ecological diversity should not predict trade today. Because my results distinguish thistheory of state formation from several alternatives, they help establish that the relation-ship between ethnic institutions and present-day outcomes is causal. I show below thathistorical gains from trade can be used as an instrument for ethnic institutions.
Geography shapes institutions (Acemoglu et al., 2001; Easterly and Levine, 2003). Bio-geographical features such as population density (Acemoglu et al., 2002), crop suitabil-ity (Engerman and Sokoloff, 1997), and domesticable species (Olsson and Hibbs, 2005)have all been shown to shape the development of institutions and related outcomes.

4 JAMES FENSKE
Other geographic explanations of states point to features such as the observability ofproduction (Moav et al., 2011), population density (Austin, 2008; Herbst, 2000), out-side options (Allen, 1997), and natural boundaries (Jones, 1981) as causes of state ca-pacity. This literature has, however, focused overwhelmingly on institutions that existin the present day or those that were created in the circum-Mediterranean or in Eu-ropean colonies. Less is known about the geographic origins of institutions that havenot been built by Europeans. I provide evidence on the causes of institutions indige-nous to Africa. Controversy remains about the power of geography to explain historicalfacts such as the beginnings of agriculture (Acemoglu and Robinson, 2012; Ashraf andMichalopoulos, 2011). My results reaffirm geography as a force in history.
Countries with better institutions trade more (Dollar and Kraay, 2003). Causationruns in both directions; countries with better contract enforcement are able to special-ize in products that require relationship-specific investments (Nunn, 2007), while trademay directly improve institutional quality (Rodrik et al., 2004). Similarly, the impactof trade on other outcomes such as growth and environmental management is miti-gated by institutional quality (Damania et al., 2003; Mehlum et al., 2006). While somestudies have found that trade reduces corruption (Dutt, 2009; Treisman, 2000) othershave found either no effect or that corruption is only displaced (Knack and Azfar, 2003;Sequeira, 2011). Similarly, the effects of trade on democracy may be positive (Lopez-Cordova and Meissner, 2005), negligible (Papaioannou and Siourounis, 2008) or maydepend on the timing of trade reforms (Giavazzi and Tabellini, 2005). In this, paper, Itrace out the importance of trade for one specific institutional outcome – the central-ization of African states.
The Ricardian view is only one of many explanations of the strength of states. In addi-tion to the geographic theories listed above, other views stress factors such the relativebenefits of “stationary” versus “roving” bandits (Olson, 1993), the relative benefits ofdifferent mechanisms for governing markets (Dixit, 2004) inter-state competition (Gen-naioli and Voth, 2011; Tilly, 1992), war (Besley and Persson, 2008; Prado and Dincecco,2012), the slave trades (Nunn, 2008; Robinson, 2002; Rodney, 1972), patronage politics(Acemoglu et al., 2011), and past investments in state capacity (Besley and Persson,2009, 2010). It is not within the scope of this paper to test these unless they are alter-native interpretations of the link between states and ecological diversity.
In section 2, I describe my econometric specification and sources of data. In section3, I present the baseline results. In section 4, I demonstrate the robustness of theseresults to endogeneity, unobserved heterogeneity, the estimation strategy, influentialobservations, and alternative measures of trade and states. In section 5, I give evidencethat the six alternative stories mentioned above do not explain the results. In section 6, Ipresent evidence that centralized states emerged from trade because it supported classdifferentiation, that no one type of trade mattered most, and that ecological diversitycan be used as an instrument for ethnic institutions today. In section 7, I conclude.
ECOLOGY, TRADE AND STATES IN PRE-COLONIAL AFRICA 5
2. DATA
To test whether the gains from trade due to ecological diversity predict the existence ofcentralized states, I estimate the following equation on a sample of pre-colonial Africansocieties, using an ordered probit:
(1) State centralizationi = α + βGains from tradei + x′iγ + εi.
In this section, I explain my sources of data on state centralization, my ecologicalproxies for the gains from trade, and the controls that I include in xi. I cluster standarderrors by the ethnographic regions recorded in the sample.3
To measure African states, I take data from Murdock’s (1967) Ethnographic Atlas. Thiswas originally published in 29 issues of Ethnology between 1962 and 1980. It containsdata on 1267 societies from around the world.4 From this source, I use variable 33, “Ju-risdictional Hierarchy Beyond Local Community” to measure state centralization. Thisgives a discrete categorization between “No Levels” and “Four Levels.” The sample usedfor the analysis consists of the 440 sub-Saharan societies for which this variable is notmissing.5 For comparison with Europe and Asia, the Chekiang and Japanese score a 4 onthis index, the Czechs and the Dutch score a 3, while the Lolo and Lapps each have nocentralization. I do not have data on possible substitutes for states, such as multi-ethnicfederations that coordinate tax collection.
As far as I am aware, no data exist on pre-colonial African trade that could allow com-parison of a large number of societies. My approach is to use geographic proxies forthe capacity to trade. I follow Bates (1983) in assuming that the ability to trade acrossecological zones creates gains from trade. I use White’s (1983) vegetation map of Africato identify these regions.6 This classifies African vegetation into 18 major types, whichI plot in the web appendix.7 I use three measures of the ecologically-driven gains fromtrade: ecological diversity, distance from an ecological boundary, and ecological po-larization. I merge these measures with the Ethnographic Atlas using Murdock’s (1959)
3These are: African Hunters, South African Bantu, Central Bantu, Northeast Bantu, Equatorial Bantu,Guinea Coast, Western Sudan, Nigerian Plateau, Eastern Sudan, Upper Nile, Ethiopia/Horn, Moslem Su-dan, and Indian Ocean.4In particular, I use the revised Atlas posted online by J. Patrick Gray athttp://eclectic.ss.uci.edu/˜drwhite/worldcul/EthnographicAtlasWCRevisedByWorldCultures.sav.5It is probable that stateless societies are more likely to be missing from these data. This will only bias theresults if they are more likely to be missing in ecologically diverse regions.6This is available at http://www.grid.unep.ch/data/download/gnv031.zip.7Altimontaine, anthropic, azonal, bushland and thicket, bushland and thicket mosaic, cape shrubland,desert, edaphic grassland mosaic, forest, forest transition and mosaic, grassland, grassy shrubland, sec-ondary wooded grassland, semi-desert, transitional scrubland, water, woodland, woodland mosaics andtransitions.

6 JAMES FENSKE
map of African ethnic groups.8 This has also been used by Michalopoulos and Papaioan-nou (2011, 2012) and in several papers by Nathan Nunn.
In section 5, I supplement this with historical and anthropological evidence from sixAfrican societies.9 In each, the exchange of products across ecological zones was signif-icant. My only other measure of pre-colonial trade is a map of trade routes from Briceand Kennedy (2001). I show in Section 6 that these predict states. I do not make them afocus of this paper, as their placement is potentially endogenous.10
Though Bates (1983) focuses on long distance trade, internal trade may also facilitatestates. A state may protect intra-ethnic trade, but it may also facilitate trade betweenpolities occupying two separate, internally homogenous regions. In section 6, I showthat the data cannot ultimately disentangle whether it is local trade or long distancetrade that matters most. Thus, I construct indices of the gains from both local and long-distance trade.
The principal measure that I use of gains from trade is ecological diversity. I calculatethe share sti of each society i’s area that is occupied by each ecological type t. Ecologicaldiversity is a Herfindahl index constructed from these shares:
(2) Ecological diversityi = 1−t=18∑t=1
(sti)2.
This is captures the opportunities for trade that exist within an ethnic group’s territory– the gains from internal trade.
The second index that I use measures ecological polarization. This is also constructedfrom the vegetation shares:
(3) Ecological polarizationi = 1−t=18∑t=1
(0.5− sti0.5
)2
sti.
This measures the degree to which a society approximates a territory in which twovegetation types each occupy half its area. Similar measures have been used for eth-nicity (Montalvo and Reynal-Querol, 2005a,b). This also captures gains from internal
8This is available on Nathan Nunn’s website. While most groups are matched directly by name, somerequire an alternative spelling, an alternative name, linkage to a supergroup or subgroup, or joining to anethnic group in roughly the same location. A table of these matches is in the web appendix.9It is possible that gains from trade could arise from other forms of geographic heterogeneity. Empirically,ecological diversity performs best. I have found no positive effect of other indices, such as ruggednessor a Theil index of land quality on states. Area under water in White (1983) indicates rivers and lakes:this has a negative impact on statehood if included with the baseline set of controls. Mangroves andcoastal areas are classified as “azonal,” and have no effect. The difference in land quality between themost fertile and least fertile points in an ethnic group’s territory does predict states, but this is given adifferent interpretation in section 5.10See Michalopoulos et al. (2010). This map includes mostly routes across the Sahara or connecting LakeVictoria to the coast. These are not correlated with ecological diversity.

ECOLOGY, TRADE AND STATES IN PRE-COLONIAL AFRICA 7
FIGURE 1. State centralization and ecological diversity
Notes: States, on the left, are from Murdock (1967). Darker regions have more centralized states. Ecolog-ical diversity, on the right, is computed using White (1983). Darker regions are more ecologically diverse.
trade. If increasing returns to scale exist in production or trade, trade may be most prof-itable if a society is evenly divided into two ecological zones. This would maximize thepolarization index.
The third index that I use is distance from an ecological boundary. I use the White(1983) map to compute the average distance (in decimal degrees) of all points in a group’sterritory from the nearest boundary between two ecological regions. This captures gainsfrom external trade, since the boundary may lie outside the ethnic group. Because a so-ciety that is intersected by a boundary will also be ecologically diverse, the measures ofinternal and external trade will be positively correlated. Distance from a boundary does,however, predict states even in the sub-sample of ecologically homogeneous societies.
I present maps of state centralization and ecological diversity in Figure 1.11 The mostcentralized African states are clustered along an East-West line between the Sahara andWest African forest, in the microclimates of the Ethiopian highlands, along the barrierbetween the equatorial rainforest and the East and Central African woodland mosaics,and on the divide between grassland and woodland in the continent’s southeastern cor-ner.
I join several other geographic variables to the data on ecology and states using theMurdock (1959) map of Africa. I include these in xi as controls. Except where I note
11The base map of ethnic groups is available on Nathan Nunn’s website. While most ethnic groups can bematched to this map directly by name, some require an alternative spelling, an alternative name, linkageto a supergroup, or subgroup, or joining to an ethnic group in roughly the same location. A table of thesematches is included in the web appendix.

8 JAMES FENSKE
FIGURE 2. State centralization above and below median diversity
The dark bars are for ecological diversity above the median, the light bars for ecological diversity belowit.
otherwise, I take data stored in raster format, and for each society I compute the aver-age value of the points within its territory.12 In particular, I control for the presence of amajor river, agricultural constraints (an inverse measure of land quality), distance fromthe coast, elevation, suitability for malaria, precipitation, ruggedness, temperature, dis-tance from Lake Victoria, date of observation, crop type dummies, and distance fromeach of the four major slave trades. These variables are described in more detail in theweb appendix. Summary statistics are given in Table 1. These data are that they are ad-mittedly anachronistic – the institutional variables are recorded at an earlier date thanthe geographic controls and the measure of ecological diversity. Because these variablesare slow to change, this should only add measurement error to the analysis.
3. RESULTS
I begin by showing the unconditional relationship between gains from trade and statecentralization. In Figure 2, I cut the sample into societies above and below median eco-logical diversity. For each, I show the relative frequencies of states of each level of cen-tralization. Below the median (the lighter bars), it is more common for societies to haveno levels of centralization, or only one level. Above the median, there is a greater preva-lence of societies with two or three levels. As ecological variation rises, the distributionof state centralization shifts to the right.
12Raster data taken from the following sources: Ag. Constraints, http://www.iiasa.ac.at/Research/LUC/SAEZ/index.html, plate 28; Elevation, http://epp.eurostat.ec.europa.eu/; Malaria, http://www.mara.org.za/lite/download.htm; Precipitation, http://www.iiasa.ac.at/Research/LUC/SAEZ/index.html, plate 1; Temperature, http://www.iiasa.ac.at/Research/LUC/SAEZ/index.html, plate 6; Rugged-ness, http://diegopuga.org/data/rugged/.

ECOLOGY, TRADE AND STATES IN PRE-COLONIAL AFRICA 9
Table 2 presents estimates of β. I report the full set of coefficient estimates in the webappendix, omitting them here for space. In column 1, only the measure of ecologicaldiversity is included. Ecological diversity has a significant and positive correlation withstate centralization. This is robust to the inclusion of additional controls in column 2.
Few of the additional controls are significant. The exceptions are date of observa-tion (negative), no major crop (negative), roots and tubers (positive), and major river(positive). The negative effect of the date of observation suggests that colonial anthro-pologists chose to first study the most centralized African societies – the low hangingacademic fruit. The negative effect of no major crop suggests that it is difficult to form astate without an agrarian base. The positive effect of roots and tubers is likely capturingunobservable features of forest-zone Bantu societies that better enabled them to createstates. Major rivers are associated with trade, and further support the Ricardian view ofAfrican states. Results are similar if the length of river per unit area is used, rather thana dummy (not reported).
Is the effect of ecological diversity large? In Table 2, I report marginal effects. The im-pact of a one unit change in ecological diversity is to reduce the probability of havingno centralization by roughly 22-26 percentage points. The probabilities of having twoor three levels increase to match this. Ecological diversity has a bimodal distribution;societies are clustered around peaks of zero diversity and roughly 0.5 (see the web ap-pendix). If an ecologically homogenous society such as the Tallensi or the Yako wereto be and placed in a more typically diverse region, such as that of the Fur (0.496) orWolof (0.506), the probability of any centralization would rise roughly 11 to 13 percent-age points. Mirroring this thought experiment, I replace the ecological diversity mea-sure with an indicator for being above median diversity. The marginal effect, in Table 2,is between 9 and 11 percentage points.
The pseudo-R2 statistics, by contrast, are low. While the effect of diversity is sizable,the controls here cannot explain more than 10% of the variation in African states. Theestimation without controls correctly predicts the level of centralization for 42% of thesample, barely an improvement over selecting the mode. Adding controls raises this toonly 45%. Although the bulk of pre-colonial state centralization in Africa remains to beexplained (Osafo-Kwaako and Robinson, 2012), the impact of ecologically-driven gainsfrom trade is robust and economically significant.
I also use Table 2 to show that the results can be expanded to cover the rest of theworld. On a sample of more than 1,000 global societies, ecological diversity continuesto predict the existence of states.13 This is true even as the sub-Saharan societies aredropped from the analysis. I conduct as many of the robustness checks as possible in
13This sample has been created for Fenske (2011b). Details on these are given in the web appendix forthat paper.

10 JAMES FENSKE
this global sample that I do for the sub-Saharan sample in sections 4, 5, and 6. Resultsare reported in the Web Appendix.14
4. ROBUSTNESS
4.1. Validity of the state centralization measure. I take two approaches to validate thestate centralization measure. First, it is strongly correlated with alternative measures ofstates. Bockstette et al. (2002) and Chanda and Putterman (2007) report a country-levelindex of historical state strength for the period 1850-1900, which just precedes colonialrule for most African societies. The state centralization index has been aggregated to thecountry level by Gennaioli and Rainer (2007). For 41 countries, I have both measures.Their correlation is positive and significant at the 1% level. Similarly, the Standard CrossCultural Sample (SCCS) gives additional variables for 186 societies. It only includes 28sub-Saharan observations, so I cannot use it in the baseline. I show in the web appendixthat several SCCS measures of state strength are positively correlated with centraliza-tion, whether they measure the existence of a police force, the presence of taxation, orthe capacity of states to enforce their decrees.15
Second, the main result holds if I use an indicator for any levels of jurisdiction abovethe local as an outcome in Table 3. This might better capture state strength if, for ex-ample, a central authority cannot delegate functions to regional leaders without losingsome control over them. Results are similar using centralization greater than one as anoutcome (not reported).
4.2. Validity of the gains from trade measure. Results are robust to using alternativemeasures of the gains from trade are in Table 3. Distance from an ecological bound-ary and ecological polarization both predict states. Distance from a divide also predictsstates in the sub-sample of ethnic groups not intersected by a boundary (not reported).Results using an indicator for any diversity (equivalent to intersection by a boundary)are similar. I collapse ecological classifications from White’s map into eight “simpler”types.16 This does not change the bi-modal distribution of diversity. I re-build the data-set discarding slices of map in which historical population density is less than 15% of the
14Some tests cannot be carried out on the global sample due to data availability. I do not have historicaltrade routes, pre-colonial cities, or salt production outside of Africa. Because the global diversity measureis constructed using raster data that uses different classifications than White (1983), I cannot computedistance from an ecological boundary, construct simpler ecological classes, or measure diversity withinartificial ethnic groups in the global sample.15The centralization measure is v237 in the SCCS.16Mountain if altimontane, other if anthropic, water or azonal, bushland if bushland and thicket or bush-land and thicket mosaics, shrub if cape shrubland, transitional scrubland or grassy shrubland, desert ifdesert or semi-desert, grassland if grassland, secondary wooded grassland or edaphic grassland mosaics,forest if forest or forest transitions and mosaics, and woodland if woodland or woodland mosaics andtransitions.

ECOLOGY, TRADE AND STATES IN PRE-COLONIAL AFRICA 11
density of the entire ethnic group.17 These potentially irrelevant regions do not deter-mine the results. Finally, an alternative diversity index using the Food and AgricultureOrganization’s (FAO) division of Africa into “dominant ecosystem classes” also predictsstates.18
4.3. Validity of the estimation. I use a generalized ordered probit model in the web ap-pendix (Maddala, 1986). Results are similar to the baseline. Because multi-ethnic poli-ties might be double-counted in the data, I down-weight all centralized societies by onehalf, and the results are virtually unchanged (not reported). Major rivers and distancesfrom the coast, Lake Victoria, and slave trade ports may capture trade. I show in the webappendix that excluding these controls barely affects the results. Nor does excluding thedate of observation or including country-level timing of the neolithic revolution (notreported).19 In the web appendix, I discard influential observations. I also drop eachof the “South African bantu,” “Ethiopia/horn,” “Moslem sudan” and “Indian Ocean” inturn, as these are the regions in which most states are concentrated. I also exclude non-agricultural societies, societies with poor land, animal husbandry, and the desert fringe.These do not drive the results. The main sample includes only sub-Saharan Africa; re-sults are similar using the whole continent (not reported).
4.4. Possible reverse causation. To control for the possibility that states may shapetheir environment, I use variation over space (not time) in rainfall to instrument forecological diversity.20 I use the log of the rainfall range as an instrument, where:
(4) Log rainfall rangei = ln(1 + (rainmaxi − rainmin
i )).
Here, rainmaxi and rainmin
i are the values of the raster points with the most and leastprecipitation for society i. The natural log improves fit. This cannot be computed forsocieties too small to have at least two raster points. Results are robust to assigningthese societies a log rainfall range of zero. Results (including the reduced-form andfirst stage) are in Table 4. The IV estimates are larger than the ordinary least squares(OLS) estimates. Measurement error in ecological diversity is a plausible explanation,since vegetation classes are subjective and have imprecise boundaries. Further, ecolog-ical diversity may be correlated with unobservable variables that hinder states. Whereecological boundaries abut agriculturally marginal areas such as deserts and mangroveswamps, states may have less agricultural surplus to tax.
17I use density in 1960.18This is plate 55, downloaded from http://www.iiasa.ac.at/Research/LUC/GAEZ/index.htm.19Data are from Louis Putterman’s website.20Variation over time is unlikely to predict ecological diversity, which is variation across space in vege-tation. Further, fluctuations in rainfall over time may lead to conflict (Miguel et al., 2004), which coulddirectly affect state formation.

12 JAMES FENSKE
4.5. Possible omitted heterogeneity. I show that results are robust to seven general ap-proaches towards omitted heterogeneity in Table 5. First, I add area shares sti of eachecological type as additional controls. Second, I include a cubic in latitude and lon-gitude with full interactions, allowing unobservables to vary smoothly across space.Third, I adjust for spatial autocorrelation using a spatial error model, a spatial auto-regressive model, including the spatially-weighted observable characteristics of a soci-ety’s neighbors, and estimating Conley’s OLS with standard errors corrected for spatialdependence with cutoffs of 5 decimal degrees. 21 I do not use Conley’s estimator in thebaseline because the dependent variable is ordinal. I instead cluster standard errors byethnographic region in the baseline.
Fourth, I interact de-meaned controls with ecological diversity (Wooldridge, 2002).Fifth, I employ a nearest neighbor matching estimator, taking diversity above the me-dian as “treatment.”22 Sixth, I compute Altonji-Elder-Taber statistics.23 Finally, I usefixed effects. In successive columns, I control for ethnographic region, United Nationsregion,24 country,25 and language family.26 These are estimated using OLS. I do not usethese in the baseline because they will exacerbate measurement error. In an OLS regres-sion, ethnographic region dummies explain 19% of the variance in state centralizationand 25% of the variance in ecological diversity.
5. ALTERNATIVE INTERPRETATIONS
The Ricardian view of African states better fits the data than six alternative interpre-tations of the link between ecological diversity and states. Some of these are comple-ments, rather than rivals, to the Ricardian view. Still, they do not fully account for therelationship between ecology and states.
5.1. Larger areas are more diverse and require centralized administration. States thatcover wider territories for reasons unrelated to their strength may have more levels ofjurisdiction (Spencer, 1998, 2010). These areas may be more diverse by construction. I
21In particular, I use the spatwmat and spatreg commands in Stata. I select the spatial adjacency matrixW so that all societies whose centroids are within ten decimal degrees of each other are given a weightinversely proportionate to their distance from each other.22In particular, I use the nnmatch command in Stata.23Replicating the main regression using OLS, I obtain the estimated coefficient on ecological diversity β1
and the estimated variance of the residuals V1. Regressing state centralization on the controls, I obtainthe predicted values xb and the estimated variance of the residuals V2. Regressing ecological diversity
on xb, I obtain the coefficient estimate β2. Altonji et al. (2005) suggest that if β1V2
β2V1> 1, it is unlikely that
unobservables will explain away the result of interest.24I make the following assignments. Southern Africa: African Hunters, South African Bantu. WesternAfrica: Guinea Coast, Western Sudan, Nigerian Plateau, Moslem Sudan. Central Africa: Central Bantu,Equatorial Bantu, Eastern Sudan. Eastern Africa: Northeast Bantu, Upper Nile, Ethiopia and Horn, IndianOcean.25I assign each ethnic group to the country into which the largest slice of its territory falls.26This is constructed from variables 98 and 99 in the Ethnographic Atlas.

ECOLOGY, TRADE AND STATES IN PRE-COLONIAL AFRICA 13
have three strategies for dismissing this alternative. First, I restrict the sample to soci-eties of similar area. In Table 5, I show that results are robust if the smallest quintile (Q1),largest quintile (Q5) or both are dropped. Second, I control for area directly in Table 5.This is not done in the main analysis, because area is potentially endogenous. Resultsare robust to this, as well as including the logarithm of area (not reported).
Third, I adopt the “virtual countries” approach of Michalopoulos (2011). I divide theAfrican continent into 1◦ by 1◦ squares and repeat the main analysis. I map these virtualcountries in the web appendix. Excepting coastal societies, these units have a uniformshape and area.27 This exercise shows that, even conditioning on size and shape, diverseareas are more likely to host states. Further, this mitigates the concern that multi-ethnicstates are “double-counted.” Some readers may prefer these “exogenous” units. I usecentralization of the strongest state in a square as its measure of centralization. Results,in Table 5, are robust to this approach.
5.2. States conquer trading regions. States might emerge for reasons unrelated to thegains from trade, and then occupy trading regions through migration or conquest. Thiscould only be conclusively ruled out using panel data – data that do not exist. I usethe cross section to make three arguments. First, the artificial country results abovesuggest that diversity does not result from the irregularly-shaped boundaries of ethnicgroups that have conquered their surroundings. Second, if conquest requires that statesexpand, I have shown above that controlling for area does not eliminate the main result.
Third, I give narrative evidence on some of the most statistically influential societiesin the data. This is effectively a very small panel taken from the larger cross section.The eighteen most influential societies (by dfbeta) are listed in Table 7. If the central-ized societies in this list developed states where they are or derived their wealth andpower from their proximity to trade routes, rather than migrating to capture trade, thissupports the Ricardian view. I choose six centralized states for case study evidence.28
To test the “Ricardian” view, I ask four questions about the Yoruba, Songhai, Toro,Suku, Luba and Lozi. First, did these societies participate in trade? Second, was tradea source of wealth for the society? Third, was trade a source of state power? Fourth,did these states move to capture trading regions after they grew strong? I summarizethe answers in Table 7. Though two of these did conquer areas with tradable resources,they relied on trade-related income to become powerful before expanding.
Yoruba. Morton-Williams (1969) argues that Yoruba Oyo “developed under the stim-ulus of external trade,” benefiting initially from its proximity to northern trade routes,
27Because the length of a degree of longitude varies by distance from the equator, I have also replicatedthe results in Table 5 down-weighting observations by the degree of this distortion. The results (not re-ported) are nearly identical.28I choose these, rather than non-centralized societies, because the alternative story being discussed isspecific to centralized ethnic groups and because the secondary historical literature is richer for thesegroups. These were the six most influential states when a different baseline specification was used inearlier versions of this paper.

14 JAMES FENSKE
and later from coastal markets. Law (1977), similarly, links the rise of Oyo to its im-ported cavalry, participation in long-distance northern commerce, and engagement inthe Atlantic slave trade.
Trade was important. Oyo cloth was sold to Dahomey and Porto Novo, and the stateimported kola nuts from forested areas of Yorubaland for consumption and re-export.Salt and camwood were imported, and the latter was re-exported to Nupe. Cavalryhorses were imported from the north. The Alafin (king) relied on trade taxes for rev-enue (Law, 1977). Even direct taxes were collected in currencies acquired through trade.Trade upheld the Alafin’s authority by enabling him to distribute money and trade goodswhile maintaining a superior lifestyle. He and other chiefs engaged in trade personally.Neither Morton-Williams (1969) nor Law (1977) mention conquest of neighboring re-gions as a pre-condition for trade.
Songhai. The Songhai Empire depended on trans-Saharan trade. Neumark (1977)explains the success of Songhay and the states that preceded it using “their strategiccommercial position on the fringes of the Sahara.” Songhay exported gold and slaves, aswell as ivory, rhinoceros horns, ostrich feathers, skins, ebony, civet, malaguetta pepper,and semi-precious stones. It re-exported cloth and leather goods from Hausaland andkola from the forests. It imported salt, linen, silk, cotton cloth, copper goods, ironwork,paper, books, weapons, cowries, beads, mirrors, dates, figs, sugar, cattle and horses.This trade brought wealth; Leo Africanus noted the empire’s prosperity (Levzion, 1975).
Taxes on trade provided government revenue (Shillington, 1989). Lovejoy (1978) notesthat Songhay’s cities “controlled trans-Saharan trade, desert-side exchange, and rivertraffic on the Niger. Located in the Sahil but with easy access to western and centralsavanna, they were at the hub of overland and river routes where staples of desert-sidetrade such as grain and salt could readily be transferred from river boat to camel, andvice versa.”
Songhay did expand into the Hausa states to capture their fertile land and into Air todrive out Tuareg raiders (Bovill, 1995). The latter was a movement to protect existingtrade interests, not to secure new routes. Songhay’s strength, like the states that camebefore it, was based on its favorable location before it expanded.
Toro. The Toro region was one of relative prosperity, producing iron goods and salt forsale within the interlacustrine region (Ingham, 1975). Trade was a source of state rev-enue, through both tribute and direct control. The king, chiefs and lords of Toro main-tained control over land, cattle, lakes, salt lakes, medicinal springs, canoe services, and“certain commodities having exchange or prestige value,” such as tusks and lion skins(Taylor, 1962). They collected goods as tribute, reallocating them to relatives, chiefs,officials and others. Subordinate states introduced agents to collect tax from both saltproducers and traders, a portion of which was sent to Bunyoro (Ingham, 1975). TheToro kings sold slaves, ivory and cows to Arab traders in return for guns and cloth (Tay-lor, 1962). Toro was also an exporter of salt; until 1923, the okukama or Mukama (king)

ECOLOGY, TRADE AND STATES IN PRE-COLONIAL AFRICA 15
of Toro held personal ownership over the trade in salt from Lake Katwe and other lakedeposits near Kasenyi (Good, 1972). Toro did expand to take advantage of a tradableresource. Lake Katwe, in Busongora, was an early conquest (Good, 1972). Salt was, how-ever, only one of many tradable goods that enhanced the power of the Toro state.
Suku. The Suku of the Congolese savanna lacked a developed system of market places,sold no cash crops and only limited rubber, and itinerant trade was “not at all devel-oped” in the colonial era (Kopytoff, 1967). The Suku did, however, participate as mid-dlemen in the long-distance trade between the raffia and palm-oil producers north andeast of them and southern groups who traded directly with the Portuguese (Kopytoff,1967). They purchased raw raffia for weaving into cloth, which was exported to thesoutheast along with palm oil in return for shell money and European goods (Kopy-toff, 1967). Though relatively poor, the Suku were known for their wealth in shell money(Kopytoff, 1964).
The Suku MeniKongo (king) directly ruled villages around the capital and adminis-tered the remainder through regional chiefs. Shell money was used to render tribute(Kopytoff, 1964), and so direct taxes were indirectly taxes on trade. The effect of tradeon the Suku state was inherited in part from the Lunda, from whom Suku seceded(Kopytoff, 1965). Within the Lunda’s territory lay both copper mines and salt, whichwere sources of trade and tribute (Birmingham, 1976). Slaves for export were collectedthrough war and tributary tax collection, and this revenue allowed the royal court todistribute the trade goods over which it held a near monopoly (Birmingham, 1976). TheSuku inherited state forms from their trading predecessor, and prospered from their po-sition as middlemen.
Luba. Before they were unified, the separate Luba states controlled local dried fish,salt, oil palm, raffia cloth, and copper-working industries (Birmingham, 1976). In thelate eighteenth century, Luba Lomami responded to the new long distance trade in ivoryand slaves, unifying the Luba (Birmingham, 1976). Traders exchanged cloth, beads andcattle for tusks that were sold subject to taxation and supervision by either the royalhousehold or by chiefs (Birmingham, 1976). This trade was preceded by “pioneeringchiefs,” who advanced into new lands and arranged for the purchase of ivory while atthe same time creating “a more or less permanent Luba political superstructure” behindwhich traders followed (Birmingham, 1976).
After 1780, the Luba expanded, first into the space between the Lualaba and LakeTanganyika, and later into the fishing and palm oil areas of the Lalaba lakes, the copper-producing portions of the Samba, and the ivory-producing province of Manyema (Birm-ingham, 1976). At its peak in the mid-nineteenth century, the empire presided over “awide-ranging and international trade” in oil, salt, poisons, drums, slaves, copper, palmcloth, baskets, iron, skins and fish. Wilson (1972) argues that long-distance trade wasthe cause of this expansion. The slave trade pushed the Luba to establish Kazembe asa tributary kingdom. Birmingham (1976) argues that Luba decline followed that of the

16 JAMES FENSKE
ivory trade. Their trading partners turned to focus on copper. Swahili-Arab traders be-gan to trade directly into the forest, cutting out the Luba. The Luba became unable topurchase the guns needed to secure their power without exporting internally capturedslaves.
Lozi. The pastoral Lozi occupy the Zambezi floodplain (Gluckman, 1941). Within Loziterritory, trade was in the specialized products of each region, including bulrush milletand cassava meal, wood products and iron (Gluckman, 1941). Before 1850, the Lozi senttraders to the Lunda areas of the upper Zambezi, trading indirectly with the Portuguese(Flint, 1970). By 1860, long distance trade, especially in ivory, became important (Flint,1970). The Lozi exported cattle and forest products (Gluckman, 1941).
The king and princess chief collected tribute in kind from “tribes” under their com-mand, including canoes, weapons, iron tools, meat, fish, fruit, salt, honey, maize andmanioc (Birmingham, 1976). The Kololo, who ruled the Lozi between 1840 and 1864,obtained ivory as tribute and sold iron hoes to the Tonga. The Kololo king established‘caravan chiefs’ and kept profits from ivory within his court (Flint, 1970). On re-gainingindependence, the Lozi king traded cattle, ivory and slaves for goods that he distributed(Gluckman, 1941).
Public goods. Subjects and traders received greater peace and protection from thesestates. The Toro “expected patronage - protection, justice, undisturbed occupation oftheir land, and rewards especially in stock or chieftainships or honours for good service”(Taylor, 1962, p 60). Lozi political authorities re-distributed tribute, sometimes to thosein need, serving as a “clearing house” (Gluckman, 1941, p. 73). Traders gave gifts to theking, “for they traveled by his permission and largely, despite their muskets, under hisprotection (p. 78).” Lewanika, for example, sent a punitive expedition against subject Ilafor having killed a party of traders (p. 79). Oyo caravans, similarly, often traveled undercavalry protection (Law, 1975).
Summary. These cases are consistent with the Ricardian view. Songhai and Oyo ex-panded, but did so after having arisen in locations favorable to trade. The Luba ex-panded after 1780 based on power already acquired through the Bisa ivory trade. Whenthat trade declined, the kingdom collapsed. Lozi dominance over surrounding peoplesdepended trade and tribute from the diverse products of their neighbors. That the Sukuparticipated in long-distance trade while possessing only limited internal markets high-lights the importance of trade spanning macro-ecological regions. In every case, rulerstaxed trade. Though Toro conquered Busongora to capture the most important sourceof salt in the region, it inherited its political structure from Bunyoro, which had previ-ously grown strong due to its sale of metal goods and control of the Kibiro salt industry.
5.3. Islands of quality. If states emerge to protect “islands” of land quality that differfrom neighboring areas, these will also have diverse ecologies. In Table 5, I control forthe range of agricultural constraints – the difference in land quality between the best
ECOLOGY, TRADE AND STATES IN PRE-COLONIAL AFRICA 17
and worst points in a society’s territory. The effect of diversity remains significant. If Icontrol for a Theil index of agricultural constrains, the results are similar (not reported).
5.4. Population density. Ecological diversity may be correlated with population den-sity, which itself explains pre-colonial African states (Osafo-Kwaako and Robinson, 2012).I proxy for historic population density by measuring it in 1960.29 This is reported in Ta-ble 5, and the effect of ecological diversity remains intact. This is also true if I includethe log of (one plus) population density (not reported).
5.5. Ethnic diversity. Ecology-specific human capital gives rise to a greater number ofethnic groups in regions of diverse ecology (Michalopoulos, 2011). Competition be-tween these groups may lead them to develop stronger states (Tilly, 1992). Alternatively,more heterogeneous communities might form more sophisticated institutions to re-duce conflict (Aghion et al., 2004). To show this is not driving my results, I return tomy sample of artificial countries. I count the number of ethnic groups that intersecteach square, and include this as an control in Table 5. The main result survives this.It also survives controlling for modern-day heterogeneity, measured as the number oflanguages reported in the World Language Mapping System (not reported).30
This alternative interpretation would also contradict several established findings. Eth-nic diversity increases the cost of nation-building (Alesina et al., 2005), inhibits pub-lic goods provision (Easterly and Levine, 1997), and predicts the break-up of nations(Desmet et al., 2009).31 Ecological diversity overcomes both these potential effects ofgreater ethnic diversity and the possible substitutability between trade openness andnation-building (e.g. Alesina and Spolaore (1997)).
5.6. Diversity and risk. Ecological diversity may increase the number of activities a so-ciety can use to cope with risk and seasonal variation. It may permit animals to bemoved to take advantage of seasonal resources and avoid diseases (Beinart, 2007). Ihave shown above that the results are not driven by societies dependant on animal hus-bandry. Results are also robust to controlling for presence of bovines (not reported).In Table 5, I show they are robust to adding subsistence diversity as a control. This isa Herfindahl index computed from the income shares derived from hunting, fishing,gathering, husbandry, and agriculture reported in the Ethnographic Atlas.
Cultivating a diverse set of grains may enable a state to better cope with risk (e.g.McCann (1999)). If these grains are exchanged through intra-regional trade, this is notinconsistent with an interpretation linking diversity to states through trade. Controllingfor a Herfindahl index constructed from the shares of each society’s territory that are
29Raster data are taken from http://na.unep.net/datasets/datalist.php.30The map can be purchased from http://www.worldgeodatasets.com/language/.31Within artificial countries, the centralization of the median ethnic group is negatively related to thenumber of ethnic groups (not reported). I have found no evidence that this relationship is non-monotonic. The positive coefficient in Table 5 likely comes from selecting the maximum state from alarger number of ethnic groups.
18 JAMES FENSKE
most suitable for the grains listed in plate 48 of the FAO-GAEZ data does not change themain result (not reported).
6. MECHANISMS
6.1. How does trade cause states? To illustrate the possible mechanisms connectingtrade to state centralization, I introduce a simple model in appendix A. This is basedon Gennaioli and Voth (2011). In the model, a ruler extends his authority within hisethnic group’s territory in order to tax trade. This trade cannot occur unless he offerspublic goods that lower the costs of trade. These public goods could include dispute-resolution services or physical protection. I do not specify whether these public goodsare used to facilitate trade with the citizens of neighboring states, or to promote internaltrade, since state services could lower trade costs in either case. I show that greater gainsfrom trade will lead the ruler to centrally administer a larger fraction of group’s territory.In the model, there are three mechanisms by which trade may lead to states:
(1) Greater gains from trade will directly increase the profitability of state centraliza-tion. It raises the tax base, allowing the ruler to extract greater revenues from theterritory he controls. Investment in public goods and administration becomesworthwhile. Adding to this direct revenue effect, the ability of rulers to tax ex-change and to trade on their own was highlighted by the case studies above.
(2) If greater access to trade makes it cheaper to project authority over space, cen-tralization will increase. Access to trade can lower these costs. The ability to tradefor horses and for firearms made it easier for states such as Oyo and Songhai toextend their power over space.
(3) If access to trade makes the ruler more effective at providing public goods, statecentralization becomes more profitable. Access to trade may give the ruler ac-cess to goods that increase his authority in settling disputes and in demandingthat traders not be harassed. The Alafin (king) of Oyo gained prestige by main-taining a superior lifestyle, while the Lozi and Toro rulers secured loyalty by re-distributing the profits from trade. Cavalry and firearms could be used to extendprotection to traders.
It is beyond the scope of this paper to discuss whether trade or centralization are“good” outcomes in all cases, or whether states that depend on tradable resources forrevenues are “better” than states that have other sources of revenue (Brunnschweilerand Bulte, 2008; Mehlum et al., 2006; Sachs and Warner, 2001).
6.2. Trade and intermediate outcomes. Here, I test whether trade predicts specific out-comes related to state formation. I find that ecological diversity is strongly associatedwith class stratification, but not with local political structures or with religion. Trade inthe SCCS is correlated with a wide selection of state functions, rather than a few narrowindicators of state capacity.
ECOLOGY, TRADE AND STATES IN PRE-COLONIAL AFRICA 19
Diminished local authority. The first possible mechanism is to take over the authorityof other smaller states in its vicinity. The atlas contains a variable (V32) that records thenumber of “levels of local jurisdiction.” I take this as a crude measure of the strength oflocal states, and use it as an outcome in place of state centralization in (1). While there isa suggestive negative correlation between ecological diversity and local states when noother controls are added, this is not robust to the inclusion of other variables. Similarly,V72 records the rules for succession to the office of the local headman. I construct a“headman is appointed” dummy if this rule is “appointment by higher authority.” InTable 8, I show that there is no correlation in the data.
Islam. Islam diffused in Africa through trade networks that encouraged both tribalunification and the adoption of Arabic (Insoll, 2003). This is one of the possible mech-anisms linking trade to states. The data do not directly record Islam. They only statewhether high gods are “supportive of human morality.” This is only positive for a hand-ful of societies outside of the Moslem Sudan, Western Sudan and Ethiopia, and so it iseffectively a dummy variable for either Christianity or Islam. This is only available fora sample roughly half the size of the main sample, and does not appear to be relatedto ecological diversity in Table 8. Similarly, if I include it as a control, the coefficient onecological diversity falls, but remains significant (not reported). Islam, then, does notdrive the correlation between trade and states in the data.
Class stratification. Trade allowed kings to amass wealth through taxation, lettingthem gain prestige and control the flow of tribute. To test for this mechanism, I use V66,“class stratification among freemen,” which is divided into five levels. In order, these are“absence among freemen,” “wealth distinctions,” “elite,” “dual,” and “complex.” Eco-logical diversity positively predicts this in Table 8. Results (not reported) are similar if abinary class stratification measure is used. Though recent trade models argue that tradeincreases inequality by raising incomes of abundant factors, increasing skill premia, andthrough search frictions in import-competing sectors (Harrison et al., 2011), these areof limited relevance to pre-industrial societies. Instead, rulers’ access to prestige goods,trade goods, and tax revenues are more likely mechanisms.
Specific state functions. I test whether the various measures of state centralization inthe SCCS’s global sample are correlated with any of the forms of trade mentioned in thatsource in the web appendix. Trade in food and the importance of trade in subsistenceare related with the greatest number of state functions. The degree of police specializa-tion and the level of the highest political office are correlated with all the trade measures.The degree to which the executive is concentrated in a single person, the presence of ajudiciary and the level of highest overarching jurisdiction are correlated with all but one.Many types of trade, then, are related to several state-related outcomes in the SCCS – noone type of trade operates through one specific mechanism.32
32Other outcomes may be of interest to the reader. Ecological diversity does predict area in an OLS re-gression, and this is robust to both the standard controls and regional fixed effects (not reported). I havefound no relationship between ecological diversity and urbanization measured by cities in 1850 reported
20 JAMES FENSKE
6.3. What sort of trade matters? Endowments of tradable products. The ecological di-versity measure cannot capture all forms of trade. In Table 8, I test whether other sourcesof trade – fishing, iron, gold, and salt – give similar rise to states. These data do not mea-sure trade in these products, only the capacity to trade. Coefficients can be thought ofas intent-to-treat effects.
A society’s percentage dependance on fishing is V3 in the Ethnographic Atlas. I find nocorrelation between this and states. To test the importance of minerals, I take data fromthe US Geological Service’s Mineral Resources Program.33 These records contain dataon both metallic and nonmetallic mineral resources at specific sites. “Iron” is the num-ber of sites of iron production found within an ethnic group’s territory, and “gold” is thenumber of sites of gold production. If there is any bias from using modern data, it will bepositive, since modern states that have inherited the strength of their pre-colonial pre-decessors should be better able to exploit their countries’ resources. Despite this, I findno evidence that iron matters.34 Gold enters significantly when no controls are added,though the effect of gold is marginally insignificant with controls. “Salt” is the numberof salt-producing cites listed by Sundstrom (1974) within an ethnic group’s territory.35
This too appears irrelevant.Types of trade. I also test whether state centralization is correlated with any particular
form of trade in the SCCS’s global sample. In the web appendix, I present the correla-tions between these indicators and state centralization. Societies with states are morelikely to trade for food, through more levels of intermediation, and this trade is moreimportant to their subsistence. Political power is more likely to depend on commercein more centralized states, trade and markets are more likely to exist, and exchange ismore important both within the community. Interestingly, this suggests that it is moremundane, intra-community trade in products such as food that matters.
Local and long distance trade. Despite this suggestive finding, the main data sourceshere do not allow for these two types of trade to be conclusively tested against eachother. I show in Table 8 that the presence of historical trade routes is correlated withstate centralization. This does not, however, rule out the importance of local trade.Similarly, while “ecological diversity” is intended as a proxy for intra-ethnic trade and
by Chandler and Fox (1974) (not reported).Similarly, some readers may be interested in how ecological diversity and pre-colonial states relate tocolonial outcomes. I show in the web appendix that ethnic groups whose largest slice of territory wasconquered by Britain were generally more diverse and more centralized than those captured by France,but less than those not colonized. Within the British empire, Frankema and van Waijenburg (2010) havefound early twentieth century real wages were much higher in West Africa than East Africa. If there isany pattern apparent, it is that ethnic groups in Britain’s East African conquests were more diverse andcentralized than those in Ghana and Nigeria, though Sierra Leone is an exception.33The data are available at http://mrdata.usgs.gov/34I similarly find no result if I use the number of iron-producing sites within a group’s territory listed bySundstrom (1974) as a measure of iron.35Of 271 sites he lists, I match 84 to ethnic groups in the data and 157 to specific geographic locations, suchas Cape Lopez. For 30 I could not find a match. The full table of matches is given in the Web Appendix.
ECOLOGY, TRADE AND STATES IN PRE-COLONIAL AFRICA 21
“distance from an ecological boundary” is meant to capture long distance trade, I showin the web appendix that including both in the same regression does not allow theireffects to be disentangled. They are strongly correlated, and both coefficients fall rela-tively 40% relative to their values in Tables 2 and 3.
6.4. Does historical trade matter today? It is not the case today that all African coun-tries have strong states. Even today, a one standard deviation increase in the Gennaioliand Rainer (2007) index of State Centralization predicts a 0.3 standard deviation dropin The Fund for Peace’s Failed States Index for 2012.36 Michalopoulos and Papaioannou(2012) have shown that pre-colonial states predict greater levels of contemporary devel-opment, as measured by the intensity of night-time lights. In Table 9, I show that histor-ical trade can be used to instrument for these ethnic institutions. Column (1) replicatesthe main result from Table 3A in their paper: conditional on controls and country fixedeffects, “ethnic” institutions predict present-day luminosity. Column (2) uses ecologi-cal diversity as an instrument for these pre-colonial states. The IV estimate is positiveand significant. This supports a causal interpretation of the results in Michalopoulosand Papaioannou (2012); ecological conditions that no longer directly influence tradepredict institutions continue to matter in the present.
7. CONCLUSION
I have used this paper to provide empirical support for Bates’s (1983) Ricardian viewof pre-colonial African states. The gains from trade stemming from ecological diver-sity predict the presence of state centralization across sub-Saharan societies recordedin the Ethnographic Atlas. Moving from a homogenous zone to one that is ecologicallydiverse predicts that the chance a society is centralized rises by more than 10 percentagepoints. There is no evidence that the effect is overstated due to endogeneity, or is dueto the influence of outliers or specific ethnographic regions. The histories of Africansocieties are consistent with this interpretation of the data, rather than one in whichstates emerge and then migrate. Similarly, area, defense of fertile islands, correlationwith dense population, risk mitigation, and ethnic competition do not explain away theresults. Ecological diversity predicts centralization outside of Africa, and continues tomatter in the present through the legacy of pre-colonial states.
What does this result add to our understanding of the link between institutions anddevelopment in the present? First, it suggests that other findings that have been inter-preted as effects of culture may operate through institutions. For example, the result inDurante (2009) that historical experience with mutual insurance leads to greater levelsof trust may arise through the institutional consequences of mutually-insuring trade.Second, institutions have heterogeneous effects on development, and part of this het-erogeneity is both path-dependent and context-specific. The mechanisms that shapedpre-colonial states in Africa continue to shape development in the present.
36In this bivariate regression, n=47, p=0.041.

22 JAMES FENSKE
REFERENCES
Acemoglu, D. (2005). Politics and economics in weak and strong states. Journal of Mon-etary Economics, 52(7):1199–1226.
Acemoglu, D., Johnson, S., and Robinson, J. (2001). The colonial origins of comparativedevelopment: An empirical investigation. American Economic Review, 91(5):1369–1401.
Acemoglu, D., Johnson, S., and Robinson, J. (2002). Reversal of Fortune: Geography andInstitutions in the Making of the Modern World Income Distribution. The QuarterlyJournal of Economics, 117(4):1231–1294.
Acemoglu, D., Johnson, S., and Robinson, J. (2003). An African Success Story: Botswana.In Search of Prosperity: Analytical Narrative on Economic Growth. Edited by Dani Ro-drik, Princeton University Press.
Acemoglu, D., Reed, T., and Robinson, J. (2012). Chiefs. Working Paper.Acemoglu, D. and Robinson, J. (2012). Why Nations Fail. Random House Digital, Inc.Acemoglu, D., Ticchi, D., and Vindigni, A. (2011). Emergence and persistence of ineffi-
cient states. Journal of the European Economic Association, 9(2):177–208.Aghion, P., Alesina, A., and Trebbi, F. (2004). Endogenous political institutions. The
Quarterly Journal of Economics, 119(2):565.Alesina, A. and Spolaore, E. (1997). On the number and size of nations. The Quarterly
Journal of Economics, 113(4):1027–1056.Alesina, A., Spolaore, E., and Wacziarg, R. (2005). Trade, growth and the size of countries.
Handbook of economic growth, 1:1499–1542.Allen, R. (1997). Agriculture and the Origins of the State in Ancient Egypt. Explorations
in Economic History, 34(2):135–154.Altonji, J., Elder, T., and Taber, C. (2005). Selection on observable and unobservable vari-
ables: Assessing the effectiveness of Catholic schools. Journal of Political Economy,113(1):151–184.
Ashraf, Q. and Michalopoulos, S. (2011). The climatic origins of the neolithic revolution:Theory and evidence. Unpublished.
Austin, G. (2008). Resources, Techniques, and Strategies South of the Sahara: Revisingthe Factor Endowments Perspective on African Economic Development, 1500-2000.The Economic History Review, 61(3):587–624.
Banerjee, A. and Iyer, L. (2005). History, institutions, and economic performance: thelegacy of colonial land tenure systems in India. The American Economic Review,95(4):1190–1213.
Bates, R. (1983). Essays on the political economy of rural Africa. University of CaliforniaPress.
Beinart, W. (2007). Transhumance, Animal Diseases and Environment in the Cape,South Africa. South African Historical Journal, 58(1):17–41.

ECOLOGY, TRADE AND STATES IN PRE-COLONIAL AFRICA 23
Besley, T. and Persson, T. (2008). Wars and state capacity. Journal of the European Eco-nomic Association, 6(2-3):522–530.
Besley, T. and Persson, T. (2009). The origins of state capacity: Property rights, taxation,and politics. The American Economic Review, 99(4):1218–1244.
Besley, T. and Persson, T. (2010). State capacity, conflict, and development. Economet-rica, 78(1):1–34.
Birmingham, D. (1976). The Forest and Savanna of Central Africa. J.E. Flint (ed.) TheCambridge History of Africa, Volume 5, c. 1790 to c. 1870, pages 222–269.
Bisson, M. (1982). Trade and Tribute. Archaeological Evidence for the Origin of States inSouth Central Africa. Cahiers d’etudes africaines, 22(87):343–361.
Bockstette, V., Chanda, A., and Putterman, L. (2002). States and markets: The advantageof an early start. Journal of Economic Growth, 7(4):347–369.
Bovill, E. (1995). The golden trade of the Moors: West African kingdoms in the fourteenthcentury. Markus Wiener Pub.
Brice, W. C. and Kennedy, H. (2001). An Historical Atlas of Islam. Leiden: Brill AcademicPublishers.
Brunnschweiler, C. and Bulte, E. (2008). The resource curse revisited and revised: Atale of paradoxes and red herrings. Journal of Environmental Economics and Man-agement, 55(3):248–264.
Bubb, R. (2009). States, law, and property rights in West Africa. Working Paper.Chanda, A. and Putterman, L. (2007). Early Starts, Reversals and Catch-up in the Process
of Economic Development. Scandinavian Journal of Economics, 109(2):387–413.Chandler, T. and Fox, G. (1974). 3000 years of urban growth. Academic Press.Damania, R., Fredriksson, P., and List, J. (2003). Trade liberalization, corruption, and
environmental policy formation: theory and evidence. Journal of Environmental Eco-nomics and Management, 46(3):490–512.
Dell, M. (2010). The Persistent Effects of Peru’s Mining Mita. Econometrica, 78(6):1863–1903.
Desmet, K., Le Breton, M., Ortuno-Ortin, I., and Weber, S. (2009). The stability andbreakup of nations: a quantitative analysis. Journal of Economic Growth, 16(3):1–31.
Dixit, A. (2004). Lawlessness and economics: alternative modes of governance. PrincetonUniversity Press.
Dollar, D. and Kraay, A. (2003). Institutions, trade, and growth. Journal of MonetaryEconomics, 50(1):133–162.
Durante, R. (2009). Risk, Cooperation and the Economic Origins of Social Trust: AnEmpirical Investigation. Job Market Paper, Brown University.
Dutt, P. (2009). Trade protection and bureaucratic corruption: an empirical investiga-tion. Canadian Journal of Economics, 42(1):155–183.
Easterly, W. and Levine, R. (1997). Africa’s growth tragedy: policies and ethnic divisions.The Quarterly Journal of Economics, 112(4):1203.

24 JAMES FENSKE
Easterly, W. and Levine, R. (2003). Tropics, germs, and crops: how endowments influ-ence economic development. Journal of Monetary Economics, 50(1):3–39.
Eltis, D. and Jennings, L. (1988). Trade between Western Africa and the Atlantic world inthe pre-colonial era. The American Historical Review, 93(4):936–959.
Engerman, S. L. and Sokoloff, K. L. (1997). Factor endowments, institutions, and differen-tial paths of growth among new world economies, pages 260–304. How Latin AmericaFell Behind. Essays on the Economic Histories of Brazil and Mexico, 1800-1914. Stan-ford University Press.
Englebert, P. (2000). Solving the Mystery of the AFRICA Dummy. World development,28(10):1821–1835.
Fenske, J. (2011a). African polygamy: past and present. Working paper.Fenske, J. (2011b). Does land abundance explain African institutions? Working paper.Flint, E. (1970). Trade and politics in Barotseland during the Kololo period. Journal of
African History, 11(1):71–86.Frankema, E. and van Waijenburg, M. (2010). African Real Wages in Asian Perspective,
1880-1940. Working Papers: Utrecht University, Centre for Global Economic History.Gennaioli, N. and Rainer, I. (2007). The modern impact of precolonial centralization in
Africa. Journal of Economic Growth, 12(3):185–234.Gennaioli, N. and Voth, H. (2011). State capacity and military conflict. Working paper.Giavazzi, F. and Tabellini, G. (2005). Economic and political liberalizations. Journal of
Monetary Economics, 52(7):1297–1330.Glennerster, R., Miguel, E., and Rothenberg, A. (2010). Collective action in diverse Sierra
Leone communities. NBER Working Paper No. 16196.Gluckman, M. (1941). Economy of the central Barotse plain. Rhodes-Livingstone Insti-
tute.Goldstein, M. and Udry, C. (2008). The profits of power: Land rights and agricultural
investment in Ghana. Journal of Political Economy, 116(6).Good, C. (1972). Salt, trade, and disease: Aspects of development in Africa’s northern
Great Lakes Region. International Journal of African Historical Studies, 5(4):543–586.Hall, R. and Jones, C. (1999). Why do some countries produce so much more output per
worker than others? The Quarterly Journal of Economics, 114(1):83–116.Harrison, A., McMillan, M., and McLaren, J. (2011). Recent Perspectives on Trade and
Inequality. Annual Review of Economics, 3(1):261–289.Head, K., Mayer, T., and Ries, J. (2010). The erosion of colonial trade linkages after inde-
pendence. Journal of International Economics, 81(1):1–14.Herbst, J. (2000). States and power in Africa: comparative lessons in authority and con-
trol. Princeton University Press.Ingham, K. (1975). The kingdom of Toro in Uganda. Methuen; New York: distributed by
Harper & Row, Barnes & Noble Import Division.

ECOLOGY, TRADE AND STATES IN PRE-COLONIAL AFRICA 25
Insoll, T. (2003). The archaeology of Islam in sub-Saharan Africa. Cambridge UniversityPress.
Iyer, L. (2010). Direct versus indirect colonial rule in India: Long-term consequences.The Review of Economics and Statistics, 92(4):693–713.
Jones, E. (1981). The European miracle: Environments, economies, and geopolitics in thehistory of Europe and Asia. Cambridge University Press.
Knack, S. and Azfar, O. (2003). Trade intensity, country size and corruption. Economicsof Governance, 4(1):1–18.
Kopytoff, I. (1964). Family and Lineage among the Suku of the Congo. The family es-tate in Africa: studies in the role of property in family structure and lineage continuity,pages 83–116.
Kopytoff, I. (1965). The Suku of Southwestern Congo. Peoples of Africa, pages 441–80.Kopytoff, I. (1967). Labor allocation among the Suku. Paper presented at conference on
competing demands for the time of labor in traditional African societies.La Porta, R., Lopez-de Silanes, F., Shleifer, A., and Vishny, R. (2000). Investor protection
and corporate governance. Journal of financial economics, 58(1-2):3–27.Law, R. (1975). A West African cavalry state: the Kingdom of Oyo. The Journal of African
History, 16(01):1–15.Law, R. (1977). The Oyo empire: c. 1600-c. 1836: a west African imperialism in the era of
the Atlantic slave trade. Clarendon press.Levzion, N. (1975). The Western Maghrib and Sudan. In Gray, R., editor, The Cambridge
history of Africa: from c. 1600 to c. 1790, pages 331–462. Cambridge University Press.Lopez-Cordova, J. and Meissner, C. (2005). The globalization of trade and democracy,
1870-2000. NBER Working Paper No. 11117.Lovejoy, P. (1978). The role of the Wangara in the economic transformation of the cen-
tral sudan in the fifteenth and sixteenth centuries. The Journal of African History,19(02):173–193.
Lovejoy, P. and Baier, S. (1975). The desert-side economy of the central Sudan. TheInternational Journal of African Historical Studies, 8(4):551–581.
Maddala, G. (1986). Limited-dependent and qualitative variables in econometrics. Cam-bridge University Press.
Mamdani, M. (1996). Citizen and subject: Contemporary Africa and the legacy of latecolonialism. Princeton University Press.
McCann, J. (1999). Green land, brown land, black land: an environmental history ofAfrica, 1800-1990. James Currey.
Mehlum, H., Moene, K., and Torvik, R. (2006). Institutions and the resource curse. TheEconomic Journal, 116(508):1–20.
Michalopoulos, S. (2011). The Origins of Ethnnolinguistic Diversity. Forthcoming in theAmerican Economic Review.
26 JAMES FENSKE
Michalopoulos, S., Naghavi, A., and Prarolo, G. (2010). Trade and geography in the eco-nomic origins of Islam: theory and evidence. Fondazione Eni Enrico Mattei.
Michalopoulos, S. and Papaioannou, E. (2011). The Long-Run Effects of the Scramblefor Africa. NBER Working Paper No. 17620.
Michalopoulos, S. and Papaioannou, E. (2012). Pre-colonial Ethnic Institutions andContemporary African Development. Forthcoming in Econometrica.
Miguel, E. and Gugerty, M. (2005). Ethnic diversity, social sanctions, and public goodsin Kenya. Journal of Public Economics, 89(11-12):2325–2368.
Miguel, E., Satyanath, S., and Sergenti, E. (2004). Economic shocks and civil conflict: Aninstrumental variables approach. Journal of Political Economy, 112(4):725–753.
Moav, O., Neeman, Z., and Mayshar, J. (2011). Transparency, Appropriability and theEarly State. CEPR Discussion Paper 8548.
Montalvo, J. and Reynal-Querol, M. (2005a). Ethnic diversity and economic develop-ment. Journal of Development economics, 76(2):293–323.
Montalvo, J. and Reynal-Querol, M. (2005b). Ethnic polarization, potential conflict, andcivil wars. American Economic Review, 95(3):796–816.
Morton-Williams, P. (1969). The influence of habitat and trade on the polities of Oyoand Ashanti. In Man in Africa, pages 79–98. Tavistock Publications.
Murdock, G. (1959). Africa: Its Peoples and Their Culture History. Nueva York.Murdock, G. (1967). Ethnographic Atlas. University of Pittsburgh Press.Neumark, S. (1977). Trans-Saharan Trade in the Middle Ages. An Economic History of
Tropical Africa: Vol 1. The pre-colonial period, pages 127–131.Nunn, N. (2007). Relationship-specificity, incomplete contracts, and the pattern of
trade. The Quarterly Journal of Economics, 122(2):569–600.Nunn, N. (2008). The Long-Term Effects of Africa’s Slave Trades. Quarterly Journal of
Economics, 123(1):139–176.Oliver, R. and Fage, J. (1962). A short History of Africa. Harmondsworth: Penguin.Olson, M. (1993). Dictatorship, democracy, and development. American Political Sci-
ence Review, 87(3):567–576.Olsson, O. and Hibbs, D. (2005). Biogeography and long-run economic development.
European Economic Review, 49(4):909–938.Osafo-Kwaako, P. and Robinson, J. A. (2012). Political Centralization in Pre-Colonial
Africa. Working Paper.Papaioannou, E. and Siourounis, G. (2008). Economic and social factors driving the
third wave of democratization. Journal of Comparative Economics, 36(3):365–387.Prado, M. and Dincecco, M. (2012). Warfare, fiscal capacity, and performance. Forth-
coming in the Journal of Economic Growth.Rauch, J. and Evans, P. (2000). Bureaucratic structure and bureaucratic performance in
less developed countries. Journal of Public Economics, 75(1):49–71.

ECOLOGY, TRADE AND STATES IN PRE-COLONIAL AFRICA 27
Robinson, J. (2002). States and Power in Africa by Jeffrey I. Herbst: A review essay. Jour-nal of Economic Literature, 40(2):510–519.
Rodney, W. (1972). How Europe Underdeveloped Africa. Bogle-L’Ouverture Publications.Rodrik, D., Subramanian, A., and Trebbi, F. (2004). Institutions Rule: The Primacy Of
Institutions Over Geography And Integration In Economic Development. Journal ofEconomic Growth, 9(2):131–165.
Sachs, J. and Warner, A. (2001). The curse of natural resources. European EconomicReview, 45(4):827–838.
Sequeira, S. (2011). Displacing corruption. Working paper.Shillington, K. (1989). History of Africa. Bedford Books.Spencer, C. (1998). A mathematical model of primary state formation. Cultural Dynam-
ics, 10(1):5–20.Spencer, C. (2010). Territorial expansion and primary state formation. Proceedings of
the National Academy of Sciences, 107(16):7119–7126.Sundstrom, L. (1974). The exchange economy of pre-colonial tropical Africa. C. Hurst &
Co. Publishers.Taylor, B. (1962). The western lacustrine Bantu. London: International African Institute.Tertilt, M. (2005). Polygyny, fertility, and savings. Journal of Political Economy,
113(6):1341–1374.Tilly, C. (1992). Coercion, capital, and European states, AD 990-1992. Blackwell.Treisman, D. (2000). The causes of corruption: a cross-national study. Journal of Public
Economics, 76(3):399–458.Vansina, J. (1966). Kingdoms of the Savanna. University of Wisconsin Press London.White, F. (1983). The vegetation of Africa: a descriptive memoir to accompany the UN-
ESCO/AETFAT/UNSO vegetation map of Africa. Natural resources research, 20:1–356.Wilson, A. (1972). Long distance trade and the Luba Lomami Empire. The Journal of
African History, 13(04):575–589.Wooldridge, J. (2002). Econometric analysis of cross section and panel data. The MIT
press.
APPENDIX A. MODEL
An ethnic group exists on a unit interval, stretching from 0 to 1. The natural ruler ofthe ethnic group lives at point 0. He chooses S ∈ [0, 1], the fraction of the ethnic group’sterritory to bring under his direct jurisdiction. That is, he will choose the level of statecentralization. He will do this in order to tax the inhabitants in their trading activities.I will show that greater gains from trade will lead him to centralize a larger fraction ofgroup’s territory.
The territory is inhabited by a continuum of agents of mass 1. They are spread uni-formly over the interval. Each of these agents chooses between one of two activities:farming and trading. The returns from farming are normalized to 1. Farming cannot be
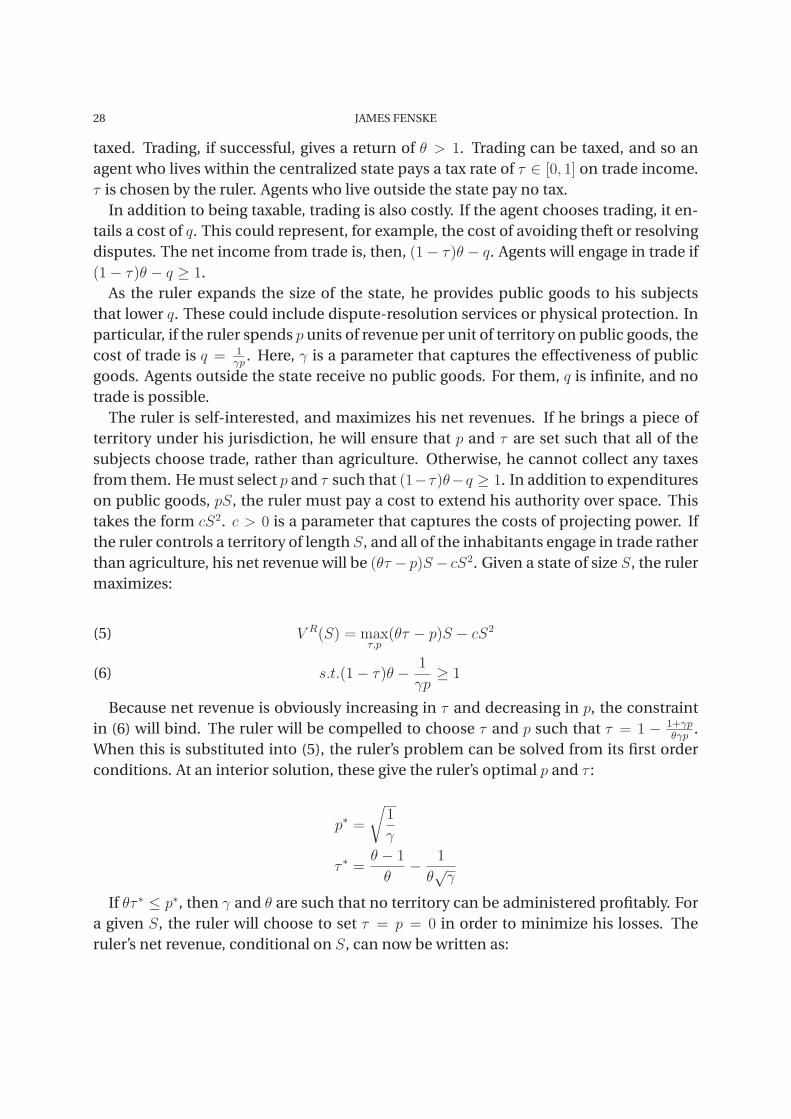
28 JAMES FENSKE
taxed. Trading, if successful, gives a return of θ > 1. Trading can be taxed, and so anagent who lives within the centralized state pays a tax rate of τ ∈ [0, 1] on trade income.τ is chosen by the ruler. Agents who live outside the state pay no tax.
In addition to being taxable, trading is also costly. If the agent chooses trading, it en-tails a cost of q. This could represent, for example, the cost of avoiding theft or resolvingdisputes. The net income from trade is, then, (1− τ)θ − q. Agents will engage in trade if(1− τ)θ − q ≥ 1.
As the ruler expands the size of the state, he provides public goods to his subjectsthat lower q. These could include dispute-resolution services or physical protection. Inparticular, if the ruler spends p units of revenue per unit of territory on public goods, thecost of trade is q = 1
γp. Here, γ is a parameter that captures the effectiveness of public
goods. Agents outside the state receive no public goods. For them, q is infinite, and notrade is possible.
The ruler is self-interested, and maximizes his net revenues. If he brings a piece ofterritory under his jurisdiction, he will ensure that p and τ are set such that all of thesubjects choose trade, rather than agriculture. Otherwise, he cannot collect any taxesfrom them. He must select p and τ such that (1−τ)θ−q ≥ 1. In addition to expenditureson public goods, pS, the ruler must pay a cost to extend his authority over space. Thistakes the form cS2. c > 0 is a parameter that captures the costs of projecting power. Ifthe ruler controls a territory of length S, and all of the inhabitants engage in trade ratherthan agriculture, his net revenue will be (θτ − p)S− cS2. Given a state of size S, the rulermaximizes:
V R(S) = maxτ,p
(θτ − p)S − cS2(5)
s.t.(1− τ)θ − 1
γp≥ 1(6)
Because net revenue is obviously increasing in τ and decreasing in p, the constraintin (6) will bind. The ruler will be compelled to choose τ and p such that τ = 1 − 1+γp
θγp.
When this is substituted into (5), the ruler’s problem can be solved from its first orderconditions. At an interior solution, these give the ruler’s optimal p and τ :
p∗ =
√1
γ
τ ∗ =θ − 1
θ− 1
θ√γ
If θτ ∗ ≤ p∗, then γ and θ are such that no territory can be administered profitably. Fora given S, the ruler will choose to set τ = p = 0 in order to minimize his losses. Theruler’s net revenue, conditional on S, can now be written as:

ECOLOGY, TRADE AND STATES IN PRE-COLONIAL AFRICA 29
V R(S) = max
{(θ − 2
√1
γ− 1
)S − cS2,−cS2
}
If the ruler maximizes this with respect to S, the degree of state centralization thatmaximizes the ruler’s self interest is:
S∗ = min
{1,max
{1
2c
(θ − 2
√1
γ− 1
), 0
}}(7)
Define θL as the value of θ that solves θτ ∗ = p∗. This is the minimum θ for whichany state centralization is profitable. Below this threshold, the ruler does not bring anyof the ethnic group’s territory under his control. Similarly, define θH as the level of θ forwhich S∗ = 1. For this level of θ and above, the ruler centralizes the entire territory. If θ ∈(θL, θH), three results hold that highlight mechanisms by which ecologically-determinedgains from trade spurred state centralization in pre-colonial Africa:
(1) ∂S∗∂θ
> 0. Greater gains from trade will directly increase the profitability of statecentralization.
(2) ∂S∗∂c
< 0. If greater access to trade makes it cheaper to project authority overspace, centralization will increase.
(3) ∂S∗∂γ
> 0. If access to trade makes the ruler more effective at providing publicgoods, state centralization becomes more profitable.

(1) (2) (3) (4) (5)Mean s.d. Min Max N
State centralization 1.15 0.93 0 4 440Any centralization 0.73 0.44 0 1 440Local state 2.91 0.68 2 4 439Class stratification 1.25 1.41 0 4 364Headman appointed 0.066 0.25 0 1 320Light density 1.50 0.18 1.15 3.34 440
Ecological diversity 0.30 0.23 0 0.80 440Eco. Div. (FAO) 0.47 0.23 0 0.80 440Ecological polarization 0.51 0.38 0 1.00 440Dist. ecological boundary 0.45 0.53 0.019 2.95 440Any diversity 0.78 0.42 0 1 440Salt 0.42 0.88 0 6 440Gold production 0.34 1.86 0 24 440Iron production 0.12 0.33 0 1 440% dep. on fishing 8.32 10.9 0 70 440
Major river 0.23 0.42 0 1 440Ag. constraints 5.41 1.06 2.94 8.92 440Dist. coast 5.54 3.76 0 14.9 440Elevation 728 520 -7.41 2,308 440Malaria 0.83 0.27 0 1 440Precipitation 846 468 0 2,474 440Ruggedness 71,792 70,413 0 421,381 440Temperature 8,882 1,112 5,295 10,699 440Dist. L. Victoria 2,198 1,438 131 5,708 440Date observed 1,919 21.6 1,830 1,960 440Dist. Atlantic ST 6,688 1,515 3,671 9,949 440Dist. Indian ST 4,546 1,589 1,028 7,953 440Dist. Saharan ST 3,333 975 806 6,999 440Dist. Red ST 2,887 1,360 107 5,773 440Crop: None 0.025 0.16 0 1 440Crop: Trees 0.084 0.28 0 1 440Crop: Roots/tubers 0.19 0.39 0 1 440
Log rainfall range 5.18 1.01 1.39 7.42 370Area 2.43 3.64 8.2e-06 27.0 440Pop. density 22.2 28.5 0 311 440Ag. constraints range 4.66 1.95 0 9 440Subsistence diversity 0.52 0.12 0.13 0.74 440
Other variables used
Table 1. Summary Statistics
Outcomes
Gains from trade
Controls
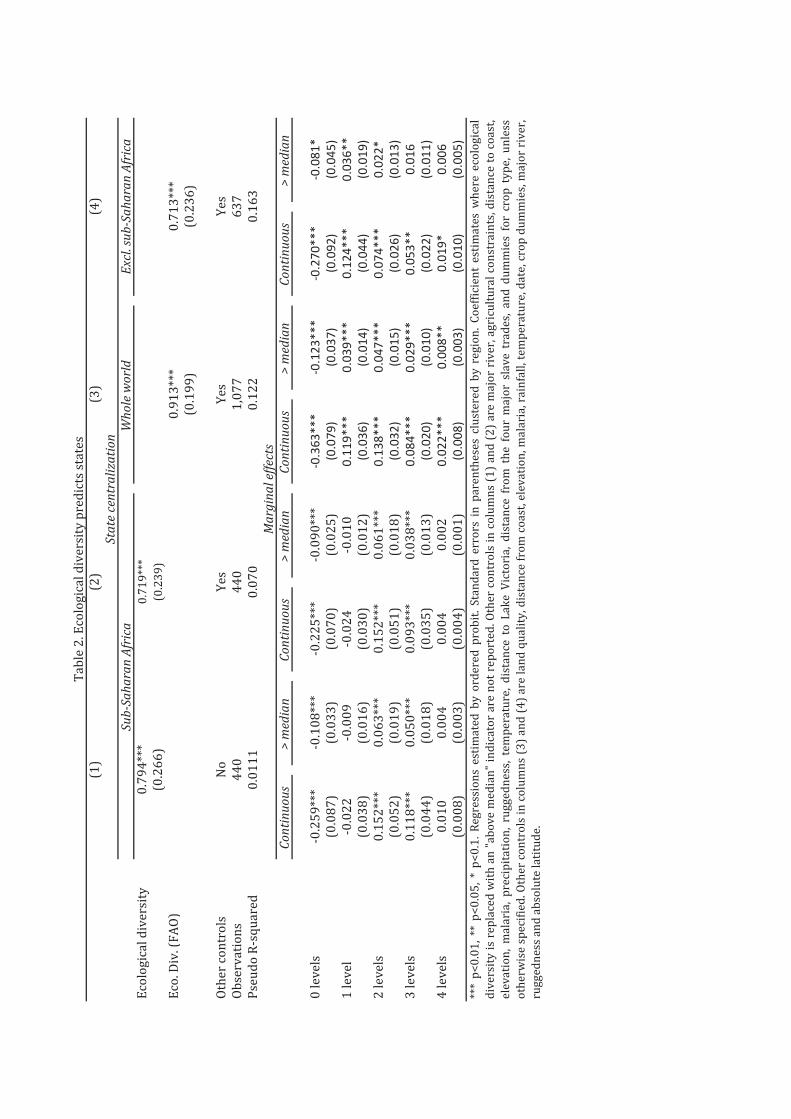
Ecol
ogic
al d
iver
sity
Eco.
Div
. (FA
O)
Othe
r con
trol
sOb
serv
atio
nsPs
eudo
R-s
quar
ed
Cont
inuo
us>
med
ian
Cont
inuo
us>
med
ian
Cont
inuo
us>
med
ian
Cont
inuo
us>
med
ian
0 le
vels
-0.2
59**
*-0
.108
***
-0.2
25**
*-0
.090
***
-0.363
***
-0.123
***
-0.270
***
-0.081
*(0
.087
)(0
.033
)(0
.070
)(0
.025
)(0.079
)(0.037
)(0.092
)(0.045
)1
leve
l-0
.022
-0.0
09-0
.024
-0.0
100.11
9***
0.03
9***
0.12
4***
0.03
6**
(0.0
38)
(0.0
16)
(0.0
30)
(0.0
12)
(0.036
)(0.014
)(0.044
)(0.019
)2
leve
ls0.
152*
**0.
063*
**0.
152*
**0.
061*
**0.13
8***
0.04
7***
0.07
4***
0.02
2*(0
.052
)(0
.019
)(0
.051
)(0
.018
)(0.032
)(0.015
)(0.026
)(0.013
)3
leve
ls0.
118*
**0.
050*
**0.
093*
**0.
038*
**0.08
4***
0.02
9***
0.05
3**
0.01
6(0
.044
)(0
.018
)(0
.035
)(0
.013
)(0.020
)(0.010
)(0.022
)(0.011
)4
leve
ls0.
010
0.00
40.
004
0.00
20.02
2***
0.00
8**
0.01
9*0.00
6(0
.008
)(0
.003
)(0
.004
)(0
.001
)(0.008
)(0.003
)(0.010
)(0.005
)**
*p<
0.01
,**
p<0.
05,*
p<0.
1.Re
gres
sions
estim
ated
byor
dere
dpr
obit.
Stan
dard
erro
rsin
pare
nthe
ses
clust
ered
byre
gion
.Coe
fficie
ntes
timat
esw
here
ecol
ogica
ldi
vers
ityis
repl
aced
with
an"a
bove
med
ian"
indi
cato
rare
notr
epor
ted.
Othe
rcon
trol
sin
colu
mns
(1)a
nd(2
)are
maj
orriv
er,a
gric
ultu
ralc
onst
rain
ts,d
istan
ceto
coas
t,el
evat
ion,
mal
aria
,pre
cipita
tion,
rugg
edne
ss,t
empe
ratu
re,d
istan
ceto
Lake
Vict
oria
,dist
ance
from
the
four
maj
orsla
vetr
ades
,and
dum
mie
sfo
rcr
opty
pe,u
nles
sot
herw
isesp
ecifi
ed.O
ther
cont
rols
inco
lum
ns(3
)and
(4)a
rela
ndqu
ality
,dist
ance
from
coas
t,el
evat
ion,
mal
aria
,rai
nfal
l,te
mpe
ratu
re,d
ate,
crop
dum
mie
s,m
ajor
river
,ru
gged
ness
and
abso
lute
latit
ude.
(3)
(4)
Tabl
e 2. E
colo
gica
l div
ersit
y pr
edic
ts st
ates
Mar
gina
l effe
cts
0.12
20.
163
Stat
e ce
ntra
lizat
ion
(0.1
99)
(0.2
36)
Yes
Yes
1,07
763
7
Who
le w
orld
0.01
110.
070
Exc
l. su
b-Sa
hara
n A
fric
a
0.91
3***
0.71
3***
0.79
4***
(0.2
66)
0.71
9***
(0.2
39)
Sub-
Saha
ran
Afr
ica
(1)
(2)
No 440
Yes
440

(1)
(2)
(3)
(4)
(5)
(6)
(7)
(8)
Any
cent
.Ce
nt. >
1Ec
olog
ical
div
ersit
y0.
272*
*0.
271*
**(0
.126
)(0
.096
)Di
st. e
colo
gica
l bou
ndar
y-0
.303
***
(0.0
69)
Ecol
ogic
al p
olar
izat
ion
0.37
0***
(0.1
32)
Any
dive
rsity
0.35
5**
(0.1
45)
Ecol
ogic
al d
iver
sity
(Sim
pler
clas
ses)
0.80
6**
(0.3
16)
Ecol
ogic
al d
iver
sity
(Hig
h de
nsity
area
s)0.
643*
**(0
.210
)Ec
o. D
iv. (
FAO)
0.99
6***
(0.2
81)
Othe
r con
trol
sYe
sYe
sYe
sYe
sYe
sYe
sYe
sYe
sOb
serv
atio
ns44
044
044
044
044
044
044
044
0
Stat
e ce
ntra
lizat
ion
***
p<0.
01,*
*p<
0.05
,*p<
0.1.
Regr
essio
nses
timat
edby
orde
red
prob
itw
ithco
effic
ient
sre
port
ed,e
xcep
twith
"any
cent
raliz
atio
n"as
the
outc
ome,
inw
hich
case
prob
itis
used
with
mar
gina
leffe
ctsr
epor
ted.
Stan
dard
erro
rsin
pare
nthe
sesc
lust
ered
byre
gion
.Oth
erco
ntro
lsar
emaj
orriv
er,a
gric
ultu
ralc
onst
rain
ts,d
istan
ceto
coas
t,el
evat
ion,
mal
aria
,pre
cipi
tatio
n,ru
gged
ness
, tem
pera
ture
, dist
ance
to L
ake V
ictor
ia, d
istan
ce fr
om th
e fou
r maj
or sl
ave t
rade
s, an
d du
mm
ies f
or cr
op ty
pe, u
nles
s oth
erw
ise sp
ecifi
ed.
Tabl
e 3. T
he m
ain
resu
lt ho
lds w
ith al
tern
ativ
e mea
sure
s of s
tate
s and
div
ersit
y

(1) (2) (3) (4)
Ecological diversity 0.559*** 0.606*** 2.676*** 3.840***(0.167) (0.188) (0.949) (1.472)
Other controls Yes Yes Yes YesObservations 440 370 440 370F-statistic 66.80 16.17
(5) (6) (7) (8)
Log rainfall range 0.090*** 0.185** 0.034*** 0.048***(0.029) (0.076) (0.004) (0.011)
Other controls Yes Yes Yes YesObservations 440 370 440 370
IV
OLS: First Stage
*** p<0.01, ** p<0.05, * p<0.1. Standard errors in parentheses clustered by region.Other controls are major river, agricultural constraints, distance to coast, elevation,malaria, precipitation, ruggedness, temperature, distance to Lake Victoria, distancefrom the four major slave trades, and dummies for crop type, unless otherwisespecified. The excluded instrument is the log rainfall range. In columns 3, 5, and 7,missing values of the log rainfall range are recoded to zero. In columns 2, 4, 6, and 8,these observations are excluded.
Table 4. The main result is robust to reverse causation
Ecological diversity
OLS: Reduced form
OLS: Baseline
State centralization
State centralization
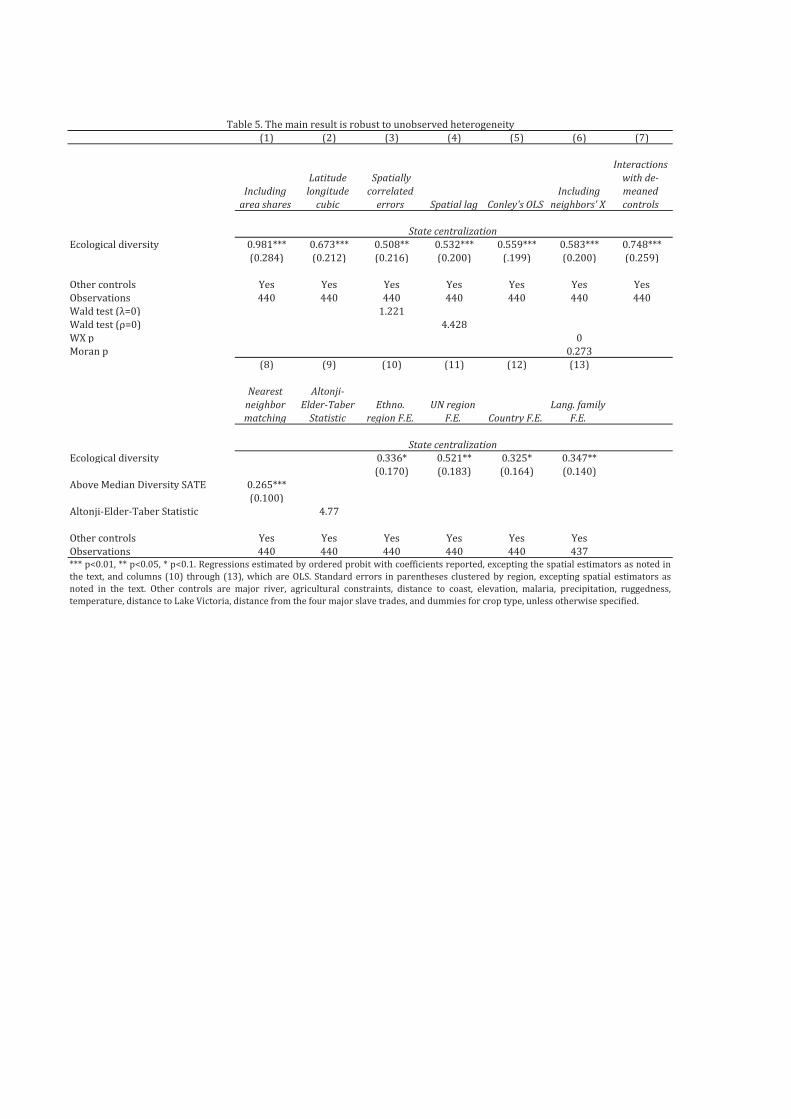
(1) (2) (3) (4) (5) (6) (7)
Including area shares
Latitude longitude
cubic
Spatially correlated
errors Spatial lag Conley's OLS Including
neighbors' X
Interactions with de-meaned controls
Ecological diversity 0.981*** 0.673*** 0.508** 0.532*** 0.559*** 0.583*** 0.748***(0.284) (0.212) (0.216) (0.200) (.199) (0.200) (0.259)
Other controls Yes Yes Yes Yes Yes Yes YesObservations 440 440 440 440 440 440 440Wald test (λ=0) 1.221Wald test (ρ=0) 4.428WX p 0Moran p 0.273
(8) (9) (10) (11) (12) (13)
Nearest neighbor matching
Altonji-Elder-Taber
StatisticEthno.
region F.E.UN region
F.E. Country F.E.Lang. family
F.E.
Ecological diversity 0.336* 0.521** 0.325* 0.347**(0.170) (0.183) (0.164) (0.140)
Above Median Diversity SATE 0.265***(0.100)
Altonji-Elder-Taber Statistic 4.77
Other controls Yes Yes Yes Yes Yes YesObservations 440 440 440 440 440 437
Table 5. The main result is robust to unobserved heterogeneity
*** p<0.01, ** p<0.05, * p<0.1. Regressions estimated by ordered probit with coefficients reported, excepting the spatial estimators as noted inthe text, and columns (10) through (13), which are OLS. Standard errors in parentheses clustered by region, excepting spatial estimators asnoted in the text. Other controls are major river, agricultural constraints, distance to coast, elevation, malaria, precipitation, ruggedness,temperature, distance to Lake Victoria, distance from the four major slave trades, and dummies for crop type, unless otherwise specified.
State centralization
State centralization

(1)
(2)
(3)
(4)
(5)
Art
ifici
al
coun
trie
sA
rtifi
cial
co
untr
ies
Dro
p A
rea
Q1
Dro
p A
rea
Q5
Dro
p A
rea
Q1
and
Q5
Ecol
ogic
al d
iver
sity
0.45
0***
0.41
8***
0.89
0***
0.67
1**
0.98
2***
(0.1
14)
(0.1
20)
(0.2
74)
(0.2
64)
(0.2
88)
No. o
f Eth
nic G
roup
s0.
105*
**(0
.039
)
Othe
r con
trol
sYe
sYe
sYe
sYe
sYe
sOb
serv
atio
ns15
2315
2344
044
044
0(6
)(7
)(8
)(9
)
Ecol
ogic
al d
iver
sity
0.68
6***
0.54
8**
0.69
7***
0.73
1***
(0.2
33)
(0.2
59)
(0.2
34)
(0.2
40)
Area
0.01
9(0
.023
)Ag
. Con
stra
ints
Ran
ge0.
065*
(0.0
36)
Pop.
den
sity
0.00
1(0
.002
)Su
bsist
ence
div
ersit
y-0
.328
(0.5
57)
Othe
r con
trol
sYe
sYe
sYe
sYe
sOb
serv
atio
ns44
044
044
044
0**
*p<0
.01,
**p<
0.05
,*p<
0.1.
Regr
essio
nses
timat
edby
orde
red
prob
itw
ithco
effic
ient
srep
orte
d.St
anda
rder
rors
inpa
rent
hese
scl
uste
red
byre
gion
.Oth
erco
ntro
lsar
em
ajor
river
,agr
icul
tura
lcon
stra
ints
,dist
ance
toco
ast,
elev
atio
n,m
alar
ia,p
reci
pita
tion,
rugg
edne
ss,t
empe
ratu
re,d
istan
ceto
Lake
Vict
oria
,dist
ance
from
the
four
maj
orsla
vetr
ades
,and
dum
mie
sfor
crop
type
,unl
ess
othe
rwise
spec
ified
.
Tabl
e 6. T
he R
icar
dian
inte
rpre
tatio
n be
tter e
xpla
ins t
he m
ain
resu
lt th
an si
x alte
rnat
ives
Stat
e ce
ntra
lizat
ion
Stat
e ce
ntra
lizat
ion
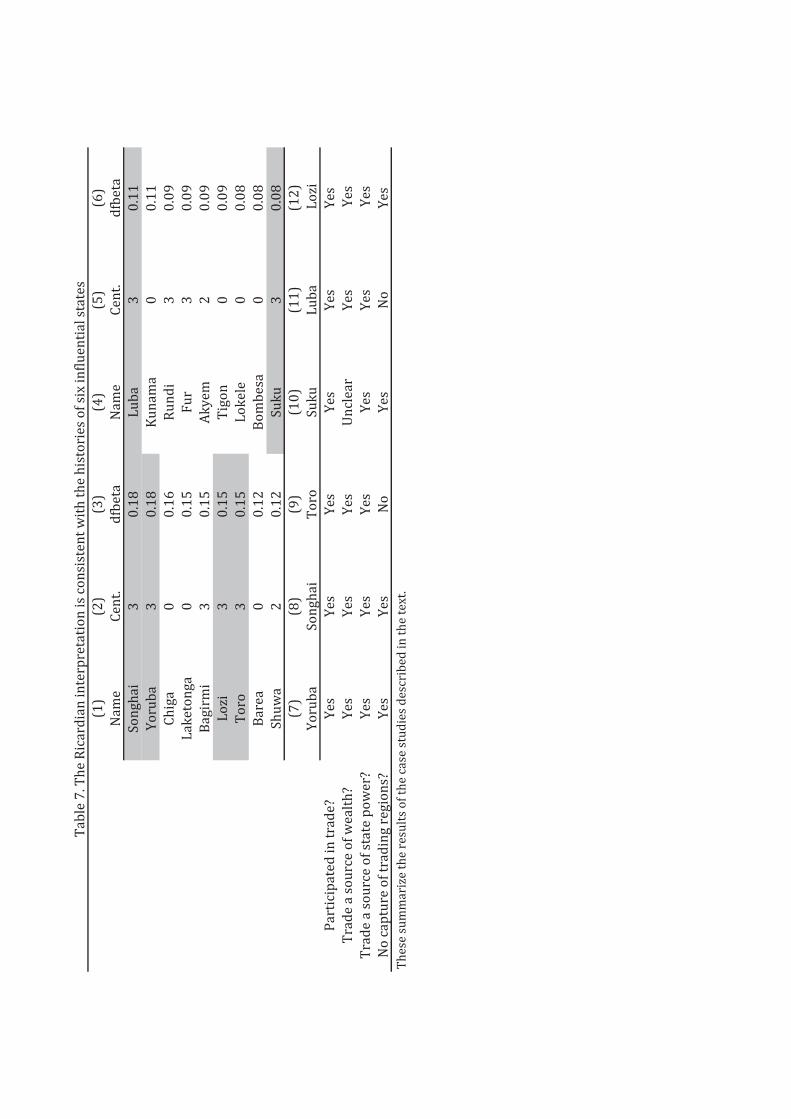
(1)
(2)
(3)
(4)
(5)
(6)
Nam
eCe
nt.
dfbe
taNa
me
Cent
.df
beta
Song
hai
30.
18Lu
ba3
0.11
Yoru
ba3
0.18
Kuna
ma
00.
11Ch
iga
00.
16Ru
ndi
30.
09La
keto
nga
00.
15Fu
r3
0.09
Bagi
rmi
30.
15Ak
yem
20.
09Lo
zi3
0.15
Tigo
n0
0.09
Toro
30.
15Lo
kele
00.
08Ba
rea
00.
12Bo
mbe
sa0
0.08
Shuw
a2
0.12
Suku
30.
08(7
)(8
)(9
)(1
0)(1
1)(1
2) Y
orub
a So
ngha
i T
oro
Suku
L
uba
Loz
iPa
rtici
pate
d in
trad
e? Y
es
Yes
Y
es
Yes
Y
es
Yes
Tr
ade a
sour
ce o
f wea
lth?
Yes
Y
es
Yes
Un
clear
Yes
Y
esTr
ade a
sour
ce o
f sta
te p
ower
? Y
es
Yes
Y
es
Yes
Y
es
Yes
No ca
ptur
e of t
radi
ng re
gion
s? Y
es
Yes
N
o Y
es
No
Yes
Th
ese s
umm
ariz
e the
resu
lts o
f the
case
stud
ies d
escr
ibed
in th
e tex
t.
Tabl
e 7. T
he R
icar
dian
inte
rpre
tatio
n is
cons
isten
t with
the h
istor
ies o
f six
influ
entia
l sta
tes
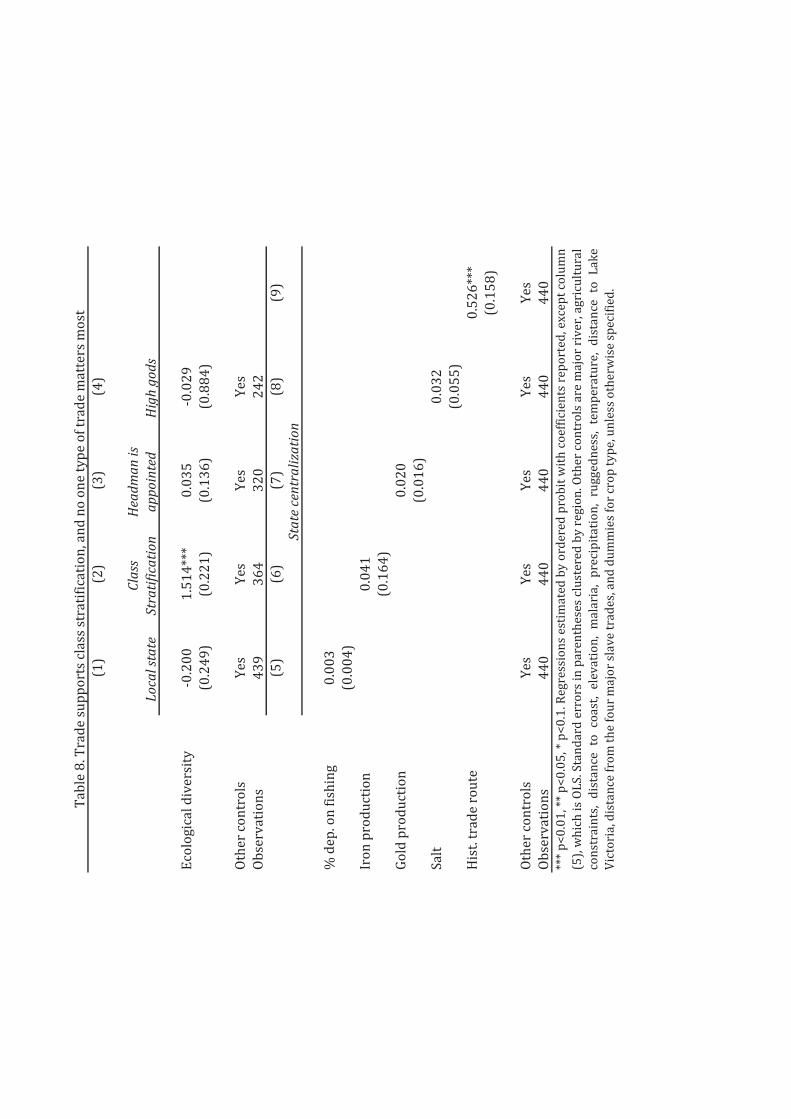
(1)
(2)
(3)
(4)
Loca
l sta
teCl
ass
Stra
tific
atio
nH
eadm
an is
ap
poin
ted
Hig
h go
ds
Ecol
ogic
al d
iver
sity
-0.2
001.
514*
**0.
035
-0.0
29(0
.249
)(0
.221
)(0
.136
)(0
.884
)
Othe
r con
trol
sYe
sYe
sYe
sYe
sOb
serv
atio
ns43
936
432
024
2(5
)(6
)(7
)(8
)(9
)
% d
ep. o
n fis
hing
0.00
3(0
.004
)Ir
on p
rodu
ctio
n0.
041
(0.1
64)
Gold
pro
duct
ion
0.02
0(0
.016
)Sa
lt0.
032
(0.0
55)
Hist
. tra
de ro
ute
0.52
6***
(0.1
58)
Othe
r con
trol
sYe
sYe
sYe
sYe
sYe
sOb
serv
atio
ns44
044
044
044
044
0
Stat
e ce
ntra
lizat
ion
***p
<0.0
1,**
p<0.
05,*
p<0.
1.Re
gres
sions
estim
ated
byor
dere
dpr
obit
with
coef
ficie
ntsr
epor
ted,
exce
ptco
lum
n(5
),w
hich
isOL
S.St
anda
rder
rors
inpa
rent
hese
sclu
ster
edby
regi
on.O
ther
cont
rols
arem
ajor
river
,agr
icul
tura
lco
nstr
aint
s,di
stan
ceto
coas
t,el
evat
ion,
mal
aria
,pr
ecip
itatio
n,ru
gged
ness
,te
mpe
ratu
re,
dist
ance
toLa
keVi
ctor
ia, d
istan
ce fr
om th
e fou
r maj
or sl
ave t
rade
s, an
d du
mm
ies f
or cr
op ty
pe, u
nles
s oth
erw
ise sp
ecifi
ed.
Tabl
e 8. T
rade
supp
orts
clas
s str
atifi
catio
n, an
d no
one
type
of t
rade
mat
ters
mos
t

(1) (2)OLS IV
State centralization 0.279*** 0.810**(0.066) (0.361)
Other controls Yes YesCountry FE Yes YesKleibergen-Paap F 12.09Observations 683 683
Table 9. Ecological diversity is an instrument for state centralization
*** p<0.01, ** p<0.05, * p<0.1. Standard errors in parentheses clustered by region.Other controls are distance to capital, distance to coast, distance to border, logwater area, log land area, elevation, suitability for agriculture, malaria ecology,petroleum and diamonds.
Light Density