Cryosphere Part 1: The Arctic Global Environmental Change – Lecture 5 Spring 2014.
108
Cryosphere Part 1: The Arctic Global Environmental Change – Lecture 5 Spring 2014
-
Upload
sophie-hood -
Category
Documents
-
view
218 -
download
0
Transcript of Cryosphere Part 1: The Arctic Global Environmental Change – Lecture 5 Spring 2014.

Cryosphere Part 1: The Arctic
Global Environmental Change – Lecture 5 Spring 2014

What is the Cryosphere?• The National Snow & Ice Data Center explains that some
places on Earth are so cold that water is a solid—ice or snow
• Scientists call these frozen places of our planet the "cryosphere"
• The word "cryosphere" comes from the Greek word for cold, "kryos“
• This is important because the cryosphere influences the climate of the entire world, and it is home to people, plants and animals
2

Regions of the Cryosphere• Arctic
• Greenland
• Antarctica
• Third Pole
• Frozen Ground
• Glaciers
• Sea Ice
• Ice Shelves and Icebergs
3

Tour of the Cryosphere
4

Basic Scientific Background• Before examining the cryosphere in more detail, it
will be useful to examine some basic concepts Feedback Albedo
5

Feedback Mechanism• Any process that acts to oppose or amplify changes to a
system that is in a steady state
• Feedback is a process whereby some proportion or in general, function, of the output signal of a system is passed (fed back) to the input
• The response is often proportional That is, as the system deviates more from the steady state position, the
faster the process works to counteract it
6

7
Homeostasis• Property of an open system, especially living
organisms, to regulate its internal environment so as to maintain a stable condition, by means of multiple dynamic equilibrium adjustments controlled by interrelated regulation mechanisms
• Term was coined in 1932 by Walter Cannon from the Greek roots homo- (same, like) and sta- (to stand or stay)
8
Negative Feedback• A type of feedback, during which a system
responds so as to reverse the direction of change
• Since this process tends to keep things constant, it is stabilizing and attempts to maintain homeostasis

9
Negative Feedback Example – A Ball Rolling Inside a Curved Bowl
• Initially, the ball oscillated from side-to-side, rising far up the sides of the bowl• With time, the amplitude of the motion decreases until the ball comes to rest at
the bottom of the bowl• Once stationary, the ball has reached a position of stability

10
Positive Feedback – Microphone Screech
• Small sounds picked up by the microphone are amplified by the nearby speaker, where the microphone once again picks up the amplified sound and rebroadcasts it through the speakers
• This looping continues until the initially tiny sound is re-amplified repeatedly to a piercing squeal

Audio Feedback
• An example of microphone-speaker feedback11

12
Nuclear Chain Reaction

13
Cybernetic Systems• From the Greek kubernetes, meaning a
steersman
• Cybernetics means the branch of study concerned with self-regulating systems using communication and control in either mechanical devices or living biological organisms

14
Cybernetic System Components• Sensor
• Amplifier
• Controller

15
Instrument vs. Man
• Cybernetic control by electrical system • Cybernetic control by
human brain

Albedo• Albedo is the fraction of solar energy (shortwave
radiation) reflected from the Earth back into space
• It is a measure of the reflectivity of the earth's surface
16

Effect of Albedo Change• Ice, especially with snow on top
of it, has a high albedo: most sunlight hitting the surface bounces back towards space
• Water is much more absorbent and less reflective
• So, if there is a lot of water, more solar radiation is absorbed by the ocean than when ice dominates
17
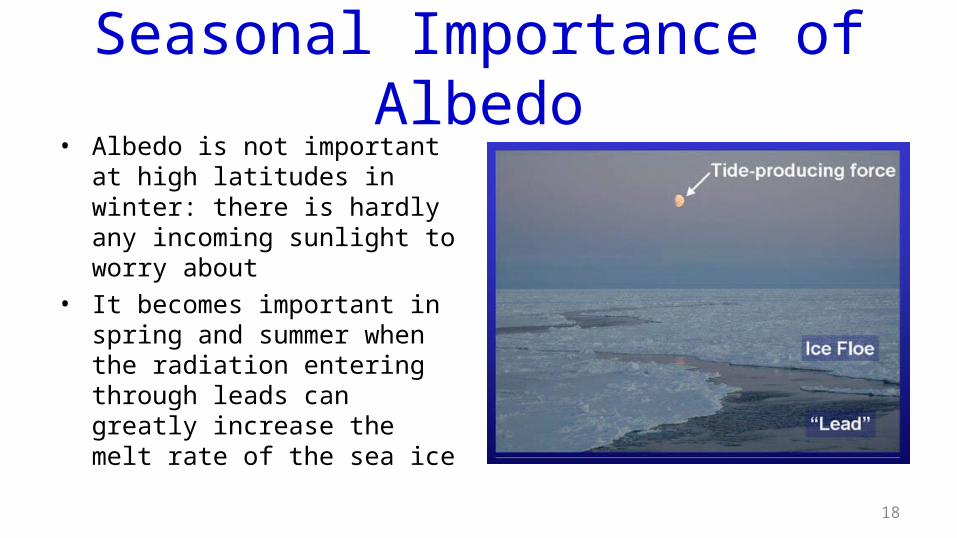
Seasonal Importance of Albedo• Albedo is not important at high
latitudes in winter: there is hardly any incoming sunlight to worry about
• It becomes important in spring and summer when the radiation entering through leads can greatly increase the melt rate of the sea ice
18
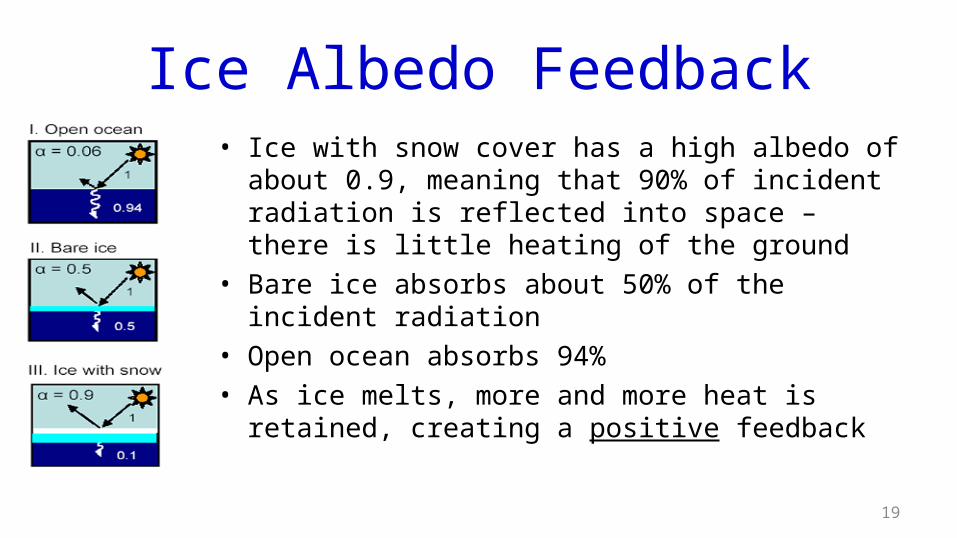
Ice Albedo Feedback• Ice with snow cover has a high albedo of about 0.9,
meaning that 90% of incident radiation is reflected into space – there is little heating of the ground
• Bare ice absorbs about 50% of the incident radiation
• Open ocean absorbs 94%
• As ice melts, more and more heat is retained, creating a positive feedback
19

Ice-Albedo Feedback Summary
• The Ice-Albedo feedback can work in reverse
• If climate starts to cool, snow accumulates, turns to ice, and reflects more light back into space
• This further cools the surface and the air above it
• Either in forward or reverse, ice-albedo is a positive feedback, amplifying the input perturbation
20

High-Latitude Climate Sensitivity• The high latitudes, particularly the Arctic, are predicted by all the
Global Circulation Models to be much more sensitive to climate change then the temperate and tropical regions
• This is currently observed
• It is largely a result of the ice-albedo feedback
• It is estimated that the Arctic will see 2-4 times the as much warming as the global average
• Sea ice changes have a very obvious effect on the large changes climate changes seen in the Greenland ice cores
21
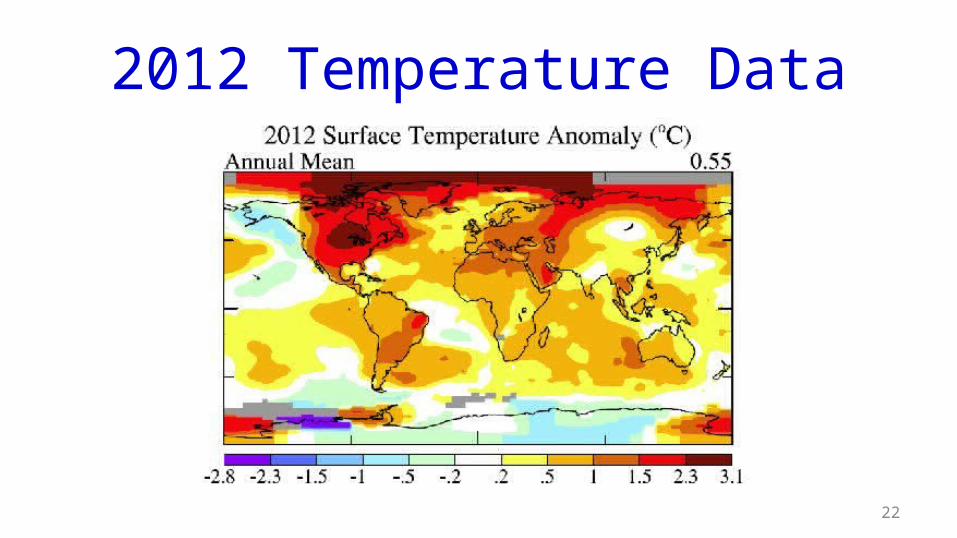
2012 Temperature Data
22
Arctic Feedbacks• Feedback mechanisms in the Arctic are of growing concern
• In 2009, the World Wildlife Federation published a well written report entitled “Arctic Climate Feedbacks: Global Implications” edited by Martin Sommerkorn & Susan Joy Hassol – a link to the PDF version of the second edition is on the Activity Sheet
• While WWF is an advocacy group, this report was written by research scientists (see pp. 93-96 of the report), and was mentioned by Professor Ricky Rood of the University of Michigan in a blog dated October 1, 2009
23

Impact on Northern Hemisphere• Amplification of global warming in the Arctic will have fundamental impacts
on Northern Hemisphere weather and climate
• Due to the sun’s rays striking the Earth’s surface more directly at the equator than at the poles, there is an inequality in the amount of solar radiation received at the poles and the equator, which gives rise to a gradient in atmospheric temperatures, driving circulation of air in the atmosphere
• This transports heat from regions of low-latitude warmth to the cooler poles, heat which is then radiated to space
• Because of this transport, poleward of about 38º in each hemisphere, the Earth emits more radiation to space (as longwave radiation) than it receives from the sun as shortwave radiation
24

Heat Transport
• Much of the atmospheric heat transport is accomplished by weather systems travelling along the wavy jet streams of the middle and higher latitudes in each hemisphere (red arrows)
25

Sea-Ice Modification• Arctic sea-ice cover modifies the basic temperature gradients from the equator to the
poles and hence the manner in which the atmosphere transports heat
• Sea ice influences temperature gradients because of its high reflectivity and its role as an insulating layer atop the Arctic Ocean
• At its maximum seasonal extent in spring, when it covers an area roughly twice the size of the continental United States, the albedo of the freshly snow covered ice surface may exceed 80 per cent, meaning that it reflects more than 80 per cent of the sun’s energy back to space and absorbs less than 20 per cent
• By September, the ice cover shrinks to about half of its spring size
• While summer melting causes the albedo of the ice pack to decrease to about 50 per cent through exposing the bare ice and the formation of melt ponds, this is still much higher than that of the ocean and land areas, which may have albedos of less than 10 per cent
26

Climate Stabilization• When arctic sea-ice melts, it absorbs a lot of energy, and keeps the air
temperature from rising
• Sea-ice is also a good insulator – from October through April, it covers much of the Arctic ocean, greatly slowing the rate of heat loss to the atmosphere
• As ice cover diminishes, the insulating effect is also diminished, allowing the Arctic atmosphere to warm in winter
• This has important climate implications
27

Ice Margin• As the figure shows, the ice
margin is characterized by particularly strong temperature gradients during winter
• This favors the development of low pressure systems along the edge of the ice
28
Polar Vortex• A persistent, large-scale cyclone located near either of a planet's geographical poles is
called a polar vortex
• On Earth, the polar vortices are located in the middle and upper troposphere and the stratosphere They surround the polar highs and lie in the wake of the polar front These cold-core low-pressure areas strengthen in the winter and weaken in the summer due to their reliance
upon the temperature differential between the equator and the poles The term is not new, dating back at least as far as 1853
When the polar vortex is strong, the Westerlies increase in strength When the polar cyclone is weak, the general flow pattern across mid-latitudes buckles and
significant cold outbreaks occur Ozone depletion occurs within the polar vortex, particularly over the Southern Hemisphere,
and reaches a maximum in the spring
29
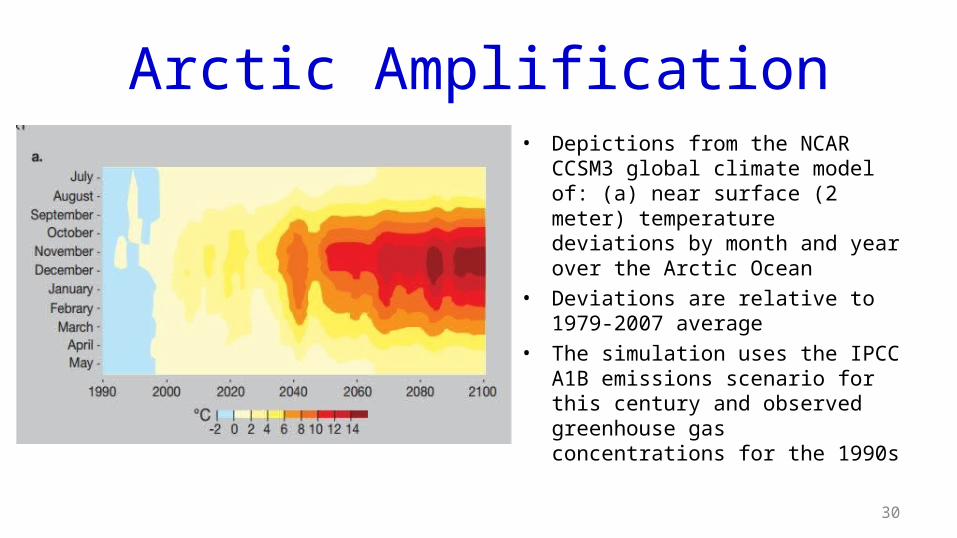
Arctic Amplification• Depictions from the NCAR
CCSM3 global climate model of: (a) near surface (2 meter) temperature deviations by month and year over the Arctic Ocean
• Deviations are relative to 1979-2007 average
• The simulation uses the IPCC A1B emissions scenario for this century and observed greenhouse gas concentrations for the 1990s
30
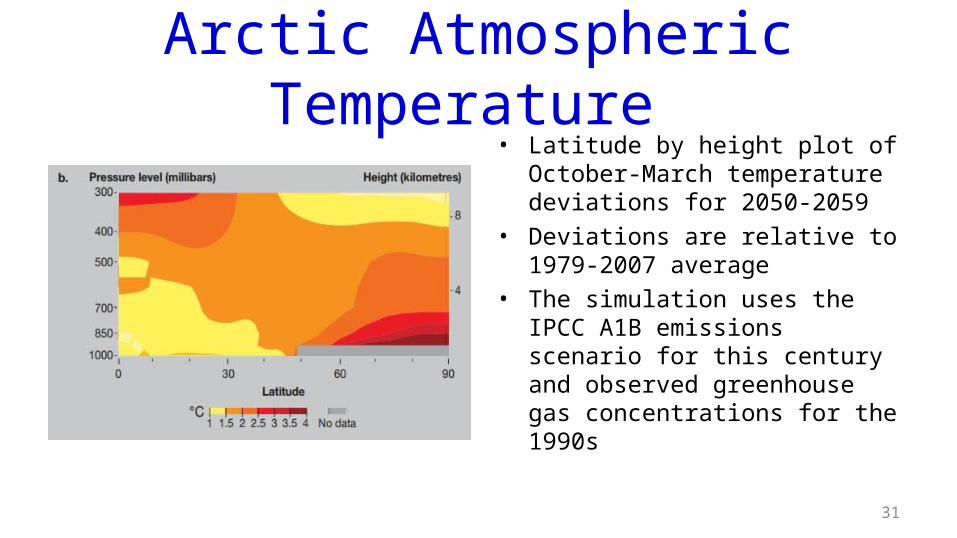
Arctic Atmospheric Temperature • Latitude by height plot of
October-March temperature deviations for 2050-2059
• Deviations are relative to 1979-2007 average
• The simulation uses the IPCC A1B emissions scenario for this century and observed greenhouse gas concentrations for the 1990s
31
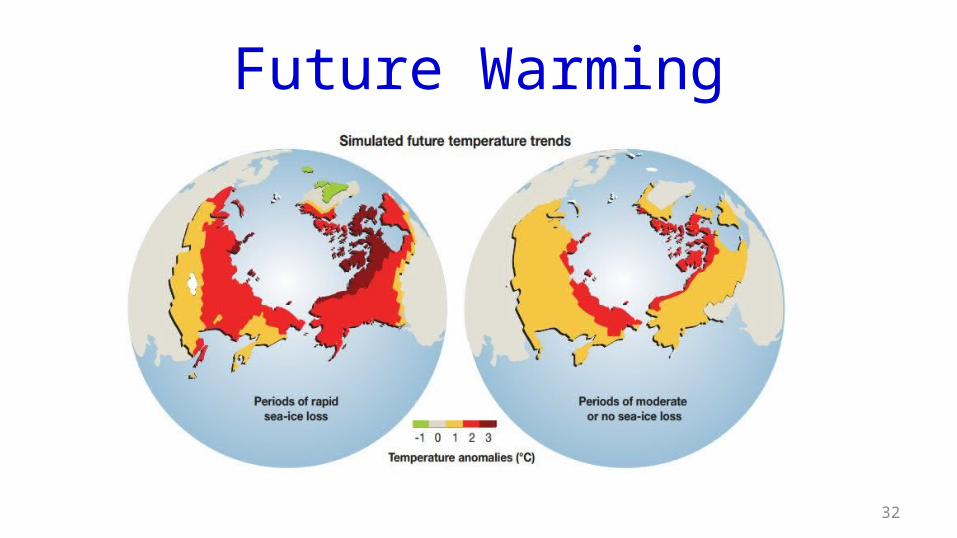
Future Warming
32

Static Stability and Atmospheric Thickness
• Atmospheric heating over the Arctic Ocean through a considerable depth will alter both the change in temperature with elevation (known as the atmosphere’s static stability) and the gradient of atmospheric thickness from the equator to the poles
• Atmospheric thickness is the separation, in meters, between two adjacent pressure levels in the atmosphere, and it increases with increasing atmospheric temperature
33
Weather Changes• A weak thickness gradient toward the poles, will weaken the
vertical change in wind speed, called the wind shear
• Warming the Arctic atmosphere will decrease the thickness gradient between the poles and the equator
• Changes in the static stability and atmospheric thickness gradient will affect the development, tracks and strengths of weather systems, and the precipitation that they generate
34

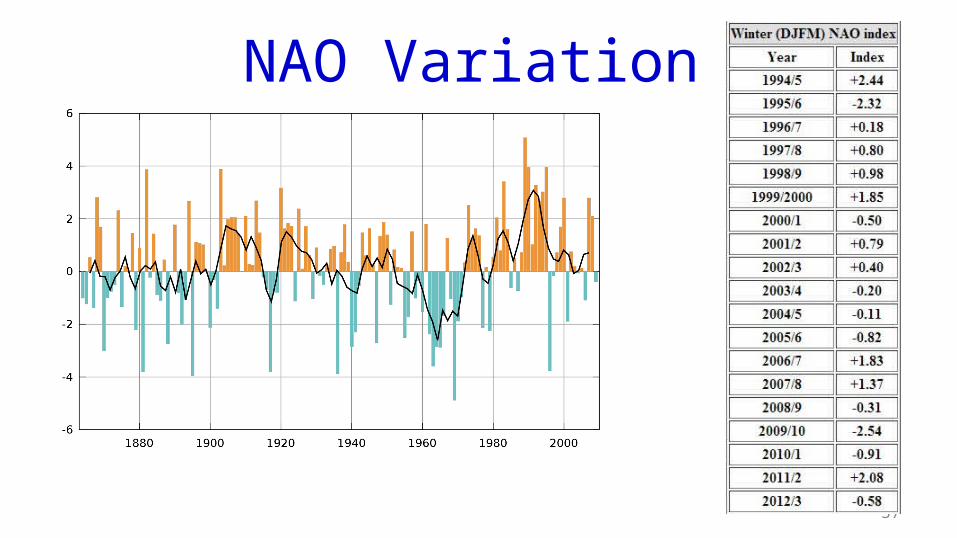
North Atlantic Oscillation• The NAO describes a correlation in the strengths of the
Icelandic Low (the semipermanent low pressure cell centered near Iceland) and the Azores High (the semipermanent high pressure cell centered near the Azores) — the major atmospheric “centers of action” in the North Atlantic.
• When both centers are strong (a deep low and a strong high), the NAO is in its positive phase
• When both centers are weak (a shallow low and a weak high), the NAO is in its negative phase
35

NAO Diagram
36
NAO Variation
37

Polar Vortex Breakdown
38
Figure 1. Arctic Atmospheric Pressure: normal 850 mb geopotential height values which were observed for December from 1968-1996 (left) and unusual 850 geopotential height values that were observed for December 2009 (middle) and for February 2010 (right). Figures from NOAA/ESRL Physical Sciences
Division.
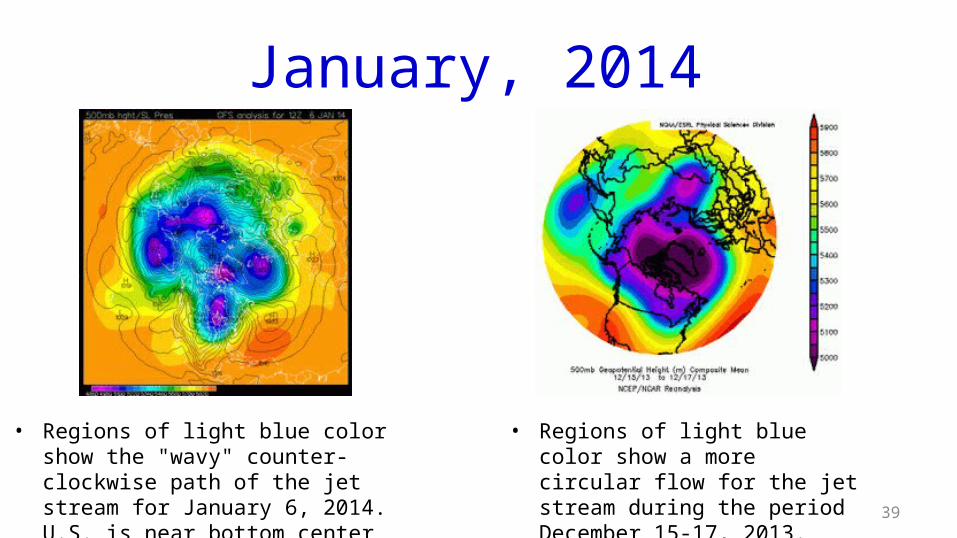
January, 2014
39
• Regions of light blue color show the "wavy" counter-clockwise path of the jet stream for January 6, 2014. U.S. is near bottom center
• Regions of light blue color show a more circular flow for the jet stream during the period December 15-17, 2013.

February 26, 2014
40
Winds at a height where the pressure is 250 mb show the axis of the jet stream, seen here at 00 UTC February 26, 2014. A sharp trough of low pressure was present over the Eastern U.S., and unusually strong ridges of high pressure were over the Western U.S. and the North Atlantic.
Great Lake ice cover as seen on February 19, 2014, by the MODIS instrument on NASA's Aqua satellite. Ice cover on North America’s Great Lakes reached 88 percent in mid-February 2014—levels not observed since 1994. The average maximum ice extent since 1973 is just over 50 percent. It has surpassed 80 percent just five times in four decades. The lowest average ice extent occurred in 2002, when only 9.5 percent of the lakes froze. Image credit: NASA Earth Observatory.

Arctic Oscillation (AO) Index• The Arctic Oscillation refers to an opposing pattern of
pressure between the Arctic and the northern middle latitudes Overall, if the atmospheric pressure is high in the Arctic, it tends to be low in
the northern middle latitudes, such as northern Europe and North America When pressure is high in the Arctic and low in mid-latitudes, the Arctic
Oscillation is in its negative phase In the positive phase, the pattern is reversed
41

Arctic OscillationDiagrams
42

Snowmageddon
43

Heavy Snowfall = No Climate Warming?
• Global warming skeptics regularly have a field day whenever a record snow storm pounds the U.S., claiming that such events are inconsistent with a globe that is warming
• If the globe is warming, there should, on average, be fewer days when it snows, and thus fewer snow storms
• However, it is possible that if climate change is simultaneously causing an increase in ratio of snowstorms with very heavy snow to storms with ordinary amounts of snow, we could actually see an increase in very heavy snowstorms in some portions of the world
• There is evidence that this is happening for winter storms in the Northeast U.S.--the mighty Nor'easters like the "Snowmageddon" storm of February 5-6 and "Snowpocalypse" of December 19, 2009.
44

Evidence• There are two requirements for a record snow storm:
1) A near-record amount of moisture in the air (or a very slow moving storm).
2) Temperatures cold enough for snow.
45

Groisman Study• Groisman et al. (2004) found a 14% increase in heavy (top
5%) and 20% increase in very heavy (top 1%) precipitation events in the U.S. over the past 100 years, though mainly in spring and summer
• They did find a significant increase in winter heavy precipitation events have occurred in the Northeast U.S.
46

Changnon Study• Changnon et al. (2006) found, "The temporal distribution of
snowstorms exhibited wide fluctuations during 1901-2000, with downward 100-yr trends in the lower Midwest, South, and West Coast. Upward trends occurred in the upper Midwest, East, and Northeast, and the national trend for 1901-2000 was upward, corresponding to trends in strong cyclonic activity."
47

2009-2010
48
Lake Effect Snow• A study by Kunkel et al. (2008) noted that we should expect
an increase in lake-effect snowstorms over the next few decades
• Lake-effect snow is produced by the strong flow of cold air across large areas of relatively warmer ice-free water
49

Kunkel Study• The report says, "As the climate has warmed, ice coverage on the Great
Lakes has fallen. The maximum seasonal coverage of Great Lakes ice decreased at a rate of 8.4 percent per decade from 1973 through 2008, amounting to a roughly 30 percent decrease in ice coverage. This has created conditions conducive to greater evaporation of moisture and thus heavier snowstorms. Among recent extreme lake-effect snow events was a February 2007 10-day storm total of over 10 feet of snow in western New York state. Climate models suggest that lake-effect snowfalls are likely to increase over the next few decades. In the longer term, lake-effect snows are likely to decrease as temperatures continue to rise, with the precipitation then falling as rain".
50
South Haven, Michigan 01-08-14
51
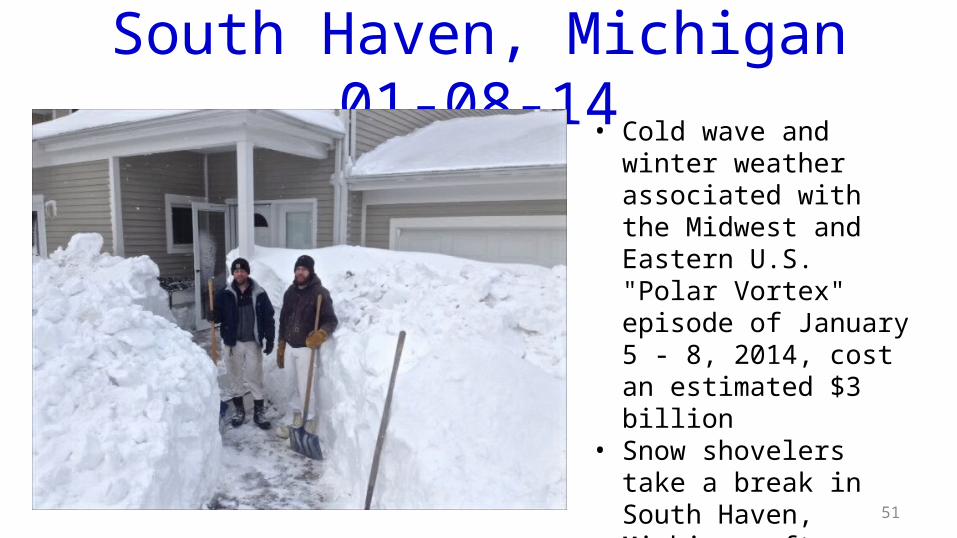
• Cold wave and winter weather associated with the Midwest and Eastern U.S. "Polar Vortex" episode of January 5 - 8, 2014, cost an estimated $3 billion
• Snow shovelers take a break in South Haven, Michigan after an epic lake effect snowstorm buried the city on January 8, 2014
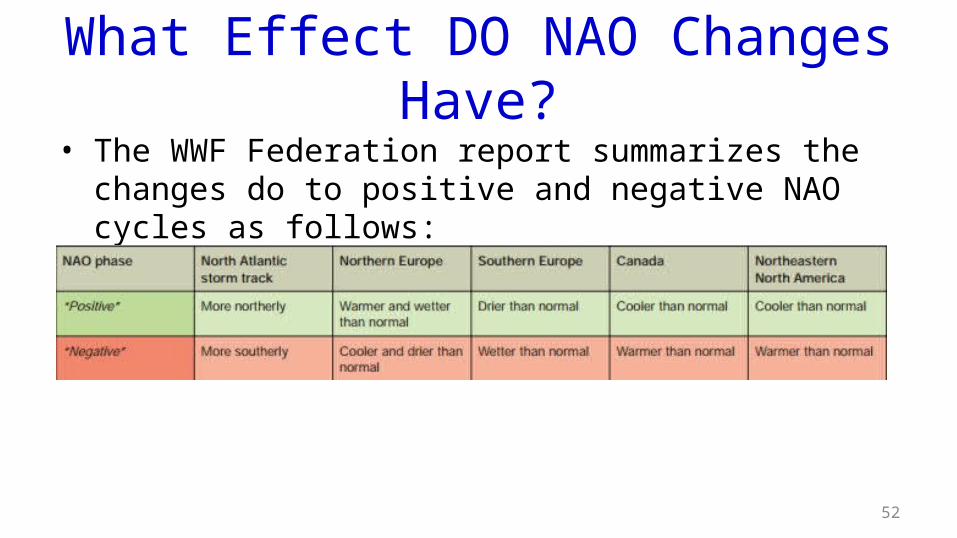
What Effect DO NAO Changes Have?• The WWF Federation report summarizes the changes do to
positive and negative NAO cycles as follows:
52

The Arctic and Carbon• Increasing attention has been responses of various
regions to increasing carbon levels in the atmosphere Carbon sinks are regions that absorb more carbon dioxide
from the atmosphere than they emit Carbon sources are regions that emit more carbon dioxide
from the atmosphere than they absorb
53
Carbon Dioxide Solubility• CO2 is more soluble in cold water than warm
• The exchange of gases, such as carbon dioxide, between the atmosphere and ocean is primarily controlled by: Gas concentration differences between the air and the sea The turbulence in the lower atmosphere, which arises from weather patterns and longer-
term climate changes that control the variability of wind and waves
• In polar seas, seasonal or permanent sea-ice cover is a potential barrier to the atmosphere-ocean exchange of gases compared to open waters elsewhere
54
Arctic Carbon Sink
• Recent analyses indicate that surface waters of the Arctic Ocean generally have low to very low carbon dioxide concentrations, compared to its concentration in the atmosphere
• As such, these surface waters have the ability to absorb large amounts of carbon dioxide, about 0.066 to 0.175 gigatonnes (GT) of carbon per year
55

Carbon Uptake• In the shallow coastal waters of the Chukchi and Barents seas, the inflow of
nutrient-rich seawater from the Pacific and Atlantic oceans, coupled with the seasonal retreat and melting of sea ice and the abundance of light, sustains high rates of marine plant (i.e., phytoplankton) photosynthesis and growth in open waters each year.
• The seasonal growth of marine phytoplankton and zooplankton (e.g., shrimp, copepods) supports rich and diverse open-water and seafloor ecosystems
• These ecosystems provide critical food sources for marine mammals (e.g., grey whale, walrus, polar bears), seabirds and human populations in the Arctic
56
Carbon Inventory• The upper waters of the Arctic contain approximately 25 GT of inorganic carbon and
about 2 GT of organic carbon (in the form of living organisms, detritus and other materials)
• Seawater inflow of Pacific Ocean water through Bering Strait into the Chukchi Sea and Atlantic Ocean water flowing into the Barents Sea supplies an inflow of about 3 GT of inorganic carbon per year into the Arctic Ocean with a similar outflow from the Arctic through Fram Strait
• Within the Arctic itself, river inputs and coastal erosion constitute a land to ocean carbon flux of about 0.012 GT of carbon per year
• However, there are larger uncertainties about the atmosphere-ocean fluxes of carbon and production of organic carbon by marine plant photosynthesis and its subsequent export from surface waters to deep waters and sediments of the Arctic
57
Arctic Vulnerability• The potential vulnerability of the marine carbon cycle due to natural and
human caused climate-change factors include: Sea-ice loss, warming, circulation and other physical changes Changes in biology and ecosystem structure of the Arctic Changes in the water cycle and freshwater inputs to the Arctic Ocean Ocean acidification effects
• Of these factors, sea-ice loss, phytoplankton growth, and warming appear to be the primary agents of change over the next decade or so
58
Short Term Effects• Because exposed surface waters have a lower carbon dioxide
content than the atmosphere, sea-ice loss is expected to increase the uptake of carbon dioxide by surface waters
• The loss of sea-ice effectively removes the barrier to the atmosphere-ocean exchange of gases, including Carbon dioxide Methane Dimethylsulfide, emitted to the atmosphere by marine phytoplankton
• Affects cloud formation
59

Present State of C in the Arctic• At present, the Arctic Ocean is a globally important net sink, responsible
for the 5 to 14 per cent of the global ocean’s net uptake of carbon dioxide
• Some estimates say this may increase to 18% in the short term
• This masks the global reduction of the ocean uptake of carbon dioxide over the last few decades and, thus, is increasingly important to the feedback between the global carbon cycle and climate
60
Future Predictions• Over time, in response to environmental changes driven
largely by climate and environmental change, changes will occur in: carbon and carbon dioxide distributions in surface and subsurface waters, atmosphere-ocean carbon dioxide gradients, the capacity of the Arctic Ocean to uptake carbon dioxide
• This makes future predictions of the Arctic Ocean carbon dioxide sink/source trajectory beyond the next decade difficult
61

Longer Term Effects• Reduced cooling of water during its movement to the poles and increased
absorption of the sun’s energy that results in the warming of surface water relative to previous decades should act to increase the carbon dioxide content of seawater toward the saturation limit
• In the recent past (1998-2006), warming of up to 2°C had been observed in the regions of significant sea-ice loss (mainly on the “inflow” arctic shelves such as the Chukchi and Barents seas)
62
Competing Effects• If surface waters warm by 4 to 5°C, as a consequence of climate change
predicted by the end of this century, and if present-day carbon and carbon dioxide distributions remain unchanged, the Arctic Ocean carbon dioxide sink will significantly decrease in size as a result of warming
• While the impacts of sea-ice and increased phytoplankton photosynthesis and growth will continue to use up carbon dioxide in the water, the saturation of carbon dioxide in warmer waters may somewhat counteract these effects on the atmosphere-ocean exchange of carbon dioxide
• As a result of future climate change, ecosystem shifts may affect the export of organic carbon and decrease interactions between the pelagic (open ocean) and benthic (seafloor) ecosystems
63
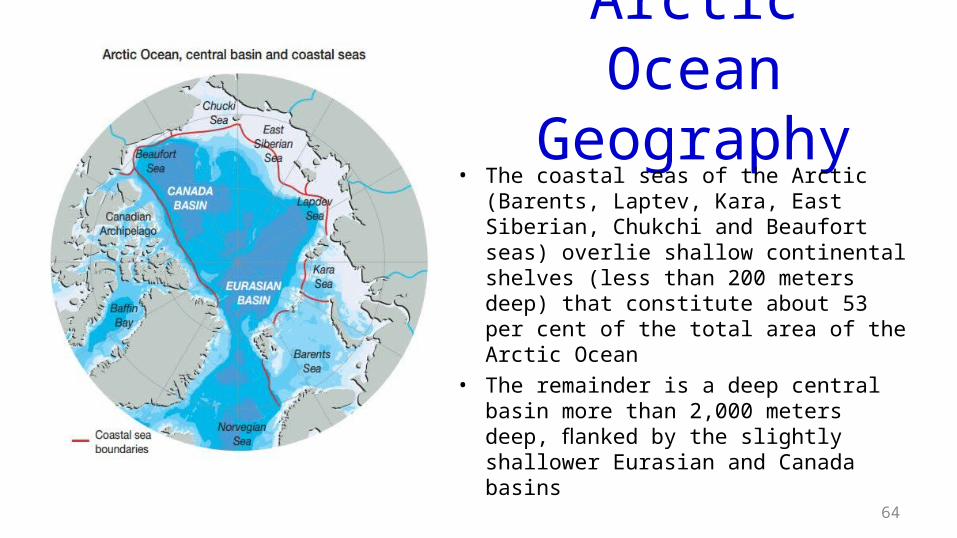
Arctic Ocean Geography
• The coastal seas of the Arctic (Barents, Laptev, Kara, East Siberian, Chukchi and Beaufort seas) overlie shallow continental shelves (less than 200 meters deep) that constitute about 53 per cent of the total area of the Arctic Ocean
• The remainder is a deep central basin more than 2,000 meters deep, flanked by the slightly shallower Eurasian and Canada basins 64

Surface vs. Deep Water• In the central basin of the Arctic, subsurface waters are relatively isolated from
surface waters due to differences in seawater density that change with depth and limited exchanges with deep water outside of the Arctic
• As such, climate change due to warming, sea-ice loss and other processes mostly affects surface waters rather than the deep, isolated and old subsurface waters in the central basin
• In the central basin, density stratification generally acts as a barrier to mixing between nutrient-poor surface waters and nutrient-rich subsurface waters Subsurface waters generally have much higher carbon dioxide content than surface waters,
with low rates of mixing between these waters and the surface mixed layer The surface mixed layer typically extends to 10 to 50 meters, with depth heavily dependent on
mixing due to winds and sea-ice cover65
Mixing in the Arctic• The loss of sea-ice should facilitate deeper mixing and bring
nutrient and carbon dioxide-rich subsurface waters to the surface
• This could either increase or decrease atmosphere-ocean carbon dioxide exchanges depending on biological responses of the Arctic Ocean surface ecosystem to the increased supply of nutrients
66

Fresh Water in the Arctic
• Melting sea-ice is introducing large amounts of cold fresh water in the Beaufort Gyre, with possible climatic consequences 67

Acidification in the Arctic• The predicted ocean uptake of human-caused carbon dioxide,
based on IPCC scenarios, is expected to increase hydrogen ion concentration by 185 per cent and decrease its pH by 0.3 to 0.5 units over the next century and beyond, with the Arctic Ocean impacted before other regions as a result of the relatively low pH of polar waters compared to other waters
• In the Arctic Ocean, potentially corrosive waters are found in the subsurface layer of the central basin
68

Terrestrial Carbon• The largest deposits of organic carbon of any region on Earth are contained
in the Arctic
• Arctic terrestrial ecosystems play an important role in the global carbon cycle, making large contributions to fluxes of the greenhouse gases carbon dioxide and methane
• Both outflows of carbon from and inflows of carbon to Arctic terrestrial ecosystems have been altered as climate has warmed
• As warming continues in the future, carbon emissions from Arctic lands are projected to outpace uptake, further adding to global warming
69

Carbon Fluxes• Arctic terrestrial ecosystems make an important contribution to terrestrial carbon fluxes They remove about 0.3 to 0.6
GT of carbon per year They add about 0.03 to 0.1 GT
of methane to the atmosphere They contribute relatively
smaller but still significant carbon export as dissolved organic matter into arctic rivers and eventually into the oceans
70
Source of Terrestrial C• Carbon was deposited over millennia of slow growth by mosses, grasses
and woody plants
• As these plants decayed to litter and eventually to soil carbon, there was little release of the stored carbon to the atmosphere as a result of prevalent low temperatures that did not allow microorganisms to break down the organic matter
• The result was a slowly growing deposit of carbon that over many millennia became one of the largest deposits on Earth
• Most of these carbon deposits are presently locked away from the atmosphere in frozen ground and so are not contributing significantly to the buildup of atmospheric greenhouse gases
71

C Storage on EarthRegion C in Vegetation, GT C in Soils, GT
Arctic 60-70 1650
Temperate Zone 139 262
Tropics 340 692
72
• Arctic means the northern circumpolar permafrost region• For comparison, the carbon content of Earth's atmosphere has increased
from 360 GT during the last glacial maximum to 560 GT during ∼ ∼preindustrial times and 730 GT in 2006∼
• In 2006, the total earth C estimate in solids was 1500 GT

Yedomo
• (Left) Exposed carbon-rich soils from the mammoth steppe-tundra along the Kolyma River in Siberia. The soils are 53 m thick; massive ice wedges are visible
• (Right) Soil close-up showing 30,000-year-old grass roots preserved in the permafrost
• Yedoma represents relict soils of the mammoth steppe-tundra ecosystem which contain little of the humus that characterizes modern ecosystems of the region, but they comprise large amounts of grass roots and animal bones, resulting in a carbon content that is much higher than is typical of most thawed mineral soils
73

C Release from Yedomo• Organic matter in yedoma decomposes quickly when thawed, resulting in
respiration rates of initially 10 to 40 g of carbon per m3 per day, and then 0.5 to 5 g of carbon per m3 per day over several years
• If these rates are sustained in the long term, as field observations suggest, then most carbon in recently thawed yedoma will be released within a century, a striking contrast to the preservation of carbon for tens of thousands of years when frozen in permafrost
74

Local Thawing• Some local thawing of yedoma occurs independently of climate change
• When permafrost ice wedges thaw, the ground subsides, forming thermokarst lakes
• Abundant thermokarst lakes on yedoma territory migrate across the plains as thawing and subsidence occur along their margins
• During the Holocene (the past 10,000 years), about half of the yedoma thawed beneath these migratory lakes and then refroze when the lakes had moved on
75
Methane Production• The yedoma carbon beneath the thermokarst lakes is decomposed by
microbes under anaerobic conditions, producing methane that is released to the atmosphere primarily by bubbling
• Near eroding lake shores, methane bubbling is so high that channels through the lake ice remain open all winter
• During a thaw/freeze cycle associated with lake migration, 30% of ∼yedoma carbon is decomposed by microbes and converted to methane
76

Release of C to Surface Waters• In a 2013 PNAS article, Cory et al. conclude that recent climate
change, by increasing arctic soil temperatures and thawing large areas of permafrost, allows for microbial respiration of previously frozen C
• They also find soil destabilization from melting ice has caused an increase in thermokarst failures that expose buried C and release dissolved organic C (DOC) to surface waters, and that, once exposed, the fate of this C is unknown but will depend on its reactivity to sunlight and microbial attack, and the light available at the surface-
77

C Release from Frozen Soil• It is clear that the rate of C release from frozen soils is a critical issue
• Permafrost thaw and the microbial decomposition of previously frozen organic carbon is considered one of the most likely positive climate feedbacks from terrestrial ecosystems to the atmosphere in a warmer world
• Knowledge of C release rates from permafrost soils are crucial for predicting the strength and timing of this carbon-cycle feedback effect
• Sustained carbon transfers to the atmosphere must come from old carbon, which forms the bulk of the permafrost carbon pool that accumulated over thousands of years
78

Schuur et al. Study• Schuur et al. (2009) found that areas that thawed over the past 15 years had 40
per cent more annual losses of old carbon than minimally thawed areas, but had overall net ecosystem carbon uptake as increased plant growth offset these losses
• However, areas that thawed decades earlier, lost significantly more old carbon, a 78 per cent increase over minimally thawed areas
• Old carbon loss contributed to overall net ecosystem C release despite increased plant growth
• “Our data document significant losses of soil carbon with permafrost thaw that, over decadal timescales, overwhelms increased plant carbon uptake at rates that could make permafrost a large biospheric carbon source in a warmer world”
79

Eight-Mile Lake Study Site• Infrared air photo of the Eight Mile Lake study site and
surrounding area
• Ground subsidence as a result of permafrost thaw and ice wedge melting is visible as dark striations that occur at the study site and the surrounding hillslopes
• Symbols represent the location of the extensive thaw site (black), the moderate thaw site adjacent to the borehole (grey), and the minimal thaw site (white).
80

Early-Season Permafrost
81
• Early-season photo of extensive permafrost thaw showing ground subsidence and water ponding
• Due to the shallow thaw at this time of year, the water table is still visible at the soil surface

Mid-season • Water table drops below the soil surface
as the seasonal thaw depth increases
• Tundra dominated by shrubs following permafrost thaw is visible in the foreground
• Minimally-subsided tundra dominated by the tussock forming sedge, Eriophorum vaginatum, is visible in the far background as the light green vegetation in the left middle of the photo
82
Estimating C Age• “At monthly intervals during the growing season, we also collected ecosystem
respiration CO2 from dark chambers, as well as soil CO2 from soil profile gas wells, for Δ14C analysis
• In the laboratory, CO2 was then purified and analyzed for Δ14C using an accelerator mass spectrometer, while a subsample was analyzed for δ13C using an isotope ratio mass spectrometer.
• Radiocarbon provides an indication of the age of respired C, and thus can be used as a fingerprint for identifying the decomposition of old organic C that has been stored in these permafrost soils”
83

Thawing Permafrost Video
84

Schuur et al. Figure
85
• Net exchange of CO2 between tundra and the atmosphere for three sites that differ in the extent of permafrost thaw
Arctic Tipping Points• The Sommerkorn and Hassol WWF study concluded that the arctic carbon
cycle will undergo one of the biggest transformations of any region, with consequences for fluxes of carbon, nutrients, energy and water, for vegetation and biodiversity, and for interactions between the Arctic and global climate
• They say many changes will unfold rapidly with immediate effects on the function and structure of the Arctic For example, disturbances driven by warmer and drier conditions have the
potential to lead to rapid changes and tipping points Increased damage by insect attacks and fires have already tipped the C balance in
parts of Canada, changing it from a small C sink to a net C source in just a decade
86

Sea Ice Decline
87
• Sea ice has been declining steadily, if irregularly, since the beginning of satellite data availability
• Numerous changes in climate behavior have been noted
• While it is not yet possible to clearly link each change to the melting of Arctic sea ice, a causal link is suspected
• The next slide shows an animation of sea ice changes

Sea Ice Animation
88
Sea Ice motion over the Arctic Basin. Sea ice shows up as various shades of grey and open ocean as blue. Each image is a snapshot of sea ice cover each day with the date shown in the lower part of each image.In general lighter shades of grey are newly formed first year ice and the dark shades of grey are older multi-year ice. The motion of large ice floes and the formation leads can be seen quite well during the winter months.

Major Changes: 2007• The Arctic sea-ice extent set a record minimum in September, with a
dramatic reduction in area of coverage (4.3 million km2)
• Cariboo populations that have been increasing at a steady rate since the early to mid 1970's are either showing signs of peaking or beginning to decline
• The last five years (to 2004) were characterized by an increase of total river discharge to the Arctic Ocean mainly due to a contribution from Asian rivers, with a mean 2000-2004 discharge from Asia was 110 km3 (5%) higher than over the previous twenty years.
89

Major Changes: 2008• Autumn temperatures are at a record 5º C
above normal, due to the major loss of sea ice in recent years which allows more solar heating of the ocean
• Winter and springtime temperatures remain relatively warm over the entire Arctic, in contrast to the 20th century and consistent with an emerging global warming influence
• Arctic-wide annual averaged surface air temperature anomalies (60°–90°N) based on land stations north of 60°N relative to the 1961–90 mean
90
Major Changes: 2008 continued• During 2008 the summer minimum ice extent, observed in September, reached 4.7
million km2
• While slightly above the record minimum of 4.3 million km2, set just a year earlier in September 2007, the 2008 summer minimum further reinforces the strong negative trend in summertime ice extent observed over the past thirty years
• At the record minimum in 2007, extent of the sea ice cover was 39% below the long-term average from 1979 to 2000
• Arctic sea ice cover is composed of perennial ice (the ice that survives year-round) and seasonal ice (the ice that melts during the summer)
• Consistent with the diminishing trends in the extent and thickness of the cover is a significant loss of the older, thicker perennial ice in the Arctic
91

Major Changes: 2008 continued• Data from the NASA QuikSCAT launched in 1999 and a buoy-
based Drift-Age Model indicate that the amount of perennial ice in the March ice cover has decreased from approximately 5.5 to 3.0 million km2 over the period 1958–2007
• Many authors have recently acknowledged that a relatively younger, thinner ice cover is more susceptible to the effects of atmospheric and oceanic forcing
• In the face of the predictions for continued warming temperatures, the persistence of recent atmospheric and oceanic circulation patterns, and the amplification of these effects through the ice albedo feedback mechanism, it is becoming increasingly likely that the Arctic will change from a perennially ice-covered to an ice-free ocean in the summer.
92

Major Changes: 2008 continued• Sea Surface Temperature (SST ) trends over the past
100 years in the Arctic marginal seas were analyzed by Steele et al. (2008)
• They found that many areas cooled up to ~0.5°C decade–1 during 1930–65 as the Arctic Oscillation (AO) index generally fell, while these areas warmed during 1965–95 as the AO index generally rose
• Warming is particularly pronounced since 1995, and especially since 2000 when the AO index exhibited relatively low and fluctuating values
• Summer 2007 satellite-derived data indicate that SST anomalies were up to 5°C in ice-free regions
93
Major Changes: 2009
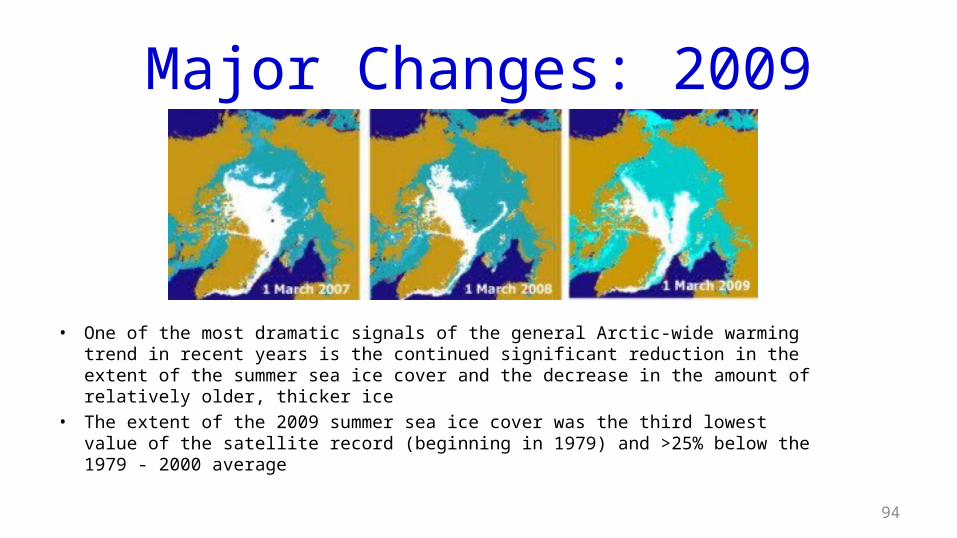
• One of the most dramatic signals of the general Arctic-wide warming trend in recent years is the continued significant reduction in the extent of the summer sea ice cover and the decrease in the amount of relatively older, thicker ice
• The extent of the 2009 summer sea ice cover was the third lowest value of the satellite record (beginning in 1979) and >25% below the 1979 - 2000 average
94

Major Changes: 2009 continued• In 2008, there was an unprecedented amount of fresh water in
the surface layer of the Arctic Ocean
• The source of the fresh water was melting sea ice
• The heating of the ocean in areas of extreme summer sea ice loss (for instance, summer surface water temperatures in the Beaufort Sea were more than 3°C above average) was contributing to record high surface air temperatures in the fall (October through December) over the Arctic Ocean.
95

Major Changes: 2010• A combination of low winter snow accumulation and warm spring temperatures created a new record
low spring snow cover duration over the Arctic in 2010, since satellite observations began in 1966
• Glaciers and ice caps in Arctic Canada are continuing to lose mass at a rate that has been increasing since 1987, reflecting a trend towards warmer summer air temperatures and longer melt seasons.
• Observations show a general increase in permafrost temperatures during the last several decades in Alaska, northwest Canada, Siberia and Northern Europe, with a significant acceleration in the warming of permafrost at many Arctic coastal locations during the last five years.
• The greatest changes in vegetation are occurring in the High Arctic of Canada and West Greenland and Northern Alaska, where increases in greening of up to 15% have been observed from 1982 to 2008.
• In the Eurasian river drainage basins, the correlation between increased river discharge and decreased summer minimum sea ice extent (over the period 1979-2008) is greater than the correlation between precipitation and runoff, suggesting that both rivers and sea ice were responding to changes in large-scale hemispheric climate patterns.
96
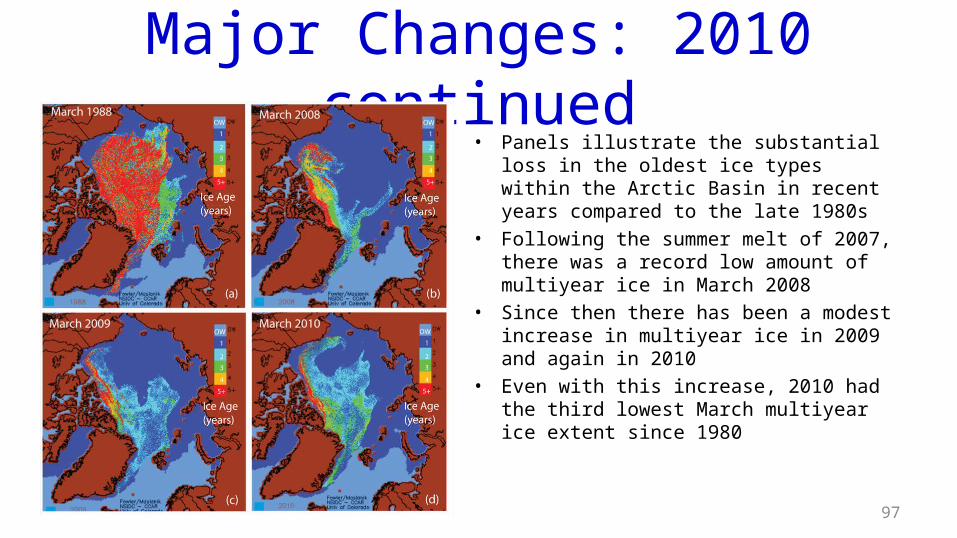
Major Changes: 2010 continued• Panels illustrate the substantial loss in the
oldest ice types within the Arctic Basin in recent years compared to the late 1980s
• Following the summer melt of 2007, there was a record low amount of multiyear ice in March 2008
• Since then there has been a modest increase in multiyear ice in 2009 and again in 2010
• Even with this increase, 2010 had the third lowest March multiyear ice extent since 1980
97
Major Changes: 2011• In 2011, annual near-surface air temperatures over much of the ocean were
approximately +1.5 °C greater than the 1981-2010 baseline period and land temperatures were also above their baseline values
• This continued a decade-long warm-bias of the Arctic relative to mid-latitudes
• The wintertime increase and the summertime decrease in cloudiness resulted in greater energy flux to the surface, potentially contributing to the near record low sea ice extent this year
• Below-average snow extent during spring 2011 is consistent with a decline observed since the 1970s, and continues an accelerated decrease since 2006. June snow cover extent in Eurasia was the lowest since the start of the satellite record in 1966
98
Major Changes: 2011continued• Sea ice and ocean observations over the past decade (2001-2011) suggest
that the Arctic Ocean climate has reached a new state with characteristics different than those observed previously
• The new ocean climate is characterized by less sea ice (both extent and thickness) and a warmer and fresher upper ocean than in 1979-2000
• The persistence of these changes is having a measureable impact on Arctic marine and terrestrial ecosystems
• An anticyclonic (clockwise) wind-driven circulation regime has dominated the Arctic Ocean for at least 14 years (1997-2011), in contrast to the typical 5-8 year pattern of anticylonic/cyclonic circulation shifts observed from 1948-1996
99

Major Changes: 2012• A new record low June snow cover extent (SCE) for the Northern
Hemisphere (when snow cover is mainly located over the Arctic) was set in 2012 A new record low May SCE was also established over Eurasia
• 2012 spring snow cover duration was the second shortest on record for both the North American and Eurasian sectors of the Arctic because of earlier than normal snow melt The rate of loss of June snow cover extent between 1979 and 2012 (-17.6% per decade
relative to the 1979-2000 mean) is greater than the loss of September sea ice extent (-13.0% per decade) over the same period
100
Major Changes: 2012 continued• Over the past 30 years (1982-2011), the Normalized Difference Vegetation Index
(NDVI), an index of green vegetation, has increased 15.5% in the North American Arctic and 8.2% in the Eurasian Arctic
• In the more southern regions of Arctic tundra, the estimated aboveground plant biomass has increased 20-26%
• Increasing shrub growth and range extension throughout the Low Arctic are related to winter and early growing season temperature increases
• Growth of other tundra plant types, including graminoids and forbs, is increasing, while growth of mosses and lichens is decreasing
• Increases in vegetation (including shrub tundra expansion) and thunderstorm activity, each a result of Arctic warming, have created conditions that favor a more active Arctic fire regime
101
Major Changes: 2012 continued• Massive phytoplankton blooms beneath a 0.8-1.3 m thick, fully consolidated (yet
melt-ponded) sea ice pack were observed in the north-central Chukchi Sea in July 2011 Blooms extended >100 km into the ice pack and biomass was greatest (>1000 mg C m -3) near the ice-
seawater interface, with nutrient depletion to depths of 20-30 m.
• New satellite remote sensing observations show: (a) the near ubiquity of ice-edge blooms across the Arctic and the importance of seasonal sea ice
variability in regulating primary production (b) a reduction in the size structure of phytoplankton communities across the northern Bering and
Chukchi seas during 2003-2010
A unique marine habitat containing abundant algal species in so-called "melt holes" was observed for the first time in perennial sea ice in the central Arctic Ocean
102
Major Changes: 2012 continued• In 2012, new record high temperatures at 20 m depth were measured at
most permafrost observatories on the North Slope of Alaska and in the Brooks Range, where measurements began in the late 1970s
• A common feature at Alaskan, Canadian and Russian sites is greater warming in relatively cold permafrost than in warm permafrost in the same geographical area
• During the last fifteen years, active-layer thickness has increased in the Russian European North, the region north of East Siberia, Chukotka, Svalbard and Greenland.
103
Major Changes: 2013• The summer 2013 mean sea level pressure field was characteristic of a positive
Arctic Oscillation/North Atlantic Oscillation
• Consequently, relative to the previous six years, air temperatures were anomalously low across the central Arctic Ocean, Greenland and northern Canada
• In contrast, summer 2013 in Alaska was one of the warmest on record
• Northern Hemisphere spring snow cover extent (SCE) was lower than the historical mean (1967-2013) during 2013, with a new record low May SCE established for Eurasia. North American June SCE was the fourth lowest on record
• The record-setting loss of Eurasian spring snow cover in May 2013, and the below normal June SCE in North America was driven by rapid snow melt, rather than anomalously low snow accumulation prior to melt onset
104
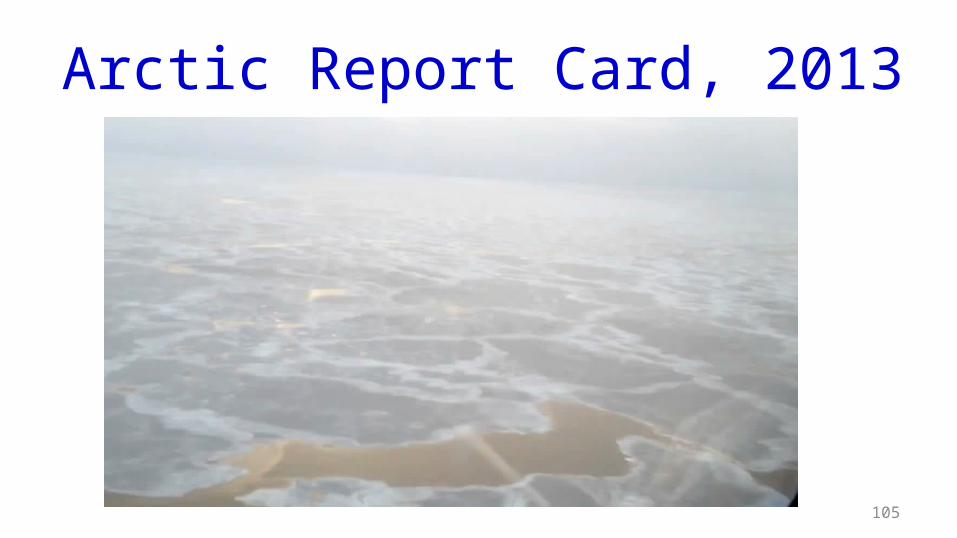
Arctic Report Card, 2013
105

Permafrost Peril
106
• Coastal house in Alaska

A Potentially
Scary Picture
• Data from March 12, 2014
• Gray shading is 2 sigma standard deviation from 1981-2010 average
107

One Week Later
• Data from March 19, 2014
108