cryogenic size reduction and engineering properties of black pepper doctor of philosophy
268
CRYOGENIC SIZE REDUCTION AND ENGINEERING PROPERTIES OF BLACK PEPPER Thesis submitted to the UNIVERSITY OF MYSORE For the award of degree of DOCTOR OF PHILOSOPHY in FOOD ENGINEERING by C. T. MURTHY CENTRAL FOOD TECHNOLOGICAL RESEARCH INSTITUTE MYSORE - 570013, INDIA APRIL 2001
Transcript of cryogenic size reduction and engineering properties of black pepper doctor of philosophy

CRYOGENIC SIZE REDUCTION AND
ENGINEERING PROPERTIES OF BLACK
PEPPER
Thesis submitted to the
UNIVERSITY OF MYSORE
For the award of degree of
DOCTOR OF PHILOSOPHY
in
FOOD ENGINEERING
by
C. T. MURTHY
CENTRAL FOOD TECHNOLOGICAL RESEARCH INSTITUTE MYSORE - 570013, INDIA
APRIL 2001

FT/FE/SB12001
Dr. Suvendu Bhattacharya Scientist Department of Food Engineering
CERTIFICATE
This is to certify that the thesis entitled Cryogenic Size Reduction and
Engineering Properties of Black Pepper submitted to the University of
Mysore, for award of the degree of Doctor of Philosophy in Food
Engineering, by Mr. C.T.Murthy, is the result of the research work carried out
by him in the Department of Food Engineering, Central Food Technological
Research Institute, Mysore, India, under my guidance during 1996-2000.
SUVENDU BHATTACHARYA Guide for Research and Scientist
Department of Food Engineering, CFTRI, Mysore-570 013, INDIA
Date: April 30 2001 Mysore
(i)

DECLARATION
1 hereby declare that the thesis entitled Cryogenic Size Reduction and Engineering
Properties of Black Pepper submitted to the University of Mysore, for award of the degree of
Doctor of Philosophy in Food Engineering, is the result of the research work carried out by
me in the Department of Food Engineering, Central Food Technological Research Institute,
Mysore, India, under the guidance of Dr. Suvendu Bhattacharya, during 1996-2000. I further
declare that the results have not been submitted for award of any other degree or fellowship.
Date: Mysore
(ii)

ACKNOWLEDGEMENT
I take this opportunity to express my heartfelt gratitude to the Director, Central Food Technological Research Institute, Mysore, Dr. V. Prakash, for providing institutional facilities and for having permitted me to document the findings of research in the form of a thesis.
I am thankful to Sri. H.Krishna Murty, Deputy Director and Head, Department of Food Engineering, Central Food Technological Research Institute, Mysore, for his encouragement and cooperation throughout this research. I am grateful to Sri. A.Ramesh, Additional Director (Rtd.) Department of Food Engineering, Central Food Technological Research Institute, Mysore, whose initiation led me to work in the area of cryogenics for spice processing.
I wish to express my most Sincere gratitude to my Research Guide, Dr. Suvendu Bhattacharya, for his sustained interest in this work, encouragement and for objectively reviewing the manuscript.
I wish to express my sincere thanks to my senior colleagues at CFTRI, Sri. P.N.Srinivasa Rao, Dr. N.G.Karanth, Dr. N.Krishnamurthy, Dr. K.Udaya Sankar, Dr. KSMS Raghava Rao, for the useful discussion in their area of expertize during my research. I also thank Dr (Mrs). Shanthi Narasihman for extending her valuable time for discussions on sensory studies. I also thank my friends and well wishers Sri. Chandrashekahar D, Sri. Ravi Kumar D, Sri. M.N.Ramesh, Sri. V.D.Nagaraju, Dr. Jaganmohan Rao, Dr. Meenakshi Singh, Sri .. M.A.Kumar, Sri. R.Ravi, Sri. Suresh Chandra, Sri.Ravee-Prasanna for extending helping hand during the preparation of this thesis.
I also wish to express my thanks to my research trainees Ms. Savitha, Ms. Sumithramma, Mr. Keshava Murthy and Mr. G. Bhat and my colleagues at CFTRI Sri. T.Ramesh, Sri Subba Rao, Sri.C.Gopal, Sri. S.G.Jayaprakashan and the staff of pilot plant for helping in conducting experiments. I am also thankful to the staff of Work Shop and Design Section for their assistance during this work.
Last but not the least, I am also grateful to my family members for their constant encouragement to complete this thesis.
C.T.Murthy

CONTENT
Certificate (i)
Declaration (ii)
Acknowledgement (iii)
List of Tables (iv)
List of Figures (vi)
Nomenclature (ix)
CHAPTER 1: INTRODUCTION 1-5
CHAPTER 2: REVIEW OF LITERATURE 6-55
2.1 Spices 6
2.1.1 Black pepper 7
2.1.2 White pepper 8 2.1.3 Processed tender green pepper 9 2.1.4 Constituents of pepper 9
2.1.5 V olatile oil of pepper 9
2.2 Engineering Properties of Food 11
2.2.1 Physical properties of food 11 2.2.1.1 Size and shape 12
2.2.1.2 V olume and. density 15 2.2.1.3 Surface area 15
2.2.1.4 Colour 16
2.2.2 Mechanical properties of food 16
2.2.2.1 Rheological properties 19 2.2.2.2 Behaviour of solids 21 2.2.2.3 Stress relaxation 21
2.2.2.4 Creep 24
2.2.2.5 Bulk properties 24
2.2.2.5.1 Bulk density and porosity 25 2.2.2.5.2 Angle of repose 25

2.3 Theory of Size Reduction 27 2.3.1 Mechanism of size reduction 30 2.3.2 Energy for size reduction 34 2.3.3 Energy laws 34 2.3.3.1 Rittinger's law 35 2.3.3.2 Kick's law 35 2.3.3.3 Bond's law 36 2.3.3.4 Holme's law 36 2.3.3.5 Charle's law 38
2.4 Size Reduction or Grinding of Spices 38
2.5 Cryogenics 38
2.5.1 Cryogenic fluids and their properties 39 2.5.2 Theory of cryogenic size reduction of food 39 2.5.3 Cryogenic freezing of food 40 2.5.4 Cryogenic size reduction or cryogenic grinding of spices 44 2.5.5 Advantages of cryogenic grinding 52 2.5.6 Cryogenic grinding of other food materials 53 2.5.7 Miscellaneous applications of cryogenics in food 55 2.5.7.1 Liquid nitrogen in packaging 55 2.5.7.2 Liquid nitrogen peeling of fruit & vegetables 55
CHAPTER 3: MATERIALS AND METHODS 56-82
3.1 Engineering Properties of Black Pepper 56
Materials Preparation of seeds at different moisture contents Size, shape and weight
Bulk density
Dynamic angle of repose Flowability
Uniaxial compression and failure behaviour Statistics and data analysis
3.1.1 3.1.2 3.1.3 3.1.4 3.1.5 3.1.6 3.1.7 3.1.8
56 56 57 57 57 57 58 58

3.2 Ambient Grinding of Black Pepper 59 3.2.1 Performance study of grinding mill at various feed rates 59 3.2.1.1 Sieve analysis 59 3.2.1.2 Moisture content of black pepper samples 60 3.2.1.3 Volatile oil content by Clevenger's method 63 3.2.2 Performance study of grinding mills of various capacities 65 3.2.2.1 Analysis of volatile oil by gas chromatography 67 3.2.3 Ambient grinding characteristics at different particle sizes 67 3.2.3.1 Energy estimation for grinding 67 3.2.3.2 V olatile oil content at various time intervals 68 3.2.3.3 Physical properties of volatile oil 68 3.2.3.3.1 Specific gravity or relative density 68 3.2.3.3.2 Refractive index 69 3.2.3.3.3 Optical rotation 69 3.2.3.4 Gas chromatographic-mass spectroscopic
(GC-MS) analysis 70 3.2.3.5 Diffusion coefficient in volatile oil distillation 70
3.3 Cryogenic Size Reduction of Black Pepper 72
3.3.1 Cooling, chilling and cryogenic freezing methods 72
3.3.2 Cryogenic (LN2) grinding and volatile oil content on
a laboratory set up 72 3.3.3 Effect of cryogenic, chilled, ambient and high temperature
grinding methods on grinding characteristics 75 3.3.3.1 Sieve analysis 75 3.3.4 Cryogenic grinding in pilot scale 77 3.3.4.1 Design of experiments and response surface methodology 77 3.3.4.2 Energy expenditure for grinding 80 3.3.4.3 Sensory studies of powdered samples 81

CHAPTER 4: RESULTS AND DISCUSSION 83-178
Engineering Properties of Black Pepper Moisture dependent engineering properties Size
Size
Sphericity and roundness
Bulk density
Dynamic angle of repose and flowability
Uniaxial compression and failure behaviour
Conclusions
4.1 4.1.1
4.1.1.1
4.1.1.2
4.1.1.3
4.1.1.4
4.1.1.5
4.1.1.6
83
83 84
84
88
88
92 95
4.2 4.2.1
4.2.1.1
4.2.1.2
4.2.1.3
4.2.1.4
Ambient Grinding of Black Pepper Performance study of grinding mill at various feed rates
Temperature rise during grinding
Particle size of powder
Volatile oil content of powder
Conclusions
96 96 97
100
100
103
4.2.2
4.2.2.1
4.2.2.2
4.2.2.3
4.2.2.4
Performance study of different types of mills of various capacities 105 Particle size of powder 105
Volatile oil content of powder 106
Analysis of volatile oil by gas chromatography 107
Conclusions 114
4.2.3'
4.2.3.1
4.2.3.2
4.2.3.3
4.2.3.4
4.2.3.5
4.2.3.6
4.2.3.7
4.2.3.8
4.2.3.9
4.2.3.10
4.2.3.11
Ambient grinding characteristics at different particle sizes
Temperature rise during grinding
Particle size of powder
Estimated energy for grinding
Volatile oil content of powder
Distillation time
Optimisation of particle size
Physical properties of volatile oil
Analysis of volatile oil by gas chromatography
Effective diffusion coefficient
Fourier Number
Conclusions
115 117
117 117
119
121 122 124 125
131 133
135

4.3 Cryogenic Size Reduction or Cryogenic Grinding of Black Pepper 137
4.3.1 Evaluation of cooling, chilling and cryogenic freezing methods for grinding Evaluation of cryogenic grinding and volatile oil content on a laboratory set-up
Effect of cryogenic, chilled, ambient and high temperature grinding methods
on grinding characteristics in laboratory scale
Particle size of powder
Temperature rise during grinding
Volatile oil content of powder
Analysis of volatile oil by gas chromatography Conclusions
137 4.3.2
1394.3.3
140
140
141
141
143
145
4.3.3.1
4.3.3.2
4.3.3.3
4.3.3.4
4.3.3.5
4.3.4 Cryogenic grinding on a pilot scale 4.3.4.1 Comparison of cryogenic grinding with ambient grinding 4.3.4.1.1 Peed rate and product temperature 4.3.4.1.2 Particle size of powder
4.3.4.1.3 Mill choking characteristics 4.3.4,,1 .4 Volatile oil content of powder
4.3.4.1.5 Analysis of volatile oil by gas chromatography 4.3.4.1.6 Sensory studies of powdered samples
4.3.4.2 Response surface methodology for cryogenic grinding 4.3.4.2.1 Effect of variables on cryogenic grinding 4.3 4.3.4.2.2 Volatile oil
4.3.4.2.3 Particle diameter
4.3.4.2.4 Energy expenditure
4.3.4.2.5 Monoterpenes
4.3.4.2.6 Sesqueterpenes
4.3.4.2.7 Correlation among the dependent variables
4.3.4.2.8 Optimization of cryogenic grinding condition 4.3.4.2.8.1 Volatile oil
4.3.4.2.8.2 Monoterpenes
4.3.4.2.8.3 Volatile oil and monoterpenes 4.3.4.3 Conclusions
146
147
148
148
149
150
151
156
158
158
159
162
164
166
169
171 172
173
173
176
176 CHAPTER V: SUMMARY AND CONCLUSIONS 179-185
REFERENCES 186-193

LIST OF TABLES
Table 2.1 Constituent compounds of black pepper volatile oil
Table 2.2 Characteristics of compounds of black pepper volatile oi1
Table 2.3 Types of grinders and their applications
Table 2.4 Properties of cryogenic fluids used in food systems
Table 2.5 Types of liquid nitrogen freezing systems
Table 2.6 Steam-distillable volatile oil of different spices
Table 2.7 Comparative composition of stamp milled and cryo-milled spices
Table 2.8 Gas-chromatographic headspace analysis of different spice volatiles obtained by cryogenic and ambient grinding
Table 2.9 Comparison of volatile oil retention by cryogenic and ambient grinding
Table 2.10 Grinding method against grinding characteristics of nutmeg powder
Table 2.11 Amount of volatile oil present in cumin powder ground under cryogenic and ambient conditions
Table 2.12 Amount of volatile oil present in clove powder ground under cryogenic and ambient conditions
Table 3.1 Reference chemical compounds and their odour notes used in sensory analysis of ground black pepper
Table 4.1.1 Parameters derived from uniaxial compression testing of black pepper
Table 4.2.1 Effect of feed rates on product temperature at different grinding time during grinding of black pepper using a Swing hammer mill.
Table 4.2.2 Effect of feed rate on particle size and on rise in product temperature and particle size at the time of stabilisation of grinding mill
Table 4.2.3 Effect of feed rate on temperature, moisture and volatile oil content of the ground black pepper powder samples
Table 4.2.4 Performance evaluation of commonly used grinding mills in ambient grinding of black pepper
Table 4.2.5 Gas chromatographic analysis of conventionally ground pepper samples using different mills (Relative concentrations in percentage)
. Table 4.2.6 Boiling points of volatile oil compounds of black pepper at different vapour pressure
Table 4.2.7 Grinding characteristics of black pepper by ambient grinding

Table 4.2.8 Sieve analysis of black pepper powder ground to different particle sizes
Table 4.2.9 Cumulative volatile oil content of powdered samples obtained by Clevenger's distillation at different time intervals
Table 4.2.10 Physical properties of volatile oils of black pepper ground to different particle sizes in various mills
Table 4.2.11 Identification of flavour compounds of volatile oil of black pepper by GCMS analysis
Table 4.2.12 GC analysis of volatile oil samples of black pepper ground to different particle sizes
Table 4.3.1 Temperatures of feed and products obtained by different method of cooling
Table 4.3.2 Cryogenic (LNz) grinding and content of volatile oil of black pepper as compared to ambient grinding in laboratory scale
Table 4.3.3 Effect of grinding conditions on the volatile oil content and fineness of ground black pepper
Table 4.3.4 Gas chromatographic analysis of pepper oil samples obtained under different grinding conditions
Table 4.3.5 Results of volatile oil, moisture content and particle size of powder during cryogenic and ambient grinding in pilot scale
Table 4.3.6 Gas chromatographic analysis of cryogenically and ambiently ground lack pepper volatile oil
Table 4.3.7 Experimental design in coded and actual level of variables
Table 4.3.8 Response functions obtained employing experimental design
Table 4.3.9 Analysis of variance (ANOVA) for response function volatile oil in coded level of variables
Table 4.3.10 Analysis of variance (ANOVA) for response function particle diameter in coded level of variables
Table 4.3.11 Analysis of variance (ANOVA) for response function energy expenditure in coded level of variables'
Table 4.3.12 Analysis of variance (ANOVA) for response function monoterpenes in coded level of variables
Table 4.3.13 Analysis of variance (ANOVA) for response function sesqueterpenes in coded level of variables
Table 4.3.14 Coefficients of the regression equation in actual level of variables Table
4.3.15 Correlation among the dependent variables
(v)

LIST OF FIGURES
Some standard shapes for describing the shape of an apple. Hunter (L a b) colour description and quantification. Commonly used rheological models based on springs and dashpots.
Force-deformation curve during compression of food.
Stress relaxation curves at different extent of initial compression.
Measurement of angle of repose by different methods. Stress-strain
diagrams of various solids
Common stress mechanism for particle size reduction.
Commercial size reduction machines
Figure 2.1
Figure 2.2
Figure 2.3
Figure 2.4
Figure 2.5
Figure 2.6
Figure 2.7
Figure 2.8
Figure 2.9
Figure 2.10 Plots of energy utilisation versus specific energy using (a) Kick, (b) Bond and (c) Rittinger energy laws
Block diagram of laboratory cryogenic grinding system.
Typical cryogenic grinding system, pilot scale Figure 2.11
Figure 2.12
Figure 3.1 Distillation apparatus for determination of moisture content in black pepper powder
Clevenger's distillation apparatus for determination of volatile oil content in black pepper powder
Schematic diagrams of grinding machines employed for ambient grinding
Experimental set-up for grinding of black pepper (Laboratory scale) Schematic
diagrams of cooling, chilling and cryogenic freezing systems Flow chart of unit
operations used in grinding
Schematic diagram of cryogenic grinding set up (Pilot scale)
The frequency distribution for the dimension of the black pepper seeds (A) Maximum dimension; (B) Minimum dimension
Figure 3.2
Figure 3.3
Figure 3.4
Figure 3.5
Figure 3.6
Figure 3.7
Figure 4.1.1
Figure 4.1.2 Cumulative frequency for the dimension of black pepper seeds, plotted against size interval. (A) Maximum dimension; (B) Minimum dimension
Figure 4.1.3 Variations of mean size, roundness and sphericity of black pepper seed with moisture content
Figure 4.1.4 Bulk density at different moisture contents of the seeds

Figure 4.1.5
Figure 4.1.6 Figure 4.1.7
Angle of repose at different moisture contents of the seeds
Funnel flow time at different moisture contents of the seeds
Uniaxial compression curve for black pepper seed showing the different parameters Effect of feed rates on the product temperature and grinding time
Variation of total, monoterpene and sesqueterpenes contents in black pepper volatile oil obtained by different grinding mills
Figure 4.2.3 Variations of monoterpenes constituents in black pepper volatile oil obtained by different grinding mills
Figure 4.2.4 Variation of sesqueterpenes constitutents in black pepper volatile oil obtained by different grinding mills
Figure 4.2.5 Volatile oil yield versus distillation time at different particle sizes of blackpepper powder (a) For samples of PDI, PD2 and PD3; (b) For samples ofPD4, PD5 and PD6
Figure 4.2.6
Figure 4.2.7
Figure 4.2.8
Optimization of parameters in grinding of black pepper
GC-MS analysis of volatile oil for identifying constituents
Variations of monoterpenes constituents in black pepper volatile oil ground to different particle sizes
Figure 4.2.9 Variations of sesqueterpenes constituents in black pepper volatile oil ground to different particle sizes
Figure 4.2.10 Variations of total, monoterpene and sesqueterpenes content in black pepper volatile oil ground to different particle sizes
Figure 4.2.11 GC profiles of black pepper volatile oil (a) at particle size of 2.10 mm and (b) at particle size of 0.14 mm
Figure 4.2.12 Ln (M1) versus distillation time at different particle sizes of black pepper powder (a) For samples of PDI, PD2 and PD3; (b) For samples of PD4, PD5.and PD6
Figure 4.3.1 Variations of volatile oil constituents of black pepper ground by four different grinding methods
Figure 4.3.2 Variations of total, monoterpene and sesqueterpenes content in volatile oil of black pepper ground by four different grinding methods
Figure 4.3.3 Variations of total, monoterpene and sesqueterpenes content in black pepper volatile oil ground by cryogenic grinding (Pilot scale)

Figure 4.3.4 Variations of monoterpenes constituents in black pepper volatile oil ground by cryogenic grinding (Pilot scale)
Figure 4.3.5 Variations of sesqueterpenes constituents in black pepper volatile oil ground by cryogenic grinding (Pilot scale)
Figure 4.3.6 Comparison of ambient and cryogenic grinding in terms of components volatile oil (Pilot scale) (a) In terms of total oil, monoterpenes and sesqueterpenes and (b) In terms of monoterpenes and sesqueterpenes
Figure 4.3.7 Sensory attributes of samples of cryogenic and conventional grinding
Figure 4.3.8 Response surface plot of volatile oil, feed rate and product temperature in cryogenic grinding
Figure 4.3.9 Response surface plot of particle diameter, feed rate and product temperature in cryogenic grinding
Figure 4.3.10 Response surface plot of energy expenditure, feed rate and product temperature in cryogenic grinding
Figure 4.3. II Response surface plot of monoterpenes, feed rate and product temperature in cryogenic grinding
Figure 4.3.12 Response surface plot of sesqueterpenes, feed rate and product temperature in cryogenic grinding
Figure 4.3.13 Contour plot of volatile oil, feed rate and product temperature for optimizing cryogenic grinding condition
Figure 4.3.14 Contour plot of monoterpenes, feed rate and product temperature for optimizing cryogenic grinding condition
Figure 4.3.15 Combined contour plot (Fig. 4.3.13 and Fig. 4.3.14) of volatile oil, monoterpenes, feed rate and product temperature for optimizing cryogenic grinding condition
(viii)

NOMENCLATURE
a Major axis of the seed (mm)
ar Sphere radius in diffusion equation (m)
A Empirical constant in Eq. (2.13) (dimensionless)
Ac Area of the smallest circumscribing circle (mm2)
Ap Largest projected area of the object in natural rest position (mm2)
b Medium axis of the seed (mm)
c Minor axis of the seed (mm)
C Celsius ( degree)
Co Constant concentration at the surface in Eq. (3.7) (dimensionless)
Cosφ Power factor (dimensionless)
dg Geometric average of two successive sieve openings (mm)
dga Geometric mean particle diameter of powder (mm)
dgo Optimal geometric mean particle diameter of powder (mm)
dj Average particle diameter of black pepper berries (mm)
dm Arithmetic mean of two successive sieve openings (mm)
dsa Surface mean diameter of powder (mm)
D Characteristic size of particles in Eq. (2.8) (mm)
DI Initial size of particles before size reduction (mm)
D2 Final size of particles after size reduction (mm)
De Effective diffusion coefficient of oil from powder to water (m2s-l)
Ed Deformation modulus (N mm-l)
Er Energy for failure (1)
EG Energy spent for grinding (kJ kg-1)
Eo Work index in Bond's energy equation (kJ kg-1)
Es Theoretical energy required for size reduction (kJ kg-1)
F Farenhiet (degree)
Fa Applied force (N)
Fr Force at failure (N) Fo Fourier Number (D t/rs
2) (dimensionless)
I Measured current during grinding (A)
10 No load current (A)
(ix)

K Slope in Eq. (3.10) (S-1)
kg Empirical constant in Eq. (2.8) (kJ kg-1 when m=l)
kk Kick's empirical constant as in Eq. 2.10 (kJ kg-1)
kr Rittinger's empirical constant as in Eq. 2.9 (kJ mm kg-1)
Elongation at breaking point (m)
m Empirical constant in Eq. (2.8) (dimensionless)
M' As defined in Eq. (3.10) (mL/100g)
M Moisture content of conditioned seeds (%, dry basis)
Mr Initial essential oil content of powder (mL/100g)
Mo Initial moisture content (%, dry basis)
M, Final moisture content of the dried and sprayed sample (%, dry basis)
MI Essential oil released from the powder at time t (mL/100g)
n, Empirical constant as in Eq. (2.13) (dimensionless)
p Probability level (dimensionless)
P Electric power for grinding (W)
q Empirical constant in Eq. (2.12) (dimensionless)
r Correlation coefficient (dimensionless)
rl Space coordinate in Eq. (3.8) (dimensionless)
rs Surface mean radius of powder (m)
Rt Roundness of seed (dimensionless)
S Sphericity of seed (dimensionless)
Distillation time (s)
tg Grinding time (min)
T Temperature of ground product (C)
Ti Initial temperature of the feed (C)
u Variable to simplify the diffusion equation in spherical coordinates
V Line voltage (Y)
Yo V olatile oil content (dry basis, mL/100g)
Vw Volume of water (mL)
W, Initial weight of the seeds at an initial moisture content of Mo (g)
WIOOO Weight of 1000 seeds (g)
W 2 Final weight of the seeds at a moisture content M, (g)
Wi Weight fraction of powder retained on ith sieve.(dimensionless)

K Slope in Eq. (3.10) (S-1)
kg Empirical constantin Eq. (2.8) (kJ kg-1 when m=l)
kk Kick's empirical constant as in Eq. 2.10 (kJ kg-1)
kr Rittinger's empirical constant as in Eq. 2.9 (kJ mm kg-1)
I Elongation at breaking point (m)
m Empirical constant in Eq. (2.8) (dimensionless)
M1 As defined in Eq. (3.10) (mL/100g)
M Moisture content of conditioned seeds (%, dry basis)
Mr Initial essential oil content of powder (mL/100g)
Mo Initial moisture content (%, dry basis)
M1 Final moisture content of the dried and sprayed sample (%, dry basis)
Mt Essential oil released from the powder at time t (mL/100g)
n1 Empirical constant as in Eq. (2.13) (dimensionless)
p Probability level (dimensionless)
P Electric power for grinding (W)
q Empirical constant in Eq. (2.12) (dimensionless)
r Correlation coefficient (dimensionless)
r1 Space coordinate in Eq. (3.8) (dimensionless)
rs Surface mean radius of powder (m)
Rd Roundness of seed (dimensionless)
S Sphericity of seed (dimensionless)
t Distillation time (s)
tg Grinding time (min)
T Temperature of ground product (C)
Ti Initial temperature of the feed (C)
u Variable to simplify the diffusion equation in spherical coordinates
V Line voltage (V)
Vo Volatile oil content (dry basis, mL/100g)
Vw Volume of water (mL)
W1 Initial weight of the seeds at an initial moisture content of Mo (g)
WI000 Weight of 1000 seeds (g)
W2 Final weight of the seeds at a moisture content MI (g)
W1 Weight fraction of powder retained on ith sieve.(dimensionless)
(x)

Ws Weight of sample (g)
x Variable expressed in coded level (dimensionless)
X Variable expressed in actual level (characteristic unit)
Xl Feed rate of black pepper in Section4.3.4.2 (kg hr-1)
X2 Product temperature of black pepper in Section 4.3.4.2 (C)
Y Response function in coded level (dimensionless)
Y Response function in actual level (characteristic. unit)
Y1 V olatile oil content of spice powder (mL/100g)
Y2 Particle diameter of spice powder (mm)
Y3 Energy expenditure for grinding (kJ kg-1)
Y 4 Monoterpenes content (%)
Ys Sesquiterpenes content (%)
0 Dynamic angle of repose (degree)
11 Motor efficiency (dimensionless)
ex. Relaxation time that characterises material response (s)
S Strain during compression (%)
't Stress at time t in stress relaxation (N m-2)
Pb Bulk density of seeds (kg m-3)
Sf Failure strain (%)
Linear limit of strain in the force-deformation curve (%)
Initial stress during stress relaxation (N m-2)
Analysis of variance
Duncan's multiple range test
Coefficient of variation (equal to SDx100/Mean)
Dry basis
Liquid nitrogen
Response Surface methodology
Rupees (Indian currency)
Standard deviation
ANOVA
DMRT
CV
Db
LN2
RSM
Rs
SD
(xi)

CHAPTER 1: INTRODUCTION

CHAPTER 1
INTRODUCTION
Spices are important agricultural commodities throughout the world due to their high
unit price. This is particularly true for India which produces about 2.5 million tonnes (valued at
3 billion US$) of spices, processes, markets in domestic sector and exports them to various
countries to earn a handsome foreign exchange. India's share in the world trade amounts to 46%
of the total in quantity (about 30% in monitory terms) (Anon, 2001a). It is, therefore, necessary
to give due attention to this commodity with particular reference to quality and value addition.
Spices occupied an important place in the world trade amounting to more than half
million tonnes valued at US$ 2.0 billion during 1998-1999 and with a projected quantity of
about 0.6 million tonnes valued at US$ 3.0 billion in 2001. Export of spices from India during
1998-1999 was around 0.2 million tonnes valued at about Rs. 1650 crores (US$ 400 million)
(Peter, 1999) and was estimated to grow to about Rs. 1860 crores (US$ 430 million) during
1999-2000 (Anon, 2001a). The demand for value added products such as volatile oils and
oleoresins has also increased in the international market from 1,330 tonnes in 1998-1999 to
1,575 tonnes (valued at Rs. 159 crores) in 1999-2000 (Anon, 2001 b).
Of all the spices produced in India, black pepper (Piper nigrum L.), also called the 'King
of Spices', is one of the major spices being exported amounting to more than 35,000 tonnes
during 1998-1999 valued at about Rs. 650 crores (Peter, 1999) and estimated to increase to
about 42,000 tonnes valued at Rs. 865 crores during 1999-2000 (Anon, 2001a). Black pepper is
a common spice produced in oriental countries (mostly in south east Asia including India,
Indonesia and Malaysia) but is used worldwide for its characteristic pungent flavour and taste.
Piper nigrunz L., from which pepper is derived, is a perennial climbing vine or shrub. Fruits,
botanically called drupes but generally called berries, are dark green turning bright orange and
red when ripe, and have a thin testa. On

sun-drying, it turns greyish to dark brown colour, and hence popularly known as black pepper. This
spice is used in foods as whole, cracked, coarse, medium or fine grinds, and also used in the form of
oleoresins (total extracts), The piperine, volatile oil, starch and fibre content values show marked
variations and are indicative of the quality of black pepper. The chemical composition data of black
pepper are: moisture: 8.7-14.1 %, total nitrogen: 1.62.6%, nitrogen in non-volatile ether extract: 2.7-
4.20/0, volatile ether extract: 4.4- 12.0%, starch (by acid hydrolysis): 28.0-49.0%, crude fibre: 8.7-
18.0%, crude piperine: 2.8-9.0%, piperine: 1.7-7.4%, total ash: 3.6-5.7%, and acid insoluble ash: 0.03-
0.55% (Gopalan et at., 1993; Pino et al., 1990; Govindarajan, 1977; Pruthi, 1974).
The characteristic aromatic odour of pepper is 'due to the presence of volatile oils in the cells
of the pericarp. On steam distillation, crushed black pepper yields 1.0-2.6% (up to a maximum of
4.8%) of the volatile oil. The volatile oils are classified into categories like monoterpenes and
sesqueterpenes. The monoterpenes are the lower molecular weight compounds; while sesquiterpenes
possess higher molecular weights.
Many spices including black pepper are ground to coarse or fine particles to provide
convenience to the human consumption. Further, the unit operation of grinding adds to the cost and
hence becomes a process of value addition. The immediate question that arises is the quality of the
ground material; a processor always tries to maintain the same quality in the finished product compared
to the original sample (whole seed). It is obvious that some portion of input mechanical energy is
transformed into thermal energy during grinding. The extent of transformation of mechanical energy
depends on several factors including raw material attributes, type and design of grinding system, and
grinding characteristics of the material. Thus, there is a need to know how these factors affect the
quality and characteristics of the finished product. The other question that arises at this point is that the
extent of deterioration of quality. If so, to what extent and how they are related with those above
mentioned factors because quality directly affects the price. In the present era of competitive world
trade, it is very important that the 'quality of the product should be of international standards. The last
question that arises here is how to maintain or improve the quality of the product. Not much work has
been carried out to find the answers for these
2

questions. There have been few research reports to show that loss in quality taken place during
grinding. But detailed scientific data are still lacking to solve these problems.
The term 'grinding' has become generic in common usage (Perry, 1950). In the present
study, the terms' grinding' and 'size reduction' are used as synonyms though the former has been
used here because of its common usage. Grinding is a very important step in the post harvest
processing of spices requiring special attention in order not to lose the aroma and flavour
compounds present in them (Gopalkrishnan et al. 1991). Spices are ground at one stage or the
other before consumption though whole spices are also used in culinary practices to a certain
extent. Generally, spices are ground either for direct use or making value-added products, such
as, ground spices, mixes, oleoresins, and spice oil extracts which have vast industrial
applications. Spice volatile oils are used in food, cosmetics, perfumery and personal hygiene
products like tooth paste, mouth paste and aerosols besides a variety of pharmaceutical
formulations (Anon, 2001a). Volatile oils of black pepper are extensively used in colognes
where it adds tenacity. Aroma, therapists describe it as useful in massage to alleviate muscular
tension (Sharp, 1991). Its antibacterial and antifungal activities has also enhanced its
applications in pharmaceuticals (McAlpine, 1991). Therefore, the demand for these value-added
products has been increasing in the world trade (Peter, 1999; Pruthi, 1991).
The aim of spice grinding is to obtain smaller particle size with good product quality in
terms of flavour and colour (Singh and Goswami, 1999a). Food processing industry is frequently
using the grinding or size reduction equipment which are generally meant for chemical
processing industries. These mills are not designed to grind the heat sensitive commodities like
spices. In such grinding process, heat is generated when energy is used to fracture a particle into
smaller sizes and this heat is detrimental to the product and results in significant losses of
volatile oils of spices. During grinding, the temperature of the product rises 42-95 C (Pruthi and
Misra, 1963), depending on the type of mill and spice, and on oil and moisture content of spices.
Naturally, exposure to such a high temperature leads to considerable loss of aroma, and flavour,
which should be reduced as spices with low flavour and aroma would fetch poor returns to the
processors.
3

Therefore, it may be desirable to practice grinding at a low temperature. Chilling and
freezing are the possible ways to achieve a product with higher content of volatile oil components.
Low temperature could also be obtained by different methods, viz., circulation of chilled water or a
refrigerant externally to cool the grinding equipment, mixing of dry ice (solid CO2) with whole spice
and then grinding. But these methods are not viable for industrial scale operations due to inefficient
heat transfer rates (Singh and Goswami, 1999a).
However, cryogenic technology is known to be an efficient method of cooling of several
food products. In this technique, the liquid nitrogen at -195.6 C provides the refrigeration needed to
pre-cool the spices and maintain the desired low temperature by absorbing the heat generated during
the grinding operation. In addition to maintaining the low temperature, vapourisation of liquid
nitrogen to the gaseous state, in effect, creates an inert and dry environment for additional protection
of spice quality. Pre-cooling of raw spice and the continuous low temperature maintained within the
mill reduces the loss of volatile oils and moisture thereby retaining most of the flavour strength per
unit mass of spice to yield a product of good quality.
A limited number of research findings on cryogenic grinding of spices have been reported. Some
work has been carried out on conditioning of spices using liquid nitrogen before grinding to reduce
the loss of volatile oils of spice (Anon, 1962). Wistreich and Schafer (1962) worked on the cryogenic
grinding of spices viz., black and white pepper, ginger, coriander, caraway and celery using liquid
nitrogen and achieved an increase of (about 30%) in the content of volatile oil. Strause (1967) while
working on cryogenic grinding of nutmeg and white pepper, has obtained samples with reduced
microbial load as well as increased content of volatile oil. Pesek et al. (1985) and Pesek and Wilson
(1986) have worked on spices viz., white pepper, nutmeg, cinnamom, cumin and orenago. Their
results supported the hypothesis that (1) the light and highly volatile components were more readily
retained through cryogenic grinding than the ambient grinding process and (2) the high molecular
weight components were retained equally well for the two grinding techniques employed.
Gopalkrishnan et al. (1991) have observed that cryogenic grinding using liquid nitrogen and dry ice
provided a superior quality product in terms of
4

volatile oil contents in cardamom. Mckee et al. (1993) have worked on three different grinding
methods viz., ambient, chilled and liquid nitrogen during grinding of nutmeg, and have
observed non-significant differences between the methods in terms of volatile oil content.
Recently, Singh and Goswami (1999b) have' worked on cryogenic grinding (-160 to -70 C) of
cumin seeds and have observed that the content of volatile oil was significantly higheras
compared to ambient (40 to 85 C) grinding. Similar results were also observed during cryogenic
grinding of cloves (Singh and Goswami, 2000).
The reported results on cryogenic grinding gave the following advantages over ambient
grinding: (1) cryogenic grinding reduced the loss of volatile and increased the flavour strength,
(2) extremely fine grinding of spice was possible as it became brittle due to very low and (3)
cryogenic grinding reduced the oxidation of spice volatile oils as evaporating LNz tended to
expel air from the grinding mill. However, the above results were obtained at laboratory scale
grinding studies (200-500 g batch size) and their findings were more general to all the spices.
The objective of the present research is thus to examine the advantages of cryogenic
grinding of black pepper in particular, and comprises of following main areas:
a) Determination of engineering properties of black pepper seeds
b) Studies on the ambient grinding characteristics of black pepper
c) Studies on the cryogenic size reduction (or grinding) of black pepper at both laboratory and
pilot scales, and comparing it with ambient grinding technique with particular reference to
quality of product and grinding characteristics.

CHAPTER 2: REVIEW OF LITERATURE

CHAPTER 2
REVIEW OF LITERATURE
This chapter on Review of Literature provides an exhaustive analysis of details on
researches conducted on cryogenic grinding of spices. In doing so, introductory subchapters on
spices, engineering properties of foods, grinding of spices, grinding and energy laws, cryogens,
cryogenic freezing and use of cryogenics in food processing have been included in order to
make this chapter more meaningful.
2.1 Spices
Spices constitute an important group of agricultural commodities which are virtually
indispensable in the culinary art. The term 'spices' applies to such natural plant or vegetable
products or mixtures thereof, in whole or ground form, as are used for imparting flavour, aroma
and piquancy to and for seasoning of foods (Pruthi, 1974).
There are about 80 spices grown in different parts of the world. Many of these spices
are grown in India. Spices may comprise different plant components or parts such as floral parts
(clove, saffron, etc.) or fruits (cardamom, chillies, etc), or berries (allspice, black pepper,
juniper), or seeds (aniseed, caraway, celery, coriander), or rhizomes (ginger, turmeric), or roots
(angelica, horse raddish and lovage), or leaves (bay leaves, mints, marjoram and tejpat), or
kernel (nutmeg), or aril (mace), or bark (cinnamom and cassia), or bulbs (garlic, onion, etc.), or
other parts of spice plants.
Spices are well-known as appetisers and are considered volatile in the culinary art all
over the world. They add a tang and flavour to otherwise insipid or bland foods. Some of them
also possess antioxidant properties, while others are used as preservatives in some foods like
pickles and chutneys. Some spices also possess strong anti-microbial activities. Many of them
possess medicinal properties and have a profound effect on human health. For instance, spices
intensify salivary now and the secretion of amylase, neuraminic acid and hexosamines. They
flavour the cleansing of oral cavity from food
6

adhesion and bacteria; they may help to check infection and caries, and to protect the mucous
membrane against thermic, mechanical and chemical irritations. Spices increase the secretion of
saliva rich in ptyalin which facilitates digestion of starch in the stomach, rendering the meals which
are rich in carbohydrates, easily digestible.
In India, the major spices are black pepper, ginger, cardamom, turmeric and chillies. Pepper
is the most important spice of India and, is termed as 'King of Spices', and is also known as 'Black
Gold of India' followed by cardamom, which is called the 'Queen of Spices'.
The present thesis is on Indian spices particularly, black pepper. Hence, the subsequent
section will deal with that spice.
2.1.1 Black Pepper
The botanical name for black pepper, green pepper and white pepper is Piper nigrum Linn.
They belong to family of Piperaceae.
Black pepper constitutes an important component of culinary seasonings throughout the
world and is an volatile ingredient of numerous commercial foodstuffs. It is an important constituent
of whole pickling spice and many ground spice formulae of seasonings; examples include poultry
dressings, sausages, soups, hamburger and frankfurter seasonings.
Black pepper is the dried mature but unripe berries (fruit) of Piper nigrum, a branching vine
or climbing perennial shrub mostly found in hot and moist parts of Southern India, notably Kerala
(contributing about 96% of India's, production), Karnataka, Tamil Nadu and Pondicherry. It is one of
the most ancient crops cultivated in India and has probably originated from the hills of South-
Western India where it is grown in the wild state in the rain forests from North Kanara (a district in
Karnataka, India) to Kanyakumari. It is also cultivated in Indonesia, Malaysia, Sri Lanka, Brazil,
Thailand and other tropical countries (Pruthi, 1974).
7

There are many varieties of black pepper known in the world trade. They take their
names from the localities where they are grown or from the ports through which they are
exported e.g., Tellicherry, Malabar, Alleppey, Lampong, Saigon, Penang and Singapore. These
varieties of black peppers differ marginally in their physical and chemical characteristics,
colour, size, shape, flavour and bite. Peppers from Tellicherry and Alleppey are large,
attractive, dark-reddish-brown to black and highly aromatic. The Malabar variety of pepper
alone accounts for nearly 90% of the total export from India. Lampong and Singapore pepper
are smaller, more shrivelled but almost equally pungent There are nearly 24 varieties of black
pepper grown in India and their identification is rather difficult, since some of them go by
different names in different regions.
The spikes/fruits are ready for harvest when they are fully mature and start yellowing or
become yellowish. At this stage, the whole spikes are removed from the vines with the aid of
ladders. The spikes are kept for a day or so, thereafter the berries are removed by rubbing or
scrubbing, and dried in the sun, or the spikes are directly dried in the sun for a few days on mats
or on clean concrete floors. They are turned over and later, berries are removed by rubbing,
threshing or trampling. When completely dry, the outer skin of the berries becomes dark brown
to black and get shrivelled. Generally, 100 kg of fresh berries yield about 26-39 kg of black
pepper of commerce. Of course, the yield of pepper varies widely in different producing areas
depending on several factors such as elevation, temperature, distribution of rainfall, soil fertility,
cultural practices, types or variety of pepper and age of the pepper vine, etc. In India, the yield
varies from 110 kg to 335 kg per hectare (Pruthi, 1974).
1.
In addition to black pepper, the pepper is also available in the following processed
forms such as white pepper and processed green pepper which is described in the subsequent
sections.
2.1.2 White Pepper
White pepper and black pepper are prepared from the berries (fruits) of the same plant or
spices (P. nigrum). The only difference is that for preparing black pepper, spikes are harvested
when berries are fully mature, but unripe, i.e., when green or greenish
8

yellow, but for preparing white pepper, the harvesting of berries is delayed until they become ripe
i.e., yellowish red or red in colour. White pepper is prepared by removing the outer pericap (skin) of
the harvested berries, either before or after drying.
2.1.3 Processed Tender Green Pepper
Tender green pepper spikes are harvested when they are semi-mature and these are sold in
market for use in pickles. Besides, canned of tender green berries in 2% brine in different sizes of
cans are also made available. The optimum stage of maturity for harvesting, for canning and
processing purposes have been determined to find ways to prevent the triple problems of cloudiness
in brine, rupturing of berries and sedimentation (Pruthi, 1974).
2.1.4 Constituents of Black Pepper
Analysis of 23 types of black pepper from Kerala, South and North Kanara regions, Coorg
and Assam gave the average ranges of'values as follows: moisture: 8.714.1 %; total nitrogen: 1.6-
2.6%; ether extractives: 4.4-12.0%; starch (by acid hydrolysis): 28.0-49.0%; crude fibre: 8.7-18.0%;
crude piperine: 2.8-9.0%; piperine: 1.7-7.4%; total ash: 3.6-5.7% and acid in soluble ash (sand):
0.03-0.55% (Pruthi, 1974). The wide variation in moisture content is due to maturity level, time of
harvest and variety. The high content of fibre gives the spice the rigidity and structural integrity.
2.1.5 Volatile oil of Black Pepper
The characteristic aromatic odour of pepper is due to the presence of a volatile oil in the
cells of the pericarp. On steam distillation, crushed black pepper yields 1.0-2.6% (up to a maximum
of 4.8%) of volatile oil. The yield depends mainly on the age of the dried fruits. Oil of pepper is an
almost colourless to slightly greenish liquid with a characteristic odour of pepper and also of
phellandrene. The oil has a mild but not pungent taste, and has the following range of values viz.,
specific gravity at 15 C: 0.873 _ 0.916; optical rotation: _10° to +3°; refractive index: 1.480 - 1.499.
Pino et al. (1990)
9

have identified and reported as many as 46 compounds present in volatile oil of black pepper
(Table 2.1).
Table 2.1 Constituent compounds of black pepper volatile oil
(Pino et al., 1990)
Compound % oil* Compound % oil* Compounds present in trace quantities
limonene 19.0 (E)sabinene hydrate 0.4 β-elemene
sabinene 19.0 camphor 0.1 δ-elemene
car-3-ene 16.0 terpinen-4-ol 0.8 α-guaIene
β-pinene 12.0 α-terpineol 0.2 α-cubebene
β-caryophyllene 10.0 α-copaene 0.2 α-curcumene
α-pmene 8.2 1,8-cineol 0.1 δ-guaiene
nerolidol 2.5 (Z)-:sabinene hydrate 0.7 nerol
myrcene 1.2 linlool 0.8 eugenol
α-phellendrene 1.3 α-humulene 0.3 cadinene
α-thujene 0.8 α-selienene 0.6 β-selinene
caryophyllene 0.7 β-bisabolene 0.6 (E)(E)-β- farnesene Ox.ide camphene 0.1 (E) -β-ocimene 0.1 (Z)(E)-farnesol
α-terpenene 0.1 γ-terpene 0.2
p-cymene 0.3 terpinolene 0.2
(Z)-β-ocimene 0.1 β-eudesmol 0.6
clemol 0.9 humtilene oxide 0.1
δ-cadanol 0.5 guailol 0.2
* Values are out of total volatile oil basis
The volatile oils are categorised into monoterpenes and sesqueterpenes. The
monoterpenes are the lower molecular weight compounds, while sesquiterpenes are higher
molecular weight compounds. The characteristics (chemical formula, molecular weight and
boiling point) of the ten major compounds are shown in Table 2.2.
10

Table 2.2
Characteristics of compounds of black pepper volatile oil (Burdock,
1995; Buckingham, 1995) Compounds of V
Volatile oil
(A) Monoterpenes
1 α-thujene 2 α-pinene 3 β-pinene 4 1,8-cineole 5 limonene 6 myrcene
(B) Sesqueterpenes
1 α-copaene 2 β-caryophyllene 3 β-bisabolene 4 caryophyllene oxide
- Data not available
Chemical formula Molecular weight Boiling Point (C)
ClOH16 ClOHI6C lOH 16 C10HlsOC ClOH16 ClOH16
136.23 136.23 136.23 154.24 136.23 136.23
163-165 156 162-166 176-177 176-178 65-66
C15H24 C15H24 C15H24 C15H26O
204.34 204.34 204.34 222.00
246- 251 254- 257
- -
2.2 Engineering Properties of Food
Engineering properties of foods are important for scale-up, product/process design and optimization,
and for storage of foods. Though engineering properties can vary widely, they may be roughly categorised
as physical properties related to size, shape etc., mechanical properties, thermal properties, rheological
properties and aerodynamic properties. The subsequent sections will discuss these properties related to
grinding of species
2.2.1 Physical Properties of Food
The physical properties of food may be defined as those properties that lend themselves to
description and quantification by physical rather than chemical means. Their
11

importance stretches from product handling to processing to consumer acceptance (Szczesniak,
1983). The parameters which are important in handling are shape, size; roundness, sphericity,
volume, density, surface area, etc. Further, storage of grains and seeds in bins and silos, mechanical
harvesting, and transport of fruits and vegetables over long distances require that the products
withstand static and dynamic loading, the latter being impact type loading. Thus, the engineering
parameters having a bearing on the behaviour of foods on handling must encompass the stress-
strain-time relationship. Friction, as in silos, both against the surface of the grain and against the
surface of the construction material is another physical system of importance.
2.2.1.1 Size and Shape
The size and shape of an agriculture commodity, or of a processed product, not only affect
the degree of consumer acceptance but in many cases influence packaging, distribution of stresses
when forces are applied, and processability. As pointed out by Medalia (1980) "to define the shape
of a body fully, one must specify the location of all points on the external surface." This is not only a
time consuming process but also poses mathematical difficulties for more irregular shaped
commodities. Therefore, qualitative shape description is the most popular with food graders. The
shapes of fruits and vegetables have been classified into 13 categories such as round, oblate, oblong,
conic, elliptical, truncated, ribbed, etc. (Mohsenin, 1980). Figure 2.1 shows the charted standard for
describing the shape of apple fruit.
The most prevailing method for quantitative shape description involves calculations of
similarity to a sphere:
Sphericity (S) = (a b c)1/3 x I00/a (2.1)
where 'a' is the major axis of the product, 'b' is the medium axis of the product and 'c' is the minor
axis of the product. Published values for the sphericity of fruits are of the order 89-97. These values
are expressed as the percentage; the higher the number, the greater the similarity to a sphere.
Oblong-shaped products, such as rice, would exhibit a low value of sphericity (Mohsenin, 1986).
12

Fig. 2.1 Some standard shapes for describing the shape of an apple.

Other ways of describing the shape of an object involve estimations of roundness, i.e.,
sharpness of the corners, measurement of axial dimensions, resemblance to geometric bodies
(Mohsenin 1986), an'd angle of curvature (as in pickles).
Roundness (Rd ) = Api Ac (2.2)
where Ap is the largest projected area of the object in natural rest position and Ac is the smallest
circumscribing circle. A value of roundness (Rd) equal to unity is a perfect sphere, and increase in
the value indicates more sharpness in the product.
Size is usually characterized in practice by determining the opening, as in a sieve or screen,
through which the product will or will not pass. This method is used with both whole and ground
materials. Although simple and widely used for grading agricultural commodities (e.g., peas,
cherries, potatoes), the method had considerable disadvantages, the main one being the fact that
sieving separates the product according to the narrowest dimension. It is most appropriate for
products that are approximately spherical in shape. For oblong materials, such as rice, slit screens are
used (Szczesniak, 1983).
Other practical methods of determining the, sizes of fruits and vegetables are diameter or
length measurements, and counts per weight or volume. With fruits, the larger size is most desirable
for the trade market. The other way of expression is weight per 100 or 1000 seed.
Only recently that serious attention has begun to be paid for originating more appropriate
methods for characterising the three-dimensional shapes and sizes of food powders. This has come
with the realisation that these physical properties affect aerodynamic and hydrodynamic
characteristics, mixing, segregation, and other types of behaviour that often lead to processing
problems, as well as detract from quality in the hands of the consumer.
14
2.2.1.2 Volume and Density
Measurements of volume and density of liquid foods are relatively easier methods, other
than proper control of moisture content and temperature at which the measurements are made.
Standard volumetric methods for volume quantification and pycnometer or commercial density
meters for density are simple and straight forward techniques. But, measurements are more
complicated for solid foods, especially those of porous nature. Volume of agricultural products,
especially those exhibiting an irregular shape, is usually determined by liquid (water or kerosene)
displacement method. The product is weighed in air and in water (using any analytical balance, or a
special gravity balance) and the volume is calculated:
Volume = (Weight in air -Weight in water)/Weight density of water (2.3)
Density of solids can be calculated as the ratio of weight and volume, or can be determined
by floatation in liquid of a different density. The density of liquid in which the product would neither
sink nor float is equivalent to the density of the product. Separation by density in floatation is also
used with many agricultural commodities to remove defective materials and extraneous matter.
Food powders pose problems in volume and density measurements because of their packing
characteristics. Generally, two types measurements are useful: free flow density and tapped density,
the difference being in the manner of filling the volumetric container. Tapped density gives a higher
number than free flow density because of partial displacement of air from between the particles. Free
flow and tapped density relate to the container fill and settling during shipment and handling.
2.2.1.3 Surface Area
Surface area has a bearing on heat transfer in heating and cooling, during storage and
handling processes. A number of methods have been developed for calculating the surface area of
products such as fruits and eggs based on shape factor measurement (e.g., area of transverse cross
sections, transverse diameters, areas of actual or longitudinal
15

cross sections). Many empirical equations have been developed relating weight or volume to surface
area. These resulted in reasonable values of the correlation coefficient and can be used to estimate
the surface area by knowing weight of the fruit or egg. Typical values for the surface of fruits are
apples, 17.2-25.2 sq.in., plums, 5.4 -7.0 sq.in, pears, 22.2-23.0 sq in. (Mohsenin, 1980).
2.2.1.4 Colour
Colour is one of the most important quality attributes because it directly affects appearance
and subsequently the consumer acceptance. It can signal a high quality product (such as the golden
yellow of a table orange) or can alert the consumer to a potential physiological danger (such as green
processed meat). Furthermore, it is well recognised that colour has important psychological
implications that can inl1uence the mood and emotional state of the human being. Techniques for
measuring the colour of food are quite advanced. It is known that human vision responds to a tri-
stimulus in the sensory perception of colour. The eye possesses three types of light-sensing devices
each corresponding to different bands of wave lengths. It is generally accepted that these are red,
green and blue. Spectrophotometric methods for colour description are also based on three
dimensions: rel1ectance (lightness or value), dominant wavelength (hue), and purity (chroma or
intensity). The popular instruments viz., Hunter, Gardner or Macbeth makes use the opponent colour
scales (L a b type). The L dimension defines the lightness; the a dimension reference to red-green
hues; and the b dimension refers to blue-yellow hues (as shown in Fig. 2.2) (Szczesniak, 1983).
Advanced colour measuring system such as cm methods can express colour completely and are
now used widely.
2.2.2 Mechanical Properties of Food
Mechanical properties of food have received the greatest attention lately. The reason for this
activity is the fact that, in addition to affecting the mechanical behaviour of the product during
transport, handling and processing, the mechanical properties form the basis for the sensory property
or texture. During mastication and industrial size reduction processes (e.g., slicing, grinding,
pureeing) it is desirable to have a 'weak' product - one that will disintegrate in the proper manner
when forces are applied. On the other hand,
16

Fig. 2.2 Hunter (L a b) colour description and quantification.
17

during transport and industrial handling, it is desirable to have a 'strong' product _ one which will
not suffer any substantial damage when impact or static compressive forces are applied
(Szczesniak, 1983).
Mohsenin (1980) has defined the mechanical properties "as those having to do with the behaviour of
the material under applied forces." Rheology has been defined as "a science devoted to the study of
deformation and flow," and more recently as "the study of those properties of materials that govern
the relationship between stress and strain" (Dealy, 1982). Stress is defined as the intensity of force
components acting on a body and is expressed in units of force per unit area. Strain is the change in
size or shape of a body in response to the applied force. Strain is a non-dimensional parameter
(reported as a ratio or percentage) and is expressed as change in relation to the original size or shape.
The ratio of stress to strain is called the 'modulus' - compression modulus, tensile modulus1
or shear modulus. When an elastic material is compressed, the stress-strain plot is a straight line
starting at the origin and its slope is called "Young's modulus of elasticity." Many foods exhibit this
behaviour under small compressions before the socalled 'limit of elasticity' is reached. The maximum
stress that the material is capable of sustaining before rupture is called "strength" - compressive
strength, tensile strength, or shear strength.
Szczesniak (1983) has defined mechanical characteristic (in relation to sensory attributes) of food:
(a) Hardness -the force necessary to attain a given deformation
(b) Cohesiveness - the strength of the internal bonds making up the body of the product (c)
Viscosity - the rate of flow per unit force
(d) Springiness - the rate at which a deformed material goes back to its undeformed condition after
the deforming force is removed
(e) Adhesiveness - the work necessary to overcome the attractive forces between the surface of the
food and the surface of other materials with which the food comes in contact (e.g., tongue, teeth,
finger, palate, etc.)
18

(f) Fracturability - the force with which the material fractures. It is related to the primary
parameters of hardness and cohesiveness. In fracturable materials, cohesiveness is low and
hardness can vary from low to high levels
(g) Chewiness - the energy required to masticate a solid food product to a state ready for
swallowing. It may be related to the primary parameters of hardness, cohesiveness and
springiness
(h) Gumminess - the energy required to disintegrate a semi-solid food product to a state ready
for swallowing. It is related to the primary parameters of hardness and cohesiveness. With
semi-solid food products, hardness is low.
2.2.2.1 Rheological Properties
Rheologically, a material may deform in three ways: elastic, plastic, or VISCOUS.
In an ideal elastic body, deformation (or strain) occurs instantly the moment stress is applied, is
directly proportional to stress, and disappears instantly and completely when the stress is
removed. In an ideal plastic body, deformation does not begin until a certain value of stress
(called the yield stress) is reached. Deformation is permanent and no recovery occurs when the
stress is removed. In an ideal viscous body, deformation occurs instantly, the moment stress is
applied, but - in contrast with an elastic body - it is proportional to the rate of strain and is not
recovered when the stress is removed. These three types of behaviour are denoted by a spring, a
friction element, and a dash pot, respectively. They can be arranged in series or in parallel and
in any number to depict the fact that a real material usually exhibits a combination of
rheological behaviour types. Figure 2.3 shows some typical rheological models. Food products
usually behave as a combination of elastic and viscous elements; such materials are called
viscoelastic and their stress-strain relationship depends on the rate of strain that introduces the
time dependency. When the stress-strain ratio is a function of time alone, the material is said to
be linearly viscoelastic. When the stress-strain ratio is a function of stress, the material is said to
be non-linearly viscoelastic (Szczesniak, 1983).
19

Kelvin-Voigt model Maxwell model
Fig. 2.3 Commonly used rheological models based on springs and dashpots.
20

2.2.2.2 Behaviour of Solids
The behaviour of foods in compression is one of the easiest and most important
mechanical tests to perform. Universal testing machine such as Instron, provides means of
applying, detecting, and recording the forces of sample resistance. A typical compression force-
deformation curve for a foodstuff is shown in "Fig. 2.4. As indicated, a number of mechanical
parameters can be quantified from such a curve. The slope of the initial straight line portion is
taken as the elastic modulus and is often considered to be a measure of firmness. The Fig. 2.4 also
shows two yield points. The first point of inflection indicates a bio-yield-failure of some structural
elements in the tested biological material. The final yield point is the rupture yield - massive
failure of the specimen. It is equivalent to the compressive strength. Compression testing of foods
is usually done at deformation rates of 20-500 mm min-I whereas impact testing involves very
high deformation rates of the order of 90 m min-I and upward (Szczesniak, 1983).
Tensile measurements, in general, are difficult to perform on foods because of their
geometry and gripping problems with materials whose geometry lends itself to this type of a test.
Tensile parameters are important in mastication since the wedging action of teeth imposes tensile
stresses (Voisey and deMan, 1976). However, the commonly used measurement technique for
foods involves compression than tension.
2.2.2.3 Stress Relaxation
When a constant strain is applied to a body, the decrease in stress as a function of time is
called stress relaxation. It is called by the inner flow of the material, which is governed by its
viscosity. The ratio of viscosity to the shear modulus is called the relaxation time. A typical stress
relaxation curve for an agricultural product is shown in Fig. 2.5. It illustrates that the rate of
relaxation and residual stress at any given time depend on the initial force and deformation applied
and the rate at which the test material is initially deformed. The greater the extent of initial
deformation and of applied force, the higher the residual stress, and faster the relaxation rate. The
slower the rate of initial deformation, the slower the material appears to relax.
21

S : modulus of elasticity; BYP : bioyield point; RP: rupture point
Fig. 2.4 Force-<leformation curve during compression of food.
22

Fig. 2.5 Stress relaxation curves at different extent of initial compression.
23

A convenient way of expressing stress relaxation is to measure the time required for the
force to relax to a given percentage (e.g., 60%) of its initial value. The equation for a viscoelastic
body is given by
't(t) = 'to . exp( -t/ά) (2.4 )
where 't(t) is the stress at time t, 'to is initial stress and a is the relaxation time that characterises
the material response. This quantity is determined by plotting log t(t)/to versus time. to is the initial
stress. The slope of the linear portion of the curve is (-1/α).
The stress relaxation test is a very useful supplement to the compression test (Peleg, 1977;
Peleg and Calzada, 1976). The shape of the curve can be related to the elements in the rheological
model. The test can also yield information about the structural changes that might have occurred
on previous deformation and about the material's rheological memory and the past history.
2.2.2.4 Creep
When constant stress is applied to a body, the increase in strain as a function of time is
called creep. The ratio of strain at any time t to the constant stress is called creep compliance.
Creep testing instrument requires a special capability with the Instron to keep the stress constant
and record the change in deformation (creep) as a function of time (Szczesniak, 1983). At present,
sophisticated rheometers usually have the facility to conduct creep testing.
2.2.2.5 Bulk Properties
The bulk properties of fine powders are always interdependent, and are determined by
both the physical and chemical properties of the material (e.g., composition, moisture content), the
geometry, size· and surface characteristics of the individual particles, and history of the system as
a whole (Peleg, 1983).,The shape of the container can affect flowability, and the powder density
usually increases as a result of vibration for example. Numerical values assigned to such
properties, therefore, ought to
24

be regarded as useful only under the as said conditions or as indicators of an order of magnitude
only.
2.2.2.5.1 Bulk Density and Porosity
Bulk (or apparent) density is the mass of particles that occupies a unit volume of the bed.
It is usually determined by weighing a container of a known volume and dividing the net weight
of the powder by the container's volume. Porosity is the fraction of volume not occupied by a
particle or solid material and therefore, it can be expressed (Peleg, 1983) as either
Total porosity = 1 - (Bulk density/Solid density) (2.5)
Inter particle porosity = 1- (Bulk density/Particle density) (2.6) or
As powders are compressible, their bulk density is usually given with an additional
specifier: loose bulk density (as poured), tapped bulk density (after vibration), or compact density
(after compression).
2.2.2.5.2 Angle of Repose
The angle of repose (Fig.2.6) is an indispensable parameter in the design of processing,
storage and conveying systems. Its magnitude, however, depends on the way in which the sample
or powder heap is formed (e.g., the impact velocity), and therefore published values are not always
comparable (Brown and Richards, 1970). In cohesive powders, the measurement of the angle itself
is sometimes difficult because of the irregular shapes that the heaps can assume. The angle of
repose is sometimes confused with the angle of internal friction. Although its magnitude is
certainly influenced by frictional forces (especially in free-flowing powders) it is also affected by
inter particles attractive forces - a factor that becomes dominant in wet and cohesive powders.
According to Carr (1976), angles of up to about 35 degree indicate free flowability, 35-45
degree some cohesiveness, 45-55 degree cohesiveness (loss of free

Fig.2.6 Mcasurement of angle of repose by different methods.
2(1
flowability), and 55 degree and above indicates very high cohesiveness with limited flowability.
2.3 Theory of Size Reduction
The present thesis deals with studies on the cryogenic grinding of spice, and hence, it is
desirable to discuss different aspects of grinding. According to Cleef (1991), in the early 1980s,
more than a billion tonnes of solid materials were mechanically reduced in sizes - crushed and
ground - annually in the United States, as the demand for powders was growing both in quantity
and sophistication.
The comminution or size reduction (Prasher, 1987) deals with solids in which complex cohesive
bonds exist between atom and atom, and between molecule and molecule, which are arranged in
ordered arrays, unlike in gases, for which the atoms and molecules are disordered. Not only are
there cohesive bonds, but there are also repulsive forces or a solid would tend to shrink and so
increase in density at constant temperature, which is not true. There exist both attractive and
repulsive forces between the atoms or molecules which get neutralised, resulting in a state ,of
equilibrium. This equilibrium is not static but dynamic, and the inter-atomic distance fluctuates
because of the thermal motions of the atoms; but it has a mean value which increases with
temperature. Rupture is possible because the net force of attraction between two atoms becomes
very small at a distance as little as 10% greater than the mean atomic distance at room
temperature.
Rupture takes place usally by tensile stress. Compressive stress just pushes atomic nuclei
closer together. When compressive forces applied to a particle produce rupture, they generate
tensile stresses within the particle. When shear accompanies compression, there is a tendency for
layers of atoms to slide over each other, and with sufficient shear, particle rupture can occur.
Fracture can be produced by thermal means alone because increase in temperature implies an
increase in mean atomic distance as well as increased amplitude of vibrations. These manifest
themselves in thermal expansion, and differential thermal expansion leads to rupture. Similarly,
rupture c~n be aided by chemical means because stressed bonds between atoms and molecules are
more prone to chemical attack than are unstressed bond (Prasher, 1987).
27

The theory of cracking in brittle materials, developed by Griffith (1920) focuses on how a
chunk of material spends its energy budget. He noted that real solids are weaker than they might
seem, because they contain microscopic flaws. A crack (or any flaw) in a brittle material reduces
its tensile strength and leads to instability. If the material is subjected to sufficient stress, the built-
up strain energy is expended rapidly in the creation of multiple failures. Once the crack starts, if
the strain in not rapidly relieved, the system becomes unstable and crack propagation accelerates
to high velocities, reaching 40% of the speed of sound in the solid. During this rapid progress, the
strain energy relaxed will exceed the energy associated with new surface produced, and the
surplus energy can concentrate on other cracks in the material and propagate these also. Hence,
once a crack begins to spread, multiple fracture can occur.
Figure 2.7, shows the stress-strain diagram for various types of solids (Loncin and
Merson, 1979). When the applied stress remains below a limiting value, the deformation which
the material experiences is elastic, i.e., the material returns to its original shape when the force is
removed. If the stress exceeds the elastic limit, the material undergoes permanent (inelastic)
deformation until it reaches the yield point and it begins to flow (region of ductility) under the
action of the applied stress until it finally breaks. This process defines the elastic stress limit, yield
stress, the breaking stress, and the region of ductility.
The breaking stress or ultimate stress is a property of the material. Breaking in a piece
occurs along cracks or defects in the piece structure. For a large piece, which has many such
defects, a small stress may cause breakage with very little deformation. As the size of the piece is
reduced, fewer defects remain and the breaking strength increases. In the limit of very small
particles, purely intermolecular forces must be overcome.
Elastic state of material is described often by Hooke's law. The most important
characteristic is the modulus of elasticity, which is the stress causing a unit change in length in the
same direction as the applied force. The Poisson coefficient or bulk modulus permits prediction of
the transverse contraction or expansion, which occurs when a stress is applied longitudinally. The
modulus of rigidity expresses the relationship between shear stress and shear strain.

E : elastic limit; Y : yield point; B : breaking point
Fig. 2.7 Stress-strain diagrams of various solids
29

Inelastic behaviour is defined for stresses greater than the elastic limit but smaller than the
breaking limit. Hardness is an. important property of the material. The empirical scale of Mohs is
often used; Diamond having highest hardness (l0 Mohs) and Talc having the least hardness (l
Mohs) in this scale.
2.3.1 Mechanism of Size Reduction
Loncin and Merson (1979) have reported that size reduction could be achieved by
different mechanisms and sometimes with combination of two or more such mechanisms. The
method of application of force to a particle is found to affect the breakage pattern. The basic
methods of force application (Loncin and Merson, 1979; Prasher, 1987) are, (1) impact - particle
concussion by a single rigicl force, (2) compression - particle disintegration between two rigid
forces, (3) shear - the wrenching apart of a particle by the action of rigid force or swirling of a
fluid, (4) attrition or rubbing - the scraping of , one surface on another, be it particle against a rigid
force or particle against particle. Figure 2.8, shows stress mechanisms which can result during
particle size reduction.
Various commercial size reduction or grinding machines have been listed Crable 2.3)
which are used for food applications, and the schematic diagrams have been given (Fig. 2.9).
Cracking behaviour of a material depends on whether the material is brittle or ductile, and on the
type of stress applied (Cleef, 1991). Many mechanisms have been developed, such that some
machines squeeze, or apply stress between two solid surfaces, resulting in compression as well as
friction between the pieces being squeezed. Another group of machines uses impact, or stress
against a single surface; the surface may be a plate or another particle. And yet another mechanism
is cutting, which creates shear stresses, used primarily for tough, plastic materials. A brittle
material, which deforms elastically before cracking, develops cracks that extend from the point to
point of impact. A ductile material deforms plastically under compression, forming a contact
surface from which meridional fractures develop (Rumpf, 1990; Austin, 1984).

Table 2.3
Types of grinders and their applications
(Lone in and Merson, 1979) Method of size reduction
2. Impact forces
Name of the equipment
Pinned disk mill
Hammer mill
Blast mill
Hammer cage mill
2.Impact and Ring beater mill shear forces
3. Abrasion
4. Section
Disk beater mill
Toothed disk mill
Cutting granulator
Peripheral speed
(m s-1)
80-160
40-50
40-110
70-90
50-70
70-90
5-16
5-18
Materials ground
Pepper, nutmeg, clove, mustard, roasted nuts, sugar, cocoa.
Sugar agglomerate, cocoa, press cake, tapioca, dry vegetables, extracted bones.
Pepper, pectin, cocoa, dry protein, sugar.
Ginger, root & bark, drugs, tobacco leaves and stems
Pepper, vegetables, oil press cake, pectin, algae, paprika
Common cereal grains, dry whey, milk powder, lactose
Wheat, pepper, linseed, fennel, bitter orange, corn, junifer berries
Fish meal, dried fruit, dried vegetable, frozen coffee extract, cocoa, press cake
31

1,2. Stress and cutting between surfaces, 3. Shear stress, 4. Impact against a solid
surface, 5. Impact with another particle, and 6. Rubbing friction.
S - represents stress and V -represents motion
Fig. 2.8 Common stress mechanism for particle size reduction.
32

1. Pinned disk milk; 2. Blast mill and wing beater mill; Hammer-cage mill
4. hammer mill; 5, 6. Toothed disc mill, vertical and horizontal; 7. Ball mill;
8. Cutting granulator; 9. Air jet mill
Fig.2.9 Commercial size reduction machines
33

2.3.2 Energy for Size Reduction
Grinding is an energy intensive operation wherein almost 99% (Loncin and Merson, 1979) of the
energy dissipated as heat resulting in high temperatures of product and equipment. Only about 1
% of energy is useful in creating new surfaces. There is no general method for predicting the
energy needed for size reduction. Elastic and plastic properties of a given food material often vary
with moisture content and the distribution of water in the material. Further complications arise
because these properties are often strongly unisotropic, the various layers or parts having
extremely different mechanical resistances. Also the properties of materials can vary with the rate
at which the stress is applied; some materials are plastic and ductile if the stress is applied slowly,
but can be elastic or brittle if the stress is applied as by impact.
The minimum work of distortion can be measured by placing a sample in tension (or
compression) in a machine (such as an Instron universal testing machine) which simultaneously
measures both the applied force (Fa) and the elongation (I) upto the breaking point (Loncin and
Merson, 1979). The energy (Er) for breaking the piece is obtained by mathematical integration of
applied force over the limits of elongation (Eq. 2.7); I
(2.7)
However, if several particles of same material, size and geometry are stressed in turn
under similar conditions of stress application, the amount of comminution energy is found not to
be a unique quantity, but varies with the flaw pattern of the individual particle (Prasher, 1987).
Hence, to obtain an unique measurement of comminution energy, a sufficient number (Beavan,
1980) of such particles must be similarly stressed to obtain a statistical average energy.
2.3.3 Energy Laws
The energy laws for causing breakage must be related to initial and final particle size
conditions. For single-particle tests, the initial conditions may be the diameter of the sphere used
or for irregularly shaped particles, two narrowly spaced sieve sizes. For
34

particle bed tests, the initial condition may be an assemblage of spheres of stated diameters, or
irregularly shaped particles between two sieve sizes, or a full distribution of sizes. In all cases, the
final condition after breakage will be a complete size distribution.
The equations for estimating the energy needed for grinding solids have been developed based
on the energy needed for causing deformation, creating new surface, or enlarging cracks. An empirical
equation for grinding energy (Es) per unit mass of material is given by Walker et al. (1937):
(2.8)
where D is a characteristic size of the particles, and kg and m are empirical constants. The following
laws have been derived based on the Eq. (2.8).
2.3.3.1 Rittinger's Law Rittinger (1867) postulated that the particles which would not deform before breaking would
be infinitely brittle. Therefore, the energy needed to break a particle depended only on the change in
surface area. Hence, he used m =2 in the Eq. (2.8), and integrated between the initial size D, and final
si/.e D2 10 arrive at the following equation
(2.9)
where kr is the Rittinger's constant. The brittleness is most important for large-sized particles, and
Rittinger's law appears to hold best for large brittle products.
2.3.3.2 Kick's Law
Kick (1885) postulated that deformation of the piece was primarily responsible for the energy
required for size reduction, and assumed m=l in the Eq. (2.8), and integrated between the initial size Dl
and final size D2 to arrive at the following equation
(2.10)
35

where kk is the Kick's constant. The deformation is most apt to be important for very small
particles, and in fact, Kick's law best corresponds to small particles. A ductile material deforms
plastically under compression, forming a contact surface from which meridional fractures
develop (Rumpf, 1990; Austin, 1984).
2.3.3.3 Bond's Law
Bond (1952) used a value of m=1.5 in Eq.(2.8) to define a work index, Eo in
dimensionless form, using 100 11m as the reference particle size, and suggested the following
equation
(2.11 )
where, the term work index Eo. is the total energy required to break from infinite size to 80%
passing through 100 microns. The Eq. (2.11) is an empirical one; Dl is defined as diameter (in
11m) of the sieve opening which will allow to pass 80% of the weight of material before grinding
and D2 is the opening which will pass 80% after grinding. The values of Eo for hard, brittle foods
such as sugar and grain are in the range of 40 - 80 kJ kg-1 . If Rittinger's law is best applicable for
large particle sizes and Kick's law for small particle sizes, the Bond's law is best suited for
medium sized particles. The typical plots of energy utilization versus specific energy when the
laws of Rittinger, Kick and Bond are applicable are shown in Fig. 2.10 (Prasher, 1987) .
2.3.3.4 Holmes' Law
Holmes (1957) introduced a variable exponent q in place of the power 0.5 as has been
used by Bond (1952), because the three laws cited here have inadequacies to express surface-
energy relationships. Therefore, the Eq. (2.11) becomes
(2.12)
36

Fig 2. 10 Plots of energy utilisation versus specific energy using (a) Kick, (h) Bond and (c) Rittinger energy laws 37

Charles' Law
(2.13)
Charles (1952) also incorporated a variable exponent into the energy equation and
gave
where nl is the slope of the straight-line portion of the plot.
2.4 Size Reduction or Grinding of Spices
Size reduction or grinding of spices is an important step in processing as it involves the loss of
volatile oil and aroma present in' them. Generally, spices are ground either for direct use or for
making value added products like oils or oleoresins. Grinding facilitates the release of aroma and
flavour components and uniform mixing with food materials. At the same time, the grinding of
spices results in considerable loss of aroma due to heat generated during ambient grinding of
spices. The temperatures of ground material and the mill can reach during grinding can be as high
as 95-100 C (Wi streich and Schafer, 1962). Since the spices are valued for their aroma and
f1avour, prevention of their losses assumes importance (Gopalkrishnan et al., 1991). In large scale
industrial grinders where continuous grinding is undertaken, gumming of grinder walls and sieves
(Anon, 1962) results in frequent stopping of mill for cleaning works and hence reduces the
grinding rate and production capacity. Spices which are fibrous in nature, consume enormous
energy and time during grinding.
2.5 Cryogenics
"Cryogenics" is defined as 'making icy cold' and is often used as a synonym for extreme
cold. The National Bureau of Standards (NBS), UK (Kim and Hung, 1994) has defined cryogenic
temperatures as -150 C. Parker (1984) has defined cryogenics as a branch of engineering
specialising in technical operations at low temperature, about -160 to -50 C in range.

Cryogenic Fluids and Their Properties
Cryogenic fluids (or cryogens) are those which boil at cryogenic temperature at
atmospheric pressure. Many fluids, for example, hydrogen, helium, nitrogen, oxygen, inert gases,
air, methane, carbon dioxide, etc., exhibit this property. Liquid nitrogen and carbon dioxide
(liquid or solid) are the two major cryogens used for food applications. Table 2.4 shows the
properties of major cryogens used in food systems. It indicates that LN2 not only posesses the
lowest boiling point but also highest thermal conductivity and highest total usable refrigerating
effect, which is desirable for cryogenic food processing applications.
Table 2.4
Properties of cryogenic fluids used in food systems (Fellows, 1988)
Properties of cryogens LN2 CO2 Freon-12
Density (kg m-3) 784 464 1485
Boiling point (C) -196 -78.5 -29.8
Thermal conductivity 0.29 0.19 0.10
(W m-1 K-1)
Specific heat capacity 1.04 2.26 0.98
(liquid, kJ kg-1 K-1)
Latent heat of evaporation 358 352 297 (kJ kg-1)
Total usable refrigeration effect (kJ kg-1)
690 565 297
2.5.2 Theory of Cryogenic Size Reduction of Food
Cleef (1991) reported that conditions such as temperature also affect materials response to
stress; tough, rubbery materials, for instance, sometimes crack easily at very low temperature.
Mixtures that easily melt and crystallise, such as cocoa press cake (the form in which the cocoa
beans are processed), also require cooling, since impact energy is

dissipated as heat. At the same time, repeated stress can cause changes in the properties of a
material, causing a ductile material to crystallize and become brittle. Size reduction, then, is a
process that can have many stages; it may incorporate cooling and series of rapid, repetitive
stresses that create a brittle solid packed with internal dislocations and strain energy when
cryogens are employed.
Kim and Hung (1994) studied the freeze-cracking phenomenon in foods as affected by
physical properties and reported that products with higher density and lower porosity are generally
more susceptible to freeze-cracking. Exposing food materials to a cryogenic medium will cause
internal stress build up due to fast freezing rate in such food materials during freezing. This
internal stress may lead to cracking or shattering of frozen material. The cracking or shattering
induced by cryogenic freezing has been explained mostly from volumetric changes associated
with the water-ice phase transition. Fennema and Powrie (1964) described volume expansion and
amount of empty space in microstructure as the primary factors affecting the degree of freeze
cracking (mechanical damage) on cells during freezing. However, two conflicting presumptions
were made, on the cause of freeze cracking at the microscopic level. Reeve and Brown (1968)
stipulated that the cracking was probably the result of non-uniform contraction following
solidification. The other presumption was that volume expansion of water-ice phase transition
caused internal stress development. Sebok et al. (1991) indicated that both contraction and
expansion might cause freeze-cracking.
2.5.3 Cryogenic Freezing of Food
Fruits and vegetables, marine products and spices have become important foreign
exchange earners for the country. Indian marine product exports were worth a whopping Rs. 2,500
crores in 1993-94, exporting mainly to Japan, USA and UK. As the developed countries have a
stringent quality specifications, using cryogenic technology makes exports more competitive. In
view of the government's intention of bringing about one lakh hectares of land under shrimp
farming by 2000 A.D. (Anon, 1995), to enhance the production, the application of this latest
technique is gaining importance. Shrimp is considered as the pink gold of the sea and export can
be made further lucrative by value addition in the form of individually quick frozen (lQF) packs.
40

During the freezing of sea-foods, fruits and vegetables and other food products, chemical
and physical changes take place in the flesh of the product. Freezing causes the crystallisation of
most of the water present in the product. The formation of ice increases the concentration of
solutes or dissolved substances in the liquid phase surrounding the individual cells. This increased
concentration causes an osmotic imbalance, resulting in the transfer of fluids from cell to intra-
cellular spaces where it freezes to form ice. Higher the water leaving the cell, the larger the ice
crystals are formed. Separation of the water from the cell continues until complete solidification of
the product is attained. Therefore, the slower the product is frozen, the more complete the
movement of water out of the cell and conversely, the quicker the solidification point is reached,
the more water is retained within the cell and the smaller the intra-cellular spaces.
The degree of change that occurs during freezing is dependent upon the freezing time and
the quality of the product before freezing. If the product is frozen slowly in an ordinary
mechanical freezer, for example, it will be found that 'drip loss' is more (as high as 10-15% for sea
food). Microscopic examination of frozen commodities shows a relatively small number of the
smaller ice crystals, whereas rapid freezing demonstrates the formation of a large number of small
crystals, and virtually no large injurious crystals. Rasmussen and Olson (1972) reported, for
freezing of green beans, that a cross section of a bean frozen with liquid nitrogen closely
resembled the structure of a fresh bean, having little cellular damage as compared to slowly
frozen in an air blast.
Many types of freezers are available viz., cold store using still air as coolant, air blast
freezer using forced air, plate freezer using contact to cold surface, and fluidised-bed freezer using
fluidising air or liquid nitrogen as coolant.
Cryogenic freezing and preservation using LN2 has several advantages, such as,
(a) Cryogenic freezing reduces bacteriological deterioration as food spends minimum time in
bacteriological damage zone of +5 to +60 C which also retards the growth of disease
producing organisms.
(b) Cryogenic freezing reduces oxidation, enzyme activity and metabolic deterioration resulting in
preservation of nutritional properties.
41

(c) Cryogenic freezing improves retention of original colour and texture leading to
uniform, glazing and attractive product which can fetch maximum market value.
(d) In cryogenic freezing, the freezing times are very low. For example, it is about 50% less
compared to other types of freezing system, and hence, production capacity increases.
(e) Cryogenically frozen products have a longer shelf-life compared to those obtained in
other similar systems
(f) Cryogenic freezing systems require low and easy maintenance as compared to
mechanical systems and hence have a higher productivity.
(g) In cryogenic freezing systems, the heat transfer coefficient is very high (2000-5000 W
m-2 K-1) as compared to conventional freezing (100-200 W m-2K-1) systems.
However, the operating cost of freezing of foods is higher in case of liquid nitrogen
freezing systems as compared to mechanical refrigeration systems (Gupta, 1992). Still, cryogenic
freezing may be feasible for high cost foods, and from the point of improved product quality.
Different types of freezing systems using liquid nitrogen are on-line freezer, spiral freezer,
immersion or dip freezer, batch cabinet, etc. Table 2.5 indicates both positive and negative
features of these freezing systems (Wilhoft, 1987). The fluidised bed freezer using LN2 as cryogen
has been discussed by Reid and Stark (1974). This method has the advantage of uniform freezing
and is ideal for foods of granular geometry, but not suitable for sticky and non-fluidisable
materials.
One of the latest techniques of freezing is "crusta-freezing", or "cryo-mechanical system"
wherein liquid nitrogen is used for initial rapid freezing of the crust, and the food is then frozen
slowly in a mechanical system (George, 1993). This offers the advantages of both the systems -
the flexibility and other benefits of cryo-freezing system together with the low unit-cost factors
of mechanical systems. This technique has been claimed to be economical as existing mechanical
systems need not be replaced.
42

Table 2.5
Types of liquid nitrogen freezing systems
(Wilhoft, 1987) Type of freezing Positive features Negative features
Very fast heat transfer resulting in high production capacity. Small floor area and low capital cost. More effective for producing instant quick freezing products.
Damages the product due to enormous thermal stresses. Only benefits from the latent heat of LN2 Uses almost twice the amount of gas as with in-line freezing.
Batch cabinet
Rapid freezing in 3-8 minutes. High efficiencies of up to 90% achievable if LN2 is re-circulated. Good product quality. Machines are generally available in different ranges of belt width to accommodate constraints on factory floor space. Low floor space and high throughput. Can store product in freezer overnight. Dwell time is about 1 hour for freezing. Well suited for chilling of foods.
Ideal for catering operations too small to handle by any other method. Faster cycle time, is about one half that of a mechanical blast freezing. Shelf life extension over mechanical type when used for cook-chilling.
Certain types of freezer designs makes them difficult to clean.
Need to establish this temperature as well as whether fan motors are resistant to freezing up.
Major exercise is to clean and de-frost. Lengthy start-up time. Quality benefits of rapid freezing linked with small ice crystals are lost. Current spiral designs are not designed to operate counter-current heat transfer and hence some loss in efficiency occurs.
Effective between 50 and 70%. Labour intensive system.
Immersion
In-line
Spiral
43

2.5.4 Cryogenic Size Reduction or Cryogenic Grinding of Spices
The process of cryogenic grinding of spices is slowly being implemented throughout the
world. The present section thus deals with the published literature on the same with an emphasis on
finished product characteristics.
Miller (1951) has reported that the use of LN2 during grinding assured fine powder in a
single pass in spice grinding. It has been reported that conditioning of spices prior to grinding curbed
the loss of flavour volatile oils both in storage and during milling (Anon, 1962). It was suggested to
condition and to store spices at proper temperature and humidity, and to grind them with minimum
handling and under optimum quality retaining conditions. A loss of volatile oils to the tune of 40%
during grinding of unconditioned spices was reported, and the powder was turning mouldy and
losing its colour if stored in rooms which were too warm. Conditioning the spices for milling also
increased throughput up to 20% and curbed shrinkage during milling. Spice volatile oils were not
only retained during storage, but also during milling regardless of type of mill employed for milling.
In contrast, when spices stored at room temperature were ground, they were heated up and lost some
of their volatile flavours. Moreover, they tend to smear and blind the screens of impact type mills, or
'cake' onto rolls. Mills then had to be shut down for maintenance at the expense of production.
However, chilled spices conditioned at least 2 to 3 weeks were friable and grindable. They went
through mills easily, without smearing, blinding or coating the mills. They could be ground faster,
with less build up of flavour robing heat and size reduction was easier because the more brittle the
spices were, more easily they shear.
Wistreich and Schafer (1962) worked on cryomilling process and observed that it could
be applicable to a wide variety of foods such as cocoa and chocolate, vanilla-sugar, coconut,
coffee, tea, dehydrated meat, etc. Freeze-grinding of spice was accomplished by controlled
injection of liquid nitrogen directly into the mill's grinding zone. Instantaneous evaporation of the
liquid refrigerant quickly chilled both the spice and the mill. It also absorbed the frictional heat of
grinding. Thus, the temperature in the grinding zone generally were well below -100 F and
theoretically could approach as low as -320 F. In contrast, conventional milling could raise spice
temperatures to as high as 200 F. The
44

process of cryomilling permitted extremely fine grinding because the spice oils solidified became
brittle at these low milling temperatures. These fine and ultra fine spice powders dispersed
flavour uniformly throughout the final' product and they eliminated specking problems. The low
temperature of freeze-grinding also curbed the usual loss of lee aromatics (Table 2.6) and
moisture. Therefore, the ground products retained much the original flavour strength and weight.
On the average, 7 g of freeze-ground spices had the same flavouring power as 10 g of the
conventionally milled counter parts. Use of LN2 minimized oxidation of spice oils because, as
liquid evaporates in the grinding zone, it tended to expel any air in the mill. Freeze-ground spices
had proved to be considerably more stable than conventionally ground products. Possibly the
spice adsorbed or in some (Way retained some of the nitrogen. Further, low temperature
treatment had a pasteurizing effect on the spices. Grinding rates were increased because the mills
low-temperature operation curbed 'gumming up' of grinding surfaces and screens.
Table 2.6
Steam-distillable volatile oil of different spices (Wistreich and Schafer, 1962)
Spice Grinding method
Ambient Cryogenic (% v/w) (% v/w)
Black pepper 1.40 1.84
Ginger 1.44 1.80
White pepper 0.40 0.80
Coriander 0.26 0.40
Caraway 2.96 4.40
Celery 1.70 2.25
Strause (1967) had made studies on cryogrinding of nutmeg which was very difficult to
mill due to its oily and sticky nature. Milling temperatures tested were in the range from room
temperature (25 C) to 100 C, and speeds of the grinder were 3,000 and
45

5000 rpm. It was observed that the efficiency of milling of nutmeg depended mainly on the
milling temperature because of the high oil content. Low temperature or cryomilling prevented
the milled powder from sticking to the mill. Speed rate of 3000 rpm gave better results. There was
less loss of volatile oil and moisture and also less iron content in cryomilled nutmeg than in the
correspondjng control sample of stamp mill. The percentage of volatile oils in cryomill was 10.9
as against 9.6 obtained by stamp mill (control). In general, microbial load was less in liquid
nitrogen immersed samples than in cryomilled or stamp milled nutmeg for which explanation was
not available. He also worked on white pepper and concluded that the absorption of milling heat
by cooling was important in order to prevent iron content in cryomilled pepper and nutmeg than in
stamp mill processed pepper and nutmeg. The reductions of number of bacteria, mould and yeast
were observed by fine cryomilling. Table 2.7 shows the comparative composition of stamp milled
and cryomilled spices.
Table .2.7
Comparative composition of stamp milled and cryomilled spices (Strause, 1967)
Spice Method of V olatile oil Moisture milling (%) (%)
White pepper Cryomill 3.6 15.8
White pepper Stamp mill 1.7 14.3
Nutmeg Cryomill 10.9 8.4
Nutmeg Stamp mill 9.6 8.0
Pesek et al. (1985) and Pesek and Wilson (1986) worked on grinding of spices such as
white pepper, nutmeg, cinnamom, cumin and oregano, and compared cryoground and ambient
ground samples. Cryoground products were superior to ambient ground spices. The results
supported the hypothesis that (a) the light and highly volatile components were more readily
retained through cryogrinding than ambient grinding of spices and (b) the high molecular weight
components were retained equally well for the two grinding techniques employed. Table 2.8
shows the gas-chromatographic headspace
46

analysis of different spice.volatiles obtained by cryogenic and ambient grinding (Pesek et.aI.,
1985).
Table 2.8
Gas-chromatographic headspace analysis of different spice volatile oils obtained by cryogenic and ambient grinding
(Pesek et al.,1985)
Spice Volatile oil Grinding techniques Compound Ambient Cryogenic % Increase due to cryo-grinding
53.0
21.9
White pepper α-Pinene 4.86 9.50 95.5 β-Pinene 6.95 10.63 Unidentified 9.64 13.36 38.6 Limonene 5.59 6.76
Nutmeg α-Pinene 16.75 19.38 15.7 β-Pinene 8.84 9.34 5.7
Cinnamon α-Pinene 1.15 8.32 623.5 Camphene 0.40 2.53 532.5 β-Pinene 0.45 2.42 437.8 Cineole 0.11 0.47 327.3 Limonene 0.24 0.54 125.0
Cumin α-Pinene 0.24 0.42 75.0 β -Pinene 3.23 4.449 39.0 τ-Terpinene 1.24 1.39 12.1
Oregano Unidentified 0.62 2.86 361.3 α-Pinene 1.49 5.71 283.2 Camphene 0.82 2.44 197.6 β-Pinene 1.40 4.10 192.9 Myrcene 0.00 3.98 Very high Cymene 8.32 17.31 108.1 γ-Terpinene 4.92 12.87 16.6
Gopalkrishnan et al. (1991) carried out grinding experiments on cardamom at four
different temperature conditions viz., ambient (28 C), after freezing seeds in a deep-

freezer (-18 C) overnight, by grinding sees along with dry ice, and after pre-cooling the seeds with
liquid nitrogen. Ambient grinding of cardamom in a centrifugal mill using 1.00, 0.75, 0.50 and 0.25
mm sieve opening showed 26 to 52% losses of volatile oil and natural aroma. Other grinding
methods using a deep freezer (-18C), dry ice and liquid nitrogen brought about noticeable
improvement in the product depending on the degree of cooling. Cryogenic grinding using dry ice
and liquid nitrogen in the centrifugal mill yielded a superior quality product without the loss of high
volatile flavour constituents during grinding.
Anon (1993) reported (in equipment catalogue, M/s Hosakawa Alpine, Germany) that the
volatile oil retention by cryogenic grinding technique increased by 40% and 64% for black pepper
and for white pepper, respectively (Table 2.9).
Table 2.9
Spice Ambient Grinding (mL/100g)
Cryogrinding (mL/100g)
Increase due to cryo-grinding (%)
White pepper 1.95 3.19
Black pepper 2.21 3.09
Pimento 2.71 3.08
Mace 9.10 14.50 Cloves 11.50 16.50
64
40
14
59
43
Mckee et al. (1993) had studied the effect of different grinding methods at ambient and
chilled conditions as well as by using liquid nitrogen on some properties of nutmeg in batches of
6.75 kg each. The highest temperatures of the powder reached during grinding were ambient: 43 C,
chilled: 38 C and liquid nitrogen: 33 C. The various parameters of powder viz., modulus of
fineness, modulus of powder uniformity, moisture
48

content, volatile oil content, oleoresin content and antioxidant capacity were determined in
each of the grinding methods. They found the steam volatile oil contents to be in the order
of 5.8, 5.4 and 5.3 g/100g for ambient, chilled and liquid nitrogen grinding, methods,
respectively. They also observed that none of the three grinding methods evaluated was
clearly superior under the conditions of the study. However, the liquid nitrogen method
tended to produce ground nutmeg with more consistent results across the batches than those
at ambient and chilled conditions. Overall, nutmeg ground by using liquid nitrogen had a
higher oleoresin colour equivalent and a higher percentage of resin. Further, they observed
that since a higher oleoresin colour equivalent and a higher percentage of oleoresin
imparted the colour and flavour provided by nutmeg to food products, the liquid nitrogen
method might provide benefits in terms of reducing the cost of the process. They also
observed a potential antioxidant capacity improvement in nutmeg ground by liquid nitrogen
method. Table 2.10 shows grinding characteristics of nutmeg powder ground using ambient,
chilled and liquid nitrogen grinding methods.
Table 2.10
Grinding method against grinding characteristics of nutmeg powder (Mckee et al., 1993)
odulus of Moisture Volatile oil Oleoresin colour equivalent ineness (g/100g) (g/100g) (g/100 mL)
---
3.4 6.9 5.8 0.90
3.4 6.8 5.4 0.75 3.5 6.8 5.3 0.97
ca
gr
de
M f
Grinding method Ambient
Chilled
Liquid nitrogen
Recently, Singh and Goswami (1999a) have designed a laboratory scale (200 g
pacity) cryogenic grinding system (Fig. 2.11). They have also reported' results of cryogenic
inding of spices such as cumin and clove (Singh and Goswami, 1999b and 2000). The
tails are discussed in the subsequent sections.
An 49

Fig. 2.11 Block diagram of Laboratory cryogenic grinding system.
50

Table 2.11
Amount of volatile oil present in cumin powder ground under cryogenic and ambient conditions (Singh and Goswami. 1999b)
Cryogenic grinding Ambient grinding
Temperature -160 -130 -100 -70 40 55 65 75 85
(C) Volatile oil 3.30 3.28 3.28 3.26 2.86 2.73 2.55 2.36 2.26 content
(mL/100g, db )
Singh and Goswami (1999b) studied the grinding of cumin seed at various cryogenic and
ambient temperatures. They have reported that an increase in temperature in cryogenic range (-
160 to -70 C) had no significant effect on volatile oil content, whereas increase in temperature in
ambient range (40 to 85 C) significantly reduced the volatile oil content from 2.86 to 2.26
mL/100g (Table 2.11). Further, they have reported that the components of volatile oil were not
significantly affected by grinding temperature in the cryogenic range. However, these components
decreased significantly with increase in grinding temperature under ambient condition. With
increase in temperature from - 160 to -70 C for 12 number of rotor ribs, the volume mean
diameter of cumin powder increased from 129 to 164 /lm and the specific energy consumption
increased from 72 to 108 kJ kg-1.
Singh and Goswami (2000) also studied the grinding of clove at various cryogenic and
ambient temperatures. They have reported similar results for grinding of clove as that for cumin. It
has been reported that the clove was successfully ground at temperature below -50 C without any
deposition over sieve surface. They have reported that an increase in temperature in cryogenic
range (-110 to -50 C) had no significant effect on volatile oil content, whereas an increase in
temperature in ambient range (55 to 85 C) significantly reduced the volatile oil content from 11.0
to 9.3 mL/100g (Table 2.12).
51

Table 2.12
Amount of volatile oil present in clove powder ground under cryogenic and ambient conditions (Singh and Goswami, 2000)
Cryogenic grinding Ambient grinding
Temperature -110 -90 -70 -50 55 65 75 85
(C)
Volatile oil 13.3 13.3 13.2 13.2 11.0 10.3 9.9 9.3 content (mL/100g, db)
There was about 30% more volatile oil content in cryogenically ground powder amples in
comparison to that of ambient grinding. The volume mean diameter of clove powder increased
from 119 to 153 µm and the specific energy consumption during, rinding also increased from 62
to 81 kJ kg-1 with increase in temperature from -110 to -50 C at constant feed rate of 1.5 kg h-1,
rotor speed of 69 IJ1 S-l and sieve opening size of 0.5 mm (Singh and Goswami, 2000).
2.5.5 Advantages of Cryogenic Grinding
Advantages of cryogenic grinding or cryogrinding over ambient temperature grinding
have been summerised by Wistreich and Schafer(1962), Anon (1962), Pesek et a/., (1985), Pesek
and Wilson (1986) and Pruthi (1991). The salient points are as follows:
a) Cryogrinding curbs the usual losses of spice aromatics (volatile oils) as well as moisture
during the grinding process. The ground products retain their original flavour strength and
weight. On an average, 7 g of freeze-ground spices have the same flavouring potential as with
10 g of ambient ground counterparts.
b) Cryogrinding cuts down the oxidation of spice oils because as the liquid nitrogen evaporates
in the grinding zone thereby expelling any air in the mill and retaining flavour.

c) It also permits extremely fine grinding, as spices become very brittle and spice oils solidify at
very low temperature. Such finely ground spices disperse flavour uniformly throughout the
final products. It virtually eliminates specking problems as encountered in sausages.
d) In liquid preparations, freeze-ground spices disperse flavour better and uniformly.
e) Freeze-ground spices have proved to be considerably more stable than ambient ground
products. Possibly, spices absorb or retain some quantity of the nitrogen.
f) Grinding rate is increased because the mill's low-temperature operation minimises the
‘gumming up' of grinding surfaces and screens.
g) The actual costs of cryoground spice are lower "than those of conventional products when the
increased quality i.e., the flavour strength is taken into account. In addition fine grinding and
greater stability are bonus points to food processors and
h) The process is applicable to a variety of other foods, such as cocoa, coffee, tea, coconut and
dehydrated meats.
A typical cryogenic grinding system (Fig. 2.12) consists of controlled injection of liquid
nitrogen on the spice to be frozen in a cryo-screw-freezer. The liquid nitrogen frozen spices are
fed to an universal mill through the cryo-screw-freezer conveyor. If required, liquid nitrogen may
also be directly injected into the grinding zone. Instantaneous evaporation of liquid nitrogen
quickly chills both the spice and the mill. It absorbs the frictional heat of grinding. By suitably
adjusting the liquid nitrogen supply, it is possible to control the temperature of the ground material
(Anon, 1994).
2.5.6 Cryogenic Grinding of Other Food Materials
Cryogenic grinding is also applicable to a wide variety of food materials viz., cocoa and
chocolate, vanilla-sugar, coconut, coffee, tea, dehydrated meats, etc. It has been found that there is
a large gain in flavour when vanilla-sugar is pulverised. The product has interesting possibilities
and advantages as a replacement for liquid extract. Coconut can be ground to eliminate
objectionable fibres, while improving its aroma and flavour as high fat content gets solidified and
fibres become brittle. This offers applications in syrups, cakes, and confectionery. Ground cocoa
and chocolate retain their natural flavour and aroma.
53

1. Vibratory feeder 4. Universal mill 7. Liquid nitrogen tank 2. Liquid nitrogen inlet 5. Rotary valve 8. Temperature control 3. Screw conveyer 6. Filter bag 9. Control Panel
Fig. 2.12 Typical cryogenic grinding system, Pilot scale
54

Cryoground coffee appears to have longer lasting freshness of particular interest in
instant-coffee processing (Wistreich and Schafer, 1962).
2.5.7 Miscellaneous Applications of Cryogenics in Food
Cryogenics is finding new applications in various fields of food processing and storage.
The subsequent sections briefly discusses those areas.
2.5.7.1 Liquid Nitrogen in Packaging
Liquid nitrogen injection system can be used for both pressurisation and for creating an
inert environment (Anon, 1990). In pressurisation, a drop of liquid nitrogen is injected into a filled
can just before sealing. When liquid nitrogen changes phase, it expands and the can gets
pressurised, increasing its strength and stackability. Liquid nitrogen is added to an empty
container before filling for creating an inert atmosphere; nitrogen expands to about 700 times its
original volume, displaces oxygen from the packaging area, thereby increasing the shelf life of the
product. The system is useful for the packaging of oxygen-sensitive products such as coffee,
sauces, olives and cooking oil.
2.5.7.2 Liquid Nitrogen Peeling of Fruits and Vegetables
Weaver et al., (1980) reported that liquid nitrogen could be used for peeling of fruits and
vegetables. For example, tomatoes are immersed in liquid nitrogen for 5-15 seconds and then
thawed in warm water to loosen the peel. Since this method involves no cooking, there is a
removal of only skin tissue with small amount of internal tomato pulp. Skin removal occurs with a
tissue loss of about 5-8%. This technique may also be applied for peeling of other fruits and
vegetables.
55

CHAPTER 3: MATERIALS AND METHODS

CHAPTER 3
MATERIALS AND METHODS
The present chapter describes the details of materials used and the methods employed for
determining various physical and mechanical properties as well as the grinding characteristics by
ambient and cryogenic grinding of whole black pepper.
3.1 Engineering Properties of Black Pepper
The details of the materials and methods used for determining the various engineering
properties of black pepper are described in this section.
3.1.1 Materials
Black pepper (variety Malabar) seeds were procured in bulk from the local market. After
cleaning, they were stored at room temperature (25 C) for one month for moisture equilibration.
The moisture content of the seed, after equilibration, as determined by the ASTA (1985) method,
was observed to be 11.1% (dry basis).
3.1.2 Preparation of Seeds at Different Moisture Contents
To obtain seeds with different moisture contents, a fine spray of water was applied using a
spray gun, commonly used for spray-painting on wooden or metallic surfaces. The time of spray
was varied to obtain seeds with different moisture contents. These seeds were kept in covered
glass bottles, at 4 C, for 48 hours with occasional gentle shaking to ensure uniform moisture
distribution. A part of the seed-lot was also dried in a tray dryer at 40 C for 2 hours to obtain seeds
having a moisture content less than that of the original seeds. The moisture contents of the dried
or sprayed samples were obtained by knowing the initial and final weights of the treated seeds
using the following equation (Eq. 3.1).
(3.1 )
56

Where Mo is Initial moisture content, M1 is final moisture content of the dried and sprayed sample, W1 is initial weight of the seeds at M0, W2 is final weight of the seeds at M1.
3.1.3 Size, Shape and Weight
The size (diameter) of the black pepper seed was measured to ±0.01 mm accuracy using a
dial-type thickness gauge at five different orientations of 100 seeds. The size distribution at 0.20
mm intervals was reported. As the individual black pepper seed was apparently spherical in shape,
the sphericity and roundness were determined using Eqs. (2.1) and (2.2) (cited in review of
literature), respectively (Mohsenin, 1986); the corresponding values being rep0l1ed as a fraction
and percentage basis, respectively. The weight of 1000 seeds was also determined with four
replications.
3.1.4 Bulk Density
The bulk density was determined by weighing a container (A 2 Y2 can, capacity 895 mL,
commonly used for canning of fruits and vegetables having a diameter of 11.4 cm and a depth of
10.1 cm) filled with black pepper seeds (two gentle tappings were employed). The reported values
were the mean ± standard deviation (SD) of five such determinations.
3.1.5 Dynamic Angle of Repose
The dynamic angle of repose depends on the way in which the material heap is formed.
For black pepper seeds in bulk, this was determined following the compacted angle of repose
method (Thomson, 1984), commonly used for testing bulk solids. The basic principle behind this
determination is the property of the seeds to form heap, while stacking.
3.1.6 FlowabiIity
From a physical point of view, the gravitational flow of powder is equivalent to solid
failure in shear, and the measurement of flowability is fairly straightforward (Peleg, 1983). This
principle was adopted for measuring the flowability of black pepper seeds. The time (in
57

seconds) for 1 kg of seeds to flow through a conical plastic funnel (diameters 150 and 30 mm and
height 200 mm) under gravity was reported as funnel flow time. Hence, an increase in funnel flow
time means a decrease in flowability. The reported values were the mean ± SD of five
determinations.
Uniaxial Compression and Failure Behaviour
A Universal testing machine (Model No 4301, lnstron Corporation, Buckinghamshire, UK)
was used for the compression of the seeds at a crosshead speed of 50 mm min-1 using a load cell with
a maximum capacity of 500 N. The seeds were compressed to 75% of their original size for
estimation of failure characteristics. A typical uniaxial compression curve along with the different
parameters estimated (please see Results and Discussion) is shown in Fig. 4.1.7. These were,
1) failure force, Ff (force in Newton when the seed undergoes failure during compression);
2) failure strain (the strain, expressed as percentage of the original height of the seed, at the time
of failure);
3) linear strain limit, E, (the extent of strain up to which the force versus deformation curve was
linear, and expressed as percent);
4) failure energy, Ef (energy needed for the failure of the seed during compression, calculated
from the area under the curve till the point of failure, and expressed in Joules);
5) deformation modulus, Ed (equivalent to elasticity and was obtained from the slope of the
initial linear portion of the force-deformation curve (Szczesnaik, 1983), and expressed in N
mm -1).
According to Mohsenin (1986), the failure energy can be denoted as the work required to
cause rupture or failure, and is a rough measure of toughness of the sample. The number of seeds
tested at each moisture level was 20 with two replications.
3.1.8 Statistics and Data Analysis
Regression analysis using the method of least squares (Snedecor and Cochran, 1968) was
adopted to obtain curve fitting equations. The significance of the correlation coefficient (r) was
judged at a probability (p) of 0.01. The Duncan's multiple range test (DMRT) was
58

applied to verify if there was a statistical difference between the groups at a p level of 0.05
(Little and Hills, 1978).
3.2 Ambient Grinding of Black Pepper
3.2.1 Performance Study of a Grinding Mill at Various Feed Rates
Black pepper (variety: Malabar), procured from the local market, was cleaned using an air
classifier. Samples were ground using a micro pulveriser (Swing hammer mill, capacity 10 kg hr-1
HP motor, 3 phase, 440 V, 1440 rpm) at feed rates of 3.6,4.8 and 9.5 kg hr-1 and these feed rates
were maintained by using 0.5, 1.0 and 4.0 mm sieve opening. The temperature of the ground
material and the corresponding time were recorded. Geometric mean particle diameter of the
powder was determined by sieve analysis. The ground material was drawn at different time
intervals/temperatures during grinding for the estimation of moisture and volatile oil contents.
3.2.1.1 Sieve Analysis
Particle diameters of powder samples were measured by sieve analysis technique. Sieve
analysis of the powdered samples were conducted using a set of US standard sieves, mounting one
above the other, with the sieve having the highest sieve opening at the top and pan (without sieve)
at the bottom. These sieve-sets were placed in a mechanical sieve shaker. Powdered black pepper
sample of 100 g was spread on the first top sieve of the sieve-set and the top lid was placed. The
sieve shaker was operated for 5 minutes. The quantity retained on each sieve (Wi) was
determined.
The geometric mean particle diameter (dga) was determined assuming log normal
distribution, using Eq. (3.2) (Farrel, 1976).
log(dga)= [∑{Wi log(dg)}/∑ Wi] (3.2)
where dga is geometric mean particle diameter of powder, dg is geometric average of two
successive sieve openings and Wi is weight fraction of powder retained on ith sieve and
59

the surface mean diameter was calculated using (Coulson and Richardson, 1978) using Eq. (3.3):
(3.3)
where dsa is surface mean diameter of powder and dill is arithmetic mean of two successive sieve
openings.
In all the grinding experiments, the above mentioned sieve analysis technique was used. The
geometric mean particle diameter was used for defining the powder particle size, while the surface
mean particle diameter was used for determining theoretical energy for size reduction and also for
diffusion coefficients in the distillation process.
3.2.1.2 Moisture Content of Black Pepper Samples
The toluene distillation method for the determination of moisture is applicable to all spices by
co-distillation with toluene, with the exception of capsicums, red peppers, paprika, chillies, saffron,
dehydrated garlic, onion and dehydrated vegetables. This method is also known as Dean and Stark
technique (Pruthi, 1998).
The principle behind this measurement is that the amount of water is determined by first
distilling the material with an organic liquid not miscible with water and then collecting the distillate in
a graduated tube. All glass distillation apparatus with ground glass joints were constructed and
assembled (Fig. 3.1). It can be seen that it consists of 500 mL or 1000 mL round bottom, short neck
flask with T.S.24/40 joint, wet condenser with drip tip, 400 mm in length with a T.S.24/40 joint and a
Bidwell-Sterling trap T.S.24/40 joint (5 mL capacity, graduated in 0.l mL intervals).
Usually, an electric heating mantle as the heating source with a variable power control and
magnetic teflon covered stirrer could be used to reflux toluene in the above apparatus. Alternatively, an
oil bath at temperature of 110 ± 1 C could also be used. Nylon brittle burette brush of 12 mm diameter
or a wire loop was used. It was long enough to extend through the condenser (about 450 mm).
Alternatively, a long copper

Fig. 3.1 Distillation apparatus for determination of moisture content in black pepper powder

wire extending through the condenser with one end twisted into a spiral could be used. The diameter
of the spiral was such that it fitted snugly within the graduated portion of e entrainment distillation
apparatus, which compring a glass flask heated by suitable means and provided with a reflux
condenser, discharging into a trap and connected to the flask. The connections between this trap and
the condenser and flask were interchangeable ground glass joints. The trap served to collect and
measured the condensed water, and to return the solvent to the flask. The assembly of the apparatus
is shown in Fig. 3.1 and the various components are described below.
A water-cooled glass reflux condenser having a jacket approximately 400 mm long and an
inner tube of 9.5 to 12.5 mm outside diameter was employed. The tip of the condenser to be inserted
in the trap was ground at an angle of 30 degrees from the vertical axis of the condenser. When
inserted into trap, the tip of the condenser was 6 to 7 mm above the surface of the liquid in the trap
after distilling conditions had been established.
Receiver (otherwise called the trap) of 5 mL capacity made of high resistance glass, well
annealed and free from defects provided with ground glass joints with the shape, dimensions and
tolerances was used. This consisted essentially of the upper chamber, together with the tube and
ground joint leading to the flask, and the graduated tube. The graduated portion had a capacity of 5
mL when filled to the highest graduation mark. The scale range of 0 to 5 mL and graduated at
intervals of 0.1 mL. The graduation marks corresponding to each mL were numbered and carried
completely round the tube. The graduation marks mid way between the numbered marks were
carried three-quarterway and the remaining marks were carried half way round the tube. The error at
any indicated capacity did not exceed 0.05 mL
Powder of black pepper (40 g, enough to yield 2 to 5 mL water) was placed in a distillation
flask. Solvent was added to cover sample completely (not less than 75 mL). The receiving tube was
filled with solvent (toluene), pouring through top of condenser. Loose cotton plug was inserted
through the top of the condenser to prevent condensation of atmosphere moisture in the tube. The
flask was heated to boil and distill slowly at the rate of 2 drops/see, until most of water distilled
over. Then, the rate of distillation was increased to about 4 drops/sec. The distillation was continued
till two consecutive
62

readings at 15 minutes intervals, showed no change. IT there was any water held upon in
condenser it was removed with brush of wire loop. The condenser was rinsed carefully with
about 5 mL toluene. Distillation was continued for 3 to 5 minutes, after which the receiver was
cooled to room temperature (about 25 C) by immersing it in water. Solvent and water layers
became clear. The volume of water collected was noted to the nearest 0.01 mL and the moisture
content (percent) was calculated on wet as well as dry basis using the following equations,
respectively.
Moisture content (% wet basis) = [V w /Ws] * 100 (3.4)
Moisture content (% dry basis) = [V w /(Ws- V w)] * 100 (3.5)
where Vw is volume of water (mL) and Ws is weight of sample (g). The reported values were the
mean of triplicate observations.
3.2.1.3 Volatile oil Content by Clevenger's Method
Spices and condiments are valued for their exotic aroma which is due to the presence of
natural volatile oil or essential oil mostly comprising volatile organic compounds such as
monoterpenes, sesqueterpenes and their oxygenated derivatives. A special Clevenger's apparatus
(Fig. 3.2) with minor modifications, is universally accepted for use to obtain volatile oil that is
insoluble in water is obtained by steam distillation process (Pruthi, 1998).
The apparatus consists of a flask (shortneck, 1 or 2 L round-bottom) with an T.S.24/40
ground joint, an electric heating mantle or oil bath, variable voltage transformer to control heat,
volatile oil traps, Clevenger with T.S. 24/40 ground joints, wet condenser, 400 mm length with
drip tip and T.S. 24/40 ground joints (Fig. 3.2).
Powder of black pepper (50 g) was weighed and transferred to a flask. About 500 mL of
distilled water was added to the flask and antifoaming beads were also added. The flask was
heated to boiling and maintained a reflux rate of 1 to 2 drops per second. Refluxing was continued
until two consecutive readings taken at 1 hour interval, showed
63
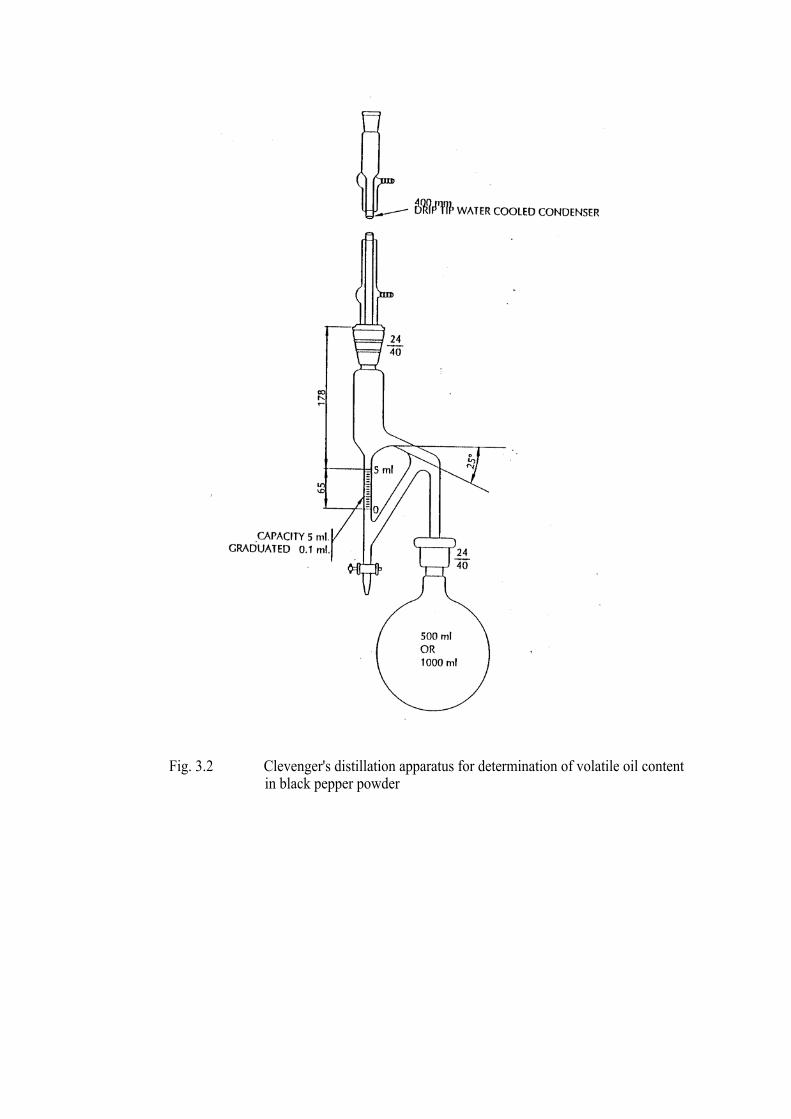
Fig. 3.2 Clevenger's distillation apparatus for determination of volatile oil content in black pepper powder

no change of oil volume in the trap. It was cooled to room temperature by immersing in a water
bath. The volatile oil content (moisture free basis, mL/l00g) was calculated using the following
equation (Eq.3.6).
Volatile oil content
= Volume of volatile oil x 100 /(Dry weight of sample) (3.6)
where volume of volatile oil was measured in mL. Analyses were carried out in triplicates.
Average value of volatile oil content, on moisture free basis, expressed in the unit of mL/100g of
sample was reported along with standard deviation values.
3.2.2 Performance Studies of the Grinding Mills of Various Capacities
In these studies, cleaned black pepper samples were used. The grinding zones of the
machines were cleaned thoroughly using hot water and machines were dried, followed by cleaning
with acetone. The samples were ground continuously in various mills until the temperature of the
ground material reached stabilisation. These samples were then, drawn at the stabilised
temperature for determination of volatile oil and gas chromatographic (OC) analysis. Mills
employed were Swing Hammer Mill (capacity 5 kg hr-1), Hammer Mill (APEX make, capacity 5
kg hr-1, Plate mill (DIAF type, capacity 5 kg hr-1, Plate Mill (10 kg hr-1) and Roller Mill (about 100
kg hr-1). In swing hammer mill, a sieve with 1 mm opening was used, while in hammer mill 0.025
inch (0.625 mm) sieve was used. Plate (DIAF) mill and Plate mill did not have any provision to
introduce sieves for control of size reduction, but there was provision to vary the gap between
stationary and movable plates. In the roller mill, the raw material was passed thrice between the
same rollers. The samples were compared with hand pounding (mortar & pestle) using traditional
method of impact forces. In all the cases, the powder obtained was visually observed to be of
nearly uniform size. The schematic diagrams of these machines are given in Fig. 3.3.
65

mn I
i)
PRODUCT
(B) HAMMER (APEX) MILL (a) SWING TYPE HAMMER MILL
I FEED
STATIONARY PLATE
(C) PLATE (DIAT) MILL
(d) PLATE MILL
rRODUCI
(e) ROLLER MILL.
Fig. 3.3 Schematic diagrams of grinding machines employed for ambient grinding

3.2.2.1 Analysis of Volatile oil by Gas Chromatography
Analysis of volatile oil obtained from powdered black pepper sample was carried out using
Hewlett Packard GC 5730a, fitted with a stainless steel column (3 m x 3 mm) packed with 10%
SE-30 on Chromosorb W. Nitrogen (30 mL min-1) as the carrier gas. The injection port and
detector (FID) temperatures were maintained at 200 and 250 C, respectively. The column
temperature was programmed from 75 C (2 minutes) to 220 C (8 minutes) with an increment of 4
C/minute. The volatile oil samples were diluted 5 times with acetone (10 /µL oil in 40 µL acetone),
and an aliquot of 1 µL was injected.
3.2.3 Ambient Grinding Characteristics at Different Particle Sizes
Black pepper samples procured from a local market were cleaned using an air classifier
and a sifter and graded to uniform size of approximately 5 mm. Four samples (500 g each) were
ground in a swing hammer mill, employing 0.5, 1, 4 and 6 mm sieve openings. Another two
samples (viz., PD 1, PD2) of 500 g each were ground in a plate mill (DIAF type) to different
particle sizes without using sieves, while varying the gap between the plates. The mills were
cleaned, and allowed to reach ambient temperature before each sample was ground. The
temperature of the ground material at mills' exits was recorded using a mercury-in-glass
thermometer. The speed of the mill was maintained constant for each trial in the respective mill.
Ground samples were packed in metallised polyester/polyethylene laminate (Met. PET/PE)
pouches and were stored in a refrigerator at 4 C till further analysis.
3.2.3.1 Energy Estimation for Grinding
The theoretical energy input (Es) for size reduction to each particle size (geometric mean
particle diameter) was estimated using Bond's energy equation (Eq. 2.11) assuming a constant
work index (Eo) of 60 kJ kg-1 (Loncin and Merson, 1979) and initial average particle diameter of 5
mm. The initial (di) and the final particle sizes (dsa) were in µm for determining energy, and the
energy equation became as follows (Eq. 3.7).
(3.7)
67

Where Es is theoretical energy required for size reduction, Eo is work index, dsa is surface mean diameter and d1 is average particle diameter of black pepper berries.
3.2.3.2 Volatile oil at Various Time Intervals
The total volatile oil contents of the powders were determined by ASTA (1985) method
employing Clevenger's apparatus with 50 g powder as mentioned in Section 3.2.1.3. Whereas in this
Section, the volatile oil distilled was measured at intervals of 30 minutes. The heater of the apparatus
was turned off for 2 minutes before taking each reading of the volatile oil distilled. The distillation was
continued until two consecutive readings, were almost the same. However, for samples PD1, PD2
and PD3, the distillation was terminated after 390, 360 and 360 minutes, respectively as prolonged
distillation did not yield much oil. Analyses were carried out in triplicate. Average value of volatile oil
content, on moisture free basis, measured mL/l00g was reported with standard deviation.
3.2.3.3 Physical Properties of Volatile oil
The volatile oils obtained from the black pepper samples were analysed for their physical
properties viz., specific gravity (AOAC method 30.022, 1980), refractive index (AOAC method
30.023,1980) and optical rotation (AOAC method 19.080,1980).
3.2.3.3.1 Specific Gravity or Relative Density
Specific or relative density at 27 C means the ratio of the densities of the liquid material at 27 C to that
of distilled water at 27 C. The specific gravity bottle (10 mL capacity) was washed and cleaned with
alcohol and diethyl ether. It was then dried in a current of dry air. The empty specific gravity bottle
was weighed (md accurately and was filled with distilled water at about 27 C, taking care to avoid the
presence of air bubbles. It was then immersed in water bath maintained at 27 ± 0.2 C for 30 minutes.
The temperature of the water bath was checked and the level of distilled water was adjusted to the
mark. The specific gravity bottle was closed by using a stopper and the outer side was wiped carefully
with a dry filter paper: It was then weighed (m2) in the
68

same balance. Then, the specific gravity bottle was emptied, washed with alcohol followed by diethyl
ether, and finally dried by means of a current of dry air. The bottle was filled with volatile oil at about
27 C, avoiding the presence of air bubble. The bottle was immersed again in water bath maintained at
27 ±·0.2 C for 30 minutes. The volatile oil was adjusted to mark, and the procedure was repeated as
stated for distilled water. The bottle with the volatile oil was then weighed (m3) accurately. Specific
gravity was calculated as equal to (m3- mi)/( m2- mi) at a temperature of 27 C.
3.2.3.3.2 Refractive Index
Refractive index is the ratio of the sine of the angle of incidence to the sine of the angle of
refraction when a ray of light of defined wavelength passes from air into test material kept at constant
temperature. The wavelength normally used is 589.3±0.3 nm corresponding with 01 and 02 lines of
sodium spectrum. The reference temperature is 27 C except those, which are not liquid at those
temperature in which case a higher temperature (say 30 C) depending on the melting point of the
material should be used.
Here, a recognised type of refractometer allowing direct readings of refractive indices between
1.3000 to 1.7000 with an accuracy of ±0.0002 was used. The instrument was calibrated with benzyl
benzoate to obtain a refractive index of 1.5678 at 27 C. Sodium light, diffused day light or light from
an electric lamp may be used for instruments fitted with an achromatic compensator.
3.2.3.3.3 Optical Rotation
The angle through which the plane of polarized light is rotated by a layer of 100 mm thickness
of the material under test at a specified temperature is called optical rotation. The wave length of
radiation used should be 589.3 ± 0.3 nm.
In this study, polarimeter of precision within ±0.03 degree was used after calibration with
reference material by employing a monochromatic light source of wavelength at 589.3 ± 0.3 nm. The
light source was switched on and it took a few
69

minutes to get the full luminosity. Zero error of the instrument was determined. The polarimeter tube
was filled with material previously brought to the temperature specified, ensuring the absence of air
bubbles. The tube was placed in the polarimeter and reading dextrorotatary (+) or laevorotatory (-)
optical rotation on the scale of the instrument was taken. The analyser was carefully adjusted in such a
way that both halves of the filled when viewed through the telescope was showing illumination of
equal intensities. Three readings were taken and the average was reported. The optical rotation values
were expressed in circular degree to the nearest 0.0 1 degree.
3.2.3.4 Gas Chromatographic - Mass Spectrometric (GC-MS) Analysis
The volatile oil samples were analysed using Shimadzu 17 A-GC Chromotograph equipped
with a QP 5000 (Quadrapole) mass spectrometer. The oil samples were diluted 20 times with acetone
(10 µL oil in 190 µL acetone) and 1 µL was injected. The following column along with the conditions
was employed in the analysis. Fused silica capillary column, SPB -1, 30 m x 0.32 mm (i.d) coated with
poly dimethyl siloxane (0.25 /lm film thickness) was used. The other conditions were carrier gas:
helium (1.0 mL/minute), injection port temperature: 150 C, detector (FID) temperature: 250 C,
temperature programme: 60(2) -250 (5) C @ 2 C/minute.
3.2.3.5 Diffusion Coefficient in Volatile oil Distillation
The volatile oil present in the powered black pepper samples was distilled using Clevenger's
(glass) apparatus. When the mixture of distilled water and black pepper powder (50 g) was heated, the
volatile oil components in black pepper shall be diffused into water at 100 C during distillation. As
there was sufficient agitation of water-powder mixture (due to buoyant forces) while boiling in the
Clevenger's apparatus, the surface resistance becomes small. Further, it can be assumed that the total
resistance is due to only the 'internal resistance' and the phenomenon was modeled using Fick's second
law (Selman et al., 1983).
70

Assuming the powdered particles to be spherical in shape, and using the unsteady transfer
equation, Fick's second law (Crank, 1970) may be depicted as
(3.8)
with boundary conditions;
u = 0, r1= 0, t> 0
u = ar Co, r1 = ar, t> 0
u = r1f(r1), t = 0, 0 < r1 < ar
where De is effective diffusion coefficient of oil from powder to water and Co is the constant
concentration at the surface.
The solution to Eq. (3.8) (Crank. 1970) is given by
Mt/Mf = 1- [(6/Π2) ∑n=1 to ∞ {(1/n2)exp(-(Den2Π2/rs2)t)}] (3.9)
where Mt is the total amount of diffusing substance leaving the sphere in time t, Mf is initial
volatile oil content in the powder sample, rs is surface mean radius of powder sample and n
varying from one to infinity.
With n=l and neglecting higher order terms, Eq. (3.9) can be rewritten as,
In(M') = - K. t
where M' = (Π2/6Mf). (Mr-Mt)) and
the slope, K = De (Π2/ rs2)
(3.10)
(3.11)
(3.12)
Plotting of Eq. (3.10), with In(M') versus t, would give a straight line, from where the diffusion
coefficient (De) could be evaluated.

3.3 Cryogenic Size Reduction or Grinding of Black Pepper
3.3.1 Cooling, Chilling and Cryogenic Freezing Methods
Black pepper samples procured from the local market, was cleaned and graded to have an
uniform size using a sifter. The samples of 100 g each were used for grinding experiments. In all
the cases, the temperatures of raw material before grinding and after grinding were recorded. A
stainless steel domestic mixer jar (2 litre capacity) was slightly modified by providing a water
jacket (Fig. 3.4) for cooling purpose. The outer wall of the jacket was thermally insulated. The
grinding experiment was repeated three times in each condition.
Sample CAI was packed in a polythene bag and sealed. It was stored in a cold room
maintained at + 10 C, for 8 hours, after which the same was immediately ground after removing
them from the cold room. Sample CA2 was also packed in a polythene bag and sealed. It was
placed in a Plate freezer chamber for 4 hours for chilling. After removing from the plate freezer,
the sample was immediately ground Sample CA3, was immersed in a liquid nitrogen tank for I
minute. It' was ground immediately after removing them from the liquid nitrogen tank. Sample
CA4 was separately taken in the jar and about 200 mL of liquid nitrogen was poured on to the
samples. The sample was then ground immediately in the bath of liquid nitrogen. Sample CA5
was ground under ambient conditions (25 C). The schematic diagrams of the cooling, chilling and
freezing methods are shown in Fig. 3.5.
3.3.2 Cryogenic (LN2) grinding and Volatile oil Content on a Laboratory Set-up
The raw material was cleaned using an air classifier and a sifter. A sample of black pepper
(l50g) was placed in a domestic grinder jar and about 300 mL of liquid nitrogen was mixed with
black pepper. Grinding was conducted using a constant motor speed of 14500 rpm for 3 minutes.
The temperatures of raw material after mixing with liquid nitrogen, and after grinding were
recorded with the help of a copper-constantan probe thermometer. The experiment was repeated
four times. The other sample was
72

Fig. 3.4 Experimental set-up for grinding of black pepper (laboratory scale)
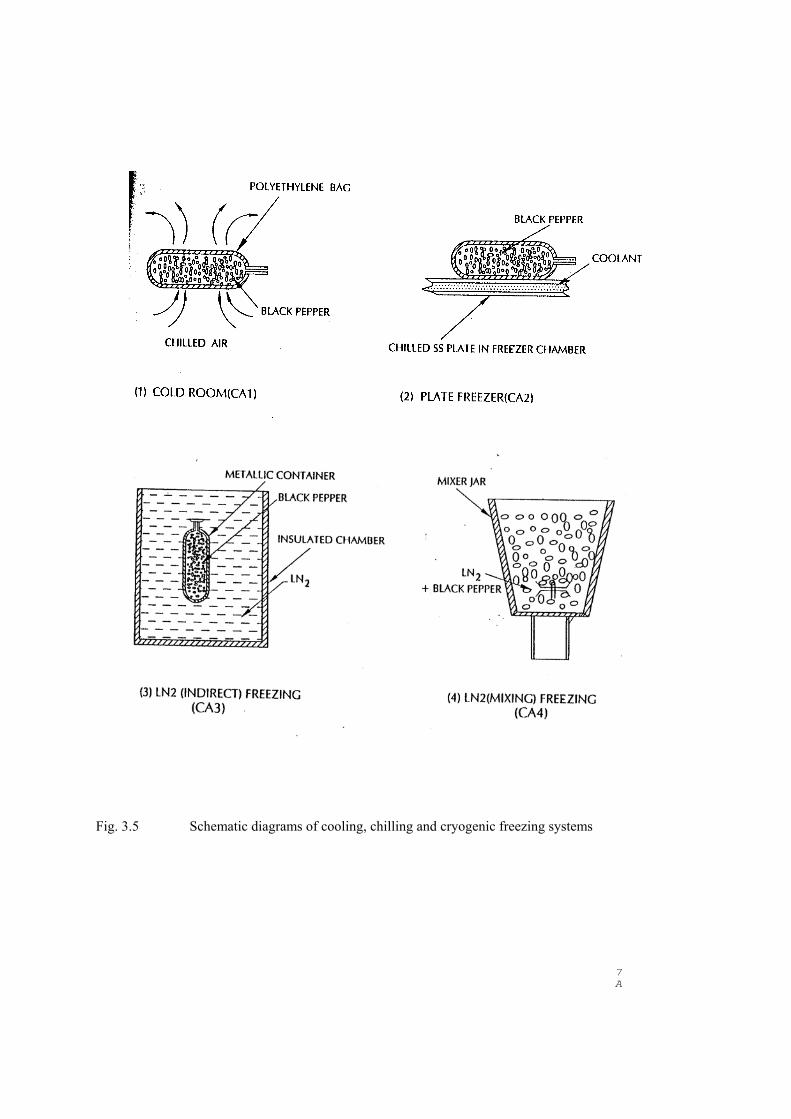
Fig. 3.5 Schematic diagrams of cooling, chilling and cryogenic freezing systems
7A

ground using ambient condition (25 C), with the same speed and the grinding time as mentioned
earlier. The volatile oils in the samples were distilled using Clevenger's method.
3.3.3 Effect of Cryogenic, Chilled, Ambient and High Temperature Grinding
Methods on Grinding Characteristics
A domestic mixer jar (Waring blender type) was used for grinding black pepper. The
stainless steel mixer jar (2 litre capacity) was slightly modified by providing a water jacket. The
outer wall of the jacket was thermally insulated (Fig. 3.4).
For attaining the chilled (10 C) temperature of raw material, black pepper was placed in
the mixer jar and chilled water was circulated through the jacket while maintaining the
temperature by connecting the jar to a cryostat. The system was allowed to reach the set
equilibrium temperature by running the cryostat for about 3 hours. Similarly, for attaining the high
temperature (40 C) of raw material, hot water was circulated through the jacket.
For cryogenic grinding, about 200 mL of liquid nitrogen was poured on to the material
taken in the mixer jar prior to grinding of sample and a feed temperature of -120 C was attained.
Sample which was at the ambient temperature of 24 C, was also ground. The samples were
stabilized at a pre-set feed temperature, prior to grinding. A grinding time of 3 minutes with a
motor speed of 14500 rpm and samples of 150 g were used for all the experiments. The ground
powder was packed in metallised polyester/polythene laminate (Met. PET/PE) pouches and stored
in a refrigerator at 4 C for subsequent analysis. The different unit operations of the process are
depicted in Fig. 3.6.
3.3.3.1 Sieve Analysis
Fineness of the product was determined by standard sieve analysis, using 60 mesh sieve
(Taylor series, with an opening of 0.250 mm) as per British standard method of test for spices and
condiments (BS 4585:Part 8: 1977/ISO-3588-1977). Weight of particles passing through the sieve
of 60 mesh with 5 minutes of shaking time was recorded.
75

RAW MATERIAL GRADING CLEANING &
DESTONING FREEZING OR CHILLING OR
HEATING
PACKAGING AND
STORAGE
PACKAGING AND
STORAGE
PACKAGING AND
STORAGE
GRINDING
PACKAGING AND
STORAGE
Fig. 3.6 Flow chart of unit operations used in grinding
6
7
3.3.4 Cryogenic Grinding in Pilot Scale
The samples of black pepper were obtained from a local spice processor. The variety was
Malabar with low oil content and medium size (about 4.1 mm in diameter). These were cleaned
for brokens and immature seeds, and- foreign matters.
The experiments were conducted using a pin mill (Hosokawa Alpine, Germany, capacity
80 kg hr-l, 3.7 kW motor, 3 phase, 440 V, stainless steel construction) as pin mills are employed
for very fine grinding and higher capacity (Pruthi, 1980). The schematic diagram of cryogenic
grinding set up is shown in Fig. 3.7.
The compressor was run before starting the experiments. The outlet valve of the compressor was
opened slightly so as to get the required pressure in the liquid nitrogen dewar flask depending
upon the grinding temperature to be maintained according to the experimental design. The valve of
transfer line was opened to enable the liquid nitrogen flow into the grinding zone. Black pepper (4
kg) was loaded on to the hopper which was connected to the grinding zone through a vibratory
sieve. Feed rate was adjusted to the desired value as per the experiment design. Temperature
sensor was located immediately below the mill's outlet in such a manner that it could measure the
temperature of the ground product just before coming out after grinding. The grinding trials were
carried out by directly introducing liquid nitrogen into the grinding zone of the pin mill at a
controlled rate to maintain the desired range temperature (-15 to 60 C) with a variation of about ±
4 C during experimentation. The grinding temperature was maintained by controlling the flow of
liquid nitrogen manually by operating the transfer line valve. The feed rate of black pepper into the
mill was varied as per the experimental design. All the experiments were repeated twice.
3.3.4.1 Design of Experiments and Response Surface Methodology
A 2 variable (5 levels each), central composite rotatable experimental design (CCRD)
with 4 replications at the center points (0,0,0,0) (Myers, 1971) in coded levels of variables was
employed wherein the independent variables were the feed rate of black
77

78

pepper (X1) and the product temperature of black pepper powder (X2). The coding of the
variables were done according to the Eq. (3.13):
j) (3.13)
where i = 1 to 2; the interval refers to the difference in actual levels of variables (corresponding
to the difference between 1 and 0 in coded level of variables. The term Xi is the mean of Xi
The experimental design in the actual (X) and coded (x) levels of variables are shown in Table
4.3.7 (Please see Results & Discussion). The response function y, I.e. and quality of volatile oil,
geometric mean particle diameter and energy expenditure, contents of monoterpenes and
sesqueterpenes, is expressed in terms of the independent variables as
(3.14)
The response function was approximated by a second degree polynomial (Eq.3.15) with
linear, quadratic and interaction effects using the methods of least squares (Little and Hills,
1978).
(3.15)
The number of variables is denoted by n, i & j are integers. The coefficients of the
polynomial are represented by bo (constant), bi (linear effect), bij (quadratic effect when i = j and
interaction effect when i < j) and ε is the random error.
The effect of individual linear, quadratic and interaction terms was determined (Khuri and
Cornell, 1989). The significance of the terms in the polynomial was judged by F test at a
probability (p) level of 0.0 1, 0.05 or 0.10. The significance of the multiple
79

correlation coefficient (r) was judged at a probability level of 0.01. The analysis of variance
(ANOVA) table is reported for the response function (y). The regression equation is also
expressed in the actual levels of variables (X) for convenience in use. The response surface graphs
were obtained from the regression equations, keeping the response function on the Z axis with X
and Y axes representing two independent variables.
The levels of the variables (Xl, X2) (within the experimental range) to obtain a maximum
volatile oil were determined by employing canonical analysis (Khuri and Cornell, 1989; Myers,
1971). In brief, the analysis consisted of the translation of the response function (y) from the
origin to the stationary points (xo). Then the response function was expressed in terms of new
variables, the axes of which correspond to the principal axes of the contour system. The
optimization of the variables were conducted by superimposing the contour plots of more than one
desired response function.
3.3.4.2 Energy Expenditure for Grinding
The energy expenditure for grinding of black pepper was determined by measuring the
current using an ammeter, using the following Eq. (3.16);
(3.16)
where P is power (W), V is voltage (V), I is the measured current (A), 10 is the no load current
(A), 11 is the motor efficiency (0.95) and Cosθ is the power factor. No load current
was subtracted from the total current to arrive at the actual energy consumed during grinding. The
energy expenditure for grinding (EG) was then calculated at different feed rates according to the
following equation (Eq. 3.17).
(3.17)
where EG is energy expenditure (kJ kg-1), P is power (W) and mass feed rate is in kg hr-l. The
energy values of cryogenic grinding were statistically compared with DMRT test. All tests were
repeated twice.
80

3.3.4.3 Sensory Studies of Powdered Samples
Odour profiles were carried out by, 12 trained panel of age group 28-50 years from both sex.
The training sessions were conducted with the reference chemicals that gave the odour notes present
in top notes and secondary notes of ground black pepper. The reference chemicals are shown in Table
3.1. These sessions were followed by further training with a fresh harvest to stored ground black
pepper. The samples were presented to panellists after sufficient accumulation of head space volatile
in room temperature.
Table 3.1
Reference chemical compounds and their odour notes used in sensory analysis of ground black pepper
Serial No. Compound Odour note
1 α-terpineol Floral
2 Acetophenone Irritant, sharp
3 Hexanal Green, green apple
4 Nerol Fresh floral, herbal
5 Nerolidol Mild spicy/rooty
6 1,8- cineol Camphory
7 Dihydrocarveol Warm, woody
8 Citral Citrussy
9 α-pinene Terpenic, oxidised
10 Piperonol Sweet, floral
The panellists were trained to mark the intensity of the perceived odour on a horozontal line
scale of 10 cm score card, anchored at two ends as low and high. The tests were carried out in three
repetitions of all the experimental samples and as sets of four to
81
eliminate panel fatique. Coded duplicate samples were presented each time to check the
consistency of panel performance. The panellists examined the top notes, basic notes and
defective notes followed by overall quality.
The data accumulated were collected as the measured distance on the line scale in
centimeters from the beginning up to the point where the horizontal line is cut. These data
points were further edited for total out layers. The mean and standard error were calculated for
further analysis. The attributes were plotted on a 10 point scale. The overall quality grading
indicate that the mean score of up to 2 is not usable, 3 and 4 is poor, 5 is average, is fair, 7 and 8
is good, 9 and 10 is very good (Narasimhan et al., 1990).
82

CHAPTER 4: RESULTS AND DISCUSSION

CHAPTER 4
RESULTS AND DISCUSSION
This chapter has been divided into three Sections for presenting results, followed by
discussion. The physical and mechanical properties of spices have been classified under the
Sections on engineering properties of black pepper. Conventional grinding aspects have been
classified under the Section on ambient grinding. Cryogenic grinding aspects have been classified
under the Section on cryogenic size reduction.
4.1 Engineering Properties of Black Pepper
Engineering properties of foods are important from the points of view of storage design,
processing and handling/conveying systems (Mohsenin, 1986). However, the engineering
properties are topics by themselves comprising of physical properties, relating to size, shape, etc.,
thermal properties, aerodynamic properties, mechanical properties, etc.
4.1.1 Moisture Dependent Engineering Properties
The study on engineering properties of black pepper has been restricted only to selected
properties or characteristics related to grinding. The physical properties such as size, shape etc.,
and mechanical properties such as angle of repose, flowability, uniaxial compression, etc., have
been studied at different moisture contents as black pepper processing industries invariably receive
materials with different moisture levels. The material used for this study is cited in Section 3.1.1,
whereas methods employed to determine these properties are described in Section 3.1.2 to 3.1.7 of
Materials and Methods (Chapter 3).
83

4.1.1.1 Size
Sizes of spices decide the sieve to be used for screening and handling. The frequency
distribution for the dimension (maximum and minimum) of the seeds (at 11.1 % moisture content,
dry basis), at an interval of 0.2 mm, is shown in Fig. 4.1.1, whereas, Fig. 4.1.2 shows the
cumulative frequency distribution. About 20% seeds had the maximum dimensions between 5.20
and 5.39 mm, whereas, 24% seeds had minimum dimensions between 4.80-4.99 mm (Fig 4.1.1).
A nearly bell shaped curve was obtained in both the cases. The mean size of the seed obtained was
5.12 ± 0.48 mm at a moisture content of 11.1 % (dry basis). On the other hand, when the
curhulative frequency was plotted (Fig. 4.1.2) against size intervals, a sigmoid type curve was
obtained for the maximum size but an exponential curve resulted when the frequency data were
plotted against minimum size. The 1000-seed weight was 60.5 ± 2.4 g at this moisture level. The
change in size (Fig. 4.1.3) of the sample with increase in moisture content, though showed a slight
increasing trend, was not statistically significant (p ≤0.05) according to Duncan's multiple range
test (DMRT). This might be due to the absorption of moisture in the pore spaces of the fibrous
structure of black pepper seed, and so, the size remained fairly constant.
4.1.1.2 Sphericity and Roundness
Sphericity can be defined as the ratio of the surface area of a sphere (Eq. 2.1), which has
the same volume as that of the solid, to the surface area of the solid. On the other hand, roundness
(Rd) of a solid (Eq. 2.2) is a measure of the sharpness of its corners (Mohsenin, 1986). A minimum
Rd value of one is for a perfect sphere, and an increase in the same shows even more sharpness in
the seed. Both these values (Fig. 4.1.3) were not affected by the change in moisture content. The
experimental roundness and sphericity values were in the neighbourhood of 1.1 and 95%,
respectively indicating a near spherical shape of the seed. The variations in the experimental
results, as indicated by the error bars in Fig. 4.1.3, are expected as biological materials usually
show such variations due to maturity and other agronomical factors.
84

Fig. 4.1.1 The frequency distribution for the dimension of the black pepper seeds (A) Maximum dimension; (8) Minimum dimension
85

Fig. 4.1.2 Cumulative frequency for the dimension of black pepper seeds, plotted against size interval. (A) Maximum dimension; (B) Minimum dimension
86

Fig. 4.1.3 Variations of mean size, roundness and sphericity of black pepper seed with moisture content
87

4.1.1.3 Bulk Density
Bulk density (Pb), is particularly important from the point of view of designing the 'age system
of black pepper seeds prior to processing. The bulk density of the seeds showed a complex
behaviour with respect to moisture content (Fig. 4.1.4). Initially, it reased marginally with an
increase in moisture content. This was due to the filling of the pores and surface cracks by
moisture without increasing the volume. According to Fig. 4.1.4, from about 14% moisture
onwards, there was an increasing trend in size (diameter). A further increase in moisture (above
14%) led to visible (but erratic) decreases in ρb-values about which no explanation would be
given. The present findings did not conform with the earlier reports that their existed simple
negative linear relations between ρb and moisture content for millets (Visvanathan et al., 1990),
and for chick pea (Dutta et al., 1988).
14.1.1.4 Dynamic Angle of Repose and Flowability
The movement of material largely depends on angle of repose. In addition, the design of
funnels and hoppers are mainly based on angle of repose. The movement of seeds during
conveying is also equally important when they are allowed to fall under gravity. Therefore, the
flowability of seeds was determined in terms of funnel flow time (Section 3.1.6).
The angle of repose (θ) (Fig 4.1.5) and funnel flow time (a measure for flowability) (Fig
4.1.6) varied between 35.4 ° and 48.2°, and between 5.2 and 7.7 s, respectively; both showing an
uniform increasing trend with the moisture content. This was expected as cohesiveness would
increase with an increase in moisture content for many food products and particulate foods, such
as, moist grain and powders, and even for highly inert inorganic substances, e.g., sand. In the
initial stage, an increase in moisture content from 8 to 14% hardly affected these indices but a
marked increase was observed when the moisture content exceeded 14%. An increase in 8-values
with an increase in moisture content was reported for different seeds (Visvanathan et al., 1990;
Dutta et al., 1988). The former researchers reported a linear relationship (r ≥ 0.97), whereas, the
latter mentioned a quadratic equation (r = 0.99) to suit their results. The results of the present study
showed a linear equation as θ
88

Fig. 4.1.4 Bulk density at different moisture contents of the seeds

Fig. 4. I .5 Angle of repose at different moisture contents of the seeds
90

Fig. 4.1.6 Funnel flow time at different moisture contents of the seeds
91

= 30.45 + 0.60 M, with a r-value of 0.96 (p≤ 0.01) where 8 is dynamic angle of repose and M is
the moisture content. The r-values did not improve even when the order of the equation was
increased to second or third.
4.1.1.5 Uniaxial Compression and Failure Behaviour
When· black pepper seeds are subjected to grinding compression is the most common
force employed (Section 2.3.1, Loncin & Merson, 1979 and Prasher, 1987). Hence, compression
of the seeds at different moisture contents was studied employing the technique of uniaxial
compression. The failure characteristics were also determined.
The different parameters (failure force: Ff, failure strain: εf, linear strain limit: failure
energy: Ef and deformation modulus: Ed), derived from the uniaxial compression study on black
pepper seed at various moisture contents, are shown in Table 4.1.1. The generalised force-
deformation curve (Fig. 4.1.7) shows the visco-elastic nature of the whole seed during
compression (till failure). Initially, at low compression force, the seed offered little resistance
towards compression, and exhibited a linear relationship that could be designated as the elastic
behaviour of the seed. The soft outer coat possibly could offer little resistance during the initial
stages of compression. Once the outer coat was compressed, the inside hard core offered
considerable resistance, resulting in a line with large gradient thus denoting plastic behaviour. As
the extent of compression was increased, the seed suddenly ruptured into two segments (this was
the failure point) and thus the force decreased drastically. The portion of the curve beyond the
failure point would have little importance.
An increase in moisture content reduced Ff and Ef values (Table 4.1.1); the decrease in Ff
being uniform, whereas, the decline in Ef was noticed only at high moisture content of the seed
(31.9%, db). At a low moisture content, it was the outer coat that mostly absorbed moisture,
whereas, increased moisture addition allowed the inner core to absorb moisture gradually. Thus,
with the increase in the moisture content, the inner core became markedly soft only when the
moisture was high (31.9%, db). This was expected as the whole seed becomes soft at high
moisture level. Further, moisture altered the mechanical strength of the product by plasticising and
softening the starch/protein matrix.
92

Fig.4.1.7 Uniaxial compression curve for black pepper seed showing the different parameters
93

Table 4.1.1
Parameters derived from uniaxial compres~ion testing of black pepper
Moisture Failure Failure Linear Failure Deformation content force strain strain energy modulus
limit M Fr Er EI Er Ed
(%, db) (N) (%) (%) (J) (N mm-I)
11.1 70.0 ± 15.3 16.6 ± 3.3 .7.9 ± 1.2 0.022 ± 0.003 44.5 ± 15.4
14.0 66.8 ± 12.3 18.5 ± 4.2 8.6 ±0.9 0.025 ± 0.006 40.3 ± 13.5
14.6 66.5 ± 10.6 18.5±2.1 8.3 ± 1.7 . 0.022 ± 0.004 39.7 ± 10.8
16.8 55.6 ± 8.9 20.9 ± 3.4 8.7 ± 1.2 0.021 ± 0.003 28.6 ± 6.5 31.9 38.9 ± 8.1 29.1 ± 4.4 12.2 ± 0.8 0.014 ± 0.002 14.1 ± 3.9
There are conf1icting reports on the effect of moisture content on these parameters.
Paulsen, (1978), Hoki and Tomita (1976) and Liu et al. (1990), reported decrease in Ff values for
soybean with increase in moisture contents. This phenomenon was found to be true for the present
work also. On the other hand, the compressive strength for snap bean (Phaseolus vulgaris L.) was
reported to increase (Bay et al., 1996) with elevation in moisture content. Therefore, in addition to
the above, other compression properties (failure strain, linear strain limit and deformation
modulus) as a function of moisture content were also determined (Table 4.1.1). The results showed
that the linear strain limit increased with an elevation in moisture indicating that the seeds would
exhibit an enhanced extent of elastic behaviour at high moisture levels. It thus would fail only at a
high level of compression (i.e., failure strain increases). The values for deformation modulus
decreased markedly. Therefore, it was easy to break or fracture black pepper seeds at a high
moisture content with the application of low compressive force. The failure energy of seeds was
fairly constant to a value of about 0.02 J when the moisture content was between 11 and 17% (db).
As the moisture content was increased beyond 17%, the failure force was decreased markedly
(Table 4.1.1) with simultaneous decreases in the slopes of both the zones (elastic and plastic
behaviour), leading to a notable decrease in deformation modulus.
94

4.1.1.6 Conclusions
The study on the determination of selected moisture dependent engineering properties
relating to grinding gave the following conclusions:
1) Black pepper seeds had a near spherical shape as reflected by roundness values (close to 1)
and high sphericity values (close to 100%).
2) An increase in the moisture content would increase the angle of repose but decrease the
flowability, particularly when the moisture content was above 14%.
3) Uniaxial compression of seeds showed two different zones (elastic and plastic behaviour). An
increase in the linear strain limit but decrease in deformation modulus showed that the seeds
of black pepper could be deformed to higher extent particularly at high moisture contents. The
failure energy remained same when the moisture contents of black pepper was in the range of
11 and 17% (dry basis).
It is worth mentioning here that the present study basically generated design data, relating
to grinding and handling of black pepper seeds. Data on this important area were earlier missing
though the importance of engineering properties was well realised. It is hoped that future design
system would be able to utilise these values to have specific handling and grinding systems of
black pepper.
95

4.2 Ambient Grinding of Black Pepper
Spices, including black pepper, are ground conventionally and commercially in mills which
usually do not have any facility for temperature control and/or cooling system. Hence, before
initiation of any work on cryogenic grinding, it is logical to have studies and data on conventional or
ambient grinding of black pepper. The term 'ambient grinding' means that the grinding operations are
carried out (truly speaking, the grinding starts at room temperature) without any cooling of mill or
cooling of material to be ground.
In the first study, a commonly used size reduction unit was selected. The only variable that
was studied was the feed rate. The results are presented and discussed in the following sections
with an intention to understand the phenomenon when black pepper was commercially ground.
4.2.1 Performance Study of a Grinding Mill at Different Feed Rates
The objective of this experiment was to study the effect of feed rate on the rise of
temperature during grinding, and on particle size and as well as volatile oil content of black
pepper powder on grinding.
Black pepper was ground using a swing type hammer mill (capacity 10 kg h-l, 430 Volts)
at three different feed rates viz. 3.6,4.8 and 9.5 kg h-l. The temperature of the ground pepper
powder was monitored at an interval of one minute for all the three feed rates, and results are
shown in Table 4.2.1. The initial temperatures of the feed material in bulk were 27, 31 and 27 C,
respectively (when sample 2 was ground on different days the initial temperature of the material
was also different, whereas samples 1&3 were ground on the same day). The samples of black
pepper powder were collected during grinding for further analysis. All grinding trials were
repeated twice.
96

4.2.1.1 Temperature Rise During Grinding
The rise of temperature of black pepper powder during grinding indicates the dissipation
of mechanical (frictional) energy into thermal energy which affect the quality the ground product.
The temperature reported in Table 4.2.1 had a standard deviation (SD) values less than 1 C.
The highest temperature of ground material reached was 76 C in case of the feed
rate of 3.6 kg h-l and the least was 36 C in case of 9.5 kg h-l. If the feed rate was less, the
ground material temperature was high, as the feed spent more time within the grinding,
zone receiving more energy for size reduction which was dissipated as heat. The product
(powder) temperature increased initially with time of grinding but later the curves (Fig.
4.2.1) flattened, indicating the attainment of equilibrium condition. The maximum rise in
product temperatures (viz., the difference of product temperature and corresponding
ambient temperature, at a grinding time t) were 49, 29 and 9 C for the feed rates of 3.6, 4.8
and 9.5 kg h-l, respectively.
The temperature of product during grinding followed an empirical polynomial of third
order (r2>0.95, p<0.0l) with grinding time (tg). The corresponding equations at different feed rates
were as follows:
(4.2.1)
(4.2.2)
(4.2.3)
where T is the product temperature in C at grinding time tg and Tj is the ambient temperature. The
coefficients of determination were (r2) were 0.99, 0.99 and 0.95 respectively. The predicted
product temperatures at different feed rates by using Eqs. 4.2.1, 4.2.2 and 4.2.3 are shown in Table
4.2.1 for comparison. The predicted values by regression analysis compared well with the
experimental ones.
97

Fig. 4.2.1 Effect of feed rates on the product temperature and grinding time

Table 4.2.1 Effect of feed rate on product temperature at different grinding time during grinding of black pepper
using a swing hammer mill
Grinding Experimental value of product Rise in product temperatures Predicted value of product
time (powder) temperatures (C ) at (C) at different feed rates of temperatures (C) at different feed (min) different feed rates of rates of
3.6 4.8 9.5 3.6 4.8 9.5 3.6 4.8 9.5
(kg h(l) (kg h(l) (kg h(1) (kg h(') (kg h(') (kg h(1) (kg h(1) (kg 111·-1) (kg h(1)
0 27 31 17 0 0 0 27.0 31.0 17.0
1 29 34 30 2 3 3 34.5 34.2 29.1
2 43* 38 31 16 7 4 41.2 37.0 30.8
3 50* 40* 33 23 9 6 47.0 39.4 32.0
4 53 42 33 26 II 6 52.0 41.5 32.9
5 58 44 33 31 13 6 56.3 43.3 33.5
6 60 45 33 33 14 6 60.0 44.7 33.9
7 62 46 34 35 15 7 63.1 45.9 34.1
8 64 47 34 37 16 7 65.6 46.9 34.2
9 67* 47 34 40 16 '7 67.6 47.6 34.2
10 69 48 34 42 17 7 69.2 48.2 34.2
11 70 48* 35 43 17 8 70.5 48.6 34.3
12 71 48 35 44 17 8 71.4 48.9 34.5
13 72 49 35 45 18 8 72.1 49.1 34.8
14 73 49 35 46 18 8 72.6 49.2 35.4
15 73 49 36* 46 18 9 73.0 49.2 36.2
16 73 49 - 46 18 - 73.2 49.3 -
17 74 50 - 47 19 - 73.5 49.3 -
- 48 19 - 73.8 49.4 -
19 75 50 - 48 19 - 74.2 49.5 -
48 20 - 74.8 49.8 -
21 75 51 - 48 20 - 75.6 50.1 -
22
20 75 51 - 4.2.1.3 Volatile oil Content of Powder
76* 51 - 49 20 - 76.6 50.6 -
23 - 51 - - 20 - - 51.3 -
- - 52* - - 21 - - 52.2 -
- Data were not collected as grinding temperature reached equilibrium
Volatile oil content in the spice powder is a measure of its aroma and flavour, and hence
its quality. Higher the volatile oil content in spice powder, the higher is its market value in
financial terms since spices are valued for their aroma and flavour (Gopalkrishnan et at., 1991).
Therefore, in order to have a better quality of the ground spice, it is desirable that the volatile oil
content should be as high as possible. It is thus desirable to determine the volatile oil content with
a detailed analysis of the volatile oil.
18 75 50* In
** Coefficient of variation (CY) < 15%
* dicates ambient temperature
99

4.2.1.2 Particle Size of Powder The particle size of the ground material affect the consumer acceptability and, hence is an
important quality attribute. The particle size' of powder was determined by 'sieve analysis
technique (method cited in Section 3.2.1.1). Table 4.2.2 shows that the three feed rates viz., 3.6,
4.8 and 9.5 kg h(l yielded the powders (when the mill attained stabilized condition) having
geometric mean particle sizes of 0.13, 0.20 and 0.61 mm, respectively. The feed rate of 9.5 kg h(l
(highest feed rate) reached the equilibrium temperature at the earliest (15 min). Fine particle size
could be achieved with low feed rate because of longer residence time of the sample inside the
grinding system.
Table 4.2.2
Effect of feed rate on particle size and on rise in product temperature at the time of stabilisation of grinding mill
Sl Feed rate Temperature Rise in product Time for Geometric mean No. of feed* temperature stabilization of particle size of
hlill** powder after grinding **
(kg hr'l) (C) (C) (min) (mm)
1 3.6 27 49 22 0.14
2 4.8 31 29 24 0.20
3 9.5 27 09 15 0.61
100

Volatile oil content as determined by distillation (method cited in Section 3.2.1.3) has been
reported as volatile oil content of black pepper powder throughout the present research. The
moisture content of spice samples are reported in a similar way. The coefficient of variation (CY)
was less than 10%.
The volatile oil contents (moisture free basis) of black pepper powder drawn at different
temperatures and feed rates are shown in Table 4.2.3. The volatile oil content in the powder varied
with both particle size and the temperature. The loss of volatile oil in comparison to the hand
pounding (control sample) is reported in Table 4.2.3, which shows that as the temperature of the
product increased, the volatile oil content decreased and hence the loss of volatile oil as compared
to control sample increased markedly. These two indices also varied with feed . rate, and a high
feed rate (and hence, low grinding or residence time) reduced the loss of these important quality
parameters. The closest value of 1.91 mL/100g, as compared to control sample (2.15 mL/100g),
was obtained only with highest feed rate of 9.5 kg h(1 because the rise in temperature during
grinding was hardly 9 C. In other words, the loss of volatile oil was the lowest (11.2%) at a feed
rate of 9.5 kg hr-1 and highest (50.7%) at a feed rate of 3.6 kg hr-1. The corresponding geometric
mean particle sizes were 0.61 and 0.14 mm respectively (Table 4.2.2). It was observed in the
present study (Section 4.2.1.2) that low feed rate gave a powder of fine particle size, and high
powder temperatures (at equilibrium during grinding) but with highest loss of volatile oil. Similar
results have been reported by Gopalkrishnan et ai. (1991) for ambient grinding of cardamom,
wherein the loss of volatile oil varied from 26% to 52% for particle size of 1.00 to 0.25 mm,
respectively.
The volatile oil content in the black pepper samples followed a negative relation with
product temperature analysis, according to the following empirical equations at different feed rates
of 3.6 and 4.8 kg hr-1 (regression equation was not possible for 9.5 kg h(l due to insufficient data
points):
(4.2.4)
101

2) (4.2.5)
where V 0 is the volatile oil content (mLl100g) and T is the corresponding product temperature
(C). The coefficients of determinations were 0.99 and 0.96, respectively.
The predicted product temperatures at different feed rates by using Eqs. 4.2.4 and 4.2.5 are given
in Table 4.2.3. The predicted values by regression compared well with the experimental ones.
Table 4.2.3
Effect of feed rate on temperature, moisture and volatile oil content of the ground black pepper powder samples
(Initial volatile oil content by hand pounding (control) sample = 2.15±0.04 mL/100g) Feed Ground Moisture Volatile oil content (moisture Loss of oil rate material content free basis) due to temperature (%) wet basis (mL/100g) grinding* (kg h{l) (C) Experimental Predicted from (%) values the regression
equation
3.6 43 8.0 1.43 ± 0.09 1.42 33.5
50 7.4 1.32 ± 0.03 1.34 38.6
67 7.3 1.15 ± 0.05 1.15 46.5
75 6.0 1.06 ± 0.08 1.06 50.7
4.8 40 8.0 1.82 ± 0.09 1.83 15.3
48 8.0 1.65 ± 0.07 1.64 23.3
50 7.9 1.62 ± 0.05 1.59 24.6
52 7.2 1.51±0.12 1.54 29.7
9.5 36 8.2 1.91 ± 0.10 -** 11.2
* Loss of oil was calculated in comparison to the control sample
** Could not fit an equation due to insufficient data points
102
Similar results have been reported by Singh and Goswami (1999b) during ambient grinding of
cumin seed. In their study, the volatile oil content decreased from 2.86 to 2.26 mL/100g with
grinding temperature increasing from 40 to 85 C. Further, the statistical analysis of the data
obtained by these researchers revealed the decrease in volatile oil content was significant at all the
grinding temperatures (p≤0.01) under ambient condition. This was because of the fact that during
the ambient grinding process, the mass transfer rate increased due to an increase in vapour pressure
at higher temperatures which resulted in a loss of volatile oil at corresponding temperatures (Wolf
and Pahl, 1990). The empirical equation (r2=0.99, p≤0.01) obtained by regression analysis using
the experimental data of Singh and Goswami (1999b) for ambient grinding of cumin seeds is
represented as:
(4.2.6) Vo = - 0.014 T + 3.460
where V 0 is the volatile oil content (mL/100g) and T is the corresponding product temperature. It
is observed that the empirical Eq. 4.2.6 was similar to the empirical equations (Eqs. 4.2.4 and
4.2.5) obtained in the present study.
The moisture content of the ground samples varied from 6.0 to 8.2 %, and higher the
powder temperature lesser was the moisture content of the samples. The highest moisture loss
(moisture content was 6%) was observed at a product temperature of 76 C which was expected
because of high rate of vaporisation of moisture from the powder sample at a high temperature.
4.2.1.4 Conclusions
From the foregoing results and discussion on performance study of swing type hammer
mill at different feed rates, it was concluded that
1) The product (black pepper powder) temperature reached a temperature of as high as 76 C at
the lowest feed rate of 3.6 kg h(l. The product temperature during grinding followed a
polynomial of third order with grinding time. The rise in product
103

temperature was of the order of 49, 29 and 9 C at the feed rates of 3.6,4.8 and 9.5 kg hr-1
respectively.
2) The geometric mean particle sizes of the products were 0.14, 0.20 and 0.61 mm at the feed
rates of 3.6, 4.8 and 9.5 kg hr-I, respectively. The lower the feed rate the finer was spice
powder and vice-versa.
3) The volatile oil contents of black pepper samples at the stabilisation temperatures of 75, 52
and 36 C were 1.06, 1.51 and 1.91 mL/lOOg, respectively. The volatile oil contents varied
negetively with the product temperature at different feed rates. The loss of volatile oil due to
grinding was calculated with respect to the control sample (hand pounding) and the values
varied from 11.2 to 50.7% depending on feed rate and product temperature. Volatile oil
content also varied with both powder temperature and average particle size. Lower feed rate
gave a powder of finer particle size, higher powder temperatures but highest loss of volatile oil
whereas the high feed rate gave a powder of coarse particle size, low powder temperature but
lowest loss of volatile oil.
104

3)
4.2.2 Performance Study of Different Types of Mills of Various Capacities
Based on grinding trials (Section 4.2.1) in a particular size reduction unit at different feed
rates, and determining the temperature rise during grinding and loss of volatile oils in ground
samples, the second set of experiment was planned, to study the performance of different types of
commonly used grinding mills. The objective of this investigation was not only to confirm the
earlier results reported in Section 4.2.1, but also carry out further detailed studies on the
~haracteristics of grinding vis-a-vis volatile oil components in five commonly used grinding mills.
Black pepper seeds were ground in five different grinding mills VIZ., Swing hammer mill,
Hammer mill (APEX make), Plate (OlAF make) mill, Plate Mill, Roller Mill which are commonly
used for grinding of spices in India. These mills were of different capacities (Table 4.2.4) as it was
extremely difficult to obtain commercial mills of similar capacities. The results of the study are
discussed in the subsequent sections.
4.2.2.1 Particle Size of Powder
The geometric mean particle sizes of the ground powders were determined from the sieve
analysis technique using Eq. 3.1. Swing hammer mill and Hammer (APEX make) mill had the
provisions to introduce sieves to roughly control the particle size, whereas other mills did not have
the provisions to introduce any sieve. The geometric mean particle sizes obtained by grinding in
Swing hammer mill, Hammer (APEX) mill, Plate (DIAF) mill, Plate type, Roller mill and hand
pounding, were 0.20, 0.25, 0.38, 0.16, 0.50 and 0.63 mm, respectively Cfable 4.2.4). The raw
material (black pepper) had a geometric mean particle diameter of about 5 mm. Fine particle « 0.2
mm) was obtained when ground in Plate mill, whereas coarse particles (> 0.5 mm) resulted by to
hand pounding (Table 4.2.4).
105

Table 4.2.4
Performance evaluation of commonly used grinding mills during ambient grinding of black pepper
(Ambient temperature = 30 C)
Parameters Type of Mill Swing Hammer Plate Plate Mill Roller Hand hammer (APEX) (DIAF) Mill pounding Mill Mill Mill ( control)
Capacity of 10 25 10 60 100 -*
mill (kg/hI')
Quantity of 5.0 5.0 5.0 10.0 5.0 0.1 material ground (kg)
Volatile oil 1.61 t 0.08 2.58 to.09 2.65 to.07 1.24 to. 10 2. 15tO.08 2.15 t 0.04 content # (mL/100g)
Product 52 43 47 68 30+ 30+ Temperature##
(C)
Moisture 11.0 10.6 11.2 8.6 11.6 10.0 content (%,
wet basis)
Particle size 0.20 0.25 0.38 0.16 0.50 0.63 (mm)**
* Not determined. # Moisture free basis ##
SD is less than 1 C **Geometric mean particle diameter +
+Indicates ambient temperature
4.2.2.2 VolatHe oil Content of Powder
The volatile oil contents (moisture free basis) from Swing hammer mill, Hammer (Apex)
mill), Plate (DIAF) mill, Plate type and Roller mill from Swing hammer mill, Hammer (Apex)
mill), Plate (DIAF) mill, Plate type and Roller mill were 1.61,2.58,2.65, 1.24 and 2.15 rnL/100g,
respectively (Table 4.2.4). The results were comparable with those of the control sample obtained
by conventional hand-pounding (2.15 rnL/I00g).
106

swing type hammer mill and Plate mill yielded powders having less volatile
oil content. This may be attributed to higher grinding temperature and finer particle size of
powder. On other hand Plate (DIAF) type and Hammer (APEX) type yielded powders having
higher oil contents than the control sample because of the low temperature attained during
grinding in these mills. Seeds ground in both Roller mill and hand pounding (control sample)
yielded similar quantities (2.15 mL/lOOg) of volatile oil. In these mills, despite having lower
grinding temperature (30 C), the volatile oil content was less than that of volatile oil obtained
from Plate (DIAF) mill and Hammer (APEX) mill. This may be due to coarser particle size of
powder which resulted in incomplete distillation of volatile oil (Vide Section 4.2.3.4 ). The
temperatures of the powders were 52, 43, 47, 68, 30 and 30 C, respectively in those selected six
different systems at stabilised grinding condition, while the ambient temperature was around 30
C. These results indicated that the quality of ground powder in terms of volatile oil content
depended on the type of the mill employed for grinding. This indicates to the fact that appropriate
mill is needed to have a good quality spice powder.
4.2.2.3 Analysis of VolatHe oil by Gas Chromatography
The gas chromatographic (GC) analysis of volatile oils is a method of separation and
identification of volatile compounds based on their retention time within gas chromatographic
column. Clevenger's method of distillation of volatile oil gives the total volatile oil content in the
powder sample, whereas the gas chromatography is a tool to identify the various constituents of
volatile oil for measuring the quality of the oil.
Hasselstrom et aZ. (1957), Uday Sankar (1989) and Pino et at. (1990) have reported the
constituents of black pepper oils obtained, by steam distillation and by supercritical carbon
dioxide extraction methods, respectively. Pepper oil constitutes mainly monoterpenes (70-80%),
sesqueterpenes (20-30%) and a small amount (less than 5%) of oxygenated compounds (Lewis et
aZ., 1969 and Govindarajan 1977). The compounds viz., a-thujene, a-pinene, sabinene, I)-pinene,
1,8-cineole and limonene are the monoterpenes present in the volatile oils of black pepper,
whereas the sesqueterpenes are a-copaene, I)-caryophyllene, I)-bisabolene and caryophyllene
oxide (which is an oxygenated compound, and is also classified under sesqueterpenes). The
chemical
107

•formula, molecular weights and boiling points of the above compounds are shown in Table 2.2
of Review of Literature. Monoterpenes are the lower molecular weight compounds (molecular
weights being 136 to 1~4), having lower boiling points as compared to the sequeterpenes
(molecular weights being 204 to 222).
Table 4.2.5
Gas chromatographic analysis of ground pepper samples using different mills (Relative concentrations are shown as percentages)
" ""'_n'_
SI Mill type No Compounds Swing Hammer Plate Plate mill Roller mill Hand hammer (APEX) (OlAF) pounding type mill type mill type mill
I Thu jene+a-pinene 6.01 7.60 8.69 2.80 7.04 8.97
2 Sabinene+p-pinene 18.84 22.53 24.31 11.79 21.34 22.19
3 1,8-cineole+ 20.98 23.06 20.13 15.90 22.25 22.01 limonene
4 a-copaene 5.24 4.79 4.25 6.25 4.74 4.25
5 p-caryophyllene 8.93 5.33 3.39 10.65 4.58 8.74
6 p-bisabolene 9.61 7.63 5.23 11.l4 6.90 8.81
7 Caryophyllene oxide 8.55 10.18 9.14 12.24 9.86 5.49
8 Total 78.16 81.12 75.14 70.77 76.71 80.46
9 Monoterpenes 45.83 53.19 53.13 30.49 50.63 53.17
(I to 3) 10
Sesquiterpenes 32.33 27.93 22.01 40.28 26.08 27.29 (4 to 7)
II Ratio of 1.42 1.90 2.41 0.76 1.94 1.95 Monoterpenes to Sesquiterpenes
12
Monoterpenes (%)* 58.64 65.57 70.71 43.08 66.00 66.08 13
Sesquiterpenes (%)* 41.36 34.43 29.29 56.92 34.00 33.92
* Percent present in total oil
The ratio of monoterpenes to sesqueterpenes in the volatile oil is an important quality
attribute. Hubert (1991) observed that the ratio of monoterpenes to sesquiterpenes of more than
1.74 would give strong peppery note in oil. According to Salzer (1977), the
108

ratio of monoterpenes to sesquiterpenes represents the quality of the volatile oil and . indicates
aroma value. Monoterpenes provide the odour and body to the volatile oil whereas the
sesquiterpenes provide the spicy note to the volatile oil. In other words, while the powder is fresh,
it contains more of monoterpenes in the volatile oil. Hence, it is desirable to have more
monoterpenes in the volatile oil.
The concentrations of black pepper volatile oil compounds obtained in the present study
are shown in Table 4.2.5. Pino et al. (1990) identified a total of 46 compounds (Table 2.1) present
in the volatile oil which included, trace elements. In present research, however, only nine major
volatile oil compounds were chosen and used for analysis. The quantity of monoterpenes viz., a-
thujene+a-pinene, sabinene+~-pinene, 1,8cineole+limonene, present in the volatile oil were
analysed by gas chromatography technique. The quantity of sesqueterpenes viz., a-copaene, ~-
caryophyllene, ~-bisabolene and caryophyllene oxide (an oxygenated compound), present in the
oil were also analysed by gas chromatography technique. The total relative' percentage
concentrations of black pepper volatile compounds used in all the selected mills varied roughly
between 70% and 80% in the present study. Among the mills, Hammer mill (APEX), Plate (DIAF)
mill, Roller mill and hand pounding gave ratios of monoterpenes to sesqueterpenes as 1.90, 2.41,
1.94 and 1.95, respectively, which indicated that the volatile oils had a strong peppery note. The
oils obtained from samples ground in these mills had more concentrations of monoterpenes. The
oil obtained from Swing type hammer mill gave a ratio of monoterpenes to sesqueterpenes of the
order of 1.,42, whereas that from Plate mill gave a least value of 0.76, which indicated that oil
obtained from these two mills had more concentration of sesqueterpenes. This might be due to
high volatility of monoterpene compounds at higher temperature, as grinding temperatures in
Swing type hammer mill and Plate mill were 52 C and 68 C, respectively. Table 4.2.6 shows the
vapour pressure and temperature data available for a few monterpene compounds of volatile oil
(Perry, 1950). It can be seen from Table 4.2.6 that if the vapour pressure of the compound was
reduced below atmospheric pressure then the boiling point of that particular compound also
reduced. During grinding, the high rotational speed of mill reduced the pressure in the grinding
zone to less than the atmospheric pressure (760 mm Hg). At this point, the boiling point of the
volatile oil compound came down depending on the pressure drop in the grinding zone (Table
4.2.6). If the temperature gradient (the
109

Idifference between the grinding temperature and boiling point) was reduced considerably then
there was an increase in mass transfer of that piuticular compound from powder to (the
surrounding atmosphere. The temperature gradient was much high in case of Swing
type hammer mill and Plate mill due to increased grinding temperature (52 and 68 C). Singh and
Goswami (l999b) have also ob'served loss of highly volatile components with low boiling points
during ambient grinding of cumin at a temperature of 85 C.
Figures 4.2.2 - 4.2.4 show the contents of, various compounds present in the distilled
volatile oil (expressed as mL/I00g) as determined by combining Table 4.2.4 and Table 4.2.5. For
example, in case of Swing type hammer mill, the content of ~caryophyllene was calculated as
(8.93*1.61/100) = 0.14 mL/I00g. The total volatile oil (all the nine compounds) content was
calculated as (78.16*1.61/100) = 1.25 mL/100g; the content of monoterpenes as (45.83*
1.61/100)= 0.74 mL/100g; the content of sesqueterpenes as (32.33* 1.61/100)= 0.52 mL/ 100g.
Though the total volatile oil content was 1.61 mL/I00g (Table 4.2.5) in case of grinding in Swing
type hammer mill, the total of all nine major compounds of volatile oil was only 1.25 mL/100g.
The rest of volatile oil of about 0.36 mL/100g accounted for unidentified and trace compounds.
The above method of determining the volatile compounds in mL/100g was followed throughout
the present work.
Figure 4.2.2 shows the plot of total oil content, quantities of monoterpenes and
sesqueterpenes for different grinding mills. The content of monoterpenes was lowest in samples
ground in Swing type hammer mill and Plate mill. This was basically due to the fact that the
powder temperatures were high (52 and 68 C) and powder particles were too fine (0.20 and 0.16
mm) for these mills which had resulted in the loss of light and highly volatile components viz., the
monoterpenes (Pesek et ai., 1985; Pesek and Wilson, 1986). On the other hand, the total content of
monoterpenes was dependent upon the type of mill. The maximum content of monoterpenes was
observed in the powder obtained by grinding in Hammer (APEX) mill and Plate (DIAF) mill
where the powder temperatures were slightly low (43 and 47 C) with powder particle size of 0.25
and 0.38 mm, respectively. The samples of Roller mill and by hand pounding did not yield highest
quantity of monoterpenes despite having a low powder temperatures (30C) as the powder particle
sizes were coarser viz., 0.50 and 0.63 mm,. respectively (this phenomenon was
110

Fig. 4.2.2.. Variation of total, monoterpene and sesqucterpenes contents in black pepper volatile oil obtained by different grinding mills
111

Ilso discussed in Section 4.2.3). However, the mean content of sesqueterpenes in the oil amples
obtained from all mills was fairly constant (0.58 mL/100g). This content did not ~epend on the
type of mill as compounds having higher molecular weight i(sesqueterpenes) were not affected by
grinding temperature (Pesek et at., 1985; Pesek and !
fWilson, 1986) and particle size.
Table 4.2.6
Boiling points (C) of volatile oil compounds of black pepper at different vapour pressure
(Perry 1950)
Compound Pressure mm Hg Melting . __________ ... __ ...... __ ...... ___ .. _ .. ______ ---..P.0int (C) 5 10 20 40 60 100 200 400 760
Temperatures (C )
a-pinene -1.0 24.6 37.3 51.4 66.8 76.8 90.1 110.2 132.3 155.0 -55.0
~-pinene 4.2 30.0 42.3 58.1 71.5 81.2 94.0 114.1 136.1 158.3
cymene 17.3 43.9 57.0 71.1 87.0 97.2 110.8 131.4 153.5 177.2 -68.2
limonene 14.0 40.4 53.8 68.2 84.3 94.6 108.3 128.5 151.4 .175.0 -96.9
myrcene 14.5 40.0 53.2 67.0 82.6 92.6 106.0 126.0 148.3 171.5
-- Indicates data not available
Figure 4.2.3 shows the distribution of three different sets of monoterpene compounds viz.,
a-thujene+a-pinene, sabinene+~-pinene, 1,8-cineole+limonene. The distribution pattern of these
compounds was similar in samples from all the mills except for Plate (DIAF) mill, where the
quantity of (sabinene+~-pinene) was the highest. Figure 4.2.4 shows the distribution of four
sesqueterpenes compounds viz., a-copaene, ~caryophyllene, ~-bisabolene and caryophyllene
oxide. Though the total quantity of sesqueterpenes in the oil was nearly same, content of
caryophyllene oxide was higher for samples ground in Plate mill (Table 4.2.5). It might be due to
the oxidation of ~caryophyllene into caryophyllene oxide at higher temperature (62 C). Hand
pounding (control) sample yielded low quantity of caryophyllene oxide as there was a little chance
of oxidation of ~-caryophyllene in the grinding process.

Fig. 4.2.3 Variations of lllonolcrpcncs constitucnls in black pepper volnlile oil obtained by difTerent grinding mills
A : Swing hammer mill D : Plate mill B : Hammer mill E : Roller mill C: Plate (DIAF) mill F: Hand pounding
fig. 4.2.4 Variation of sesqueterpenes constitutcnts in black pepper volatile oil obtained by different grinding mills

4.2.2.4 Conclusions
The following conclusions can be drawn based on the results reported in the present
section.
1) Among the mills employed for grinding, fine powder could be obtained using Plate mill, with
a geometric mean particle diameter of 0.16 mm.
2) The volatile oil contents (moisture free basis)· of samples ground in Swing type hammer mill,
Hammer (APEX) mill, Plate (D1AF) mill, Plate Mill, Roller mill and hand pounding were
1.61,2.58,2.65,1.24,2.15 and 2.15 mL/lOOg, respectively The corresponding product
temperatures were 52, 43, 47, 68, 30 and 30 C. These results indicated that the quality. of
ground powder in terms of volatile oil content depended on a few factors such as the type of
the mill employed for grinding, the product temperature, and the average particle size of the
ground material.
3) The gas chromatographic (GC) analysis data of the volatile oil showed that grinding Hammer
(APEX) mill, Plate (DIAF) mill, Roller mill and hand pounding gave oil with high quantity of
monoterpenes. Monoterpenes were sensitive to grinding temperatures and their volatility
increased with an increase in grinding temperature. The overall content of sesqueterpenes in
the oil samples obtained from all the mills was fairly constant and it did not depend on the
type of mill.
114

f 4.2.3 Ambient Grinding Characteristics at Different Particle Sizes
Generally, spices are ground either for direct consumption as powder or for making value-
added products like essential or volatile oils or as oleoresins. Grinding facilitates the release of
aroma and flavour principles from the spices for mixing with food materials (Gopalkrishnan, et
at., 1991). During grinding, most of the energy input to the grinder is converted into heat, whereas
only a small portion is used for actual size reduction (Loncin and Merson, 1979). if the particle
size of powdered product is low (fine powder), enormous quantity of heat is generated within the
mill raising the temperature of the ground product to as high as 93 C (Wistreich and Schafer,
1962).
As observed in the previous sections, the grinding of black pepper at high temperatures and to low
particle sizes (fine powder) resulted in the higher loss of volatile oil. At the same time, it was
observed that even if the particle size obtained was high (coarse powder), the loss of volatile oil
was also high though the powder temperature was low. Energy laws for grinding indicates that to
obtain low particle size (fine powder), more grinding energy is required and grinding to' high
particle size (coarse powder) consumed less grinding energy. However, the low particle size (fine
powder) consumed less time in the distillation process for the extraction of volatile oil from the
powdered samples, while high particle size (coarse powder) consumed more time for distillation.
As volatile oils are critical components of spices, and spices are valued according to their volatile
oil content, a detailed investigation was undertaken to find the optimum mean particle size
(diameter) of powder at a point in which the loss of volatile oil would be minimum, and to study
the corresponding conditions of grinding energy and distillation times.
The black pepper samples were coded as POI, P02, PD3, PD4, PD5 and P06 for easy
identification and they were ground to different particle sizes as explained in Section 3.2.3
(Chapter 3, Materials and Methods). The powder obtained by grinding of sample PO 1 was the
coarsest particle size and that of sample P06 was the finest particle size. The other samples (P02,
P03, PD4 and PD5) were in the range from coarser to finer particle sizes; number increased with a
decrease in particle size. (Table 4.2.7). Separate grinding trials resulted in powdered samples of
different particle sizes viz., PO 1 to P06. For
115

Table 4.2.7
Grinding Characteristics of Black pepper by ambient grinding
Ambient Temperature = 30C Codes
for Samples
Mean particle
size (mm)
Moisture content (%, wb)
Mill’s discharge rate (g. min –1)
Product temperatu
re (C)
Maximum oil content (mL/100g)
Distillation on
time (h)
Grinding energy
(kJ.kg-1)
Fourier Number
F0
Diffusivity
Dx1011 (m2-s-1)
PD1 2.10 9.5 255 30 2.54±0.04 6.7 4.61 0.17 1.70 PD2 1.23 9.5 210 30 2.72±0.06 6.0 8.62 0.20 1.50 PD3 0.70 9.5 165 31 2.92±0.03 6.0 14.19 0.29 1.10 PD4 0.61 9.5 158 31 2.65±0.05 4.0 15.81 0.31 1.23 PD5 0.20 9.0 80 45 2.02±0.09 3.5 33.94 0.28 0.14 PD6 0.14 7.0 60 65 1.48±0.03 3.0 42.22 0.29 0.03

obtaining the different particles sizes of PD 1 and PD2, the gap between the plates in the Plate
(DIAF) mill was varied, whereas in case of other samples viz., PD3 to PD6, the sieves of
different sizes were employed in the Swing hammer mill. The subsequent sections discuss the
results of this study.
4.2.3.1 Temperature Rise during Grinding
The product (powder) temperatures of the samples PD 1, PD2, PD3, PD4, PD5 and PD6
measured at the outlet of grinding mill, were 30, 30, 31, 31, 45 and 65 C, respectively, whereas
the feed material temperature was 30 C (ambient temperature) (Table 4.2.7). The ground products
obtained from samples PD5 and PD6 (fine samples) had temperature rise of 15 and 35 C,
respectively, whereas for the other samples, the rise in temperature was marginal. This was
expected as fine particles could be obtained only with enhanced level of energy input.
4.2.3.2 Particle Size of Powder
The average particle sizes of the powders were determined from the sieve analysis data
using equations (3.2) and (3.3) and are shown.in the Table 4.2.8. The geometric mean diameters
were 2.10, 1.23,0.70,0.61,0.2 and 0.14 mm for ground samples PDl, PD2, PD3, PD4, PD5 and
PD6, respectively. The corresponding surface mean diameters of the above samples were 3.12,
2.52, 1.81, 1.50, 0.50 and 0.21 mm, respectively. The surface mean diameters of the powders
were- determined for the purpose of estimating the effective diffusion coefficient of the distillation
process (discussed later in Section 4.2.3.9).
4.2.3.3 Estimated Energy for Grinding
The gririding of spices is an energy intensive process. The energy needed for grinding of
solids is a function of surface area of particles produced. There are several energy laws for
grinding (Section 2.3.3 of Review of Literature) of which three of them viz., Kick's law, Rittingers
law and Bond's law are cOIpmonly used for estimation of energy for grinding. However, Kick's
law is best suited for small initial particle sizes
117

ereas Rittinger's law is best applicable for larger initial particle sizes. As the Bond's 'W.is best
suited for medium particle sizes (which is true here), Bond's equation was plied for the estimation
of energy in the present study.
The estimated energy required for size reduction or grinding from an initial article size of 5 mm
(initial average size or diameter of a black pepper seeds) to different article sizes (PD1, PD2, PD3,
PD4, PD5 and PD6) using Bond's Eq. 3.4 is shown in Table 4.2.7. As expected, the highest
estimated energy (42.22 kJ kg-I) was consumed for 'obtaining fine powder (PD6) of geometric
mean particle size of 0.14 mm and lowest energy (4.61 kJ kg-I) was consumed for obtaining coarse
powder (PD1) having geometric
m
Table 4.2.8
ean particle size of 2.10 mm.
, Sieve analvsis data of ground black pepper powder to different particle sizes
51 Mesh Mean sieve No. size Diameters Weight fractions (Wi) ofdlf't'erent samples
dm dg PD1 PD2 PD3 PD4 PD5 PD6
1 4/5 4.375 4.359 0.058 0.010 - - - -
2 5/10 3.000 2.828 0.683 0.231 0.044 0.012 0.003 - 3 10/20 1.425 1.304 0.157 0.582 0.438 0.392 0.016 - 4 20/30 0.725 0.714 0.020 0.017 0.092 0.096 0.167 - 5 30/40 0.513 0.505 0.032 0.048 0.130 0.144 0.209 -
6 40/60 0.338 0.326 0.026 0.034 0.098 0.120 0.088 0.057
7 60/80 0.215 0.212 0.010 0.052 0.055 0.097 0.108 0.084
8 80/100 0.165 0.164 0.016 0.024 0.066 0.054 0.1 04 0.218
9 100/120 0.138 0.137 - - 0.040 0.036 0.043 0.215
10 120/140 0.116 0.115 - - - - 0.106 0.160
11 140/200 0.091 0.089 - - - - 0.098 0.101
12 200/270 0.064 0.063 - - - - - 0.091
Geometric mean diameter 2.10 1.23 0.70 0.61 0.20 0.14
(Eq.3.2) Surface mean diameter (Eq.3.3) 3.12 2.52 1.81 1.50 0.50 0.21
dm arithmetic mean sieve diameter dg – geometric mean sieve diameter
118
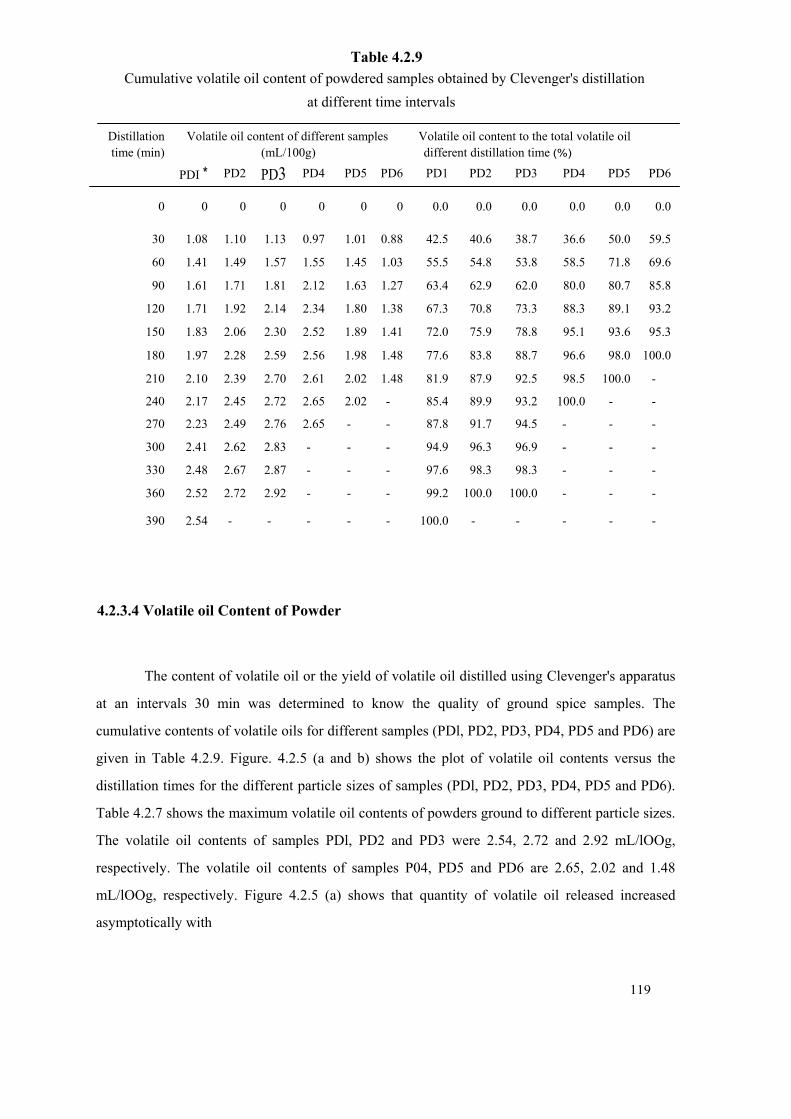
Table 4.2.9 Cumulative volatile oil content of powdered samples obtained by Clevenger's distillation
at different time intervals
Distillation Volatile oil content of different samples Volatile oil content to the total volatile oil time (min) (mL/100g) different distillation time (%)
PDI * PD2 PD3 PD4 PD5 PD6 PD1 PD2 PD3 PD4 PD5 PD6
0 0 0 0 0 0 0 0.0 0.0 0.0 0.0 0.0 0.0
30 1.08 1.10 1.13 0.97 1.01 0.88 42.5 40.6 38.7 36.6 50.0 59.5
60 1.41 1.49 1.57 1.55 1.45 1.03 55.5 54.8 53.8 58.5 71.8 69.6
90 1.61 1.71 1.81 2.12 1.63 1.27 63.4 62.9 62.0 80.0 80.7 85.8
120 1.71 1.92 2.14 2.34 1.80 1.38 67.3 70.8 73.3 88.3 89.1 93.2
150 1.83 2.06 2.30 2.52 1.89 1.41 72.0 75.9 78.8 95.1 93.6 95.3
180 1.97 2.28 2.59 2.56 1.98 1.48 77.6 83.8 88.7 96.6 98.0 100.0
210 2.10 2.39 2.70 2.61 2.02 1.48 81.9 87.9 92.5 98.5 100.0 -
240 2.17 2.45 2.72 2.65 2.02 - 85.4 89.9 93.2 100.0 - -
270 2.23 2.49 2.76 2.65 - - 87.8 91.7 94.5 - - -
300 2.41 2.62 2.83 - - - 94.9 96.3 96.9 - - -
330 2.48 2.67 2.87 - - - 97.6 98.3 98.3 - - -
360 2.52 2.72 2.92 - - - 99.2 100.0 100.0 - - -
390 2.54 - - - - - 100.0 - - - - -
4.2.3.4 Volatile oil Content of Powder
The content of volatile oil or the yield of volatile oil distilled using Clevenger's apparatus
at an intervals 30 min was determined to know the quality of ground spice samples. The
cumulative contents of volatile oils for different samples (PDl, PD2, PD3, PD4, PD5 and PD6) are
given in Table 4.2.9. Figure. 4.2.5 (a and b) shows the plot of volatile oil contents versus the
distillation times for the different particle sizes of samples (PDl, PD2, PD3, PD4, PD5 and PD6).
Table 4.2.7 shows the maximum volatile oil contents of powders ground to different particle sizes.
The volatile oil contents of samples PDl, PD2 and PD3 were 2.54, 2.72 and 2.92 mL/lOOg,
respectively. The volatile oil contents of samples P04, PD5 and PD6 are 2.65, 2.02 and 1.48
mL/lOOg, respectively. Figure 4.2.5 (a) shows that quantity of volatile oil released increased
asymptotically with
119

Fig. 4.2.5 Volatile oil yield versus distillation time at different particle sizes of black pepper powder (a) For samples of POI, P02 and P03 (b) For samples of
PD4, P05 and PD6 .
120

the distillation time for all the three samples of PO 1, P02 and P03, indicating that the complete
volatile oils present in these powdered samples were not removed in the distillation process as the
curves were not flattened even at the end of 350 minutes. On the other hand, Fig. 4.2.5 (b) shows
that as the entire quantity of oil present in the powdered samples (P04, P05 and P06) was distilled,
as the curves flattened at the end of distillation process. This meant that there was a definite loss
in the volatile oil content due to grinding in case of samples P04, P05 and P06 (finer powders) as
these samples yielded less volatile oil when compared with the content of volatile oil of sample
P03. The lowest content of volatile oil was found to be in P06, which had a very fine geometric
mean particle diameter of only 0.14mm. There results indicate that particles with low average
mean diameter possess low quantity of volatile oil.
4.2.3.5 Distillation Time
The distillation time for distillation of volatile oil from the samples changes due to the particle size
of the powder (Table 4.2.9). The time for the complete distillation of volatile oil samples of PD1,
P02, PD3, P04, PD5 and PD6 were 390,360,360,240,210 and 180 min, respectively. Table 4.2.9
shows that the content of volatile oil was about 40% of the total volatile oil in first 30 min of
distillation for samples of PO 1, P02, PD3 and P04, whereas the contents were 50 and 60% in case
of P05 and PD6, respectively. The mean volatile oil content at the end of 90 min of distillation
time was about 63% for samples of PD1, P02, PD3, and about 80 to 86% in case of PD4, PD5 and
P06. It indicated that if coarser were the particles slower was' the rate of volatile oil distillation but
finer the particles faster was the distillation of volatile oil. This might be because, if coarser were
the particle size, the resistance offered by the particle for the movement of volatile oil from the
core of the particle to the surface was higher and hence the mass transfer was slower. In the case of
finer particle size, however, this resistance was relatively low, and hence, the mass transfer was
faster, thereby reducing the distillation time. It was thus concluded that distillation time of Hfe
particles depended on the mean
diameter of the powder particles.
121
4.2.3.6 Optimization of Particle Size
The foregoing discussions indicated that during ambient grinding of spices, very fine
particle sizes had yielded less of volatile oil due to the volatile oil loss during grinding. On the
other hand, i I' the powder was coarse, volati Ie oi I content was also less as the complete volatile
oil present in the powder was not released easily during distillation. Hence, there might exist a
particle size between coarse and fine which could offer the highest content of volatile oil. The
present section thus deals with finding of the best particle size of black pepper suitable for
commercial purpose.
The optimal particle size of the powder is defined as the geometric mean particle diameter
at which percentage recovery of volatile oil is maximum or the loss of volatile oil is minimum.
Figure 4.2.6 shows the plot of volatile oil loss, distillation time and input energy for grinding
versus geometric mean particle (dga) diameter. The loss of volatile oil was minimum at geometric
mean particle diameter (size) of about 0.7 mm. If the particle size was less than 0.7 mm, the loss of
oil was more (due to high temperature during grinding and due to enhanced surface area of the
particles exposed to the atmosphere during grinding), the energy for size reduction was also high,
though the distillation time was less. On the other hand, if the particle size was more than 0.7 mm,
the content of oil was less as the oil present in the powder could not be completely distilled even
after 6 hours of extraction, though the energy required for size reduction reduced. Hence, the
particle size of about 0.7 mm (US 25 mesh) can be taken as optimum (Fig. 4.2.6) and the
corresponding grinding energy and distillation time were 14.19 kJ kg-1 and 6 hours, respectively.
Gopalkrishnan et al. (1991) reported that the volatile oil content IS maximum for particles obtained
with sieve size of 0.75 mm in case of grinding of cardamom.
This optimal particle size (about 0.7 mm) would be of commercial importance in the large
scale industrial grinding operations where black pepper is ground for the production of volatile oil
by distillation process.
122

Fig. 4.2.6 Optimization of parameters in grinding of black pepper

4.2.3.7 Physical Properties of Volatile oil
The properties of volatile oil of black pepper samples were determined in order to
determine the quality of ground samples (PO 1, P02, P03, P04, PD5 and P06). The physical
properties of volatile oil measured were specific gravity, refractive index and optical rotation
Cfable 4.2.10). No significant changes (p s 0.05) in the physical properties of oils at different
particle sizes were observed. The average values of specific gravity, refractive index and optical
rotation of oils were 0.94, 1.49 and -2.40°, respectively. The values indicated that these properties
could not be used to differentiate the quality of ground black pepper. In other words, it indicates
that in range of particle sizes studied, these selected physical properties of volatile oil remains
unaltered.
Table 4.2.10
Physical properties of volatile oils of black pepper ground to different particle sizes in
various mills.
Plate Mill Hammer mill
Sample POI P02 P03 P04 P05 P06
Particle
Diameter (mm) 2.08 1.23 0.70 0.61 0.20 0.14
Grinding
temperature (C ) 30 30 31 31 45 65
Volatile oil 2.54 ± 0.04 2.72 ± 0.06 2.92 ± 0.03 2.65 ± 0.05 2.02 ± 0.09 content
1.48 ± 0.03
(mL/100g)
Specific gravity 0.930 0.932 0.941 0.954 0.905 0.942
Refractive index 1.495 1.492 1.487 1.488 1.485 1.490
Optical rotation( degree)
-2.381 -2.340 -2.396. -2.360 -2.495 -2.393
124

4.2.3.8 Analysis of Volatile oil by Gas Chromatography
The gas chromatographic analysis of volatile spice oils is a method of separation of
volatile compounds based on their retention time within gas chromatographic column. Clevenger's
method of volatile oil distillation gives the total volatile oil content in the powdered sample,
whereas the gas chromatographic analysis is a tool to identify the various constituents of volatile
oil for measuring the quality of the oil. As mentioned in earlier sections, volatile oil constitutes
mainly of monoterpenes (70-80%), sesqueterpenes (20-30%) and small amount (less than 5%) of
oxygenated compounds.
The Gas Chromatographic-Mass Spectra (GC-MS) analysis of one of the samples of
volatile oil (Fig. 4.2.7) was done to identify these components. Based on the retention time, Kovats
indices (Jennings and Shibamato, 1980; Davies, 1990) and also matching with the reference mass
spectra (Adams, 1989) or by co-injection on GC,' nine major compounds were identified (Table
4.2.11). These were taken as markers to study the flavour quality of the oil. These nine compounds
constituted 79 to 90% of the total volatile oil (Table 4.2.12). The absolute recovery data with
respect to each component in volatile oil are shown in Fig 4.2.8 and 4.2.9.
The quantities of monoterpenes (Fig. 4.2.8 and 4.2.10) viz., a-thujene, a-pinene, sabinene,
13-pinene and limonene, present in the volatile oil was higher in large and medium sizes of
particle. The quantity of monoterpene reached maximum when the particle size was 0.70 mm. At a
higher particle size (2.10 mm), the release of monoterpenes was incomplete. At lower particle
sizes (0.14 and 0.20 mm), less quantities of monoterpenes indicated that the loss was due to higher
temperatures (45 to 65 C)
during grinding.
125

Table 4.2.11
Identification of flavour compounds in volatile oil of black pepper by GC-MS analysis
Compounds Peak No.** Retention time Refractive Method of (Min) index identification * * *
α-Thujene* - - Co-GC
α-Pinene A 3.767 942 RI, GC, MS Sabinene* - - - Co-GC
~-Pinene B 4.867 982 RI, GC, MS
Limonene C 6.633 1033 RI, GC, MS a-Copaene 0 24.300 1368 RI,MS
~-Caryophyllene E 26.700 1428 RI, MS, Co-GC
~-Bisabolene F 32.567 1505 RI,MS
Caryophyllene oxide G 35.383 1582 RI,MS
* Identified by co-injection in gas chromatography ** Please see Fig.4.2.7 for details of GC peaks *** GC means Gas Chromatography, Co-GC means co-injection of GC,
RI means refractive index, MS means mass spectrography
The quantities of sesquiterpene (Fig. 4.2.9 and Fig. 4.2.10) viz., α-copaene, β-
caryophyllene, β-bisabolene and caryophyllene oxide, present in the oil were maximum at the
particle size of 0.14 mm. At higher particle sizes, the release of sesquiterpenes was incomplete
(Table 4.2.12). The amount of oxygenated compound (major compound: caryophyllene oxide
identified from its mass spectrum and Kovats index value) present in volatile oil at various particle
sizes varied from 0.20 to 0.26 mL/lOOg. In the present study, no noticiable change was observed
except its complete disappearance in. the volatile oil obtained from the powder of particle size 0.2
mm, probably due to its conversion to β-caryophyllene during processing as observed by a rise in
its quantity.
126

Fig. 4.2.7 GC-MS analysis of volatile oil for identifying constituents
127

Table 4.2.12
Gas chromatographic analysis data of volatile oil samples of black pepper ground to
different particle sizes (% concentrations)
Compounds Samples of black PD1 PD2 PD3 PD4 PD5 PD6
1. α-Thujene 0.72 1.72 2.00 1.12 1.44 0.41
2. α-Pinene 3.38 5.57 8.58 4.59 4.87 1.65
3. Sabinene 16.68 19.52 24.47 17.23 15.19 7.80
4. β-Pinene 10.53 11.53 14.42 10.63 12.45 5.53 5. Limonene 26.17 24.20 23.31 22.70 23.82 15.62 6. α-Copaene 4.19 3.50 3.55 4.46 5.96 9.30 7. β-Caryophyllene 1.82 1.64 1.58 2.09 15.94 9.44 8. β-Bisabolene 6'(l9 5.67 4.35 7.21 10.13 14.20 9.Caryophyllene 9.58 8.73 6.82 9.88 0.00 17.22 Total 79.16 82.10 89.08 79.91 89.80 81.17 Monoterpenes (%) 57.48 62.54 72.78 56.27 57.77 31.01 Sesqui terpenes (%) 21.68 19.54 16.30 23.64 32.03 50.16 Ratio of To Sesquiterpenes 2.65 3.20 4.47 2.38 1.80 0.62
.. ,* Particle sizes of, PO I, P02, P03, P04, P05 and P06 are 2.10, 1.23, 0.70, 0.61,
0.20 and 0.14 mm, respectively
Hubert (1991) observed that the ratio of monoterpenes to sesquiterpenes more than 1.74
would give strong peppery note to oil. Table 4.2.12, shows that the ratio was greater than 1.74 for
oils obtained from particles sizes greater than 0.2 mm, for maximum amount of volatile oil with
overall flavour quality. According to Salzer (1977), good amounts of monoterpenes for odour and
the body, moderate amounts of sesquiterpenes for spicy note and reasonable amounts of
oxygenated compounds should be present in the oil. Accordingly, the particle sizes of 0.6 to 0.7
mm were preferred. If large amounts of sesquiterpenes in the volatile oil are required, the particle
sizes of 0.20 and 0.14 mm may be preferred which gives sweet and flowery notes (Lewis et at., 1969). The variation in the content of sesqueterpenes was not significant (in the range of 0.48 to
0.74 mL/100g) as compared to the contents of monoterpenes. which varied from 0.46 to 2.13 mL/
100g.
128

Fig. 4.2.8 Variations of 1lI0noterpenes constituents in hlack pepper volatile oil ground to di frerent particle sizes
rig. 4.2.9 Variations of sesqucterpencs constitucnts in black pepper volatile oil ground to different particle sizes
129

Fig. 4.2.10 Variations of total, l11onoterpene and sesqueterpenes content in pepper volatile oil ground to different particle sizes
130

Typical gas chromatographs of PO 1 (2.1 0 mm) and P06 (0.14 mm) are indicated in Fig.
4.2.11 (a) and (b), respectively for comparison of distribution pattern of gas chromatographic
peaks in both particle sizes. These graphs indicated that at higher particle sizes (2.10 mm) the
contents of monoterpenes (viz., peak numbers 1 to 5) in the volatile oil were higher whereas the
contents of sesquete~'penes (viz., peak numbers 6 to 9) were lower. In the case of lower or finer
particle sizes (0.14 mm) the contents of sesqueterpenes were relatively higher. This meant that at
finer particle sizes, the loss of monoterpenes could be higher due to higher product temperatures.
4.2.3.9 Effective Diffusion Coefficient
Distillation of volatile oil involves removal of volatile oil present in the powdered black
pepper samples using Clevenger's apparatus (Section 3.2.3.2 of Materials and Methods). The
quantity of volatile oil content per unit distillation time is a function of particle size, as has been
mentioned in the earlier sections. If the particle size is very fine then the content of volatile oil is
less due to the volatile oil loss during grinding. On the hand, if the particle size of the powder is
coarse then volatile oil content is also less as the complete volatile oil present in the powder is not
released during distillation. In this section, this phenomenon was analysed employing the diffusion
theory (mentioned in Section 3.2.3.5) by determining the effective diffusion coefficients for
different particle sizes of samples namely PDI, PD2, PD3, PD4, PD5 and PD6.
The volatile oil from the black pepper powder was distilled using Clevenger's apparatus.
When the mixture of black pepper powder and water system was heated, the volatile oil
constituents of the powder were be diffusing into water at 100 C during the distillation process. As
there was sufficient agitation of powder-water mixture system due to buoyant forces while boiling
in the apparatus, the surface resistance became small. Therefore, it was assumed that the total
resistance was due to only internal resistance, and the phenomenon was analysed using diffusion
theory employing Pick's second law (Eq.3.8). The powdered particles were assumed to be
spherical in shape and surface mean particle diameters were used in determining the effective
diffusion coefficients.
131

Fig. 4.2.11GC Profiles of black pepper volatile oil (a) at particle size of 2.10 mm and (b) at particle size of 0.14mm
132

The effective diffusion coefficient of the samples was calculated using Eq. 3.10, from the
plots of In M1 versus distillation time t, employing linear regression technique. However, the
significance of the intercepts was overlooked (Spiro and Hunter, 1985). The initial oil content Mr
in case of PDI, PD2 and PD3 was taken as 3.07 ml/100g (assuming 95% distillation efficiency of
sample PD3). In the case of PD4, PD5 and P06 the initial oil contents were 2.80, 2.13 and 1.56
mI/100g, assuming 95% distillation to give their maximum yield. The weighed surface mean
particle radius was determined using Eq. (3.3) for the calculation of effective diffusion
coefficient.
The experimental data fitted well with the Eq. 3.6, as evidenced by high correlation
coefficients (0.96 to 0.99) and the plots are shown in Figs 4.2. 12(a & b). The values of effective
diffusion coefficients are shown in Table 4.2.7. The values of diffusion coefficients for coarser
particle samples PO 1, P02, PD3 and P04 were of the same magnitude (1.7 x 10,11, 1.5 X 10,11,
1.1 X 10,11 and 1.2 x 10,11 m2 S,I, respectively)
with an average of 1.38 x 10'11 m2 S,l. Gekas (1992) reported a value of diffusion coefficient to be
1.08 x lO'IIm2 S'I for the extraction of oil from soybean flakes (0.43 mm thick) using hexane as
solvent. Thus, the values of di~Tusion coefficients obtained in the present study compared well
with literature values for coarser particles of higher oil concentrations. For finer powders (P05 and
P06), the yalues were very low, 0.14 x 10,11 and 0.03 x 10,11 m2 S,I, respectively, which might be
attributed to low initial oil concentrations in these samples. The latter was in accordance with the
observations made by Aguerre et al., (1985) that the diffusion coefficients were not constant for
drying and leaching operations at low concentrations.
4.2.3.10 Fourier Number
The Fourier number (Fo ) was determined employing Eq. 3.9 which contains a range of
values for n that can vary from unity to infinity. The values of effective diffusion coefficients were
determined assuming n value as unity for simplification. To check whether this assumption was
correct, the Fourier number (Fo= De tlrs2) was determined using effective diffusion coefficients
(De), obtained from the experimental data using distillation time (t) and surface mean radius of the
powder. ,The values of Fourier numbers for powdered samples of PD1, PD2, PD3, PD4, PD5 and
PD6 thus determined were 0.17,
133

Fig. 4.2.12 Ln (Ml) versus distillation time at different particle sizes of black pepper powder
(a) For samples of PD1, PD2 and PD3 (b) For samples of PD4, PD5 and PD6
134
0.20, 0.29, 0.31, 0.28, and 0.29, respectively. It has been reported (McCabe and Smith, 1976;
Aguerre et ai., 1985) that if the Fourier number thus obtained is greater than 0.1 then the
assumption of n=l in Eq. 3.9 is justified. It was observed in the present study that the Fourier
numbers (Table 4.2.7) for all the particle sizes were greater than 0.1, which justified for
considering only the first term (n=l) in Eq. 3.9, ignoring the higher order terms.
4.2.3.11 Conclusions
The study on ambient grinding characteristics has led to the following conclusions:
1) The particle size of powdered sample determined using sieve analysis varied from coarse to
fine. The powdered sample of PD I, PD2, PD3, PD4, PD5 and PD6 had geometric mean
particle diameters of 2.10, 1.23, 0.70, 0.61, 0.20 and 0.14 mm, respectively. The finer the
particle size of powder the higher was the temperature of ground powder measured at the
mill's outlet at steady condition, and obviously the finer the particle size the higher was the
energy expenditure.
2) The time for volatile oil distillation of coarse to fine powdered samples varied from 390 to
180 min, respectively indicating that the finer were the powder particles the faster was the
distillation.
3) The volatile oil content of samples of PD1, PD2, PD3, PD4, PD5 and PD6 at the end of
distillation were 2.54,2.72,2.92, 2.65,2.02 and 1.48 mL/IOOg, respectively. The lowest
volatile oil content was observed with fine particles. The particle mean diameter of 0.7 mm
was found to be the optin~um particle size which gave the desirable highest volatile oil
content.
4) The physical properties of volatile oil viz., specific gravity, refractive index and optical
rotation did not change in the rang~ of experimental particle sizes.
5) The study on quality of oil using gas chromatogn~phic analysis showed that higher ratio of
monoterpenes to sesqueterpenes was present in coarse particles (> 0.2 mm),
135

and gave a very strong peppery note. Powdered particle sizes lesser than 0.2 mm
contained more quantity of volatile oil that gave spicy, sweet and flowery notes. The
content of sesqueterpenes varied marginally (0.5 to 0.7 mL/100g) as compared to the
content of monoterpenes, which varied between 0.5 and 2.1 mL/100g for the range of
particle sizes studied.
6. The effective diffusion coefficients (determined using Fick's second law) were fairly
constant (1.38 x 10⁻¹¹ m2 S-I) for powdered samples of POI, P02, P03 and P04 having
higher initial oil concentrations. These were low for powdered samples of P05 and
PD6 having lower initial oil concentration. The Fourier numbers determined for all the
powered samples were greater than 0.1.
136

4.3 Cryogenic Size-Reduction or Cryogenic Grinding of Black Pepper
The aim of spice grinding was to obtain powder of smaller particle sizes with good quality
in terms of aroma and flavour. In the ambient grinding process, heat is generated when energy is
used to fracture a particle into smaller sizes. This generated heat IS detrimental to the finished
product, as it rises the temperature to as high as 93 C (Wistreich and Schafer 1962), and it may
result in considerable loss of aroma and flavour components, resulting in deterioration of quality.
The loss of volatile oil (aroma and flavour) can be significantly reduced by a cryogenic grinding
technique (Pruthi, 1980). Liquid nitrogen at -195.6 C provides the refrigeration needed to pre-cool
the spices and maintain the desired low temperature by not allowing the heat (generated during
grinding operation) to increase the temperature of product. In addition to maintaining the low
temperature, vapourisation of liquid nitrogen to the gaseous state, in effect, creates an inert and dry
atmosphere for additional protection of spice quality. Pre-cooling of raw spice and continuous low
temperature maintained within the mill reduce the losses of volatile oils and moisture contents,
thereby retaining most of the flavour strength per unit mass of spice (Singh and Goswami, 1999a).
As quantitative data on cryogenic grinding of Indian spices are scarce, this experiment was planned
to study the grinding characteristics of black pepper employing the system of cryogenic grinding
and to compare it with the conventionally followed ambient grinding method, both in laboratory
scale (150 to 200 g) and at pilot scale (4 kg) grinding operations.
4.3.1 Evaluation of Cooling, Chilling and Cryogenic Freezing Methods for Grinding
A comparison of different cooling systems including cryogenic freezing is a prerequisite
to know the advantages or limitations of these systems. Low temperature of the spice before
grinding can be attained by different methods. The present section deals with four such methods
for obtaining low temperature of feed spice prior and after grinding employing domestic mixer
grinder (Fig. 3.4), using identical grinding conditions.
137

Table 4.3.1
Temperature of feed and products obtained by different methods of cooling
Sample Method of cooling* Temperature of black pepper (C)
Code Before grinding After grinding
CAI Cold room 13 ± 1 49 ± I
CA2 Plate Freezer -11 ± 1 40±4
CA3 LN2 indirect mixing -38 ± 3 41 ± 2
CA4 LN2 direct mixing -195.6 -32 ± 3
CA5 Ambient 30± 0 61 ± 1
* Details of grinding systems employed are shown in Fig. 3.5 of chapd.er 3.
The following four cooling or chilling or freezing methods were employed. They were:
(1) cooling black pepper in a cold room, (2) chilling black pepper using a plate freezer, (3)
freezing by dipping black pepper enclosed in a polyethylene pouch in liquid nitrogen and (4)
freezing black pepper by directly injecting liquid nitrogen into a known quantity of the spice.
These methods of cooling or chilling or freezing are represented by schematic diagrams as shown
in Fig. 3.5. The product temperatures were measured immediately after grinding. As expected, the
lowest temperature of the product was obtained by directly mixing liquid nitrogen with black
'pepper sample (Table 4.3.1). This was because the heat transfer rate was higher in case of direct
mixing of liquid nitrogen with black pepper as small droplets evaporated quickly by absorbing the
latent heat of vapourisation from the sample. In other freezing methods, polyethylene cover acted
as a barrier (insulating effect) for heat transfer between the spice and liquid nitrogen, and reduced
the rate of heat transfer and hence, spice did not attain such a low temperature.
It was observed, from preliminary laboratory experimentation, that among the different
methods of freezing (viz., cooling, chilling and cryogenic freezing) the cryogenic freezing method
with liquid nitrogen, by direct injection into black pepper, was
138

Samples Temperature of black pepper (C) Content of volatile oil Before grinding After grinding (mL/lOOg)
Cryogenic grinding -195.6 -54.3 ± 8 3.18 ± 0.03
Ambient grinding +28 ± 0 +36.0 ± 2 2.85 ± 0.07
the most efficient method of freezing and reaching extremely low temperature of spice and
spice powder. These results are used in subsequent sections and detailed grinding
studies were conducted.
4.3.2 Evaluation of Cryogenic Grinding and Volatile oil Content of Black Pepper on a
Laboratory Set-up
A comparison of cryogenic and ambient grinding was needed to judge the quality of the
ground samples. Hence, the objective of this study was to compare the two grinding methods viz.,
cryogenic grinding and ambient grinding. Black pepper samples were ground using domestic
mixer-cum-grinder under both cryogenic and ambient grinding conditions keeping other grinding
parameters constant. Temperatures of the spice before and after grinding were recorded in both the
cases (Table 4.3.2). These temperatures were -195.6 and -54.3 C, respectively for cryogenic
conditions whereas for ambient grinding these temperatures were 28 and 36 C, respectively. The
cryogenic condition yielded markedly higher volatile oil (3.18 mLlI00g) as compared to ambient
sample (2.85 mL/100g).
Table: 4.3.2
Cryogenic (LN ) grinding and content of volatile 'oil of black pepper as compared to ambient grinding in laboratory scale
2
It was concluded from this laboratory scale experiment that cryogenic grinding could
yield about 12% higher quantity of volatile oil from black pepper as compared to that of ambient
grinding.
139

4.3.3 Effect of Cryogenic, Chilled, Ambient and High Temperature Grinding
Methods on Grinding Characteristics in Laboratory Scale
During the ambient grinding of black pepper, the mill and product temperature might rise
to as high as 93 C, and at such high temperature, there will be considerable loss of volatile oil
(Wistreich and Schafer, 1962). Section 4.2 also supported this finding that at a high grinding
temperature, the loss of volatile oil was considerably high. Cryogenic grinding could overcomes
this problem and help in retaining more volatile oils (Section 4.3.2 in the present study, Pruthi
1980 and 1991). It has been reported (Anon, 1993) by a grinding equipment manufacturer
(Hosakawa Alpine, 'Germany) that cryogenic grinding increased total volatile oil by 40% (Table
2.9). Mckee et ai. (1993) compared three grinding methods viz., ambient, chilled and liquid
nitrogen with ground material temperatures of 40, 38 and 33 C, respectively and observed
marginal variation in the volatile oil content.
The present section thus deals with studies on the effect of temperature on grinding
characteristics of black pepper. The four grinding methods (as described in Section 3.3.3) were the
powder samples of black pepper obtained by employing cryogenic, chilled, ambient and high
temperature grinding methods. The temperatures of raw materials prior to grinding were
maintained at -120, 10,24 and 40 C, respectively. The parameters determined for comparison were
particle size, temperature rise, and quantity and quality of volatile oil. These parameters were
selected considering the commercial importance of quality of ground spice.
4.3.3.1 Particle Size of Powder
Fineness of the powder is an index for quality of ground spice. It was measured in terms of
quantity of powder by weight which passed through a 60 mesh sieve (US sieve) having aperture
opening of 0.42 mm (Table 4.3.3). Fineness of powder was found to be greater (72.2 %) in case of
LN cooled samples. At cryogenic conditions, the material became brittle and crisp (Pruthi, 1991)
making size reduction easy by shattering technique instead of tearing. At high temperature
conditions, the fineness was the lowest (62.5%), and at chilled water and ambient grinding
conditions, the values were 52.5 and
2
140

55.6%, respectively. These values indicate that LN2 ground samples possess the highest fineness
which is highly desirable in commercial operations.
4.3.3.2 Temperature Rise During Grinding
The input and output temperatures of black pepper samples when subjected to grinding
under different conditions are shown in Table 4.3.3. As expected, the product (powder)
temperature was the lowest (-20 C) when liquid nitrogen was used for cooling the feed material,
while, the product temperature was very high (62 C) when the feed material was stabilized at 40 C
before grinding. At ambient conditions (24 C), the product temperature was 50 C while with
chilled water circulation the product temperature was 30 C. The moisture content of the product
varied from 11.8 to 13.5%. These results show that high temperature (prior or after grinding) is
detrimental to quality of ground spice samples.
Table 4.3.3
Effect of grinding conditions on the volatile oil content and fineness of ground black pepper
Finenessb Grinding Condition
Feed temperature
Product temperature
Moisture content
Volatile oil content
Retention"
(C) (C) (%) (mL/I00g) (%) (%)
High 40 62 11.8 2.65 ± 0.07 62.5
Temperature
Ambient 24 50 13.5 3.]0 ± 0.09 17.0 55.6
Chilled water 10 30 13.4 3.56 ± 0.05 34.3 52.5
LN2 cooling -120 -20 12.5 3.60 ± 0.04 35.9 72.2
of oil
a - Percentage increase in retention of volatile oil as compared to high temperature condition b- Percentage of powder by weight passing through a 60 mesh US sieve
4.3.3.3 Volatile oil Content of Powder
The volatile oil content of a ground spice is the primary index for quality of product. It
was (Table 4.3.3) the highest (3.6 mL/100g) in the case of cryogenically
141

(liquid nitrogen) frozen-ground sample and was least (2.65 mL/I00g) at the high product
temperature of 62 C. The volatile oil content in chilled pepper sample and in liquid nitrogen frozen
samples were close (3.56 and 3.6 mL/I00g, respectively) and were not significantly different (p <
0.01). The use of liquid nitrogen in grinding had not only increased the content of volatile oils
(about 36% more as compared to high temperature method) but also improved the fineness of the
product. In Industrial scale of applications where the highest temperature of powder can reach as
high as 93 C, the content of volatile oils may even be higher with the application of liquid
nitrogen. The chilled water circulation would also retain same quantity of volatile oils, as it
happened in the case of liquid nitrogen method. But, chilled water technique was not sufficient to
significantly reduce the temperature rise of the product (Singh and Goswami, 1999a). Also the
particle size is also high. The direct mixing of liquid nitrogen and spices could efficiently cool
(due to enhanced heat transfer rate) the spice rather than indirect cooling using chilled water
technique in large scale grinding operations. It was thus, inferred that liquid nitrogen was an
efficient cooling system (and also to obtain fine particles) as compared to other existing methods
of grinding mentioned in this study.
Table 4.3.4
GC analysis data of black pepper oil samples obtained under different grinding conditions (Values
are expressed on relative percent basis) .
Component Grinding methods High Ambient Chilled LN2 frozen temperature water
1. α-pinene 5.05 5.60 6.65 7.00
2. β-pinene 13.52 14.36 15.12 15.68
3. Myrcene 21.20 19.5Q 20.45 23.20 4. Limonene 22.80 22.18 22.90 23.80 5. B-caryophyllene 21.20 20.20 19.75 17.65 Total 83.77 81.84 84.87 87.33 Monoterpenes (%) (1-4) 62.57 61. 64 65.12 69.70 Sesqueterpenes (%) (5) 21.20 20.20 19.75 17.65 Ratio of monoterpenes to 3.00 3.10 3.30 3.90 Sesq ueterpenes
142

4.3.3.4 Analysis of Volatile oil by Gas Chromatography
Chemical composition of the black pepper oil has been reported (Lewis et al., 1969 and Govindrajan,
1977). Pepper oil is mainly made up of monoterpenes (70-80%), and sesqueterpene (20-30%), and a
small amount (less than 5%) of oxygenated compounds is also present. The major monoterpenes
present in the oil are α- pinene, β-pinene, myrcene, limonene and sabinene while β-caryophyllene is
the chief sesqueterpene (the presence of myrcene, a monoterpene component was also observed in
this variety of black pepper). The gas chromatographic analysis of the four oil samples obtained
under different grinding (high temperature, ambient, chilled water and liquid nitrogen frozen)
conditions and the relative percentage of some the main constituents of oil are presented in Table
4.3.4. Better retention of monoterpenes (α-pinene, β-pinene, myrcene, limonene) was observed in the
case of chilled water and LN2 cooled grinding (10 and -120 C) as compared to ambient and high
temperature (24 and 40 C) ground conditions of grinding. The ratio of monoterpenes to
sequeterpenes varied from 3.0 to 3.9 which indicated that all the four samples yielded volatile oil
with a strong peppery note (Hubert, 1991). Figure 4.3.1 shows the variation of constituent
compounds of volatile oil (in absolute quantities in mLlI00g). The content of all the four compounds
was higher for chilled water and liquid nitrogen frozen ground samples compared to other powders.
Considering β-caryophyllene, the values were slightly low (19.8 and 17.7) in the case of chilled
water and LN2 frozen (10 and -120 C) ground samples than that for ambient and high temperature
(24 and 40 C) ground samples. Figure 4.3.2 shows the variations of constituent compounds of
volatile oil viz., total oil, monterpenes and sesqueterpenes in absolute quantities (mL/100g). The
contents of sesqueterpenes in the volatile oil was marginally different (0.6 to 0.75 mLlI00g), while
these of monoterpenes were in the range from 1.6 to 2.5 mLlI00g. This was because the
sesqueterpenes compounds were less sensitive to temperature unlike the monoterpene compounds. It
is thus, concluded that LN2 samples possess highest quantity of monoterpenes compared to all other
samples which gives the desirable feeling of flavour freshness.
143

Fig. 4.3.1 Variations or volatile oil constituents or black pepper ground by rour diflerent grinding methods
Fig. 4.3.2 Variations or total, monoterpene and sesqueterpenes content in volatile oil or black pepper ground by rour dirrerent grinding methods
144

4.3.3.5 Conclusions
It was concluded from the foregoing discussion that,
I) The particle size of black pepper powder ground by cryogenic method was the finest as
compared to other three methods.
2) The cryogenic and chilled temperature methods .of grinding yielded similar quantities of
volatile oil as compared to low quantities in ambient and high temperatures grinding methods.
There was a gain of about 36% in the content of volatile oil by cryogenic grinding method as
compared to high temperature grinding method. Chilled water technique was not adequate to
markedly reduce the temperature rise during grinding of the product.
3) Gas chromatographic analysis showed that in cryogenic grinding technique, the contents of
monoterpenes was higher compared"to those obtained by other methods. The content of
sesqueterpenes was fairly similar in all four grinding methods employed in this study.
145

4.3.4 Cryogenic Grinding on a Pilot Scale
It was reported in the Section 4.3.3 that cryogenic grinding of black pepper in the
laboratory scale grinding gave better grinding characteristics in terms of particle fineness, volatile
oil content and quality of volatile oil. However, most of the studies have reported the results
obtained on experiments conducted for a small batch size of spice (l00 to 200g). The reason being
the high unit cost of spices and unavailability of high capacity LN2 grinding facilities. Since
experimental results are scanty in terms of pilot scale cryogenic grinding of spices, a study of
cryogenic grinding of black pepper in a pilot scale (each sample run of 4 kg) grinder at various
feed rates and temperature conditions was carried out to evaluate the grinding characteristics. This
would not only simulate the industrial process but also generates data that would be useful for
large scale trials, scaleup and process standardisation. A central composite rotatable design
(CCRD) concept was used in this study to determine the effect of these variables and to find
optimum grinding conditions in cryogenic grinding. The use at' experimental design was beneficial
in reducing the number of experiments and thus reducing quantity of spices which are expensIve.
The raw material (black pepper) obtained from a local spice processing company (not
from the local market) was used to simulate the real industrial situation to compare the cryogenic
ground powder with that for ambient ground samples. This raw material was of a variety of low
volatile oil content and had an average particle seed diameter of 4.1 mm.
The mill employed for both ambient and cryogenic grinding was the pin mill obtained
from Hosakowa Alpine, Germany, 80 kg h(1 capacity having 3.7 kW motor (3 phase, 440 V and
50 Hz) and was made of stainless steel. It consisted of two rotors (one fixed and another rotating
type) with a number of cylindrical stainless steel pins of 4 mm diameter affixed perpendicularly on
them. The feed spice was fed axially, ground between the pins and powder exit was in the radial
direction. The schematic diagram of the pilot scale cryogenic grinding set up is shown in Fig. 3.7.
146

4.3.4.1 Comparison of Cryogenic Grinding with AIl)bicnt Grinding
The following sections deal with the result~ obtained in cryogenic grinding technique
compared with those of ambient grinding on pilot scale grinding operations in terms of quantity of
volatile oil content, particle size of the powder, mill choking characteristics and quality of volatile
oiL In this investigation, cryogenically ground samples (CI to C9) were compared with ambient
ground samples (AI, A2) (Table 4.3.5).
Table 4.3.5
Results of volatile oil, moisture content and particle size of powder in cryogenic and ambient grinding in pilot scale
Codes for Feed rate Product Moisture Volatile oil Mean particle Sample * temperature content content** diameter
(kg hr-1) ( C) (% wb) (mL/100g) (mm)
C1 35.00 -15.00 10.00 1.67± 0.05 0.22
C2 35.00 -40.00 10.80 1.91± 0.03 0.26
C3 60.00 -40.00 12.00 1.82± 0.06 0.25
C4 15.00 -54.00 12.00 1.87± 0.08 0.25
C5 15 .00 -40.00 11.00 1.35± 0.03 0.20
C6 52.00 -25.00 11.50 1.90± 0.04 0.27
C7 35.00 -60.00 10.00 1.78± 0.09 0.22
C8 7.00 -15.00 10.00 1.44±0.07 0.24
C9 52.00 -54.00 12.00 1.42±0.06 0.25
Al 35.00 53.00 10.00 0.98± 0.05 0.24
A2 15.00 86.00 8.40 0.78± 0.04 0.16
* C 1 to C9 were the cryogenic ground samples and Al & A2 were ambient ground samples ** Moisture free basis
147

4.3.4.1.1 Feed Rate and Product Temperature
The feed rate of grinding influenced the rise in product temperature during ambient
grinding (Section 4.2.1) which in turn affected the quality attributes of the powder. The feed rate
and product temperatures were found to be interrelated in ambient grinding. On the other hand, in
case of low feed rate, the rise in product temperature (temperature gradient) was high (Table
4.2.2). Therefore, it was necessary to control the feed rate and the product temperature
(independent variables) to study their effect on the grinding characteristics of black pepper.
In the pilot scale cryogenic grinding experimentation, the feed rate and the product
temperatures during grinding were controlled by controlling both the feed rate of black pepper and
flow of LN2, according to the experiment design (Section 3.4.4.1). The feed rates, shown in Table
4.3.5, were varied from 7 to 60 kg h(1 using a vibratory (magnetic type) feeder. The product
temperatures were maintained at a predetermined temperature using a temperature controller by
suitably monitoring the flow of liquid nitrogen into the mill. The product temperature were in the
range of -15 ± 3 to -60 ± 3 C (Table 4.3.5). The range of feed rate was chosen based on the
equipment specification, particularly the capacity. However, the product temperature chosen was
based on the following aspects of industrial situations, (1) the minimum temperature chosen should
not be very low which would otherwise leads to difficulty in storage of powder for retail
distribution, and (2) the maximum temperature chosen should be slightly away from the freezing
point of water (0 to 5 C). Hence, the temperature range of about -IOta -65 Cwas chosen. The feed
rates of two control (ambient grinding) samples (in addition to that of experimental design) were
maintained at 15 and 35 kg h(1 and the product temperature reached were 86 and 53 C,
respectively.
4.3.4.1.2 Particle Size of Powder
The average particle sizes of the powders were determined by adopting the sieve analysis
technique using Eq.3.2 and the results are shown in the Table 4.3.5. The geometric mean particle
diameters in the case of cryogenic grinding varied from 0.20 mm to 0.27 mm, with an average of
0.25 ± 0.02 mm and in case of ambient grinding, it was
148

0.20 ± 0.04 mm. The geometric mean particle diameter in the case of cryogenic grinding was
higher (coarser) than the ambient ground black pepper powder. This apparently contradicted the
data reported in the literature that cryogenic grinding improved the fineness of powder (Section
2.4.5 (b)). Higher (coarser) particle size in case cryogenic grinding may be attributed to the fact that
the moisture content of cryogenic ground powder was higher as compared to samples ground in
ambient conditions. Higher moisture content of powder improved the cohesiveness of particles and
they stuck to each other, thereby increases apparent particle mean diameter. However, the mean
diameters of the powder particles was more consistent across the batch of nine cryogenic ground
samples (samples C1 to C9). These results indicate that particle size of product also depended upon
moisture content of feed apart from varying with feed rate and temperature. Thus, the grinding trials
were conducted with constant moisture feed.
4.3.4.1.3 Mill choking characteristics
Mill choking or sieve choking is a phenomenon in grinding of foods in which ground material
which is sticky (not free flowing) in nature adheres to the grinding surfaces or blocks the sieve
opening. It is a crucial characteristic in grinding of spices which usually have higher fat content. In
large scale ambient grinding operations, the ground products accumulate on the walls of mills or.
block the sieve opening (Anon, 1962) which may result in fire hazard or breakdown of the mill. It
has been reported (Landwehr and Pahl, 1986) that almost all grinding experiments on pepper
without chilling caused choking of sieve and ultimately led to breakdown of the mill. Watanabe et
at (1978) reported that grinding of nutmeg was impossible above 20 C but it was possible to grind
at temperature below -40 C. Sieve choking characteristics were photographed at various
temperatures of powder in cryogenic grinding of cumin and clove (Singh and Goswami, 1999a and
2000), who observed that at high temperatures, the blockage of sieves was high.
In the present investigation, it was observed that there was higher accumulation of pepper
powder on the different grinding surfaces viz., between the pins, and mill walls during ambient
grinding. The reasons for powder accumulation may be due to the fact that during grinding at the
temperature higher than the brittle point of black pepper and
149

4.2.1.2 Particle Size of Powder
The particle size of the ground material affect the consumer acceptability and, hence is an important
quality attribute. The particle size' of powder was determined by 'sieve analysis technique (method
cited in Section 3.2.1.1). Table 4.2.2 shows that the three feed rates viz., 3.6, 4.8 and 9.5 kg hr-1
yielded the powders (when the mill attained stabilized condition) having geometric mean particle
sizes of 0.13, 0.20 and 0.61 mm, respectively. The feed rate of 9.5 kg hr-1 (highest feed rate) reached
the equilibrium temperature at the earliest (15 min). Fine particle size could be achieved with low
feed rate because of longer residence time of the sample inside the grinding system.
Table 4.2.2
Effect of feed rate on particle size and on rise in product temperature at the time of stabilisation of grinding mill
Sl Feed rate Temperature Rise in product Time for Geometric mean No. of feed* temperature stabilization of particle size of
mill** powder after grinding ** (kg hr-1) (C) (C) (min) (mm)
1 3.6 27 49 22 0.14
2 4.8 31 29 24 0.20
3 9.5 27 09 15 0.61
* dicates ambient temperature In** Coefficient of variation (CY) < 15%
4.2.1.3 Volatile oil Content of Powder
Volatile oil content in the spice powder is a measure of its aroma and flavour, and hence
its quality. Higher the volatile oil content in spice powder, the higher is its market value in
financial terms since spices are valued for their aroma and flavour (Gopalkrishnan et al., 1991).
Therefore, in order to have a better quality of the ground spice, it is desirable that the volatile oil
content should be as high as possible. It is thus desirable to determine the volatile oil content with
a detailed analysis of the volatile oil.
100

Volatile oil content as determined by distillation (method cited in Section 3.2.1.3) has been
reported as volatile oil content of black pepper powder throughout the present research. The
moisture content of spice samples are reported in a similar way. The coefficient of variation (CY)
was less than 10%.
The volatile oil contents (moisture free basis) of black pepper powder drawn at different
temperatures and feed rates are shown in Table 4.2.3. The volatile oil content in the powder varied
with both particle size and the temperature. The loss of volatile oil in comparison to the hand
pounding (control sample) is reported in Table 4.2.3, which shows that as the temperature of the
product increased, the volatile oil content decreased and hence the loss of volatile oil as compared
to control sample increased markedly. These two indices also varied with feed rate, and a high
feed rate (and hence, low grinding or residence time) reduced the loss of these important quality
parameters. The closest value of 1.91 mL/100g, as compared to control sample (2.15 mL/100g),
was obtained only with highest feed rate of 9.5 kg hr-1 because the rise in temperature during
grinding was hardly 9 C. In other words, the loss of volatile oil was the lowest (11.2%) at a feed
rate of 9.5 kg hr-1 and highest (50.7%) at a feed rate of 3.6 kg hr-1. The corresponding geometric
mean particle sizes were 0.61 and 0.14 mm respectively (Table 4.2.2). It was observed in the
present study (Section 4.2.1.2) that low feed rate gave a powder of fine particle size, and high
powder temperatures (at equilibrium during grinding) but with highest loss of volatile oil. Similar
results have been reported by Gopalkrishnan et al. (1991) for ambient grinding of cardamom,
wherein the loss of volatile oil varied from 26% to 52% for particle size of 1.00 to 0.25 mm,
respectively.
The volatile oil content in the black pepper samples followed a negative relation with
product temperature analysis, according to the following empirical equations at different feed rates
of 3.6 and 4.8 kg hr-1 (regression equation was not possible for 9.5 kg hr-1 due to insufficient data
points):
(4.2.4)
101

2) (4.2.5)
where V 0 is the volatile oil content (mL/100g) and T is the corresponding product temperature
(C). The coefficients of determinations were 0.99 and 0.96, respectively.
The predicted product temperatures at different feed rates by using Eqs. 4.2.4 and 4.2.5 are given
in Table 4.2.3. The predicted values by regression compared well with the experimental ones.
Table 4.2.3
Effect of feed rate on temperature, moisture and volatile oil content of the ground black pepper powder samples
(Initial volatile oil content by hand pounding (control) sample = 2.15±0.04 mL/100g) Feed Ground Moisture Volatile oil content (moisture Loss of oil rate material content free basis) due to temperature (%) wet basis (mL/100g) grinding* (kg hr-1 (C) Experimental Predicted from (%) values the regression
equation
3.6 43 8.0 1.43 ± 0.09 1.42 33.5
50 7.4 1.32 ± 0.03 1.34 38.6
67 7.3 1.15 ± 0.05 1.15 46.5
75 6.0 1.06 ± 0.08 1.06 50.7
4.8 40 8.0 1.82 ± 0.09 1.83 15.3
48 8.0 1.65 ± 0.07 1.64 23.3
50 7.9 1.62 ± 0.05 1.59 24.6
52 7.2 1.51±0.12 1.54 29.7
9.5 36 8.2 1.91 ± 0.10 -** 11.2
* Loss of oil was calculated in comparison to the control sample
** Could not fit an equation due to insufficient data points
102

Similar results have been reported by Singh and Goswami (1999b) during ambient grinding of
cumin seed. In their study, the volatile oil content decreased from 2.86 to 2.26 mL/100g with
grinding temperature increasing from 40 to 85 C. Further, the statistical analysis of the data
obtained by these researchers revealed the decrease in volatile oil content was significant at all the
grinding temperatures (p≤0.01) under ambient condition. This was because of the fact that during
the ambient grinding process, the mass transfer rate increased due to an increase in vapour pressure
at higher temperatures which resulted in a loss of volatile oil at corresponding temperatures (Wolf
and Pahl, 1990). The empirical equation (r2=0.99, p≤0.01) obtained by regression analysis using
the experimental data of Singh and Goswami (1999b) for ambient grinding of cumin seeds is
represented as:
(4.2.6) Vo = - 0.014 T + 3.460
where V 0 is the volatile oil content (mL/100g) and T is the corresponding product temperature. It
is observed that the empirical Eq. 4.2.6 was similar to the empirical equations (Eqs. 4.2.4 and
4.2.5) obtained in the present study.
The moisture content of the ground samples varied from 6.0 to 8.2 %, and higher the
powder temperature lesser was the moisture content of the samples. The highest moisture loss
(moisture content was 6%) was observed at a product temperature of 76 C which was expected
because of high rate of vaporisation of moisture from the powder sample at a high temperature.
4.2.1.4 Conclusions
From the foregoing results and discussion on performance study of swing type hammer
mill at different feed rates, it was concluded that
1) The product (black pepper powder) temperature reached a temperature of as high as 76 C at
the lowest feed rate of 3.6 kg h(l. The product temperature during grinding followed a
polynomial of third order with grinding time. The rise in product
103

temperature was of the order of 49, 29 and 9 C at the feed rates of 3.6,4.8 and 9.5 kg hr-1
respectively.
2) The geometric mean particle sizes of the products were 0.14, 0.20 and 0.61 mm at the feed
rates of 3.6, 4.8 and 9.5 kg hr-I, respectively. The lower the feed rate the finer was spice
powder and vice-versa.
3) The volatile oil contents of black pepper samples at the stabilisation temperatures of 75, 52
and 36 C were 1.06, 1.51 and 1.91 mL/lOOg, respectively. The volatile oil contents varied
negetively with the product temperature at different feed rates. The loss of volatile oil due to
grinding was calculated with respect to the control sample (hand pounding) and the values
varied from 11.2 to 50.7% depending on feed rate and product temperature. Volatile oil
content also varied with both powder temperature and average particle size. Lower feed rate
gave a powder of finer particle size, higher powder temperatures but highest loss of volatile oil
whereas the high feed rate gave a powder of coarse particle size, low powder temperature but
lowest loss of volatile oil.
104

3)
4.2.2 Performance Study of Different Types of Mills of Various Capacities
Based on grinding trials (Section 4.2.1) in a particular size reduction unit at different feed
rates, and determining the temperature rise during grinding and loss of volatile oils in ground
samples, the second set of experiment was planned, to study the performance of different types of
commonly used grinding mills. The objective of this investigation was not only to confirm the
earlier results reported in Section 4.2.1, but also carry out further detailed studies on the
characteristics of grinding vis-a-vis volatile oil components in five commonly used grinding mills.
Black pepper seeds were ground in five different grinding mills VIZ., Swing hammer mill,
Hammer mill (APEX make), Plate (DIAF make) mill, Plate Mill, Roller Mill which are commonly
used for grinding of spices in India. These mills were of different capacities (Table 4.2.4) as it was
extremely difficult to obtain commercial mills of similar capacities. The results of the study are
discussed in the subsequent sections.
4.2.2.1 Particle Size of Powder
The geometric mean particle sizes of the ground powders were determined from the sieve
analysis technique using Eq. 3.1. Swing hammer mill and Hammer (APEX make) mill had the
provisions to introduce sieves to roughly control the particle size, whereas other mills did not have
the provisions to introduce any sieve. The geometric mean particle sizes obtained by grinding in
Swing hammer mill, Hammer (APEX) mill, Plate (DIAF) mill, Plate type, Roller mill and hand
pounding, were 0.20, 0.25, 0.38, 0.16, 0.50 and 0.63 mm, respectively (Table 4.2.4). The raw
material (black pepper) had a geometric mean particle diameter of about 5 mm. Fine particle « 0.2
mm) was obtained when ground in Plate mill, whereas coarse particles (> 0.5 mm) resulted by to
hand pounding (Table 4.2.4).
105

Table 4.2.4
Performance evaluation of commonly used grinding mills during ambient grinding of black pepper
(Ambient temperature = 30 C)
Parameters Type of Mill Swing Hammer Plate Plate Mill Roller Hand hammer (APEX) (DIAF) Mill pounding Mill Mill Mill ( control)
Capacity of 10 25 10 60 100 -*
mill (kg/hr)
Quantity of 5.0 5.0 5.0 10.0 5.0 0.1 material ground (kg)
Volatile oil 1.61 t 0.08 2.58 to.09 2.65 to.07 1.24 to. 10 2. 15tO.08 2.15 t 0.04 content # (mL/100g)
Product 52 43 47 68 30+ 30+ Temperature##
(C)
Moisture 11.0 10.6 11.2 8.6 11.6 10.0 content (%,
wet basis)
Particle size 0.20 0.25 0.38 0.16 0.50 0.63 (mm)**
* Not determined. # Moisture free basis ##
SD is less than 1 C **Geometric mean particle diameter +
+Indicates ambient temperature
4.2.2.2 Volatile oil Content of Powder
The volatile oil contents (moisture free basis) from Swing hammer mill, Hammer (Apex)
mill), Plate (DIAF) mill, Plate type and Roller mill from Swing hammer mill, Hammer (Apex)
mill), Plate (DIAF) mill, Plate type and Roller mill were 1.61,2.58,2.65, 1.24 and 2.15 rnL/100g,
respectively (Table 4.2.4). The results were comparable with those of the control sample obtained
by conventional hand-pounding (2.15 rnL/I00g).
106

Seeds ground in swing type hammer mill and Plate mill yielded powders having less volatile oil
content. This may be attributed to higher grinding temperature and finer particle size of powder.
On other hand Plate (DIAF) type and Hammer (APEX) type yielded powders having higher oil
contents than the control sample because of the low temperature attained during grinding in these
mills. Seeds ground in both Roller mill and hand pounding (control sample) yielded similar
quantities (2.15 mL/100g) of volatile oil. In these mills, despite having lower grinding
temperature (30 C), the volatile oil content was less than that of volatile oil obtained from Plate
(DIAF) mill and Hammer (APEX) mill. This may be due to coarser particle size of powder which
resulted in incomplete distillation of volatile oil (Vide Section 4.2.3.4 ). The temperatures of the
powders were 52, 43, 47, 68, 30 and 30 C, respectively in those selected six different systems at
stabilised grinding condition, while the ambient temperature was around 30 C. These results
indicated that the quality of ground powder in terms of volatile oil content depended on the type
of the mill employed for grinding. This indicates to the fact that appropriate mill is needed to have
a good quality spice powder.
4.2.2.3 Analysis of Volatile oil by Gas Chromatography
The gas chromatographic (GC) analysis of volatile oils is a method of separation and
identification of volatile compounds based on their retention time within gas chromatographic
column. Clevenger's method of distillation of volatile oil gives the total volatile oil content in the
powder sample, whereas the gas chromatography is a tool to identify the various constituents of
volatile oil for measuring the quality of the oil.
Hasselstrom et al. (1957), Uday Sankar (1989) and Pino et al. (1990) have reported the
constituents of black pepper oils obtained, by steam distillation and by supercritical carbon
dioxide extraction methods, respectively. Pepper oil constitutes mainly monoterpenes (70-80%),
sesqueterpenes (20-30%) and a small amount (less than 5%) of oxygenated compounds (Lewis et
al., 1969 and Govindarajan 1977). The compounds viz., α-thujene, α -pinene, sabinene, β-pinene,
1,8-cineole and limonene are the monoterpenes present in the volatile oils of black pepper,
whereas the sesqueterpenes are α-copaene, β-caryophyllene, β-bisabolene and caryophyllene oxide
(which is an oxygenated compound, and is also classified under sesqueterpenes). The chemical
107

formula, molecular weights and boiling points of the above compounds are shown in Table 2.2 of
Review of Literature. Monoterpenes are the lower molecular weight compounds (molecular
weights being 136 to 154), having lower boiling points as compared to the sequeterpenes
(molecular weights being 204 to 222).
Table 4.2.5
Gas chromatographic analysis of ground pepper samples using different mills (Relative concentrations are shown as percentages)
SI Mill type No Compounds Swing Hammer Plate Plate mill Roller mill Hand hammer (APEX) (OlAF) pounding type mill type mill type mill
I Thujene+α-pinene 6.01 7.60 8.69 2.80 7.04 8.97
2 Sabinene+ β-pinene 18.84 22.53 24.31 11.79 21.34 22.19
3 1,8-cineole+ 20.98 23.06 20.13 15.90 22.25 22.01 limonene
4 α-copaene 5.24 4.79 4.25 6.25 4.74 4.25
5 β- caryophyllene 8.93 5.33 3.39 10.65 4.58 8.74
6 β -bisabolene 9.61 7.63 5.23 11.l4 6.90 8.81
7 Caryophyllene oxide 8.55 10.18 9.14 12.24 9.86 5.49
8 Total 78.16 81.12 75.14 70.77 76.71 80.46
9 Monoterpenes 45.83 53.19 53.13 30.49 50.63 53.17
(1 to 3) 10 Sesquiterpenes 32.33 27.93 22.01 40.28 26.08 27.29
(4 to 7) II Ratio of 1.42 1.90 2.41 0.76 1.94 1.95
Monoterpenes to Sesquiterpenes
12 Monoterpenes (%)* 58.64 65.57 70.71 43.08 66.00 66.08
13 Sesquiterpenes (%)* 41.36 34.43 29.29 56.92 34.00 33.92
* Percent present in total oil
The ratio of monoterpenes to sesqueterpenes in the volatile oil is an important quality
attribute. Hubert (1991) observed that the ratio of monoterpenes to sesquiterpenes of more than
1.74 would give strong peppery note in oil. According to Salzer (1977), the
108

ratio of monoterpenes to sesquiterpenes represents the quality of the volatile oil and indicates
aroma value. Monoterpenes provide the odour and body to the volatile oil whereas the
sesquiterpenes provide the spicy note to the volatile oil. In other words, while the powder is fresh,
it contains more of monoterpenes in the volatile oil. Hence, it is desirable to have more
monoterpenes in the volatile oil.
The concentrations of black pepper volatile oil compounds obtained in the present study
are shown in Table 4.2.5. Pino et al. (1990) identified a total of 46 compounds (Table 2.1) present
in the volatile oil which included, trace elements. In present research, however, only nine major
volatile oil compounds were chosen and used for analysis. The quantity of monoterpenes viz., α-
thujene+α-pinene, sabinene+β-pinene, 1,8cineole+limonene, present in the volatile oil were
analysed by gas chromatography technique. The quantity of sesqueterpenes viz., α-copaene, β-
caryophyllene, β-bisabolene and caryophyllene oxide (an oxygenated compound), present in the
oil were also analysed by gas chromatography technique. The total relative percentage
concentrations of black pepper volatile compounds used in all the selected mills varied roughly
between 70% and 80% in the present study. Among the mills, Hammer mill (APEX), Plate (DIAF)
mill, Roller mill and hand pounding gave ratios of monoterpenes to sesqueterpenes as 1.90, 2.41,
1.94 and 1.95, respectively, which indicated that the volatile oils had a strong peppery note. The
oils obtained from samples ground in these mills had more concentrations of monoterpenes. The
oil obtained from Swing type hammer mill gave a ratio of monoterpenes to sesqueterpenes of the
order of 1.42, whereas that from Plate mill gave a least value of 0.76, which indicated that oil
obtained from these two mills had more concentration of sesqueterpenes. This might be due to
high volatility of monoterpene compounds at higher temperature, as grinding temperatures in
Swing type hammer mill and Plate mill were 52 C and 68 C, respectively. Table 4.2.6 shows the
vapour pressure and temperature data available for a few monterpene compounds of volatile oil
(Perry, 1950). It can be seen from Table 4.2.6 that if the vapour pressure of the compound was
reduced below atmospheric pressure then the boiling point of that particular compound also
reduced. During grinding, the high rotational speed of mill reduced the pressure in the grinding
zone to less than the atmospheric pressure (760 mm Hg). At this point, the boiling point of the
volatile oil compound came down depending on the pressure drop in the grinding zone (Table
4.2.6). If the temperature gradient (the
109

difference between the grinding temperature and boiling point) was reduced considerably then
there was an increase in mass transfer of that particular compound from powder to (the
surrounding atmosphere. The temperature gradient was much high in case of Swing type hammer
mill and Plate mill due to increased grinding temperature (52 and 68 C). Singh and Goswami
(l999b) have also observed loss of highly volatile components with low boiling points during
ambient grinding of cumin at a temperature of 85 C.
Figures 4.2.2 - 4.2.4 show the contents of, various compounds present in the distilled
volatile oil (expressed as mL/100g) as determined by combining Table 4.2.4 and Table 4.2.5. For
example, in case of Swing type hammer mill, the content of β-caryophyllene was calculated as
(8.93*1.61/100) = 0.14 mL/I00g. The total volatile oil (all the nine compounds) content was
calculated as (78.16*1.61/100) = 1.25 mL/100g; the content of monoterpenes as (45.83*
1.61/100)= 0.74 mL/100g; the content of sesqueterpenes as (32.33* 1.61/100)= 0.52 mL/ 100g.
Though the total volatile oil content was 1.61 mL/I00g (Table 4.2.5) in case of grinding in Swing
type hammer mill, the total of all nine major compounds of volatile oil was only 1.25 mL/100g.
The rest of volatile oil of about 0.36 mL/100g accounted for unidentified and trace compounds.
The above method of determining the volatile compounds in mL/100g was followed throughout
the present work.
Figure 4.2.2 shows the plot of total oil content, quantities of monoterpenes and
sesqueterpenes for different grinding mills. The content of monoterpenes was lowest in samples
ground in Swing type hammer mill and Plate mill. This was basically due to the fact that the
powder temperatures were high (52 and 68 C) and powder particles were too fine (0.20 and 0.16
mm) for these mills which had resulted in the loss of light and highly volatile components viz., the
monoterpenes (Pesek et al., 1985; Pesek and Wilson, 1986). On the other hand, the total content of
monoterpenes was dependent upon the type of mill. The maximum content of monoterpenes was
observed in the powder obtained by grinding in Hammer (APEX) mill and Plate (DIAF) mill
where the powder temperatures were slightly low (43 and 47 C) with powder particle size of 0.25
and 0.38 mm, respectively. The samples of Roller mill and by hand pounding did not yield highest
quantity of monoterpenes despite having a low powder temperatures (30C) as the powder particle
sizes were coarser viz., 0.50 and 0.63 mm respectively (this phenomenon was
110

Fig. 4.2.2.. Variation of total, monoterpene and sesqueterpenes contents in black pepper volatile oil obtained by different grinding mills
111
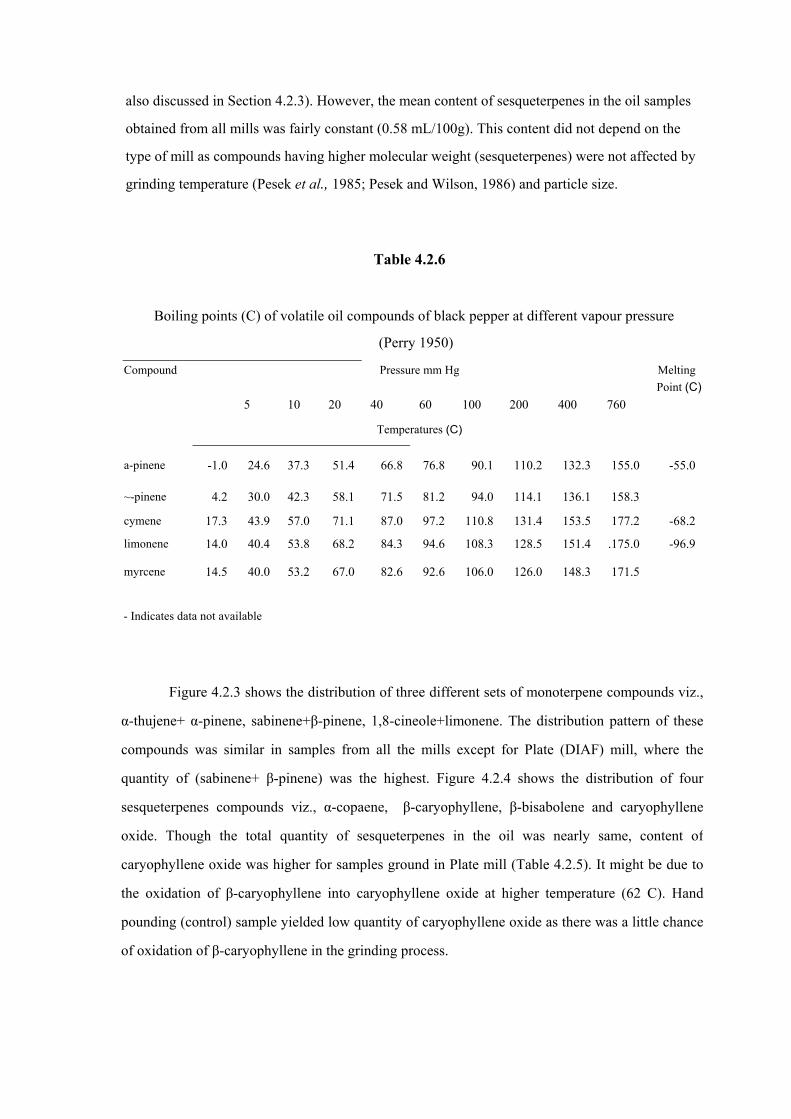
also discussed in Section 4.2.3). However, the mean content of sesqueterpenes in the oil samples
obtained from all mills was fairly constant (0.58 mL/100g). This content did not depend on the
type of mill as compounds having higher molecular weight (sesqueterpenes) were not affected by
grinding temperature (Pesek et al., 1985; Pesek and Wilson, 1986) and particle size.
Table 4.2.6
Boiling points (C) of volatile oil compounds of black pepper at different vapour pressure
(Perry 1950)
Compound Pressure mm Hg Melting Point (C) 5 10 20 40 60 100 200 400 760
Temperatures (C)
a-pinene -1.0 24.6 37.3 51.4 66.8 76.8 90.1 110.2 132.3 155.0 -55.0
~-pinene 4.2 30.0 42.3 58.1 71.5 81.2 94.0 114.1 136.1 158.3
cymene 17.3 43.9 57.0 71.1 87.0 97.2 110.8 131.4 153.5 177.2 -68.2
limonene 14.0 40.4 53.8 68.2 84.3 94.6 108.3 128.5 151.4 .175.0 -96.9
myrcene 14.5 40.0 53.2 67.0 82.6 92.6 106.0 126.0 148.3 171.5
- Indicates data not available
Figure 4.2.3 shows the distribution of three different sets of monoterpene compounds viz.,
α-thujene+ α-pinene, sabinene+β-pinene, 1,8-cineole+limonene. The distribution pattern of these
compounds was similar in samples from all the mills except for Plate (DIAF) mill, where the
quantity of (sabinene+ β-pinene) was the highest. Figure 4.2.4 shows the distribution of four
sesqueterpenes compounds viz., α-copaene, β-caryophyllene, β-bisabolene and caryophyllene
oxide. Though the total quantity of sesqueterpenes in the oil was nearly same, content of
caryophyllene oxide was higher for samples ground in Plate mill (Table 4.2.5). It might be due to
the oxidation of β-caryophyllene into caryophyllene oxide at higher temperature (62 C). Hand
pounding (control) sample yielded low quantity of caryophyllene oxide as there was a little chance
of oxidation of β-caryophyllene in the grinding process.

Fig. 4.2.3 Variations of lllonolcrpcncs constitucnls in black pepper volnlile oil obtained by difTerent grinding mills
A : Swing hammer mill D : Plate mill B : Hammer mill E : Roller mill C: Plate (DIAF) mill F: Hand pounding
fig. 4.2.4 Variation of sesqueterpenes constitutcnts in black pepper volatile oil obtained by different grinding mills

4.2.2.4 Conclusions
The following conclusions can be drawn based on the results reported in the present
section.
1) Among the mills employed for grinding, fine powder could be obtained using Plate mill, with
a geometric mean particle diameter of 0.16 mm.
2) The volatile oil contents (moisture free basis)· of samples ground in Swing type hammer mill,
Hammer (APEX) mill, Plate (D1AF) mill, Plate Mill, Roller mill and hand pounding were
1.61,2.58,2.65,1.24,2.15 and 2.15 mL/100g, respectively The corresponding product
temperatures were 52, 43, 47, 68, 30 and 30 C. These results indicated that the quality of
ground powder in terms of volatile oil content depended on a few factors such as the type of
the mill employed for grinding, the product temperature, and the average particle size of the
ground material.
3) The gas chromatographic (GC) analysis data of the volatile oil showed that grinding Hammer
(APEX) mill, Plate (DIAF) mill, Roller mill and hand pounding gave oil with high quantity of
monoterpenes. Monoterpenes were sensitive to grinding temperatures and their volatility
increased with an increase in grinding temperature. The overall content of sesqueterpenes in
the oil samples obtained from all the mills was fairly constant and it did not depend on the
type of mill.
114

4.2.3 Ambient Grinding Characteristics at Different Particle Sizes
Generally, spices are ground either for direct consumption as powder or for making value-
added products like essential or volatile oils or as oleoresins. Grinding facilitates the release of
aroma and flavour principles from the spices for mixing with food materials (Gopalkrishnan, et
al., 1991). During grinding, most of the energy input to the grinder is converted into heat, whereas
only a small portion is used for actual size reduction (Loncin and Merson, 1979). If the particle
size of powdered product is low (fine powder), enormous quantity of heat is generated within the
mill raising the temperature of the ground product to as high as 93 C (Wistreich and Schafer,
1962).
As observed in the previous sections, the grinding of black pepper at high temperatures and to low
particle sizes (fine powder) resulted in the higher loss of volatile oil. At the same time, it was
observed that even if the particle size obtained was high (coarse powder), the loss of volatile oil
was also high though the powder temperature was low. Energy laws for grinding indicates that to
obtain low particle size (fine powder), more grinding energy is required and grinding to' high
particle size (coarse powder) consumed less grinding energy. However, the low particle size (fine
powder) consumed less time in the distillation process for the extraction of volatile oil from the
powdered samples, while high particle size (coarse powder) consumed more time for distillation.
As volatile oils are critical components of spices, and spices are valued according to their volatile
oil content, a detailed investigation was undertaken to find the optimum mean particle size
(diameter) of powder at a point in which the loss of volatile oil would be minimum, and to study
the corresponding conditions of grinding energy and distillation times.
The black pepper samples were coded as POI, P02, PD3, PD4, PD5 and P06 for easy
identification and they were ground to different particle sizes as explained in Section 3.2.3
(Chapter 3, Materials and Methods). The powder obtained by grinding of sample PO 1 was the
coarsest particle size and that of sample P06 was the finest particle size. The other samples (P02,
P03, PD4 and PD5) were in the range from coarser to finer particle sizes; number increased with a
decrease in particle size. (Table 4.2.7). Separate grinding trials resulted in powdered samples of
different particle sizes viz., PD1 to PD6. For
115

Table 4.2.7
Grinding Characteristics of Black pepper by ambient grinding
Ambient Temperature = 30C Codes
for Samples
Mean particle
size (mm)
Moisture content (%, wb)
Mill’s discharge rate (g. min –1)
Product temperatu
re (C)
Maximum oil content (mL/100g)
Distillation on
time (h)
Grinding energy
(kJ.kg-1)
Fourier Number
F0
Diffusivity
Dx1011 (m2-s-1)
PD1 2.10 9.5 255 30 2.54±0.04 6.7 4.61 0.17 1.70 PD2 1.23 9.5 210 30 2.72±0.06 6.0 8.62 0.20 1.50 PD3 0.70 9.5 165 31 2.92±0.03 6.0 14.19 0.29 1.10 PD4 0.61 9.5 158 31 2.65±0.05 4.0 15.81 0.31 1.23 PD5 0.20 9.0 80 45 2.02±0.09 3.5 33.94 0.28 0.14 PD6 0.14 7.0 60 65 1.48±0.03 3.0 42.22 0.29 0.03

obtaining the different particles sizes of PD1 and PD2, the gap between the plates in the Plate
(DIAF) mill was varied, whereas in case of other samples viz., PD3 to PD6, the sieves of
different sizes were employed in the Swing hammer mill. The subsequent sections discuss the
results of this study.
4.2.3.1 Temperature Rise during Grinding
The product (powder) temperatures of the samples PD 1, PD2, PD3, PD4, PD5 and PD6
measured at the outlet of grinding mill, were 30, 30, 31, 31, 45 and 65 C, respectively, whereas
the feed material temperature was 30 C (ambient temperature) (Table 4.2.7). The ground products
obtained from samples PD5 and PD6 (fine samples) had temperature rise of 15 and 35 C,
respectively, whereas for the other samples, the rise in temperature was marginal. This was
expected as fine particles could be obtained only with enhanced level of energy input.
4.2.3.2 Particle Size of Powder
The average particle sizes of the powders were determined from the sieve analysis data
using equations (3.2) and (3.3) and are shown in the Table 4.2.8. The geometric mean diameters
were 2.10, 1.23,0.70,0.61,0.2 and 0.14 mm for ground samples PD1, PD2, PD3, PD4, PD5 and
PD6, respectively. The corresponding surface mean diameters of the above samples were 3.12,
2.52, 1.81, 1.50, 0.50 and 0.21 mm, respectively. The surface mean diameters of the powders
were- determined for the purpose of estimating the effective diffusion coefficient of the distillation
process (discussed later in Section 4.2.3.9).
4.2.3.3 Estimated Energy for Grinding
The grinding of spices is an energy intensive process. The energy needed for grinding of
solids is a function of surface area of particles produced. There are several energy laws for
grinding (Section 2.3.3 of Review of Literature) of which three of them viz., Kick's law,
Rittinger’s law and Bond's law are commonly used for estimation of energy for grinding.
However, Kick's law is best suited for small initial particle sizes
117

whereas Rittinger's law is best applicable for larger initial particle sizes. As the Bond's law is best
suited for medium particle sizes (which is true here), Bond's equation was plied for the estimation
of energy in the present study.
The estimated energy required for size reduction or grinding from an initial article size of 5 mm
(initial average size or diameter of a black pepper seeds) to different article sizes (PD1, PD2, PD3,
PD4, PD5 and PD6) using Bond's Eq. 3.4 is shown in Table 4.2.7. As expected, the highest
estimated energy (42.22 kJ kg-I) was consumed for 'obtaining fine powder (PD6) of geometric
mean particle size of 0.14 mm and lowest energy (4.61 kJ kg-I) was consumed for obtaining coarse
powder (PD1) having geometric mean particle size of 2.10 mm
, Table 4.2.8 Sieve analvsis data of ground black pepper powder to different particle sizes
S1 Mesh Mean sieve No. size Diameters Weight fractions (Wi ) of different samples
dm dg PD1 PD2 PD3 PD4 PD5 PD6
1 4/5 4.375 4.359 0.058 0.010 - - - -
2 5/10 3.000 2.828 0.683 0.231 0.044 0.012 0.003 - 3 10/20 1.425 1.304 0.157 0.582 0.438 0.392 0.016 - 4 20/30 0.725 0.714 0.020 0.017 0.092 0.096 0.167 - 5 30/40 0.513 0.505 0.032 0.048 0.130 0.144 0.209 -
6 40/60 0.338 0.326 0.026 0.034 0.098 0.120 0.088 0.057
7 60/80 0.215 0.212 0.010 0.052 0.055 0.097 0.108 0.084
8 80/100 0.165 0.164 0.016 0.024 0.066 0.054 0.1 04 0.218
9 100/120 0.138 0.137 - - 0.040 0.036 0.043 0.215
10 120/140 0.116 0.115 - - - - 0.106 0.160
11 140/200 0.091 0.089 - - - - 0.098 0.101
12 200/270 0.064 0.063 - - - - - 0.091
Geometric mean diameter 2.10 1.23 0.70 0.61 0.20 0.14
(Eq.3.2) Surface mean diameter (Eq.3.3) 3.12 2.52 1.81 1.50 0.50 0.21
dm arithmetic mean sieve diameter dg – geometric mean sieve diameter
118

Table 4.2.9 Cumulative volatile oil content of powdered samples obtained by Clevenger's distillation
at different time intervals
Distillation Volatile oil content of different samples Volatile oil content to the total volatile oil time (min) (mL/100g) different distillation time (%)
PDI * PD2 PD3 PD4 PD5 PD6 PD1 PD2 PD3 PD4 PD5 PD6
0 0 0 0 0 0 0 0.0 0.0 0.0 0.0 0.0 0.0
30 1.08 1.10 1.13 0.97 1.01 0.88 42.5 40.6 38.7 36.6 50.0 59.5
60 1.41 1.49 1.57 1.55 1.45 1.03 55.5 54.8 53.8 58.5 71.8 69.6
90 1.61 1.71 1.81 2.12 1.63 1.27 63.4 62.9 62.0 80.0 80.7 85.8
120 1.71 1.92 2.14 2.34 1.80 1.38 67.3 70.8 73.3 88.3 89.1 93.2
150 1.83 2.06 2.30 2.52 1.89 1.41 72.0 75.9 78.8 95.1 93.6 95.3
180 1.97 2.28 2.59 2.56 1.98 1.48 77.6 83.8 88.7 96.6 98.0 100.0
210 2.10 2.39 2.70 2.61 2.02 1.48 81.9 87.9 92.5 98.5 100.0 -
240 2.17 2.45 2.72 2.65 2.02 - 85.4 89.9 93.2 100.0 - -
270 2.23 2.49 2.76 2.65 - - 87.8 91.7 94.5 - - -
300 2.41 2.62 2.83 - - - 94.9 96.3 96.9 - - -
330 2.48 2.67 2.87 - - - 97.6 98.3 98.3 - - -
360 2.52 2.72 2.92 - - - 99.2 100.0 100.0 - - -
390 2.54 - - - - - 100.0 - - - - -
4.2.3.4 Volatile oil Content of Powder
The content of volatile oil or the yield of volatile oil distilled using Clevenger's apparatus
at an intervals 30 min was determined to know the quality of ground spice samples. The
cumulative contents of volatile oils for different samples (PDl, PD2, PD3, PD4, PD5 and PD6) are
given in Table 4.2.9. Figure. 4.2.5 (a and b) shows the plot of volatile oil contents versus the
distillation times for the different particle sizes of samples (PDl, PD2, PD3, PD4, PD5 and PD6).
Table 4.2.7 shows the maximum volatile oil contents of powders ground to different particle sizes.
The volatile oil contents of samples PDl, PD2 and PD3 were 2.54, 2.72 and 2.92 mL/100g,
respectively. The volatile oil contents of samples P04, PD5 and PD6 are 2.65, 2.02 and 1.48
mL/100g, respectively. Figure 4.2.5 (a) shows that quantity of volatile oil released increased
asymptotically with
119

Fig. 4.2.5 Volatile oil yield versus distillation time at different particle sizes of black pepper powder (a) For samples of POI, P02 and P03 (b) For samples of
PD4, PD5 and PD6 .
120

the distillation time for all the three samples of PD1, PD2 and PD3, indicating that the complete
volatile oils present in these powdered samples were not removed in the distillation process as the
curves were not flattened even at the end of 350 minutes. On the other hand, Fig. 4.2.5 (b) shows
that as the entire quantity of oil present in the powdered samples (PD4, PD5 and PD6) was
distilled, as the curves flattened at the end of distillation process. This meant that there was a
definite loss in the volatile oil content due to grinding in case of samples PD4, PD5 and PD6
(finer powders) as these samples yielded less volatile oil when compared with the content of
volatile oil of sample PD3. The lowest content of volatile oil was found to be in PD6, which had a
very fine geometric mean particle diameter of only 0.14mm. There results indicate that particles
with low average mean diameter possess low quantity of volatile oil.
4.2.3.5 Distillation Time
The distillation time for distillation of volatile oil from the samples changes due to the particle size
of the powder (Table 4.2.9). The time for the complete distillation of volatile oil samples of PD1,
PD2, PD3, PD4, PD5 and PD6 were 390,360,360,240,210 and 180 min, respectively. Table 4.2.9
shows that the content of volatile oil was about 40% of the total volatile oil in first 30 min of
distillation for samples of PD1, PD2, PD3 and PD4, whereas the contents were 50 and 60% in case
of P05 and PD6, respectively. The mean volatile oil content at the end of 90 min of distillation
time was about 63% for samples of PD1, PD2, PD3, and about 80 to 86% in case of PD4, PD5 and
P06. It indicated that if coarser were the particles slower was the rate of volatile oil distillation but
finer the particles faster was the distillation of volatile oil. This might be because, if coarser were
the particle size, the resistance offered by the particle for the movement of volatile oil from the
core of the particle to the surface was higher and hence the mass transfer was slower. In the case of
finer particle size, however, this resistance was relatively low, and hence, the mass transfer was
faster, thereby reducing the distillation time. It was thus concluded that distillation time of the
particles depended on the mean diameter of the powder particles.
121

4.2.3.6 Optimization of Particle Size
The foregoing discussions indicated that during ambient grinding of spices, very fine
particle sizes had yielded less of volatile oil due to the volatile oil loss during grinding. On the
other hand, if the powder was coarse, volatile content was also less as the complete volatile oil
present in the powder was not released easily during distillation. Hence, there might exist a
particle size between coarse and fine which could offer the highest content of volatile oil. The
present section thus deals with finding of the best particle size of black pepper suitable for
commercial purpose.
The optimal particle size of the powder is defined as the geometric mean particle diameter
at which percentage recovery of volatile oil is maximum or the loss of volatile oil is minimum.
Figure 4.2.6 shows the plot of volatile oil loss, distillation time and input energy for grinding
versus geometric mean particle (dga) diameter. The loss of volatile oil was minimum at geometric
mean particle diameter (size) of about 0.7 mm. If the particle size was less than 0.7 mm, the loss of
oil was more (due to high temperature during grinding and due to enhanced surface area of the
particles exposed to the atmosphere during grinding), the energy for size reduction was also high,
though the distillation time was less. On the other hand, if the particle size was more than 0.7 mm,
the content of oil was less as the oil present in the powder could not be completely distilled even
after 6 hours of extraction, though the energy required for size reduction reduced. Hence, the
particle size of about 0.7 mm (US 25 mesh) can be taken as optimum (Fig. 4.2.6) and the
corresponding grinding energy and distillation time were 14.19 kJ kg-1 and 6 hours, respectively.
Gopalkrishnan et al. (1991) reported that the volatile oil content IS maximum for particles obtained
with sieve size of 0.75 mm in case of grinding of cardamom.
This optimal particle size (about 0.7 mm) would be of commercial importance in the large
scale industrial grinding operations where black pepper is ground for the production of volatile oil
by distillation process.
122

Fig. 4.2.6 Optimization of parameters in grinding of black pepper

4.2.3.7 Physical Properties of Volatile oil
The properties of volatile oil of black pepper samples were determined in order to
determine the quality of ground samples (PD1, PD2, PD3, PD4, PD5 and PD6). The physical
properties of volatile oil measured were specific gravity, refractive index and optical rotation
(Table 4.2.10). No significant changes (p ≤0.05) in the physical properties of oils at different
particle sizes were observed. The average values of specific gravity, refractive index and optical
rotation of oils were 0.94, 1.49 and -2.40°, respectively. The values indicated that these properties
could not be used to differentiate the quality of ground black pepper. In other words, it indicates
that in range of particle sizes studied, these selected physical properties of volatile oil remains
unaltered.
Table 4.2.10
Physical properties of volatile oils of black pepper ground to different particle sizes in
various mills.
Plate Mill Hammer mill
Sample POI P02 P03 P04 P05 P06
Particle
Diameter (mm) 2.08 1.23 0.70 0.61 0.20 0.14
Grinding
temperature (C ) 30 30 31 31 45 65
Volatile oil 2.54 ± 0.04 2.72 ± 0.06 2.92 ± 0.03 2.65 ± 0.05 2.02 ± 0.09 content
1.48 ± 0.03
(mL/100g)
Specific gravity 0.930 0.932 0.941 0.954 0.905 0.942
Refractive index 1.495 1.492 1.487 1.488 1.485 1.490
Optical rotation( degree)
-2.381 -2.340 -2.396. -2.360 -2.495 -2.393
124

4.2.3.8 Analysis of Volatile oil by Gas Chromatography
The gas chromatographic analysis of volatile spice oils is a method of separation of
volatile compounds based on their retention time within gas chromatographic column. Clevenger's
method of volatile oil distillation gives the total volatile oil content in the powdered sample,
whereas the gas chromatographic analysis is a tool to identify the various constituents of volatile
oil for measuring the quality of the oil. As mentioned in earlier sections, volatile oil constitutes
mainly of monoterpenes (70-80%), sesqueterpenes (20-30%) and small amount (less than 5%) of
oxygenated compounds.
The Gas Chromatographic-Mass Spectra (GC-MS) analysis of one of the samples of
volatile oil (Fig. 4.2.7) was done to identify these components. Based on the retention time, Kovats
indices (Jennings and Shibamato, 1980; Davies, 1990) and also matching with the reference mass
spectra (Adams, 1989) or by co-injection on GC, nine major compounds were identified (Table
4.2.11). These were taken as markers to study the flavour quality of the oil. These nine compounds
constituted 79 to 90% of the total volatile oil (Table 4.2.12). The absolute recovery data with
respect to each component in volatile oil are shown in Fig 4.2.8 and 4.2.9.
The quantities of monoterpenes (Fig. 4.2.8 and 4.2.10) viz., α-thujene, α -pinene, sabinene,
β-pinene and limonene, present in the volatile oil was higher in large and medium sizes of particle.
The quantity of monoterpene reached maximum when the particle size was 0.70 mm. At a higher
particle size (2.10 mm), the release of monoterpenes was incomplete. At lower particle sizes (0.14
and 0.20 mm), less quantities of monoterpenes indicated that the loss was due to higher
temperatures (45 to 65 C) during grinding.
125

Table 4.2.11
Identification of flavour compounds in volatile oil of black pepper by GC-MS analysis
Compounds Peak No.** Retention time Refractive Method of (Min) index identification * * *
α-Thujene* - - Co-GC
α-Pinene A 3.767 942 RI, GC, MS Sabinene* - - - Co-GC
β-Pinene B 4.867 982 RI, GC, MS
Limonene C 6.633 1033 RI, GC, MS α-Copaene 0 24.300 1368 RI,MS
β-Caryophyllene E 26.700 1428 RI, MS, Co-GC
β-Bisabolene F 32.567 1505 RI,MS
Caryophyllene oxide G 35.383 1582 RI,MS
* Identified by co-injection in gas chromatography ** Please see Fig.4.2.7 for details of GC peaks *** GC means Gas Chromatography, Co-GC means co-injection of GC,
RI means refractive index, MS means mass spectrography
The quantities of sesquiterpene (Fig. 4.2.9 and Fig. 4.2.10) viz., α-copaene, β-
caryophyllene, β-bisabolene and caryophyllene oxide, present in the oil were maximum at the
particle size of 0.14 mm. At higher particle sizes, the release of sesquiterpenes was incomplete
(Table 4.2.12). The amount of oxygenated compound (major compound: caryophyllene oxide
identified from its mass spectrum and Kovats index value) present in volatile oil at various particle
sizes varied from 0.20 to 0.26 mL/100g. In the present study, no noticiable change was observed
except its complete disappearance in. the volatile oil obtained from the powder of particle size 0.2
mm, probably due to its conversion to β-caryophyllene during processing as observed by a rise in
its quantity.
126

Fig. 4.2.7 GC-MS analysis of volatile oil for identifying constituents
127

Table 4.2.12
Gas chromatographic analysis data of volatile oil samples of black pepper ground to
different particle sizes (% concentrations)
Compounds Samples of black PD1 PD2 PD3 PD4 PD5 PD6
1. α-Thujene 0.72 1.72 2.00 1.12 1.44 0.41
2. α-Pinene 3.38 5.57 8.58 4.59 4.87 1.65
3. Sabinene 16.68 19.52 24.47 17.23 15.19 7.80
4. β-Pinene 10.53 11.53 14.42 10.63 12.45 5.53 5. Limonene 26.17 24.20 23.31 22.70 23.82 15.62 6. α-Copaene 4.19 3.50 3.55 4.46 5.96 9.30 7. β-Caryophyllene 1.82 1.64 1.58 2.09 15.94 9.44 8. β-Bisabolene 6'(l9 5.67 4.35 7.21 10.13 14.20 9.Caryophyllene 9.58 8.73 6.82 9.88 0.00 17.22 Total 79.16 82.10 89.08 79.91 89.80 81.17 Monoterpenes (%) 57.48 62.54 72.78 56.27 57.77 31.01 Sesqui terpenes (%) 21.68 19.54 16.30 23.64 32.03 50.16 Ratio of To Sesquiterpenes 2.65 3.20 4.47 2.38 1.80 0.62
.. ,* Particle sizes of, PD1, PD2, PD3, PD4, PD5 and PD6 are 2.10, 1.23, 0.70, 0.61,
0.20 and 0.14 mm, respectively
Hubert (1991) observed that the ratio of monoterpenes to sesquiterpenes more than 1.74
would give strong peppery note to oil. Table 4.2.12, shows that the ratio was greater than 1.74 for
oils obtained from particles sizes greater than 0.2 mm, for maximum amount of volatile oil with
overall flavour quality. According to Salzer (1977), good amounts of monoterpenes for odour and
the body, moderate amounts of sesquiterpenes for spicy note and reasonable amounts of
oxygenated compounds should be present in the oil. Accordingly, the particle sizes of 0.6 to 0.7
mm were preferred. If large amounts of sesquiterpenes in the volatile oil are required, the particle
sizes of 0.20 and 0.14 mm may be preferred which gives sweet and flowery notes (Lewis et al., 1969). The variation in the content of sesqueterpenes was not significant (in the range of 0.48 to
0.74 mL/100g) as compared to the contents of monoterpenes which varied from 0.46 to 2.13 mL/
100g.
128

Fig. 4.2.8 Variations of monoterpenes constituents in black pepper volatile oil ground to different particle sizes
rig. 4.2.9 Variations of sesqueterpenes constitucnts in black pepper volatile oil ground to different particle sizes
129

Fig. 4.2.10 Variations of total, monoterpene and sesqueterpenes content in pepper volatile oil ground to different particle sizes
130

Typical gas chromatographs of PD1 (2.1 0 mm) and PD6 (0.14 mm) are indicated in Fig.
4.2.11 (a) and (b), respectively for comparison of distribution pattern of gas chromatographic
peaks in both particle sizes. These graphs indicated that at higher particle sizes (2.10 mm) the
contents of monoterpenes (viz., peak numbers 1 to 5) in the volatile oil were higher whereas the
contents of sesqueterpenes (viz., peak numbers 6 to 9) were lower. In the case of lower or finer
particle sizes (0.14 mm) the contents of sesqueterpenes were relatively higher. This meant that at
finer particle sizes, the loss of monoterpenes could be higher due to higher product temperatures.
4.2.3.9 Effective Diffusion Coefficient
Distillation of volatile oil involves removal of volatile oil present in the powdered black
pepper samples using Clevenger's apparatus (Section 3.2.3.2 of Materials and Methods). The
quantity of volatile oil content per unit distillation time is a function of particle size, as has been
mentioned in the earlier sections. If the particle size is very fine then the content of volatile oil is
less due to the volatile oil loss during grinding. On the hand, if the particle size of the powder is
coarse then volatile oil content is also less as the complete volatile oil present in the powder is not
released during distillation. In this section, this phenomenon was analysed employing the diffusion
theory (mentioned in Section 3.2.3.5) by determining the effective diffusion coefficients for
different particle sizes of samples namely PDI, PD2, PD3, PD4, PD5 and PD6.
The volatile oil from the black pepper powder was distilled using Clevenger's apparatus.
When the mixture of black pepper powder and water system was heated, the volatile oil
constituents of the powder were be diffusing into water at 100 C during the distillation process. As
there was sufficient agitation of powder-water mixture system due to buoyant forces while boiling
in the apparatus, the surface resistance became small. Therefore, it was assumed that the total
resistance was due to only internal resistance, and the phenomenon was analysed using diffusion
theory employing Pick's second law (Eq.3.8). The powdered particles were assumed to be
spherical in shape and surface mean particle diameters were used in determining the effective
diffusion coefficients.
131

Fig. 4.2.11GC Profiles of black pepper volatile oil (a) at particle size of 2.10 mm and (b) at particle size of 0.14mm
132

The effective diffusion coefficient of the samples was calculated using Eq. 3.10, from the
plots of In M1 versus distillation time t, employing linear regression technique. However, the
significance of the intercepts was overlooked (Spiro and Hunter, 1985). The initial oil content Mr
in case of PD1, PD2 and PD3 was taken as 3.07 ml/100g (assuming 95% distillation efficiency of
sample PD3). In the case of PD4, PD5 and P06 the initial oil contents were 2.80, 2.13 and 1.56
ml/100g, assuming 95% distillation to give their maximum yield. The weighed surface mean
particle radius was determined using Eq. (3.3) for the calculation of effective diffusion
coefficient.
The experimental data fitted well with the Eq. 3.6, as evidenced by high correlation
coefficients (0.96 to 0.99) and the plots are shown in Figs 4.2. 12(a & b). The values of effective
diffusion coefficients are shown in Table 4.2.7. The values of diffusion coefficients for coarser
particle samples PD1, PD2, PD3 and PD4 were of the same magnitude (1.7 x 10,11, 1.5 X 10,11,
1.1 X 10,11 and 1.2 x 10,11 m2 s-1, respectively) with an average of 1.38 x 10'11 m2 s-1. Gekas
(1992) reported a value of diffusion coefficient to be 1.08 x l0-11 m2 s-1 for the extraction of oil
from soybean flakes (0.43 mm thick) using hexane as solvent. Thus, the values of diffusion
coefficients obtained in the present study compared well with literature values for coarser particles
of higher oil concentrations. For finer powders (PD5 and PD6), the values were very low, 0.14 x
10,11 and 0.03 x 10,11 m2 s-1, respectively, which might be attributed to low initial oil
concentrations in these samples. The latter was in accordance with the observations made by
Aguerre et al., (1985) that the diffusion coefficients were not constant for drying and leaching
operations at low concentrations.
4.2.3.10 Fourier Number
The Fourier number (Fo ) was determined employing Eq. 3.9 which contains a range of
values for n that can vary from unity to infinity. The values of effective diffusion coefficients were
determined assuming n value as unity for simplification. To check whether this assumption was
correct, the Fourier number (Fo= De tlrs2) was determined using effective diffusion coefficients
(De), obtained from the experimental data using distillation time (t) and surface mean radius of the
powder. The values of Fourier numbers for powdered samples of PD1, PD2, PD3, PD4, PD5 and
PD6 thus determined were 0.17,
133

Fig. 4.2.12 Ln (Ml) versus distillation time at different particle sizes of black pepper powder
(a) For samples of PD1, PD2 and PD3 (b) For samples of PD4, PD5 and PD6
134

0.20, 0.29, 0.31, 0.28, and 0.29, respectively. It has been reported (McCabe and Smith, 1976;
Aguerre et al., 1985) that if the Fourier number thus obtained is greater than 0.1 then the
assumption of n=l in Eq. 3.9 is justified. It was observed in the present study that the Fourier
numbers (Table 4.2.7) for all the particle sizes were greater than 0.1, which justified for
considering only the first term (n=l) in Eq. 3.9, ignoring the higher order terms.
4.2.3.11 Conclusions
The study on ambient grinding characteristics has led to the following conclusions:
1) The particle size of powdered sample determined using sieve analysis varied from coarse to
fine. The powdered sample of PD1, PD2, PD3, PD4, PD5 and PD6 had geometric mean
particle diameters of 2.10, 1.23, 0.70, 0.61, 0.20 and 0.14 mm, respectively. The finer the
particle size of powder the higher was the temperature of ground powder measured at the
mill's outlet at steady condition, and obviously the finer the particle size the higher was the
energy expenditure.
2) The time for volatile oil distillation of coarse to fine powdered samples varied from 390 to
180 min, respectively indicating that the finer were the powder particles the faster was the
distillation.
3) The volatile oil content of samples of PD1, PD2, PD3, PD4, PD5 and PD6 at the end of
distillation were 2.54,2.72,2.92, 2.65,2.02 and 1.48 mL/100g, respectively. The lowest volatile
oil content was observed with fine particles. The particle mean diameter of 0.7 mm was found
to be the optimum particle size which gave the desirable highest volatile oil content.
4) The physical properties of volatile oil viz., specific gravity, refractive index and optical
rotation did not change in the range of experimental particle sizes.
5) The study on quality of oil using gas chromatographic analysis showed that higher ratio of
monoterpenes to sesqueterpenes was present in coarse particles (> 0.2 mm),
135

and gave a very strong peppery note. Powdered particle sizes lesser than 0.2 mm contained
more quantity of volatile oil that gave spicy, sweet and flowery notes. The content of
sesqueterpenes varied marginally (0.5 to 0.7 mL/100g) as compared to the content of
monoterpenes, which varied between 0.5 and 2.1 mL/100g for the range of particle sizes
studied.
6. The effective diffusion coefficients (determined using Fick's second law) were fairly
constant (1.38 x 10⁻¹¹ m2 S-I) for powdered samples of POI, P02, P03 and P04 having
higher initial oil concentrations. These were low for powdered samples of P05 and
PD6 having lower initial oil concentration. The Fourier numbers determined for all the
powered samples were greater than 0.1.
136

4.3 Cryogenic Size-Reduction or Cryogenic Grinding of Black Pepper
The aim of spice grinding was to obtain powder of smaller particle sizes with good quality
in terms of aroma and flavour. In the ambient grinding process, heat is generated when energy is
used to fracture a particle into smaller sizes. This generated heat IS detrimental to the finished
product, as it rises the temperature to as high as 93 C (Wistreich and Schafer 1962), and it may
result in considerable loss of aroma and flavour components, resulting in deterioration of quality.
The loss of volatile oil (aroma and flavour) can be significantly reduced by a cryogenic grinding
technique (Pruthi, 1980). Liquid nitrogen at -195.6 C provides the refrigeration needed to pre-cool
the spices and maintain the desired low temperature by not allowing the heat (generated during
grinding operation) to increase the temperature of product. In addition to maintaining the low
temperature, vapourisation of liquid nitrogen to the gaseous state, in effect, creates an inert and dry
atmosphere for additional protection of spice quality. Pre-cooling of raw spice and continuous low
temperature maintained within the mill reduce the losses of volatile oils and moisture contents,
thereby retaining most of the flavour strength per unit mass of spice (Singh and Goswami, 1999a).
As quantitative data on cryogenic grinding of Indian spices are scarce, this experiment was planned
to study the grinding characteristics of black pepper employing the system of cryogenic grinding
and to compare it with the conventionally followed ambient grinding method, both in laboratory
scale (150 to 200 g) and at pilot scale (4 kg) grinding operations.
4.3.1 Evaluation of Cooling, Chilling and Cryogenic Freezing Methods for Grinding
A comparison of different cooling systems including cryogenic freezing is a prerequisite
to know the advantages or limitations of these systems. Low temperature of the spice before
grinding can be attained by different methods. The present section deals with four such methods
for obtaining low temperature of feed spice prior and after grinding employing domestic mixer
grinder (Fig. 3.4), using identical grinding conditions.
137

Table 4.3.1
Temperature of feed and products obtained by different methods of cooling
Sample Method of cooling* Temperature of black pepper (C)
Code Before grinding After grinding
CAI Cold room 13 ± 1 49 ± I
CA2 Plate Freezer -11 ± 1 40±4
CA3 LN2 indirect mixing -38 ± 3 41 ± 2
CA4 LN2 direct mixing -195.6 -32 ± 3
CA5 Ambient 30± 0 61 ± 1
* Details of grinding systems employed are shown in Fig. 3.5 of chapd.er 3.
The following four cooling or chilling or freezing methods were employed. They were:
(1) cooling black pepper in a cold room, (2) chilling black pepper using a plate freezer, (3)
freezing by dipping black pepper enclosed in a polyethylene pouch in liquid nitrogen and (4)
freezing black pepper by directly injecting liquid nitrogen into a known quantity of the spice.
These methods of cooling or chilling or freezing are represented by schematic diagrams as shown
in Fig. 3.5. The product temperatures were measured immediately after grinding. As expected, the
lowest temperature of the product was obtained by directly mixing liquid nitrogen with black
'pepper sample (Table 4.3.1). This was because the heat transfer rate was higher in case of direct
mixing of liquid nitrogen with black pepper as small droplets evaporated quickly by absorbing the
latent heat of vapourisation from the sample. In other freezing methods, polyethylene cover acted
as a barrier (insulating effect) for heat transfer between the spice and liquid nitrogen, and reduced
the rate of heat transfer and hence, spice did not attain such a low temperature.
It was observed, from preliminary laboratory experimentation, that among the different
methods of freezing (viz., cooling, chilling and cryogenic freezing) the cryogenic freezing method
with liquid nitrogen, by direct injection into black pepper, was
138

the most efficient method of freezing and reaching extremely low temperature of spice and
spice powder. These results are used in subsequent sections and detailed grinding studies were
conducted.
4.3.2 Evaluation of Cryogenic Grinding and Volatile oil Content of Black Pepper on a
Laboratory Set-up
A comparison of cryogenic and ambient grinding was needed to judge the quality of the
ground samples. Hence, the objective of this study was to compare the two grinding methods viz.,
cryogenic grinding and ambient grinding. Black pepper samples were ground using domestic
mixer-cum-grinder under both cryogenic and ambient grinding conditions keeping other grinding
parameters constant. Temperatures of the spice before and after grinding were recorded in both the
cases (Table 4.3.2). These temperatures were -195.6 and -54.3 C, respectively for cryogenic
conditions whereas for ambient grinding these temperatures were 28 and 36 C, respectively. The
cryogenic condition yielded markedly higher volatile oil (3.18 mL/100g) as compared to ambient
sample (2.85 mL/100g).
Table: 4.3.2
Cryogenic (LN2) grinding and content of volatile 'oil of black pepper as compared to ambient grinding in laboratory scale
Samples Temperature of black pepper (C) Content of volatile oil Before grinding After grinding (mL/100g)
Cryogenic grinding -195.6 -54.3 ± 8 3.18 ± 0.03
Ambient grinding +28 ± 0 +36.0 ± 2 2.85 ± 0.07
It was concluded from this laboratory scale experiment that cryogenic grinding could
yield about 12% higher quantity of volatile oil from black pepper as compared to that of ambient
grinding.
139

4.3.3 Effect of Cryogenic, Chilled, Ambient and High Temperature Grinding
Methods on Grinding Characteristics in Laboratory Scale
During the ambient grinding of black pepper, the mill and product temperature might rise
to as high as 93 C, and at such high temperature, there will be considerable loss of volatile oil
(Wistreich and Schafer, 1962). Section 4.2 also supported this finding that at a high grinding
temperature, the loss of volatile oil was considerably high. Cryogenic grinding could overcomes
this problem and help in retaining more volatile oils (Section 4.3.2 in the present study, Pruthi
1980 and 1991). It has been reported (Anon, 1993) by a grinding equipment manufacturer
(Hosakawa Alpine, 'Germany) that cryogenic grinding increased total volatile oil by 40% (Table
2.9). Mckee et al. (1993) compared three grinding methods viz., ambient, chilled and liquid
nitrogen with ground material temperatures of 40, 38 and 33 C, respectively and observed
marginal variation in the volatile oil content.
The present section thus deals with studies on the effect of temperature on grinding
characteristics of black pepper. The four grinding methods (as described in Section 3.3.3) were the
powder samples of black pepper obtained by employing cryogenic, chilled, ambient and high
temperature grinding methods. The temperatures of raw materials prior to grinding were
maintained at -120, 10,24 and 40 C, respectively. The parameters determined for comparison were
particle size, temperature rise, and quantity and quality of volatile oil. These parameters were
selected considering the commercial importance of quality of ground spice.
4.3.3.1 Particle Size of Powder
Fineness of the powder is an index for quality of ground spice. It was measured in terms of
quantity of powder by weight which passed through a 60 mesh sieve (US sieve) having aperture
opening of 0.42 mm (Table 4.3.3). Fineness of powder was found to be greater (72.2 %) in case of
LN2 cooled samples. At cryogenic conditions, the material became brittle and crisp (Pruthi, 1991)
making size reduction easy by shattering technique instead of tearing. At high temperature
conditions, the fineness was the lowest (62.5%), and at chilled water and ambient grinding
conditions, the values were 52.5 and
140
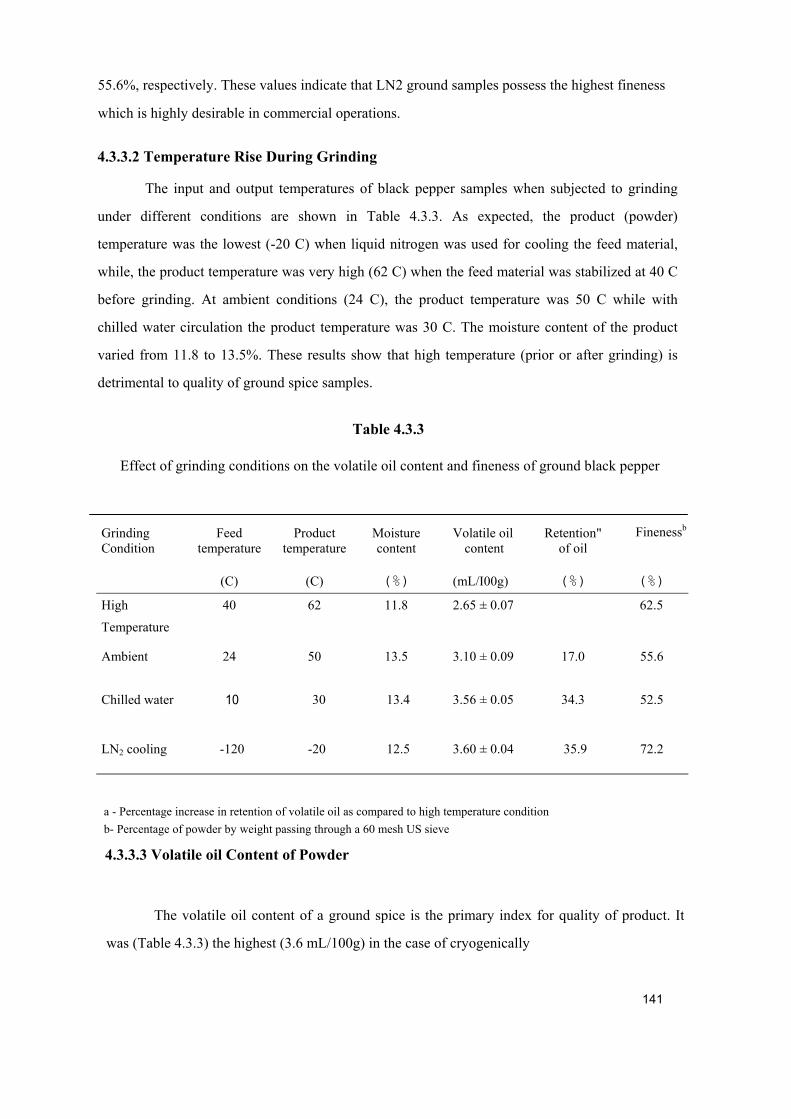
55.6%, respectively. These values indicate that LN2 ground samples possess the highest fineness
which is highly desirable in commercial operations.
4.3.3.2 Temperature Rise During Grinding
The input and output temperatures of black pepper samples when subjected to grinding
under different conditions are shown in Table 4.3.3. As expected, the product (powder)
temperature was the lowest (-20 C) when liquid nitrogen was used for cooling the feed material,
while, the product temperature was very high (62 C) when the feed material was stabilized at 40 C
before grinding. At ambient conditions (24 C), the product temperature was 50 C while with
chilled water circulation the product temperature was 30 C. The moisture content of the product
varied from 11.8 to 13.5%. These results show that high temperature (prior or after grinding) is
detrimental to quality of ground spice samples.
Table 4.3.3
Effect of grinding conditions on the volatile oil content and fineness of ground black pepper
Finenessb Grinding Condition
Feed temperature
Product temperature
Moisture content
Volatile oil content
Retention" of oil
(C) (C) (%) (mL/I00g) (%) (%)
High 40 62 11.8 2.65 ± 0.07 62.5
Temperature
Ambient 24 50 13.5 3.10 ± 0.09 17.0 55.6
Chilled water 10 30 13.4 3.56 ± 0.05 34.3 52.5
LN2 cooling -120 -20 12.5 3.60 ± 0.04 35.9 72.2
a - Percentage increase in retention of volatile oil as compared to high temperature condition b- Percentage of powder by weight passing through a 60 mesh US sieve
4.3.3.3 Volatile oil Content of Powder
The volatile oil content of a ground spice is the primary index for quality of product. It
was (Table 4.3.3) the highest (3.6 mL/100g) in the case of cryogenically
141

(liquid nitrogen) frozen-ground sample and was least (2.65 mL/100g) at the high product
temperature of 62 C. The volatile oil content in chilled pepper sample and in liquid nitrogen frozen
samples were close (3.56 and 3.6 mL/100g, respectively) and were not significantly different (p <
0.01). The use of liquid nitrogen in grinding had not only increased the content of volatile oils
(about 36% more as compared to high temperature method) but also improved the fineness of the
product. In Industrial scale of applications where the highest temperature of powder can reach as
high as 93 C, the content of volatile oils may even be higher with the application of liquid
nitrogen. The chilled water circulation would also retain same quantity of volatile oils, as it
happened in the case of liquid nitrogen method. But, chilled water technique was not sufficient to
significantly reduce the temperature rise of the product (Singh and Goswami, 1999a). Also the
particle size is also high. The direct mixing of liquid nitrogen and spices could efficiently cool
(due to enhanced heat transfer rate) the spice rather than indirect cooling using chilled water
technique in large scale grinding operations. It was thus, inferred that liquid nitrogen was an
efficient cooling system (and also to obtain fine particles) as compared to other existing methods
of grinding mentioned in this study.
Table 4.3.4
GC analysis data of black pepper oil samples obtained under different grinding conditions (Values
are expressed on relative percent basis) .
Component Grinding methods High Ambient Chilled LN2 frozen temperature water
1. α-pinene 5.05 5.60 6.65 7.00
2. β-pinene 13.52 14.36 15.12 15.68
3. Myrcene 21.20 19.5Q 20.45 23.20 4. Limonene 22.80 22.18 22.90 23.80
5. β-caryophyllene 21.20 20.20 19.75 17.65 Total 83.77 81.84 84.87 87.33 Monoterpenes (%) (1-4) 62.57 61. 64 65.12 69.70 Sesqueterpenes (%) (5) 21.20 20.20 19.75 17.65 Ratio of monoterpenes to 3.00 3.10 3.30 3.90 Sesqueterpenes
142

4.3.3.4 Analysis of Volatile oil by Gas Chromatography
Chemical composition of the black pepper oil has been reported (Lewis et al., 1969 and Govindrajan,
1977). Pepper oil is mainly made up of monoterpenes (70-80%), and sesqueterpene (20-30%), and a
small amount (less than 5%) of oxygenated compounds is also present. The major monoterpenes
present in the oil are α- pinene, β-pinene, myrcene, limonene and sabinene while β-caryophyllene is
the chief sesqueterpene (the presence of myrcene, a monoterpene component was also observed in
this variety of black pepper). The gas chromatographic analysis of the four oil samples obtained
under different grinding (high temperature, ambient, chilled water and liquid nitrogen frozen)
conditions and the relative percentage of some the main constituents of oil are presented in Table
4.3.4. Better retention of monoterpenes (α-pinene, β-pinene, myrcene, limonene) was observed in the
case of chilled water and LN2 cooled grinding (10 and -120 C) as compared to ambient and high
temperature (24 and 40 C) ground conditions of grinding. The ratio of monoterpenes to
sequeterpenes varied from 3.0 to 3.9 which indicated that all the four samples yielded volatile oil
with a strong peppery note (Hubert, 1991). Figure 4.3.1 shows the variation of constituent
compounds of volatile oil (in absolute quantities in mLlI00g). The content of all the four compounds
was higher for chilled water and liquid nitrogen frozen ground samples compared to other powders.
Considering β-caryophyllene, the values were slightly low (19.8 and 17.7) in the case of chilled
water and LN2 frozen (10 and -120 C) ground samples than that for ambient and high temperature
(24 and 40 C) ground samples. Figure 4.3.2 shows the variations of constituent compounds of
volatile oil viz., total oil, monterpenes and sesqueterpenes in absolute quantities (mL/100g). The
contents of sesqueterpenes in the volatile oil was marginally different (0.6 to 0.75 mLlI00g), while
these of monoterpenes were in the range from 1.6 to 2.5 mL/100g. This was because the
sesqueterpenes compounds were less sensitive to temperature unlike the monoterpene compounds. It
is thus, concluded that LN2 samples possess highest quantity of monoterpenes compared to all other
samples which gives the desirable feeling of flavour freshness.
143

Fig. 4.3.1 Variations or volatile oil constituents or black pepper ground by rour diflerent grinding methods
Fig. 4.3.2 Variations or total, monoterpene and sesqueterpenes content in volatile oil or black pepper ground by rour dirrerent grinding methods
144

4.3.3.5 Conclusions
It was concluded from the foregoing discussion that,
I) The particle size of black pepper powder ground by cryogenic method was the finest as
compared to other three methods.
2) The cryogenic and chilled temperature methods .of grinding yielded similar quantities of
volatile oil as compared to low quantities in ambient and high temperatures grinding methods.
There was a gain of about 36% in the content of volatile oil by cryogenic grinding method as
compared to high temperature grinding method. Chilled water technique was not adequate to
markedly reduce the temperature rise during grinding of the product.
3) Gas chromatographic analysis showed that in cryogenic grinding technique, the contents of
monoterpenes was higher compared to those obtained by other methods. The content of
sesqueterpenes was fairly similar in all four grinding methods employed in this study.
145

4.3.4 Cryogenic Grinding on a Pilot Scale
It was reported in the Section 4.3.3 that cryogenic grinding of black pepper in the
laboratory scale grinding gave better grinding characteristics in terms of particle fineness, volatile
oil content and quality of volatile oil. However, most of the studies have reported the results
obtained on experiments conducted for a small batch size of spice (l00 to 200g). The reason being
the high unit cost of spices and unavailability of high capacity LN2 grinding facilities. Since
experimental results are scanty in terms of pilot scale cryogenic grinding of spices, a study of
cryogenic grinding of black pepper in a pilot scale (each sample run of 4 kg) grinder at various
feed rates and temperature conditions was carried out to evaluate the grinding characteristics. This
would not only simulate the industrial process but also generates data that would be useful for
large scale trials, scaleup and process standardisation. A central composite rotatable design
(CCRD) concept was used in this study to determine the effect of these variables and to find
optimum grinding conditions in cryogenic grinding. The use of experimental design was beneficial
in reducing the number of experiments and thus reducing quantity of spices which are expensive.
The raw material (black pepper) obtained from a local spice processing company (not
from the local market) was used to simulate the real industrial situation to compare the cryogenic
ground powder with that for ambient ground samples. This raw material was of a variety of low
volatile oil content and had an average particle seed diameter of 4.1 mm.
The mill employed for both ambient and cryogenic grinding was the pin mill obtained
from Hosakowa Alpine, Germany, 80 kg hr-1 capacity having 3.7 kW motor (3 phase, 440 V and
50 Hz) and was made of stainless steel. It consisted of two rotors (one fixed and another rotating
type) with a number of cylindrical stainless steel pins of 4 mm diameter affixed perpendicularly on
them. The feed spice was fed axially, ground between the pins and powder exit was in the radial
direction. The schematic diagram of the pilot scale cryogenic grinding set up is shown in Fig. 3.7.
146

4.3.4.1 Comparison of Cryogenic Grinding with AIl)bicnt Grinding
The following sections deal with the result obtained in cryogenic grinding technique
compared with those of ambient grinding on pilot scale grinding operations in terms of quantity of
volatile oil content, particle size of the powder, mill choking characteristics and quality of volatile
oil. In this investigation, cryogenically ground samples (CI to C9) were compared with ambient
ground samples (AI, A2) (Table 4.3.5).
Table 4.3.5
Results of volatile oil, moisture content and particle size of powder in cryogenic and ambient grinding in pilot scale
Codes for Feed rate Product Moisture Volatile oil Mean particle Sample * temperature content content** diameter
(kg hr-1) ( C) (% wb) (mL/100g) (mm)
C1 35.00 -15.00 10.00 1.67± 0.05 0.22
C2 35.00 -40.00 10.80 1.91± 0.03 0.26
C3 60.00 -40.00 12.00 1.82± 0.06 0.25
C4 15.00 -54.00 12.00 1.87± 0.08 0.25
C5 15 .00 -40.00 11.00 1.35± 0.03 0.20
C6 52.00 -25.00 11.50 1.90± 0.04 0.27
C7 35.00 -60.00 10.00 1.78± 0.09 0.22
C8 7.00 -15.00 10.00 1.44±0.07 0.24
C9 52.00 -54.00 12.00 1.42±0.06 0.25
Al 35.00 53.00 10.00 0.98± 0.05 0.24
A2 15.00 86.00 8.40 0.78± 0.04 0.16
* C 1 to C9 were the cryogenic ground samples and Al & A2 were ambient ground samples ** Moisture free basis
147
4.3.4.1.1 Feed Rate and Product Temperature
The feed rate of grinding influenced the rise in product temperature during ambient
grinding (Section 4.2.1) which in turn affected the quality attributes of the powder. The feed rate
and product temperatures were found to be interrelated in ambient grinding. On the other hand, in
case of low feed rate, the rise in product temperature (temperature gradient) was high (Table
4.2.2). Therefore, it was necessary to control the feed rate and the product temperature
(independent variables) to study their effect on the grinding characteristics of black pepper.
In the pilot scale cryogenic grinding experimentation, the feed rate and the product
temperatures during grinding were controlled by controlling both the feed rate of black pepper and
flow of LN2, according to the experiment design (Section 3.4.4.1). The feed rates, shown in Table
4.3.5, were varied from 7 to 60 kg h(1 using a vibratory (magnetic type) feeder. The product
temperatures were maintained at a predetermined temperature using a temperature controller by
suitably monitoring the flow of liquid nitrogen into the mill. The product temperature were in the
range of -15 ± 3 to -60 ± 3 C (Table 4.3.5). The range of feed rate was chosen based on the
equipment specification, particularly the capacity. However, the product temperature chosen was
based on the following aspects of industrial situations, (1) the minimum temperature chosen should
not be very low which would otherwise leads to difficulty in storage of powder for retail
distribution, and (2) the maximum temperature chosen should be slightly away from the freezing
point of water (0 to 5 C). Hence, the temperature range of about –10 to -65 C was chosen. The feed
rates of two control (ambient grinding) samples (in addition to that of experimental design) were
maintained at 15 and 35 kg hr-1 and the product temperature reached were 86 and 53 C,
respectively.
4.3.4.1.2 Particle Size of Powder
The average particle sizes of the powders were determined by adopting the sieve analysis
technique using Eq.3.2 and the results are shown in the Table 4.3.5. The geometric mean particle
diameters in the case of cryogenic grinding varied from 0.20 mm to 0.27 mm, with an average of
0.25 ± 0.02 mm and in case of ambient grinding, it was
148
0.20 ± 0.04 mm. The geometric mean particle diameter in the case of cryogenic grinding was
higher (coarser) than the ambient ground black pepper powder. This apparently contradicted the
data reported in the literature that cryogenic grinding improved the fineness of powder (Section
2.4.5 (b)). Higher (coarser) particle size in case cryogenic grinding may be attributed to the fact that
the moisture content of cryogenic ground powder was higher as compared to samples ground in
ambient conditions. Higher moisture content of powder improved the cohesiveness of particles and
they stuck to each other, thereby increases apparent particle mean diameter. However, the mean
diameters of the powder particles was more consistent across the batch of nine cryogenic ground
samples (samples C1 to C9). These results indicate that particle size of product also depended upon
moisture content of feed apart from varying with feed rate and temperature. Thus, the grinding trials
were conducted with constant moisture feed.
4.3.4.1.3 Mill choking characteristics
Mill choking or sieve choking is a phenomenon in grinding of foods in which ground material
which is sticky (not free flowing) in nature adheres to the grinding surfaces or blocks the sieve
opening. It is a crucial characteristic in grinding of spices which usually have higher fat content. In
large scale ambient grinding operations, the ground products accumulate on the walls of mills or.
block the sieve opening (Anon, 1962) which may result in fire hazard or breakdown of the mill. It
has been reported (Landwehr and Pahl, 1986) that almost all grinding experiments on pepper
without chilling caused choking of sieve and ultimately led to breakdown of the mill. Watanabe et
at (1978) reported that grinding of nutmeg was impossible above 20 C but it was possible to grind
at temperature below -40 C. Sieve choking characteristics were photographed at various
temperatures of powder in cryogenic grinding of cumin and clove (Singh and Goswami, 1999a and
2000), who observed that at high temperatures, the blockage of sieves was high.
In the present investigation, it was observed that there was higher accumulation of pepper
powder on the different grinding surfaces viz., between the pins, and mill walls during ambient
grinding. The reasons for powder accumulation may be due to the fact that during grinding at the
temperature higher than the brittle point of black pepper and

freezing point of its oil, the powder adhered to the grinding surfaces. Also, during grinding, the
spice oil might come out of the ruptured cells and formed a layer over the grinding surfaces (Li et
ai., 1991). The powder was deposited above this layer and formed a thick layer on the grinding
surface, which caused hindrance in grinding. At the same time, the incoming raw material might
overload the grinding surface and the mill and would finally stop the mill. At cryogenic
temperatures, no blockage of pins or mill walls was observed. This was because at temperatures
lower than the brittle point of black pepper and freezing point of spice oil, the oil got solidified and
the grinding operation continued unhindered. Hence, there was a possibility to increase the grinding
rate. In other words, the production capacity of the mill could be enhanced, thereby bringing better
return to the spice processors. It was, thus inferred that cryogenic grinding operations could
eliminate the problem of choking and thereby increasing the production capacity for grinding mills.
4.3.4.1.4 Volatile oil content of Powder
The content of volatile oil, in both cryogenic and ambient conditions are shown in Table
4.3.5. The volatile oil contents in case of cryogenic grinding were in the range of 1.42 to 1.91 mL/
l00g whereas in case of ambient grinding, they were poor (0.78 and 0.98 mL/100g). This was
expected because grinding of black pepper at cryogenic temperature improved the volatile oil
content in the powder. The average volatile oil content in case of cryogenic grinding was 1.7
mL/100g whereas in ambient grinding it was only 0.9 mL/100g. The loss of volatile oil in the case
of ambient grinding was 50% more as compared to cryogenic grinding. This loss may be attributed
to higher grinding temperature.
It was observed during ambient grinding that the loss of volatile oils from the powder
took place in the atmosphere due to vapourisation of these oils which were sensitive to high
product temperatures. This vapourisation also took place, if the powder was fine. These vapourised
oils caused eye, nose and throat irritations if inhaled, thereby leading to fatigue of workers. The
dust produced during ambient grinding could create respiratory problems.
150

During cryogenic grinding, the vapourisation of oils was minimum as most of the volatile
oil compounds were retained within the powder itself because at cryogenic temperatures the oils
got solidified. The dust formation was also marginal. These specific advantages of cryogenic
grinding show the practical usefulness of this technology.
4.3.4.1.5 Analysis of Volatile oil by Gas Chromatography
The gas chromatographic analysis of the volatile oil samples obtained under different conditions
and their relative percentage of some main constituents of volatile oil are presented in Table 4.3.6.
The main monoterpene compounds of black pepper volatile oil were a-thujene, α-pinene, sabinene
β-pinene, limonene, and the sesqueterpenes compounds were α-copaene, β-caryophyllene, β-
bisabolene, caryophyllene oxide. These compounds accounted for 70 to 88% of the total volatile oil
in both cryogenic and ambient grinding samples.
Table 4.3.6
Gas chromatographic analysis of cryogenic and ambient ground volatile oil
Compound Al A2 CI C2 C3 C4 C5 C6 C7 C8 C9
1. Thujene+α-pinene 0.78 0.89 7.82 5.60 7.45 6.81 5.09 3.06 7.23 1.77 6.79
2. Sabinene+β-pinene 4.98 3.96 22.87 19.64 22.15 20.58 18.76 15.67 21.39 9.32 21.10
3. 1,8 Cineole 3.75 3.41 7.60 7.32 7.61 7.46 7.27 6.80 7.57 4.71 8.81
4. Limonene 7.85 5.99 15.50 15.49 15.73 14.82 15.66 14.94 15.73 9.90 16.82
5. α-Copaene 5.61 5.31 3.54 3.77 3.45 3.75 3.97 4.48 3.59 5.37 3.57
6. β-Caryophyllene 21.46 25.50 9.79 8.98 10.72 13.12 9.20 3.78 13.14 13.20 17.23
7. β-Bisabolene 16.03 19.95 7.66 8.35 8.13 9.19 8.06 6.88 8.81 12.87 10.51
8. Caryophyllene 13.13 12.67 8.13 9.94 7.74 7.53 10.41 14.74 6.02 15.99 3.58 oxide
Total (%) 73.59 77.68 82.91 79.09 82.98 83.26 78.42 70.35 83.48 73.13 88.41
Moneterpenes 17.36 14.25 53.79 48.05 52.94 49.67 46.78 40.47 51.92 25.70 53.52 (SI. No.I-4) Sesqueterpenes 56.23 63.43 29.12 31.04 30,(J4 33.59 31.64 29.88 31.56 47.43 (SI No.5-8) Ratio of 0.31 0.22 1.85 1.55 1.76 1.48 1.48 1.35 1.65 0.54 1.53 monotepenes and
* C I to C9 were the cryogenic ground samples and A I & A2 were ambient ground samples
34.89
151

The ratios of monoterpenes to sequeterpenes varied from 1.35 to 1.85 in the case of
cryogenic ground samples with exception of one cryogenic ground sample (C8) for which the ratio
was 0.54, while both the ambient ground samples had a very low ratios of 0.31 and 0.22.
Figure 4.3.3 shows the variation of constituent compounds of volatile oil viz., total oil,
monterpenes and sesqueterpenes in absolute quantities (mL/100g). The contents of
sesqueterpenes in the volatile oil was between 0.43 and 0.63 mL/100g while the contents of
monoterpenes in the volatile oil was in the range of 0.61 to 1.55 mL/100g.
Figure 4.3.4 shows the variations of constituent monoterpene compounds of volatile oil in
absolute quantities (mL/100g). The loss of monoterpenes was significant in ambient grinding, as
there was a loss of volatile oil in terms of every monoterpene compound, which might be
attributed to high product temperature.
Figure 4.3.5 shows the variations of constituent sesqueterpene compounds of volatile oil in absolute
quantities (mL/100g). There was marginal difference in the distribution pattern of sesqueterpene
compounds in both ambient and cryogenic ground samples as sesqueterpene compounds were not
sensitive to high temperature. Figure 4.3.6(a) shows the comparison of these two grinding methods
with respect to total oil, monoterpenes and sesqueterpenes in absolute quantities (mL/100g). The
average content of monotepenes content in cryogenic grinding was 0.80 mL/l00g whereas that from
ambient grinding was 0.15 mL/100g. However, the average sesqueterpenes content was fairly
constant in both the grinding methods. This aspect is clearly brought out in the pie chart (Fig. 4.3.6
(b)), wherein it is indicated that· in the case of ambient grinding monoterpenes and sesqueterpens
amount to 22 and 78%, respectively of the total oil, While the corresponding values in the
cryogenic grinding are 60 and 40%, respectively, which shows that cryogenic grinding technique is
superior to ambient grinding in terms of monoterpenes retention in the powder.
152

Fig. 4.3.3 Variations of total, monoterpene and sesqueterpenes content in black pepper volatile oil ground by cryogenic grinding (pilot scale)
153

Fig. 4.3.4 Variations of monoterpenes constituents in black pepper volatile oil ground by cryogenic grinding (pilot scale)
Fig. 4.3.5 Variations of sesqueterpenes constituents in black pepper volatile oil ground by cryogenic grinding (pilot scale)
154

Fig. 4.3.6 Comparison of ambient and cryogenic grinding in terms of components volatile oil (Pilot scale) (a) In terms of total oil, monoterpenes and sesqueterpenes and (b) In terms of monoterpenes and sesqueterpenes
155

4.3.4.1.6 Sensory Studies of Powdered Samples
In the previous sections, the volatile oil obtained from the powdered black pepper samples
was subjected to instrumental analysis by gas chromatography. However, instrumental analysis
alone may not always be a correct measurement of quality of powdered sample. The consumers'
acceptance of the powdered sample is a very important parameter in the studies on spice grinding.
Therefore, powders of both cryogenically and ambient ground samples were subjected to' sensory
studies. As odour is one of critical parameters in powered spice products (Narasimhan et al, 1990,
1992), the odour profiles were obtained with the help of a trained panel of 12 persons (please see
Section 3.3.4.3 of Materials and Methods, chapter 3).
The odour profile of powdered black pepper was classified as top notes, basic notes,
defective notes and the overall quality. The odour attributes such as floral, citrussy, fresh cut wood,
camphory and green, were categorised as top notes. The odour attributes such as herbal, woody,
irritant/sharp, earthy and rooty were catergorised as basic notes, and the stale and oxidised were
catergorised as defective notes. It is desirable to have higher top notes and minimum defective
notes, which means the freshness of the powder.
The panel training was found to be effective as their performance as compared by the coded
duplicate sample was consistent. The understanding of the top and basic notes were in tandem. The
results of the odour profile (the mean and SD) of both cryogenically and conventionally ground
samples were plotted on a 10 point axis scale (Fig. 4.3.7). The top notes in case of cryogenically
ground samples were in the zone of mean score between 5 and 7.5, whereas the conventionally
ground samples was in the zone of mean score between 2.5 and 4.5. This means that cryogenically
ground samples were better in odour quality and the powder was fresh. In the basic notes, the
attributes such as earthy and rooty did not have any significant difference between the two grinding
methods, whereas in other attributes cryogenically ground samples were better. The defective notes
were higher in conventionally ground samples and were very low in cryogenically ground samples.
The mean scores of overall quality was about 5 and 10 for conventional and cryogenically ground
samples, respectively which indicated that powder obtained by the former was average and the
latter was very good in overall quality.
156

fig. 4.3.7 Sensory attributes of samples of cryogenic and conventional grinding
157

Further, among the nine cryogenically ground samples (Refer Table 4.3.5), the samples C4
(processed at 15 kg hr-1 and -54 C) and C6 (processed at 52 kg hr-1 and -25 C) were found to be
ideal to give a good quality powder. This aspect was confirmed by repeated testing by the same
sensory panel.
To conclude, the sensory studies data indicated that cryogenically ground samples were
distinctly high in top notes which represented freshness, and marginally high in basic notes also.
Hence, the quality of cryogenic ground samples were better than that of ambient ground samples.
4.3.4.2 Response Surface Methodology (RSM) for Cryogenic Grinding
In the previous Section 4.3.4.1 also, it was clearly mentioned that cryogenic grinding was
superior to ambient grinding even in pilot scale grinding, in terms volatile oil content and quality
of volatile oil. This section on response surface methodology for cryogenic grinding examines
specifically the effect of independent variables such as feed rate and product temperature on
dependent variables viz., volatile oil, particle diameter, energy expenditure, content of
monoterpenes and sesqueterpenes in the volatile oil. Having concluded that cryogenic grinding is
an alternative, this section deals with optimisation of experimental condition for volatile oil content
and content of monoterpenes in the volatile oil. The objective of this section was to know the
quantitative effect of these variables on quality parameters, and to find an optimised condition for
practical application.
4.3.4.2.1 Effect of Variables on Cryogenic Grinding
Pilot scale cryogenic grinding of black pepper was conducted to quantify the effect of
grinding variables such as feed rate (Xt) and temperature of product (X2) at the mill's exit. The
response functions or dependent variables were volatile oil (Y1), geometric mean particle
diameter of the powder (Y2), energy expenditure for grinding (Y3), and product characteristics
such as content of monoterpenes (Y4) and sesqueterpenes (Y5) in the volatile oil. An experimental
design (CCRD) in coded level of
158

variables was employed (Section 3.3.4.1) to investigate the effect of the two variables on
these five response functions. The experimental design in coded level (-1.414 to 1.414) of
variables is shown in Table 4.3.7, while the experimental results concerning the response
functions are shown in Table 4.3.8. To visualise the effect of the variables in a better manner,
3 dimensional response surfaces are shown in Figs. 4.3.8 to 4.3.12.
4.3.4.2.2 Volatile oil
The volatile oil contents in the powders varied between 1.35 and 1.94 mL/100g in the
range of experimental variables. The analysis of variance (ANOV A) using a second order
polynomial (Eq. 3.15) for volatile oil is represented by Table 4.3.9
Table 4.3.7
Experimental design in coded (x) and actual level (X) of variables X1 and Xl : Feed rate X2 and X2 : Temperature
Expt Variables No. Coded level Actual level
X1 X2 Xl X2
1 -1 -1 14.8 53.4
2 -1 1 14.8 -21.6 3 1 -1 52.2 -53.4 4 1 1 52.2 -21.6 5 -1.414 0 7.0 -37.5 6 1.414 0 60.0 -37.5 7 0 -1.414 33.5 -60.0 8 0 1.414 33.5 -15.0 9 0 0 33.5 -37.5 10 0 0 33.5 -37.5 11 0 0 33.5 -37.5

Table 4.3.8
Response functions (Y1, Y 2, Y 3, Y 4 and Y5 ) obtained employing experimental design
(corresponding to Table 4.3.7)
Expt. Volatile oil Particle Energy Monoterpenes Sesqueterpenes No. Y1 diameter expenditure
(mLl 100g) Y2 Y3 Y4 Ys (mm) (kJ/kg) (%) (%)
1 1.87 0.25 278.0 I 49.67 33.59 2 1.35 0.20 208.51 46.78 31. 64 3 1.42 0.25 300.74 53.52 34.89 4 1.90 0.27 300.74 40.4 7 29.88 5 1.44 0.24 446.81 25.70 47.43 6 1.82 0.25 278.01 52.94 30.04 7 1.78 0.22 327 .66 51.92 31.56 8 1.67 0.22 327 .66 53.79 29.12 9 1.91 0.26 327.66 48.05 31.04
10 1.94 0.25 327 .66 48.05 31. 04 11 1.88 0.26 327.66 48.05 31.04
A high multiple correlation coefficient (r) of 0.967 (significant at p ≤ 0.0 1) indicated the
suitability of the second order polynomial to express the response function (volatile oil) in terms of
the variables (feed rate and temperature). Among the variables, the effect of feed rate (linear and
quadratic) was more prominent than that for temperature (Table 4.3.9). The quadratic effect of feed
rate was negative but dominated over its positive linear effect. The quadratic effect of temperature
was only significant (p ≤ 0.10) and had a negative effect. On the contrary, the interaction effect of
feed rate and temperature had the highest effect (significant at p ≤ 0.01) compared to all the
variables and its effect was positive. This indicated that the effect of feed rate depended on the
level of temperature and vice-versa. The negative quadratic effect of feed rate tried to decrease
volatile oil when feed rate was increased. Figure 4.3.8 shows this trend when the temperature was
very low. On the other hand, the dominating effect of feed rate x temperature became prominent
when one of them or both were high. The net result in such circumstances was an increase in
volatile oil because this interaction term was positive in nature (Fig. 4.3.8) and possessed the
highest effect. The inference that could

Fig. 4.3.8 Response surface plot of volatile oil, feed rate and product temperature in cryogenic grinding
161

be drawn from these results are that the effects of these two variables are inter-related, and a
desirable condition is possibly low temperature in combination with a high feed rate.
4.3.4.2.3 Particle diameter
The change in geometric mean particle. diameter of the powder due to cryogenic
grinding was between 0.20 and 0.27 mm (Table 4.3.8). The response surface relating particle
diameter, and feed rate and temperature are shown in Fig. 4.3.9. The ANOVA table (Table 4.3.10)
shows significant effects for linear feed rate (positive effect), quadratic negative effect of
temperature, and the interaction effect of feed rate and temperature (positive effect). These meant
that an increase in feed rate increased the particle size in a linear fashion, whereas an increase in
temperature decreased the particle size in a quadratic manner. Among these three significant
effects, the interaction term indicated that final particle size depended on the level of feed rate in
conjunction with temperature. Thus, a low feed rate could produce particles with low average
particle sizes.
Table 4.3.9
Analysis of variance (ANOV A) for response function volatile oil (Y1) in coded level of variables
Source of variation Coefficient of Sum of Degrees of Mean sum of F-value regression Squares freedom squares
equation
Intercept 1. 91000 - - - -
Feed rate OJl7968 0.05078 1 0.05078 8.19 ** (Feed rate) 2 -0.15066 0.12812 1 0.12812 20.62 *** Temperature -0.02445 0.00478 1 0.00478 0.77 NS
(Temperature) 2 -0.10314 0.06005 1 0.06005 9.69 ** Feed rate x 0.25000 0.25000 1 0.25000 40.26 *** Temperature - Error - 0.03099 5 0.00620 - r 0.967
* Significant at p < 0.25 ** Significant at p < 0.10 *** Significant at p < 0.01 NS Non-significant at p =0.25
162

Fig. 4.3.9 Response surface plot of particle diameter, feed rate and product tcmperature in cryogcnic grinding
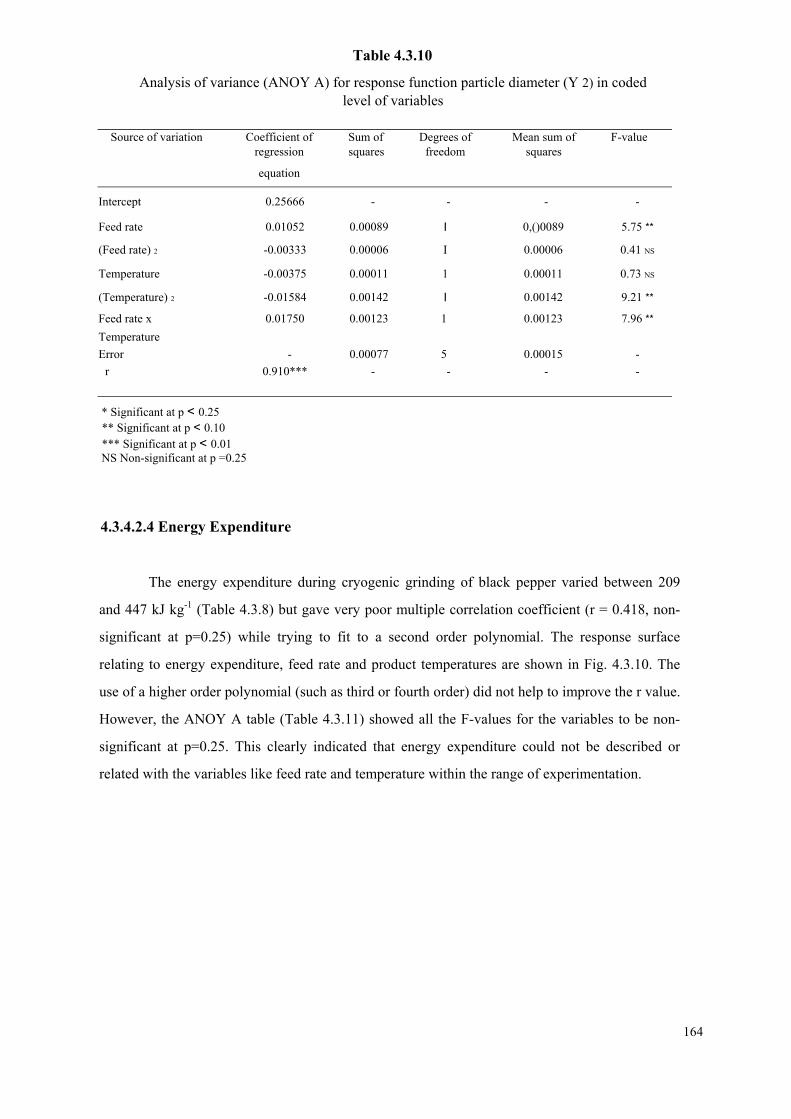
Table 4.3.10
Analysis of variance (ANOY A) for response function particle diameter (Y 2) in coded level of variables
Source of variation Coefficient of Sum of Degrees of Mean sum of F-value regression squares freedom squares
equation
Intercept 0.25666 - - - -
Feed rate 0.01052 0.00089 I 0,()0089 5.75 **
(Feed rate) 2 -0.00333 0.00006 I 0.00006 0.41 NS
Temperature -0.00375 0.00011 1 0.00011 0.73 NS
(Temperature) 2 -0.01584 0.00142 I 0.00142 9.21 **
Feed rate x 0.01750 0.00123 1 0.00123 7.96 ** Temperature Error - 0.00077 5 0.00015 -
r 0.910*** - - - -
* Significant at p < 0.25 ** Significant at p < 0.10 *** Significant at p < 0.01 NS Non-significant at p =0.25
4.3.4.2.4 Energy Expenditure
The energy expenditure during cryogenic grinding of black pepper varied between 209
and 447 kJ kg-1 (Table 4.3.8) but gave very poor multiple correlation coefficient (r = 0.418, non-
significant at p=0.25) while trying to fit to a second order polynomial. The response surface
relating to energy expenditure, feed rate and product temperatures are shown in Fig. 4.3.10. The
use of a higher order polynomial (such as third or fourth order) did not help to improve the r value.
However, the ANOY A table (Table 4.3.11) showed all the F-values for the variables to be non-
significant at p=0.25. This clearly indicated that energy expenditure could not be described or
related with the variables like feed rate and temperature within the range of experimentation.
164

Fig.4.3.10 Response surface plot of energy expenditure, feed rate and product temperature in cryogenic grinding
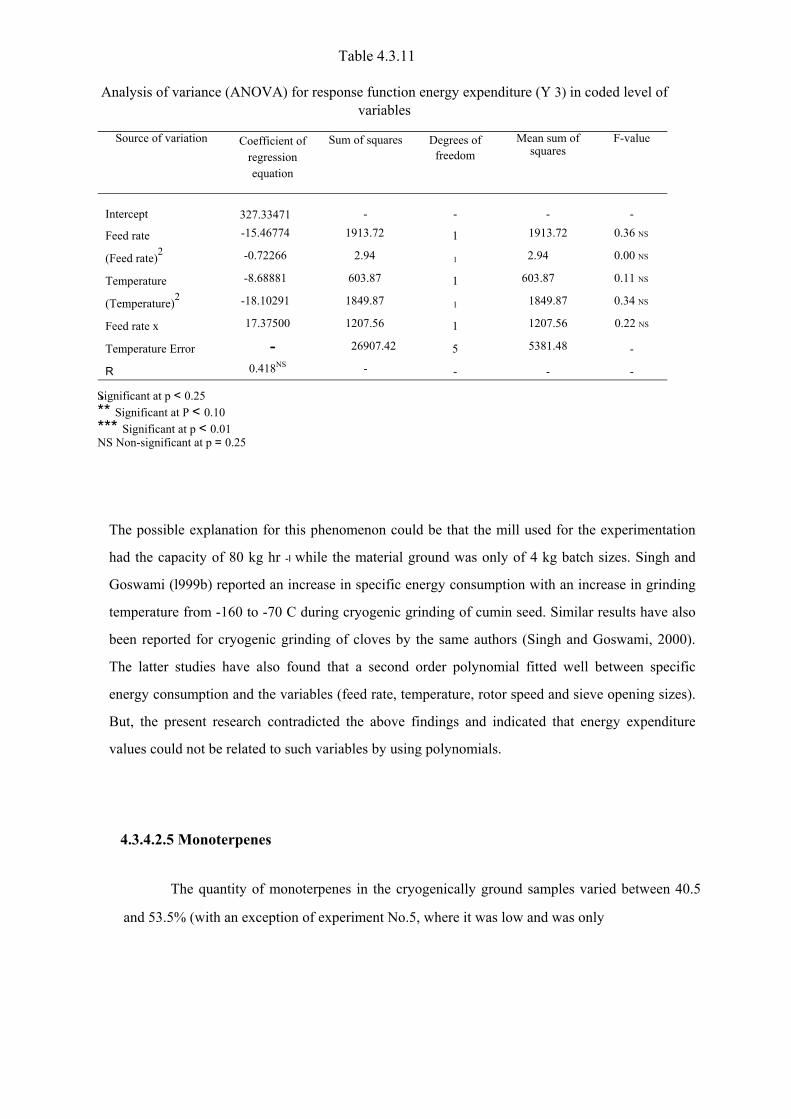
Table 4.3.11
Analysis of variance (ANOVA) for response function energy expenditure (Y 3) in coded level of variables
Source of variation Coefficient of regression equation
Sum of squares
Degrees of freedom
Mean sum of squares
F-value
Intercept 327.33471 - - - -
Feed rate -15.46774 1913.72 1 1913.72 0.36 NS
(Feed rate)2 -0.72266 2.94 1 2.94 0.00 NS
Temperature -8.68881 603.87 1 603.87 0.11 NS
(Temperature)2 -18.10291 1849.87 1 1849.87 0.34 NS
Feed rate x 17.37500 1207.56 1 1207.56 0.22 NS
Temperature Error - 26907.42 5 5381.48 -
R 0.418NS - - - -
S gnificant at p < 0.25 ** Significant at P < 0.10 *** Significant at p < 0.01 NS Non-significant at p = 0.25
i*
The possible explanation for this phenomenon could be that the mill used for the experimentation
had the capacity of 80 kg hr -I while the material ground was only of 4 kg batch sizes. Singh and
Goswami (l999b) reported an increase in specific energy consumption with an increase in grinding
temperature from -160 to -70 C during cryogenic grinding of cumin seed. Similar results have also
been reported for cryogenic grinding of cloves by the same authors (Singh and Goswami, 2000).
The latter studies have also found that a second order polynomial fitted well between specific
energy consumption and the variables (feed rate, temperature, rotor speed and sieve opening sizes).
But, the present research contradicted the above findings and indicated that energy expenditure
values could not be related to such variables by using polynomials.
4.3.4.2.5 Monoterpenes
The quantity of monoterpenes in the cryogenically ground samples varied between 40.5
and 53.5% (with an exception of experiment No.5, where it was low and was only

25.7%). The analysis of variance (ANOVA) using a second order polynomial (Eq. 3.15) for
monoterpenes is represented in Table 4.3.12. A multiple correlation coefficient (r) of 0.779
(significant at p≤0.0I) indicated the moderate suitability of a second order polynomial to express
the response function (monoterpenes) in terms of the dependent variables (feed rate and
temperature). In the experimental range of variables selected, the effect of feed rate (linear and
quadratic) was prominent on the percentage of monoterpenes (significant at p < 0.25) whereas the
effect of temperature (linear and quadratic) was non-significant (p=0.25). The linear effect of feed
rate was positive whereas its quadratic effect was negative on the percentage of monoterpenes.
This meant that an initial increase in feed rate increased monoterpenes but a very high level of
feed rate marginally decreased the same, which was reflected in the response surface (Fig. 4.3.11).
The highest value for monoterpenes appeared to be associated with a high value of feed rate (not
at the highest level but close to about 50 kg hr-1.
Table 4.3.12
Analysis of variance (ANOVA) for response function monoterpenes (Y4) in coded level of variables
Source of variation Coefficient of Sum of Degrees of Mean sum of F-value
regression equation squares freedom squares
Intercept 48.14969 - - - -
Feed rate 4.50785 162.54 I 162.54 3.16 *
(Feed rate) 2 -4.03528 91.92 I 91.92 1.78 *
Temperature - 1.66223 22.10 1 22.10 0.43 NS
(Temperature) 2 2.73426 42.20 1 42.20 0.82 NS
Feed rate x -2.54000 25.81 I 25.81 0.50 NS
Temperature Error 257.84 5 51.48 - r 0.779*** - - - -
* Significant at p < 0.25 ** Significant at p < 0.10 *** Significant at p < 0.0 1 NS Non-significant at p = 0.25
The phenomenon of increased feed rate (linear), increasing the percentage of
monoterpenes might be due to the fact that the ground material spent less time within the
167

Fig. 4.3.11 Response surface plot of monoterpenes, feed rate and product temperature in cryogenic grinding

grinding zone as compared to the lower feed rate samples. Higher the time spent by the ground
material within the grinding zone the higher was the loss of monotepernes, as these compounds
were volatile in nature. The range of temperature (-15 to -60 C) did not appears not to affect the
percentage of monoterpenes, indicating that selection of any temperature in this range was
suitable. Hence, a temperature such as -15 C could be selected to have more monoterpenes in the
product because selection of too low temperature was not a cost effective situation.
4.3.4.2.6 Sesqueterpenes
The percentages of sesqueterpenes (Table 4.3.8) in the samples were between 29.1 and
47.4%. The analysis of variance using the second order polynomial (Table 4.3.13) indicated a
moderately good correlation coefficient of 0.882 (significant at p ≤ 0.01). The effect of feed rate
(linear) on the sesqueterpenes was negative (p ≤ 0.10) which meant that the high feed rates gave
low percentage of sesqueterpenes. The quadratic effect of the feed rate was positive (significant p
< 0.25) indicating that at a very high level of feed rate, the response function would increase,
which was visible in the response surface (Fig. 4.3.12).
Table 4.3.13
Analysis of variance (ANOV A) for response function sesqueterpenes (Y5) in coded level of variables
Source of variation Coefficient of Sum of Degrees of Mean sum of F-value
regression squares freedom squares
Intercept 31.04376 - - - -
Feed rate -3.16916 80.33 1 80.33 4.77 **
(Feed rate) 2 3.31823 62.15 1 62.15 3.82 *
Temperature -1.26396 12.77 1 12.77 0.82 NS
(Temperature) 2 -0.88053 4.38 1 4.38 0.25 NS
Feed rate x -0.69000 1.90 I 1.90 0.14 NS
Temperature Error - 81.23 5 16.24 - r 0.827*** - - - -
* Significant at p < 0.25 ** Significant at p < 0.10 *** Significant at p < 0.01 NS Non-significant at p = 0.25
169

Fig. 4.3.12 Response surface plot of sesqueterpenes, feed rate and product temperature in cryogenic grinding

The coefficients of regression equation for the four dependent variables, VIZ., volatile oil,
particle size, monoterpenes and sesqueterpenes in the actual level of variables are shown in Table
4.3.14. However, the correlation coefficients for energy expenditure have not been presented in
the table due to inadequate suitability. These coefficients would be of practical use for large scale
grinding operations of black pepper.
Table 4.3.14
Coefficients of the regression equation in actual level of variables*
Volatile oil Particle . Monoterpenes Sesqueterpenes diameter
(Y1) (Y2) (Y4) (Ys)
Constant -0.40224 0.05631 49.475 42.753
Feed rate 0.06455 0.00341 0.682 -0.902'
(Feed rate) 2 -0.00043 -0.00001 -0.011 0.010
Temperature -0.06030 -0.00690 1.005 -0.249
(Temperature) 2 -0.00041 -0.00006 0.011 -0.003
Feed rate x 0.00084 0.00006 -0.009 -0.003 Temperature * The coefficients for energy expenditure (Y3) are not presented due to inadequate suitability.
4.3.4.2.7 Correlation among the Dependent Variables
It is interesting to know whether the response functions are inter-related, and if so, to what
extent. Table 4.3.15, shows the correlation coefficients among the dependent variables. Volatile oil
and particle size were having a moderate correlation of 0.62 (significant at p ≤ 0.05). Similar
correlation was reported in previous sections also (Section 4.2.3.4) for ambient grinding.
Correlation of volatile oil with other dependent variables such as energy expenditure,
monoterpenes and sesqueterpenes was nonsignificant (p = 0.05). The correlation of particle size
with other dependent variables was non-significant (p= 0.05) for energy expenditure,
monoterpenes and sesqueterpenes. The correlation of energy expenditure with monoterpenes and
sesqueterpenes was negative and positive, respectively (significant at p < 0.05). This meant that,
high energy consumption lowered the heat sensitive monoterpenes, while, increasing
sesqueterpenes.
171

The correlation of monoterpenes with sesqueterpenes was negative (significant at p < 0.05) as
expected because a decrease in one quantity would increase the other.
Table 4.3.15.
Correlation among the dependent variables
Volatile oil Particle Energy Monoterpenes Sesqueterpenes (Y1) diameter expenditure (Y2) (Y3) (Y4) (Ys)
Volatile oil (Y1) 1.000 0.616* 0.019NS 0.250 NS -0.521 NS
Particle diameter (Y 2) 1.000 0.260 NS -0.131 NS -0.029 NS
Energy expenditure (Y 3) 1.000 -0.630* 0.690*
Monoterpenes (Y 4) 1.000 -0.800**
Sesqueterpenes (Y s) 1.000
* Significant at p < 0.05 * * Significant at p < 0.0 I NS Non-significant at p = 0.05
It could be inferred that high correlation between monoterpenes and sesqueterpenes and a
moderate correlation existed between energy expenditure with monoterpenes and sesqueterpenes,
and between volatile oil and particle size. These indicate that larger particle size has maximum
volatile oil and an increased energy input reduced monoterpenes but simultaneously increased
sesqueterpenes.
4.3.4.2.8 Optimization of Cryogenic Grinding Condition
The cryogenic grinding conditions could be optimised for obtaining maximum volatile oil,
monoterpenes and combination of both from the point of commercial use as ground particles are
priced mainly on these quality attributes. The optimisation process employed in these study was
the canonical procedure (Section 3.3.4.1) along with overlapping of contour plots for obtaining the
zone (s) of suitable opertating conditions.
172

4.3.4.2.8.1 Volatile oil
In cryogenic grinding volatile oil content in the powder varied between 1.94 and 1.35 mL/
100g at various feed rates and. grinding temperatures as per the experimental design. The
objective of this optimisation process was to obtain suitable conditions of feed rate and
temperature which could yield the highest volatile oil from the powder by distillation. The contour
plot (Fig. 4.3.13) indicated that volatile oil reached the maximum (1.94 mL/100g) at two zones.
One zone being at low feed rates (7 to 15 kg hr-l and low temperature (-53 to -60 C) and the other
being at high feed rate (47 to 57 kg hr-l and high temperature (-15 to -20 C).
However, in practical situation, it would be worthwhile to choose higher feed rate and
higher temperature because higher grinding rates would be desirable in the industrial grinding
applications to enhance production capacity and to save coolant requirement, respectively. Hence,
the optimum cryogenic condition for maximum content of volatile oil could be selected as 47 to
57 kg hr-l of feed rate and -20 to -15 C of product temperature. The values of optimum condition
of cryogenic grinding agreed with the value of optimum product temperature (about -20 C) for
obtaining the highest volatile oil (Anon, 1994).
4.3.4.2.8.2 Monoterpenes
The objective was to obtain optimum condition for cryogenic condition that would
produce maximum quantity of monoterpenes, which in turn would give the freshness of the
product. The response surface (FigA.3.14) showed that the optimum value of monoterpenes in the
range of feed rate of 40 to 55 kg hr-l and the product temperature of -56 to -50 C, gave the highest
monoterpenes. These conditions yielded the product containing volatile oil having high aroma,
high freshness and also strong peppery notes (Section 4.2.3.8).
173

Fig. 4.3.13 Contour plot of volatile oil, feed rate and product temperature for optimizing cryogenic grinding condition

Fig. 4.3.14 Contour plot of monoterpenes, feed rate and product temperature for optimizing cryogenic grinding condition
175

4.3.4.2.8.3 Volatile oil and Monoterpenes
The optimisation of both volatile oil and monoterpenes is required, as for industrial
applications, higher content of volatile oil is desirable with higher percentage of monoterpenes to
have higher unit price of ground black pepper product. Accordingly, Fig. 4.3.13 and 4.3.14 were
superimposed to have a combined graph of volatile oil and monoterpenes (Fig. 4.3.15) as functions
of feed rate and product temperature. As indicated in the graph, .the combined optimum condition
was 8 to 15 kg hr-l of feed rate and -60 to -55 C of product temperature when the volatile oil
content was 1.94 mL/I00g and monoterpenes content was about 47.8%. On the other hand a feed
rate of 47 to 57 kg hr-l and product temperature between -20 to -15 C also gave a high volatile oil
content of 1.94 mL/100g but slightly lower monoterpene content of about 38%.
However, for the reasons mentioned in Section 4.3.4.2.7, a high feed rate and a high
product temperature combination which would yield maximum volatile oil with a reasonable
quantity of monoterpenes may be preferred. Hence, the feed rate of 47 to 57 kg hr-l and product
temperature of -20 to -15 C which gave volatile oil of 1.94 mL/100g and monoterpenes of about
38 % was the combined final optimum grinding condition.
4.3.4.3 Conclusions
The following inferences were drawn based on pilot scale grinding studies involving
ambient and cryogenic grinding;
1) The control sample in ambient grinding reached a product temperature of 86 and 53C, at the
feed rates of 15 and 35 kg hr-l, respectively indicating that low feed rate would give higher
temperature which would be undesirable.
2) The average volatile oil content in case of cryogenic grinding was 1.7 mL/100g whereas in
ambient grinding it was 0.9 mL/100g. The loss of volatile oil in the case of ambient grinding
was about 50% as compared to cryogenic grinding.
176

Fig. 4.3.15 Combined contour plot (Fig. 4.3.13 and Fig. 43.14) of volatile oil, monoterpenes, feed rate and product temperature for optimizing cryogenic grinding condition
177

3) The gas chromatographic analysis data of volatile oil indicated that the ratio of monoterpenes
to sequeterpenes varied from 1.35 to 1.85 in the case of cryogenic grinding, whereas, the
ambient ground samples had a very low ratio (0.22 to 0.31). The content of sesqueterpenes in
the volatile oil was between 0.43 and 0.63 mL/100g while the content of monoterpenes in the
volatile oil was in the range of 0.61 to 1.55 mL/100g, in both cryogenic and ambient
conditions. The loss of monoterpenes was high in ambient grinding, as their was a loss of
volatile oil in terms of every monoterpene compound. Cryogenic grinding technique was
found to be superior to ambient grinding in terms of monoterpenes retention in the powder.
4) Mill choking characteristic or blockage of grinder pins in ambient grinding was severe which
reduced the grinding rate. Such a phenomenon was absent in cryogenic grinding as oils got
solidified and grinding operation was unhindered, resulting in enhanced grinding rate or
production capacity.
5) Vapourisation of volatile oils to the atmosphere was high during ambient grinding which
caused health hazards to workers whereas vapourisation was minimum during cryogenic
grinding.
6) Sensory studies indicated that cryogenically ground samples were distinctly high in top notes
which represented freshness, and marginally high in basic notes also. Hence, the quality of
cryogenically ground sample was better than the ambient ground samples.
7) Feed rate and product temperature of the samples during cryogenic grinding had significant
effects on dependent variables viz., volatile oil, particle diameter, monoterpenes content and
sesqueterpenes content, but not with energy expenditure.
8) The optimum cryogenic conditions for maximum volatile oil content and reasonable quantity
of monoterpenes were 47 to 57 kg hr-l of feed rate and -20 to -15 C of product temperature.
178

CHAPTER 5: SUMMARY AND CONCLUSIONS

CHAPTER 5
SUMMARY AND CONCLUSIONS
Spices are important agricultural commodities throughout the world due to their high unit
price. This is particularly true for India, which produces, processes, and markets spices in
domestic sector. India also exports a number of spices to earn a good amount of foreign
exchange, and black pepper (Piper nigrum L.) is one of the major spices being exported. Black
pepper is a common spice produced in oriental countries but is used worldwide for its
characteristic pungent flavour, aroma and taste. The demand for value added products viz.,
powders, volatile oils and oleoresins has been increasing every year. It is, therefore, necessary
to give due attention to this commodity with particular reference to processing, quality aspects
and value addition.
Spices are ground for obtaining value-added products like powders, pastes, oleoresins and
volatile oils. Grinding facilitates the release of aroma and flavour components, and aids in
improved and uniform mixing with food materials during preparation. Grinding or size
reduction is an important step in spice processing as it leads to losses of volatile oil and aroma
present in them. During grinding, the mill as well as the ground product get heated up due to
dissipation of mechanical energy. The temperature of the ground spice may rise to as high as 95
C. Hence, such high temperature leads to considerable loss of aroma and flavour components in
spice volatile oil for which they are valued. A spice with low flavour and aroma fetches poor
return to the processor. Therefore, the challenge is to find an appropriate method to retain these
components. Besides, spices with high fat and fibre contents are difficult to grind. In a large
scale operation where grinding has to be conducted continuously, gumming of grinder walls and
sieves results in frequent shut-off of the mill for cleaning purposes. This reduces the production
capacity with simultaneous increase in the cost of processing.
It is thus desirable to practice grinding at a low temperature. Chilling and freezing are
the possible ways to achieve a product with maximum possible retention of volatile oil
components in the powder. With the increasing use of cryogens,
179

particularly liquid nitrogen (LN2), a few studies have been attempted on grinding of spices. The
advantages of cryogenic grinding over ambient grinding system as per these reports include
reduced loss of volatile oils and hence increased flavour strength, reduced oxidation of spice oils,
increased grinding rate, and improved colour of the ground spices. Though a limited number of
research investigations have been carried out on cryogenic size reduction of spices, literature on
pilot or large scale grinding studies of spices is scanty. Spice processing industry is in need or an
appropriate technology 1'01' the manufacture of improved quality products particularly for export
purposes.
Keeping the status of the spice processing industries in mind, the present study was
initiated on black pepper in view of its importance in world trade and in Indian context. The
obj~ctives of the present research were (1) to determine the engineering properties of black pepper
seeds related to size reduction operations, (2) to study the ambient grinding characteristics of black
pepper, (3) to study the cryogenic grinding characteristics of black pepper at both laboratory and
pilot scale, and to compare with ambient grinding technique. The results of these studies and the
conclusions are mentioned briefly in the following sections.
Engineering properties
The engineering properties of black pepper such as size, shape, bulk density, angle of
respose, flowability and uniaxial compression characteristics were determined at various moisture
contents as these properties are important from the point of design of storage, processing and
conveying systems. The study basically generated design data, relating to grinding and handling .of
black pepper seeds.
The seeds of black pepper had a near spherical shape as reflected by roundness values
(close to 1) and high sphericity values (close to 100%). Angle of respose of black pepper seeds was
dependent on moisture content and was in the range of 35 to 48°. It was observed that an increase
in the moisture content would increase the angle of repose but decrease the flowability, particularly
when the moisture content was above 14%.
180

Compressive force is the most common force applied during grinding and hence uniaxial
compression and failure characteristics were determined. Individual seeds of black pepper,
subjected to uniaxial compression, showed two different zones (elastic and plastic behaviour)
during compression. An increase in the linear strain limit but decrease in deformation modulus
showed that black pepper seeds could be deformed to higher extent particularly at high moisture
contents. The failure energy remained unaltered when the moisture content of black pepper was in
the range of 11 and 17% (dry basis).
Ambient grinding
Ambient (or conventional) grinding is the commonly followed technique now in practice
among the spice processing industries wherein material as well as the grinder gets heated up during
operation which leads to significant loss in product quality. It is desirable that powder of black
pepper shall have maximum volatile oil with higher percentage of monoterpenes after grinding
which represent desirable freshness and strong peppery notes of powder.
Grinding characteristics at various feed rates using a commonly used grinding mill such as
swing hammer mill were studied. The rise of product temperature, during grinding at different feed
rates using a swing hammer mill, followed a polynomial of third order with grinding time. The
product temperature reached a high temperature at lowest feed rate. The contents of volatile oil
varied negatively with the product temperature at different feed rates. The loss of volatile oil due to
grinding varied from 11.2 to 50.7% with respect to the control sample (hand pounding) in the range
of selected feed rates. It also varied with both powder temperature and average particle size. Lower
feed rate gave a powder of finer particle sizes and higher powder temperatures but highest loss of
volatile oil. On the other hand, the high feed rate gave a powder with lower temperature and lower
loss of volatile oil which is a desirable condition for grinding.
Grinding was also carried out employing different grinding mills viz., hammer (APEX)
mill, plate (DIAF type) mill, plate mill and roller mill in addition to swing hammer mill. The
grinding characteristics were compared with hand pounding technique. The results indicated that
the quality of ground powder in terms of volatile oil content
181

depended on the type of mill employed, the product temperature and the average particle size
of the powder. Among these mills, hand pounding (control sample) and roller mill showed no
increase in temperature during grinding. The rise in temperature was highest for plate mill
though it could produce the finest particles with geometric mean particle diameter of 0.16 mm
with very low content of volatile oil. The finer the particle size of powder the higher was the
temperature of ground powder measured at the mill's outlet at steady condition, and obviously
the finer the particle size the higher was the energy expenditure. Monoterpenes were sensitive
to grinding temperatures and their volatility increased with an increase in grinding temperature.
The overall content of sesqueterpenes in the oil samples obtained from all the mills was fairly
constant and it did not depend on the type of mill. Plate (DIAF) mill was found to be better in
terms of high content of both volatile oil and content of monoterpenes which were desirable
product attributes.
Grinding was also carried out to different range of particle sizes (geometric average particle
sizes of 0.14 to 2.10 mm) as volatile oil content of powder depended on the particle size. The
results indicated that the contents of volatile oil of samples having various particle sizes at the
end of distillation were 1.48 to 2.92 mL/I00g. The particle mean diameter of about 0.7 mm was
optimum which gave the desirable highest volatile oil content. The time for volatile oil
distillation of fine to coarse powdered samples varied from 180 to 390 min, respectively
indicating that the finer were the powder particles the faster was the distillation. The gas
chromatographic analysis of volatile oil showed that higher ratio of monoterpenes to
sesqueterpenes was present in coarse particles, which gave a very strong peppery note. Finer
particle sizes contained volatile oil that gave spicy, sweet and flowery notes. The content of
sesqueterpenes varied marginally (0.5 to 0.7 mL/I00g) as compared to the content of
monoterpenes, which varied between 0.5 and 2.1 mL/100g for the range of particle sizes
studied. However, the physical properties viz., specific gravity, refractive index and optimal rotation
of volatile oils of samples obtained for different particles sizes were constant.
In brief, during ambient grinding, the contents of volatile oil of the spice powder
varied negatively with the product temperature at different feed rates. When different mills
with varied grinding capacity were used, contents of volatile oil depended on product
temperature, particle size and also on the type of mill. Grinding to a particle size

of about 0.70 mm was optimum for highest content of volatile oil in the powder. As far as the
quality of volatile oil was concerned, the monoterpenes were sensitive to high temperature but
the sesqueterpenes were not much affected by high temperature.
Cryogenic grinding
Cryptogenic grinding of black pepper was carried out to study the grinding characteristics as
well as to compare the quality of the ground powders with that of the samples obtained by
ambient grinding. This study was divided into two aspects, viz., grinding at laboratory scale
followed by pilot scale trials to generate data which is close to industrial situation.
The laboratory scale (200 g per batch) trials were conducted at four different feed material
temperature conditions viz., high temperature, ambient, chilled and cryogenic (LN2)
temperatures. The results indicated that the particle size of black pepper powder ground by
cryogenic method was the finest as compared to other three methods. The cryogenic and chilled
temperature methods of grinding yielded similar quantities of volatile oil as compared to low
quantities in ambient and high temperatures grinding methods. There was a gain of about 36%
in the content of volatile oil by cryogenic grinding method as compared to high temperature
grinding method; the latter had a product temperature of 62 C. Chilled water technique was not
adequate to markedly reduce the temperature rise during grinding of the product. Gas
chromatographic analysis also showed that in cryogenic grinding technique, the contents of
monoterpenes was higher compared to those obtained by the other methods. The content of
sesqueterpenes was fairly similar in all four grinding methods. Cryogenic grinding technique
emerged as the most desirable technique during laboratory scale experimentation.
The trials on pilot scale grinding (4 kg/batch) indicated that the control sample in
ambient grinding reached product temperatures of 86 and 53 C at the feed rates of 15 and 35 kg
hr-1, respectively indicating that low feed rate would give higher temperature which would be
undesirable. The product temperature was controlled and maintained at a range of -15 to -60 C
using liquid nitrogen, and the feed rate were in the range of 7 to 60 kg hr-1 as per the
experimental design. The average volatile oil content in case of
183

cryogenic grinding was 1.7 mL/100g whereas in ambient grinding it was only 0.9 mL/I00g. The
loss of volatile oil in the case of ambient grinding was about 50% as compared to cryogenic
grinding.
The gas chromatographic analysis of volatile oil indicated that the ratio of monoterpenes
to sequeterpenes varied from 1.35 to 1.85 in the case of cryogenic grinding which is desirable,
whereas, the ambient ground samples had a very low ratio (0.22 to 0.31). The loss of
monoterpenes was high in ambient grinding, as there was a loss of volatile oil in terms of every
monoterpene'compound. Cryogenic grinding technique was found to be superior to ambient
grinding in terms of content of monoterpenes in the powder. It may be mentioned here that
monoterpenes provided the freshness, aroma and body to the volatile oil with a strong peppery
note whereas sesquiterpenes gave the spicy note. Hence, it is desirable to have more monoterpenes
in the volatile oil to achieve a good quality product. This quality was established in both
laboratory scale and pilot scale cryogenic grinding operations. In pilot scale grinding, the loss of
volatile oil in ambient grinding was as high as 50% as compared to cryogenic grinding. Mill
choking was severe in ambient grinding which reduced the grinding rate due to frequent stoppage
of mill for maintenance. Such phenomenon was absent in case of cryogenic grinding as oils got
solidified and grinding operation was unhindered which resulted in enhanced grinding rate which
meant higher production capacity. Ambient grinding resulted in higher loss of volatile oils to
atmosphere in the form of vapours, due to higher grinding temperature, which may cause health
hazards (viz., ear, nose and throat diseases) to mill workers. This vapourisation was minimum
during cryogenic grinding as the vapours of volatile oil were retained within the product. Sensory
studies indicated that cryogenically ground samples were distinctly high in top notes which
represented freshness, and marginally high 'in basic notes with very less undesirable defective
notes. Hence, the quality of cryogenically ground sample was better than the ambient ground
samples.
The effect of grinding variables (feed rate and product temperature of the samples during
cryogenic grinding) on grinding and product characteristics had been determined employing
response surface methodology. The experimental results were fitted to second order polynomials.
These polynomials were able to relate the dependent variables viz., volatile oil, particle diameter,
contents of monoterpenes and sesqueterpenes but failed to
184
do so for energy expenditure. The optimum cryogenic grinding conditions considering
maximum volatile oil content and reasonably high quantity of monoterpenes were 47 to 57 kg
hr-1 of feed rate and -20 to -15 C of product temperature.
In brief, it can be mentioned that the present research generated data on engmeenng
properties of black pepper related to size and shape, angle of respose, flowability, and
compression characteristics at various moisture contents. These properties are important from
the points of design of storage, processing and conveying systems, and for design of suitable
grinding system for black pepper seeds. Data were also generated for grinding of black pepper
employing ambient and cryogenic grinding systems. The superiority of the latter system was
established and grinding conditions were optimised considering the important quality
characteristics. This research clearly proved that cryogenic grinding improved the content of
volatile oil in the powder by increasing the flavour strength to almost double. It has also
increased the grinding rate by reducing choking of mills and grinding surfaces. It is hoped that
cryogenic grinding technology would be widely used by the spice processing industries to
enhance the quality of the ground product. It is also desirable that similar type of data would be
generated for other heat sensitive spices in near future. A beginning has been made here.
185

REFERENCES
Adams, R.P. 1989. Identification of Essential Oils by Ion-trap Mass Spectroscopy. Academic Press. San Diego. California.
Aguerre, R.J., Gabitto, J.F., and Chirife, 1. 1985. Utilisation of Fick's second law for the evaluation of diffusion coefficients in food processes controlled by internal diffusion. Journal of Food Technology. 20: 623-629.
Anon. 1962. Better way to mill spices. Food Engineering. 34: 64-65.
Anon. 1990. Liquid nitrogen injection system for food packaging. Trends in Food Science and Technology. 4: 134-138.
Anon. 1993. Catalogue of grinding equipment. M/s Hosakawa Alpine. Germany.
Anon. 1994. Catalogue of grinding equipment. M/s Kemutec. United Kingdom.
Anon. 1995. Ascent. Times of India (Newspaper). Dated 25th January.
Anon. 2001a. Statistics, Spices Board India, Cochin, India (Website).
Anon. 2001b. Statistics. Indian Food Industry. Jan-Feb, Vol 20(1). India.
AOAe. 1980. Official Methods of Analysis, 13th Ed., Association of Official Analytical Chemists, Washington De.
ASTA 1985. Official Analytical Methods for Spices. 2nd Ed., American Spice Trade Association, New York. '
Austin, L.G. 1984. Size reduction of solids: Crushing and grinding equipment. In Handbook of Powder Science and Technology. Edited by M.E. Fayed and L. Otten, Van Nostrand Reinbold, New York. 562-606.
Bay, P.M.A, Bourne, M.e., and Taylor, AG. 1996. Effect of moisture content on compressive strength of whole snap bean. (Phaseolus vulgaris L.) seeds and separated cotyledons. International Journal of Food Science and Technology. 31: 327-331.
Beaven, e.H.J. 1980. How many measurements? Proceedings on Powder Europa, Weisbaden, Germany. 22-24 June, Technical Sessions 1, 1-25.
Bond, F.e. 1952. The third theory of comminution. Mineral Engineering Transactions. AIME, 193: 484-494.
186

Brown, R.L., and Richards, J.e. 1970. Principles of Powder Mechanics. Pergamon Press, Oxford, England.
Buckingham, J. (Editor) 1995. Dictionary of Organic Compounds. 5th Ed., Chapman and Hall Publication, New York.
Burdock, G.A. (Editor) 1995. Fenaroli's Handbook of Flavour Ingredients. 3rd Ed., CRC Press, London.
Carr, R.L. 1976. Powder and granule properties and mechanics. In Gas-Solids Handling in the
Processing Industries. Edited by J .M.Marchello and A. Gomezplata, Marcel Dekker, New York.
Charles, R.J. 1952. Energy-size reduction relationships in comminution. Transactions AIME. 208: 80-88.
Cleef, J.V. 1991. Powder Technology. American Scientist. 79: 304-315.
Coulson, J.M., and Richardson, J.F. 1978. Chemical Engineering. 3rd Ed., Pergamon Press, Oxford, England.
Crank, J. 1970. The Mathematics of Diffusion, 2nd Ed., Clavendron Press. Oxford, England.
Davies, N.W. 1990. Gas chromatographic retention indices of monoterpenes and sesqueterpenes on methyl silicone and carbGwax 20 M phases. Journal of Chromatograph. 503: 1-24.
Dealy, J.M. 1982. Rheometers for molten plastics. Van Nostrand-Reinhold Co., New York.
Dutta, S.K., Nema, V.K., and Bhardwaj, R.K. 1988. Physical properties of gram. Journal of Agricultural Engineering Research. 39: 259-268.
Farrel, A.W. 1976. Food Engineering Systems - Operations. The AVI Publishing Co. Ltd. West Port, Connecticut.
Fellows, P. 1988. Food Processing Technology: Principles and Practice. Ellis Horwood, New York.
Fennema, O.R., and Powrie, W.O. 1964. Fundamentals of low temperature food preservation. Advanced Food Research. 13: 220 (Cited by Kim and Hung, 1994).
Gekas, V. 1992. Transport Phenomena of Foods and Biological Materials. CRC Press, London.
187

George, R.M. 1993. Freezing processes used in the food industry. Trends in Food Science and Technology. 4: 134-138.
Gopalan, c., Rama Sastri, B.V., and Balasubramanian, S.c. 1993. Nutritive Value of Indian Foods. National Institute of Nutrition. Hyderabad, India.
Gopalkrishnan, M., Luxmi Varma, R., Padmakumari, K.P., Symon, B., Umma, H., and Narayan, C.S: 1991. Studies on cryogenic grinding of cardamom. Indian Perfumer. 35(1): 1-7.
Govindarajan, V.S. 1977. Pepper-chemistry, technology and quality evaluation. CRC Critical Reviews in Food Science and Nutrition. 9: 1 L5-225.
Griffith, A.A. 1920. Phenomena of rupture and flow in solids. Philosophical Transactions of the Royal Society of London. 221 A:163. (Cited by Cleef, 1991).
Gupta, R. 1992. Use of liquid nitrogen to freeze-in the freshness. Seafood Export Journal. April: 33-39.
Hasselstrom, T., Hewitt, EJ., Konigsbacher, K.S., and Ritter, JJ. 1957. Pepper analysis-composition of volatile oil of black pepper: Piper nigrum. Agricultural and Food Chemistry. 5(1): 53- 55.
Hixon, L., Prior, M., Prem H., and Cleet, J.V. 1990. Sizing materials by crushing and grinding. Chemical Engineering. 97 (11): 94-103.
Hoki, M., and Tomita, K. 1976. Moisture effects .on mechanical strength of soybeans. Bulletin of the Faculty of Agriculture. Mie University, Tsu, Japan. 51: 103-110.
Holtnes, J .A. 1957. A contribution to the study of comminution: a modified form of Bond's law, Transactions of Institutional Chemical Engineering. 35:125-156.
Hubert, R.MJ. 1991. Spices and condiments 1. Ch. 12, in Volatile Compounds in Food and Beverages, Marcel Dekker, Inc. New York.
Jennings, W., and Shibamoto, T. 1980 (Editors). Qualitative Analysis of Flavour and Fragrance Volatiles by Glass Capillary Gas Chromatography. Academic Press Inc. (London) Ltd. New York.
Khuri, A. 1., and Cornell, J.A. 1989. Re5ponse Surfaces: Designs and Analyses. Marcel Dekker, Inc., New York.
Kick, F. 1885. Das gesetz der proportionalen widerstande und seine anwesdungen Arthur Felix, Leipzig (Cited by Loncin and Merson, 1979).
188

Kim, N.K., and Hung, Y.c. 1994. Freeze cracking in food as affected by physical properties. Journal of Food Science. 59(3): 669-674.
Landwehr, D., and Pahl, M.H. 1986. Cold grinding of spices. (Cited by Singh and Goswami, 2000).
Lewis, Y.S., Krishnamurthy, N., Nambudari, E.S., and Mathew, A.G. 1969. Composition of pepper oils. Perfumery Essential Oil Record. 60: 259-262.
Li, S., Ge, S., Huang, Z., Wang, Q., Zhao, H., and Pan, H. 1991. Cryogenic grinding technology for traditional chinese herbal medicine. Cryogenics. 31: 136-137. (Cited by Singh and Goswami, 1999a).
Little, T.M., and Hills, F.J. 1978. Agricultural Experimentation: Design and Analysis. John Wiley, New York.
Liu, M., Haghighi, K., Stroshine, R.L., and Ting, E.C. 1990. Mechanical properties of the soybean cotyledon and failure strength of soybean kernels. Trarrsactions of the American Society of Agricultural Engineers. 33: 559-566.
Loncin, M., and Merson, R. 1979. Food Engineering: Principles and Selected Applications. Academic Press. New York.
McAlpine. 1991. Spices in pharmaceuticals. Report of the third meeting of the international spice group Kingston, Jamaica, 18-23 November. ITC UNCTAD/GAIT. 118-124.
McCabe, W.L., and Smith, J.C., 1976, Unit Operations of Chemical Engineering. 3rd Ed., McGraw-Hill Kogakusha Ltd., New York.
Mckee, L.H., Thompson, L.D., and Harden, M.L. 1993. Effect of three grinding methods on some properties of nutmeg. Lebensmittel Wissenschafi und Technologie. 26: 121- 125.
Medalia, A.I. 1980. Three-dimensional shape parameters. In Testing Characterisation of Powders and Fine Particles. Edited by J.K. Betldow and T. Meloy. Heyden & Son Ltd., London.
Miller, G. 1951. New nitrogen technique assures fine grinding-in only one pass. Food Engineering. 23: 36-37.
Mohsenin, N.N. 1980. Physical Properties of Plant and Animal Materials. 2nd Ed. Gordon and Breach Science Publishers. New York.
189

Mohsenin, N.N. 1986. Physical Properties of Plant and Animal Materials. 3rd Ed. Gordon and Breach Science Publishers. NewYark.
Myers, RH. 1971. Response Suiface Methodology. Allyn and Bacon, Inc., Boston, USA.
Narasihman, S., Nagin Chand., Rajalakshmi, D., and Indiramma, AR 1990. Quality of powdered black pepper (Piper nigrum L.) during storage. 1. Sensory and physicochemical analysis. Journal of Sensory Studies. 4: 229-240.
Narasihman, S., Rajalakshmi, D., and Nagin Chand. 1992. Quality of powdered black pepper (Piper nigrum L.) during storage. 1. Principal components analysis of GC and sensory profiles. Journal of Food Quality. 15: 67-83.
Parker, S.P. 1984. Dictionary of Science and Engineering, McGraw Hill, New Yark.
Paulsen, RM. 1978. Fracture resistance of soybeans to compressive loading. Transactions of the American Society of Agricultural Engineers. 21: 1210-1216.
Peleg, M. 1977. Operational conditions apd the stress-strain relationship of solid foodstheoretical evaluation. Journal Texture Studies. 8: 283-295.
Peleg, M. 1983. Physical characteristics of food powders. In Physical Properties of Foods. edited by M. Peleg and E.B. Bagley. A VI Publishing Co., Westport. Connecticut. pp 293323.
Peleg, M., and Calzada, J.P. 1976. Stress relaxation of deformed fruit and vegetables. Journal Food Science. 41: 1325-1329.
Perry, J.H. 1950. Chemical Engineers' Hand Book. 3rd Ed., McGraw Hill Book Co. Inc., New York. pp 153-165.
Pesek, C.A, and Wilson, L.A 1986. Spice quality: Effect of cryogenic and ambient grinding on colour. Journal of Food Science. 51: 1386-1388.
Pesek, C.A, Wilson, L.A, and Hammond, E.G. 1985. Spice quality: Effect of cryogenic and ambient grinding on volatiles. Journal of Food Science. 50: 599-601.
Peter, K.V. 1999. Spice research and development: An updated overview. Processed Food Industry. September. pp 11-15.
Pino, J., Rodriguez-Feo, G., Borges, P., and Rosado, A 1990. Chemical and sensory properties of black pepper oil. Nahrung. 34(6): 555-560.
Prasher, C.L. 1987. Crushing and Grinding Process Handbook. John Wiley & Sons Ltd., New York.
190

Pruthi, lS. 1974. Spices and Condiments. National Book Trust. New Delhi. India.
Pruthi, J.S. 1980. Spices and condiments; chemistry, ,microbiology, technology. Advances in Food Research. Supplement 4. Academic Press Inc., New Yark. pp 206-209.
Pruthi, J .S. 1991. Spice processing. Report of the Third Meeting of the International Spice Group Kingston. Jamaica. 18-23 Nov. ITC UNCTAD/GATT. 36-60.
Pruthi, J.S. 1998. Quality Assurance in Spices and Spice Products: Modern Methods of Analysis. Allied Publisher Ltd., New Delhi. India.
Pruthi, J.S., and Misra, B.D. 1963. Spice 'Bulletin. 3: 3-5. (Cited by Singh and Goswami 1999a).
Rasmussen, C.L., and Olson, R.L. 1972. Freezing methods as related to cost and quality. Food Technology. 32-47.
Reeve, RM., and Brown, M.S. 1968. Historical development of green bean pod as related to culinary texture. 2. Structure and composition at edible maturity. Journal of Food Science. 33: 326 (Cited by Kim and Hung, 1994)
Reid, W.S., and Stark, R 1974. Design and development of a batch fluidized bed freezer and fluidized bed dryer far diced food products. Journal of Institution of Canadian Science and Technology. 7(4): 236-242.
Rittinger, P.R 1867. Lehrbuch der aujbereitungskunde. Berlin. (Cited by Loncin and Merson, 1979).
Rumpf Hans. 1990. Particle Technology (English ed.), Powder Technology Series. Chapman and Hall, London.
Salzer, U. J. 1977. The analysis of essential oils and extracts (oleoresins) from seasonings. A critical review. CRC Critical Review in Food Science and Nutrition. 9: 345-373.
Sebok, A., Csepregi, I., and Heke, G. 1991. Cracking of fruits and vegetables during freezing and
the influence of precooling. Presented at the International Congress of Refrigeration. Montreal Convention Centre, Montreal. Canada, Aug 10-17. (Cited by Kim and Hung, 1994).
Selman, J.D., Rice, P., and Abdul Rezzak, R.K. 1983. A study of the apparent diffusion coefficients for solute losses from carrot tissue.during blanching in water. Journal of . Food Technology. 18: 427-440.
191

Sharp, J. 1991. Spices in cosmetics and perfumery. Report of the Third Meeting of the International Spice Group Kingston. Jamaica. 18-23 Nov. ITC UNCT AD IGA TT. 116-117 .
Singh, KK, and Goswami, T.K 1999a. Design of a cryogenic grinding system for spices.
Journal of Food Engineering. 39: 359-368.
Singh, KK, and Goswami, T.K 1999b. Studies on cryogenic grinding of cumin seed. Journal of Food Process Engineering. 22: 175-190.
Singh, KK, and Goswami, T.K 2000. Cryogenic grinding of cloves. Journal of Food Processing and Preservation. 24: 57-71
Snedecor, G.W., and Cochran, W.G. 1968. Statistical Methods. 6th ed., Oxford and IBH Publishing Co., Calcutta, India.
Spiro, M., and Hunter, J.E. 1985. The kinetics and mechanism of caffeine infusion from coffee: the effect of roasting. Journal of Science, Food and Agriculture. 36: 871-876.
Strause. D. 1967. Investigation of nutmeg powder. Deutsche Lebensmitteln Rundschrift. 63: 239 (Cited by Pruthi, 1991)
Szczesniak, A.S. 1983. Physical properties of foods: what they are and their relation to other food properties. In Physical Properties of Foods, Edited by M. Peleg and E.B. Bagley, A VI Publication Co., Westport. Connecticut. 1-41.
Thomson, F.M. 1984. Storage of particulate solids. In Handbook of Powder Science and Technology. Edited by M.E. Fayed and L. Otten. Van Nostrand Reinhold Co., New York. 365-463.
Uday Sankar, K 1989. Studies on the physicochemical characteristics of volatile oil from pepper (Piper nigrum) extracted by supercritical carbon dioxide. Journal of Science, Food and Agriculture. 48: 483-493.
Visvanathan, R., Varadharaju, N., Gothandapani, L., and Sreenarayanan, V. V. 1990. Effect of moisture content on angle of repose and bulk density of selected foodgrains. Journal of Food Science and Technology. 27: 133-135.
Voisey, P.W., and deMan, 1.M. 1976. Applications of instruments for measuring food texture. In Rheology and Texture in Food Quality. Edited by 1.M. deMan, P.W. Voisey, V.F. Rasper and D.W. Stanley. A VI Publishing Co., Westport, Connecticut. 142-243.
Walker, W.H., Lewis, W.K, McAdams, W.H., and Gilliland, E.R. 1937. Principles of Chemical Engineering. 3rd Ed., McGraw Hill, New York.
192

Watanabe, et al. 1978. Cryomilling of nutmeg. Nippon Shokuhim Kogyo Gakkaijah. 25(8), 275-280. (Cited by Pruthi, 1980)
Weaver, M.L., Huxsoll, c.c., and Ng, K.C. 1980. Sequenlial heal cool peeling of lomaloes. Food Technology. February. 34(1): 40-43.
Wilhon, T. 1987. Advances in cryogenic chilling and freezing of foods. Food Science and
Technology Today. 1: 79-83.
Wistreich, H.E., and Schafer, W.F. 196:? Freeze-grinding ups product quality. Food Engineering. 34: 62-63.
Wolf, T., and Pahl, M.H. 1990. Cold grinding of caraway seeds in impact mill. 41(10): 596-604. (Cited by Singh and Goswami, 1999b) ..
########
193

I, Mr. C. T. Murthy, (born on July 18, 1965), have obtained degree in mechanical engineering from Karnataka Regional Engineering College, Suratkal, in the year 1987 and obtained my master degree in management studies from Indian Institute of Science, Bangalore in the year 1989.
Later on, worked as Deputy Engineer in Bharat Electronics, Ghaziabad and as SeniorScientific Officer in the Department of Science and Technolgy, New Delhi for a brief periodof 2 years. Then joined Central Food Technological Research Institute (CFTRI), Mysore, asScientist in the year 1991, where I worked in the area of application of cryogenics for spiceprocessing. During this period, I was also principal investigator of a prestegious project oncryogenic grinding of spices sponsored by Department of Science and Technology, NewDelhi. I have six research papers and four patents to my credit, in the area of food engineering.I was also a teaching faculty of food engineering at CFTRI. I also served in the editorial boardof the journal Indian Food Industry, as one of the editors. I am a life member professionalbodies viz., AFST (I) and Indian Cryogenic Council. Presently, I am associated withDepartment of Transport, Government of Karanataka as Regional Transport Officer.
My research publications in the area related to this thesis are,
Murthy, C.T. 1995. Cryogenics for food applications. Indian Food Industry. Sept-Oct, Vol. 14(5): 24-33.
Murthy, C.T., Krishnamurthy, N., Ramesh, T. and Srinivasa Rao, P.N. 1995. Effect of grinding methods on the retention of pepper volatiles. journal of Food Science and Technology. 33(4): 299-301.
Murthy, C.T., and Bhattacharya. S. 1998. Moisture dependent physical and uniaxial compression properties of black pepper. journal of Food Engineering. 37: 193-205.
Murthy, C.T., Meenakshi Rani, and Srinivasa Rao, P.N. 1999. Optimal grinding characteristics of black pepper for essential oil yield. journal of Food Process Engineering. 22: 161-173.
######
(xii).