Crustal stress field in Yunnan: implication for crust ... · equipped with a Guralp CMG-3EPC...
11
RESEARCH PAPER Crustal stress field in Yunnan: implication for crust-mantle coupling Zhigang Xu . Zhouchuan Huang . Liangshu Wang . Mingjie Xu . Zhifeng Ding . Pan Wang . Ning Mi . Dayong Yu . Hua Li Received: 17 November 2015 / Accepted: 17 February 2016 / Published online: 1 April 2016 Ó The Author(s) 2016. This article is published with open access at Springerlink.com Abstract We applied the gCAP algorithm to determine 239 focal mechanism solutions 3:0 M W 6:0 ð Þ with records of dense ChinArray stations deployed in Yunnan, and then inverted 686 focal mechanisms (including 447 previous results) for the regional crustal stress field with a damped linear inversion. The results indicate dominantly strike-slip environment in Yunnan as both the maximum (r 1 ) and minimum (r 3 ) principal stress axes are sub-hori- zontal. We further calculated the horizontal stress orien- tations (i.e., maximum and minimum horizontal compressive stress axes: S H and S h , respectively) accord- ingly and found an abrupt change near *26°N. To the north, S H aligns NW-SE to nearly E-W while S h aligns nearly N-S. In contrast, to the south, both S H and S h rotate laterally and show dominantly fan-shaped patterns. The minimum horizontal stress (i.e., maximum strain axis) S h rotates from NW-SE to the west of Tengchong volcano gradually to nearly E-W in west Yunnan, and further to NE-SW in the South China block in the east. The crustal strain field is consistent with the upper mantle strain field indicated by shear-wave splitting observations in Yunnan but not in other regions. Therefore, the crust and upper mantle in Yunnan are coupled and suffering vertically coherent pure-shear deformation in the lithosphere. Keywords Tibet Yunnan Focal mechanism solution Stress field Crust-mantle coupling 1 Introduction The tectonic evolution of the Tibetan plateau (Fig. 1a), especially its rapid uplift, has always been the focus in geo- sciences. Different mechanisms have been proposed among which the lateral lithospheric extrusion (e.g., Tapponnier et al. 1982, 2001), thickening Asian crust (England and Houseman 1989), and ductile mid-lower crustal flow (e.g., Royden et al. 1997, 2008) are three most popular candidates. The structures and dynamics in SE Tibet are essentially important for understanding the tectonic evolution of the plateau. However, there is ongoing debates on whether the crust and upper mantle are coupled or not beneath Yunnan SE to Tibet on the basis of the comparison between the crustal strain field inferred from GPS observations and the upper-mantle strain field inferred from teleseismic shear-wave (i.e., SKS, SKKS, and PKS) splitting analysis (e.g., Flesch et al. 2005; Wang et al. 2008; Huang et al. 2015a). Yunnan is located in the southern part of the North- South seismic zone that is characterized as high seismicity and heavy seismic hazards (Fig. 1b). The focal mechanism solutions of small-to-moderate earthquakes are important indicators of the stress field near the source, i.e., generally in the crust under continents. Thus inverting for the focal Electronic supplementary material The online version of this article (doi:10.1007/s11589-016-0146-3) contains supplementary material, which is available to authorized users. Z. Xu Z. Huang (&) L. Wang M. Xu P. Wang N. Mi D. Yu H. Li State Key Laboratory for Mineral Deposits Research, School of Earth Sciences and Engineering, Nanjing University, Nanjing 210046, China e-mail: [email protected] Z. Xu Z. Huang L. Wang M. Xu P. Wang N. Mi D. Yu H. Li Institute of Geophysics and Geodynamics, Nanjing University, Nanjing 210046, China Z. Ding Institute of Geophysics, China Earthquake Administration, Beijing 100081, China 123 Earthq Sci (2016) 29(2):105–115 DOI 10.1007/s11589-016-0146-3
-
Upload
phunghuong -
Category
Documents
-
view
214 -
download
0
Transcript of Crustal stress field in Yunnan: implication for crust ... · equipped with a Guralp CMG-3EPC...
RESEARCH PAPER
Crustal stress field in Yunnan: implication for crust-mantlecoupling
Zhigang Xu . Zhouchuan Huang . Liangshu Wang .
Mingjie Xu . Zhifeng Ding . Pan Wang . Ning Mi .
Dayong Yu . Hua Li
Received: 17 November 2015 / Accepted: 17 February 2016 / Published online: 1 April 2016
� The Author(s) 2016. This article is published with open access at Springerlink.com
Abstract We applied the gCAP algorithm to determine
239 focal mechanism solutions 3:0�MW � 6:0ð Þ with
records of dense ChinArray stations deployed in Yunnan,
and then inverted 686 focal mechanisms (including 447
previous results) for the regional crustal stress field with a
damped linear inversion. The results indicate dominantly
strike-slip environment in Yunnan as both the maximum
(r1) and minimum (r3) principal stress axes are sub-hori-
zontal. We further calculated the horizontal stress orien-
tations (i.e., maximum and minimum horizontal
compressive stress axes: SH and Sh, respectively) accord-
ingly and found an abrupt change near *26�N. To the
north, SH aligns NW-SE to nearly E-W while Sh aligns
nearly N-S. In contrast, to the south, both SH and Sh rotate
laterally and show dominantly fan-shaped patterns. The
minimum horizontal stress (i.e., maximum strain axis) Shrotates from NW-SE to the west of Tengchong volcano
gradually to nearly E-W in west Yunnan, and further to
NE-SW in the South China block in the east. The crustal
strain field is consistent with the upper mantle strain field
indicated by shear-wave splitting observations in Yunnan
but not in other regions. Therefore, the crust and upper
mantle in Yunnan are coupled and suffering vertically
coherent pure-shear deformation in the lithosphere.
Keywords Tibet � Yunnan � Focal mechanism solution �Stress field � Crust-mantle coupling
1 Introduction
The tectonic evolution of the Tibetan plateau (Fig. 1a),
especially its rapid uplift, has always been the focus in geo-
sciences. Different mechanisms have been proposed among
which the lateral lithospheric extrusion (e.g., Tapponnier et al.
1982, 2001), thickening Asian crust (England and Houseman
1989), and ductile mid-lower crustal flow (e.g., Royden et al.
1997, 2008) are threemost popular candidates. The structures
and dynamics in SE Tibet are essentially important for
understanding the tectonic evolution of the plateau. However,
there is ongoing debates on whether the crust and upper
mantle are coupled or not beneath Yunnan SE to Tibet on the
basis of the comparison between the crustal strain field
inferred from GPS observations and the upper-mantle strain
field inferred from teleseismic shear-wave (i.e., SKS, SKKS,
and PKS) splitting analysis (e.g., Flesch et al. 2005; Wang
et al. 2008; Huang et al. 2015a).
Yunnan is located in the southern part of the North-
South seismic zone that is characterized as high seismicity
and heavy seismic hazards (Fig. 1b). The focal mechanism
solutions of small-to-moderate earthquakes are important
indicators of the stress field near the source, i.e., generally
in the crust under continents. Thus inverting for the focal
Electronic supplementary material The online version of thisarticle (doi:10.1007/s11589-016-0146-3) contains supplementarymaterial, which is available to authorized users.
Z. Xu � Z. Huang (&) � L. Wang � M. Xu � P. Wang � N. Mi �D. Yu � H. LiState Key Laboratory for Mineral Deposits Research, School of
Earth Sciences and Engineering, Nanjing University,
Nanjing 210046, China
e-mail: [email protected]
Z. Xu � Z. Huang � L. Wang � M. Xu � P. Wang � N. Mi �D. Yu � H. LiInstitute of Geophysics and Geodynamics, Nanjing University,
Nanjing 210046, China
Z. Ding
Institute of Geophysics, China Earthquake Administration,
Beijing 100081, China
123
Earthq Sci (2016) 29(2):105–115
DOI 10.1007/s11589-016-0146-3
mechanisms in Yunnan may help to understand the stress/
strain field in the crust, which is important for discussing
the crust-mantle coupling/decoupling model in SE Tibet.
Many previous researchers determined the earthquake
focal mechanisms there with such an approach and studied
the stress field in different blocks as well as the influence of
the active faults (e.g., Xu et al. 1987, 2010; Xie et al. 1993;
Qian et al. 2011; Cui et al. 2006; Ma et al. 2008; Luo et al.
2014). Zhao et al. (2013) further derived the regional stress
field in Yunnan through a damped linear inversion
(Hardebeck and Michael 2006) using the focal mechanisms
obtained from records of the permanent stations and the
gCMT catalogue. They found that Yunnan is under a
strike-slip faulting regime dominated by horizontal maxi-
mum and minimum principle stresses and that the orien-
tation of the maximum principle stress axis clearly follows
the surface horizontal velocity field from GPS observations
(Zhao et al. 2013).
In this study, we first obtained the focal mechanism
solutions of 239 events 3:0�MW � 6:0ð Þ recorded by
dense ChinArray stations deployed in Yunnan with the
gCAP algorithm. The dense stations allows us to determine
the focal mechanisms for earthquakes of magnitude down
to MW 3:0 (compared with MW � 3:4 with permanent sta-
tions in previous studies), which provides better space
coverage. We then inverted the improved dataset for the
regional stress field with a damped linear inversion
(Hardebeck and Michael 2006) and compared it with the
upper-mantle strain field indicated by shear-wave splitting
measurements. The results suggest coupled crust and
mantle in Yunnan, which improves our understanding of
the tectonic evolution of the Tibetan Plateau.
2 Focal mechanism solutions
The waveform used in this study is recorded by 343
portable stations (Fig. 1a) of the ChinArray project
deployed in SE Tibet (mostly in Yunnan province) during
August 2011 to December 2013. Most of the stations were
equipped with a Guralp CMG-3EPC three-component
broadband seismometer and a Reftek-130 digitizer. The
sampling rates are 100 samples per second. We collected a
total of 372 local events with 3.0 B MW B 6.0 occurred in
this region.
In this study, we used the generalized Cut-and-Paste
(gCAP) method (Zhao and Helmberger 1994; Zhu and
Helmberger 1996; Zhu and Ben-Zion 2013) to determine
the seismic moment tensors of the local events. The
method selects five phase windows (i.e., two P-wave
windows on the vertical and radial components and three
S-wave windows on all three components) for
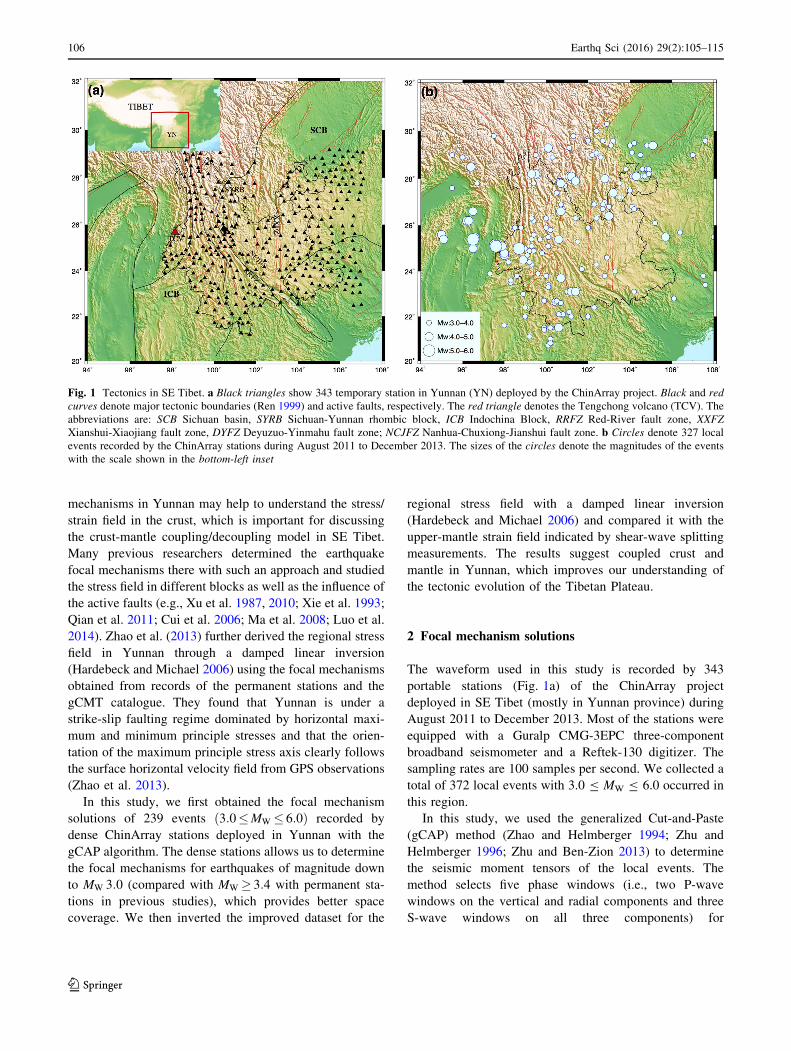
Fig. 1 Tectonics in SE Tibet. a Black triangles show 343 temporary station in Yunnan (YN) deployed by the ChinArray project. Black and red
curves denote major tectonic boundaries (Ren 1999) and active faults, respectively. The red triangle denotes the Tengchong volcano (TCV). The
abbreviations are: SCB Sichuan basin, SYRB Sichuan-Yunnan rhombic block, ICB Indochina Block, RRFZ Red-River fault zone, XXFZ
Xianshui-Xiaojiang fault zone, DYFZ Deyuzuo-Yinmahu fault zone; NCJFZ Nanhua-Chuxiong-Jianshui fault zone. b Circles denote 327 local
events recorded by the ChinArray stations during August 2011 to December 2013. The sizes of the circles denote the magnitudes of the events
with the scale shown in the bottom-left inset
106 Earthq Sci (2016) 29(2):105–115
123
3-component seismograms recorded at each station. The
synthetic waveforms were modeled with the F-K algorithm
(Aki and Richards 2002; Zhu and Rivera 2002). The 1D
velocity model (Fig. 2a) was derived from the layered
model from seismic exploring (e.g., Wang et al. 2003). The
fit between synthetic and observational seismograms is
calculated separately for the short-period P-wave and long-
period S-wave windows. Different time-shifts and weights
were used for P and S wave windows to reduce to uncer-
tainties induced by 1D velocity model and to avoid the
dominance of surface wave, respectively. The grid-search
algorithm is applied to search for the optimal moment
tensors that minimize the misfit between the synthetic and
observational waveforms.
Figure 2 shows the 1D velocity model and an example
of gCAP solution for an MW 4.1 event occurring on 16
October 2011. We only used the records at stations with
epicentral distances smaller than 400 km. Figure 2c
shows both the synthetic and observational waveforms.
The correlation coefficient is generally greater than 0.7 for
P-wave windows (80 %) and greater than 0.8 for S-wave
windows (90 %), which indicates that the result is reliable.
Finally, we obtained 239 robust focal mechanism solutions
from the 372 events analyzed (Table S1). Most of the event
occurred at depths of\20 km and have the magnitudes of
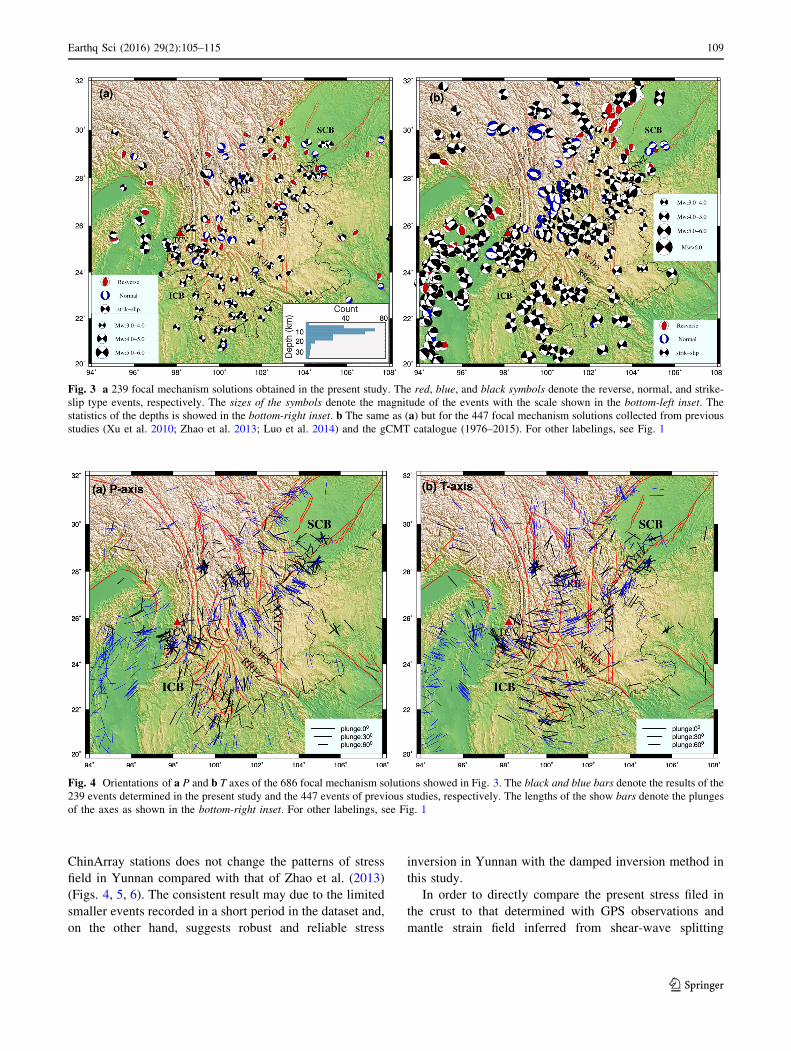
MW 3.0–4.0 (Fig. 3a). The general pattern of the focal
mechanisms (Fig. 3a) is similar to previous studies
(Fig. 3b; Tables S2–S4) (e.g., Xu et al. 2010; Zhao et al.
2013; Luo et al. 2014). Most of the earthquakes are strike-
slip events, which is consistent with the dominant strike-
slip regime in Yunnan due to the India-Asian collision
(e.g., Tapponnier et al. 1982, 2001). However, we also
found some normal and thrust type events in south Yunnan
(i.e., Indochina Block) (Fig. 3a) that were not visible in
previous studies with permanent stations (Fig. 3b). It may
indicate that the occurring of smaller events (*MW 3.0) is
affected significantly by local structures in smaller scale
(e.g., Scholz 2002; Huang et al. 2011b). In contrast, for
larger events (MW C 3.4), the regional stress field is more
important.
The stress field inferred from the focal mechanisms
shows important transition from north to south at 26�–28�N(Fig. 4). To the north, the P-axis mainly aligns E-W while
the T-axis is nearly N-S. It reflects the E-W compression
regime because the eastern expansion of the Tibetan Pla-
teau is blocked by the stable Sichuan basin (i.e., Yangtze
Craton). To the south, the dominant P and T axes are N-S
and E-W, respectively. However, both P and T axes show
important rotations. The P-axis rotates anticlockwise from
NE-SW in the west gradually to NW-SE in the east while
T-axis rotates anticlockwise from NW-SE in the west to
NE-SW in the east.
3 Stress field inversion
The earthquakes occurred on a preexisting weak zone or
fault and the stress directions inferred from individual focal
mechanisms may show considerable lateral variations (e.g.,
Scholz 2002). Instead, the regional stress field can be
estimated from a group of events in a limited area (e.g.,
Gephart and Forsyth 1984; Michael 1987; Huang et al.
2011a). In this study, we used the MSATSI toolbox
(Martinez-Garzon et al. 2014) to apply the damped regio-
nal-scale linear inversion (Hardebeck and Michael 2006;
Michael 1987) and inverted the 686 focal mechanism
solutions (239 in this study and 447 in previous studies) for
the uniform stress field in Yunnan. The method divides the
study region into many subareas and simultaneously invert
for stress field (Michael 1987) in all subareas while mini-
mizing the difference in stress between adjacent subareas.
It is a least-squares solution of the equation:
GTGþ e2DTD� �
m ¼ GTd;
where m is the model vector containing the stress tensor
elements at the grid points, d is the data vector including
the slip vector components of earthquakes at the corre-
sponding grid points, and G is the data kernel matrix
involving the normal vector components of all the fault
planes. The matrix D is the damping matrix formed by
blocks of zeros, the identity matrix I and its opposite -I,
which is used to minimize the difference in stress between
adjacent subareas. e is the damping parameter to adjust the
strength of damping. The damped inversion may well
resolve the general pattern of the stress field in a region
(Hardebeck and Michael 2006) while removing some local
features due to geological activities such as active faults
(e.g., Hardebeck and Hauksson 2001; Huang et al. 2011b).
We first inverted for the smoothed stress field in Yunnan
with the 239 focal mechanism solutions obtained in this
study (Fig. 5a) and then with all of the 686 solutions by
combining previous results (Fig. 5b). Both results show
dominantly similar patterns that suggest the crust beneath
Yunnan is general under strike-slip environment (with both
horizontal r1 and r3). The thrust regime is generally
located to the west of the Sichuan basin where nearly E-W
r1 is consistent with the eastward extrusion of the Tibet’s
materials. The normal regime is located in northwest
Yunnan and r3 is sub-parallel to the active faults. Both r1and r3 show important rotation from west to east (Fig. 5)
that are comparable to the P and T axes of single focal
mechanism solutions (Fig. 4), respectively. The first-order
pattern is the same with previous studies that characterized
the regional stress field in Yunnan, e.g., by focal mecha-
nism solutions of many smaller events in a region (Xu et al.
1987), traditional stress field inversion with many focal
Earthq Sci (2016) 29(2):105–115 107
123

mechanisms in a region (e.g., Wan 2010), and damped
stress inversion with focal mechanisms determined with
permanent stations (Zhao et al. 2013). All these results
show dominant abrupt change near 26�N–28�N, i.e., fromE-W r1 and N-S r3 in the north to N-S r1 and E-W r3 in
the south. The gradual transitions of both r1 (NE-
SW ? N-S ? NW–SE from west to east) and r3 (NW–
SE ? E-W ? NE-SW from west to east) in the south are
also notable (Fig. 5). Note that adding more focal mecha-
nism solution of smaller events recorded by the dense
Fig. 2 An example of the focal mechanism determination with the gCAP method for an earthquake occurring at 16 October 2011. a The 1D
velocity model used in the study derived from Wang et al. (2003). b The locations of the event and corresponding stations used to determine the
focal mechanisms. c Synthetic (red) and observational (black) seismograms at the stations marked in the left. The two numbers under each
segment are the time shift in seconds between the synthetic and observational waveform (upper) and the waveform correlation coefficient (lower;
100 means best fit)
108 Earthq Sci (2016) 29(2):105–115
123
ChinArray stations does not change the patterns of stress
field in Yunnan compared with that of Zhao et al. (2013)
(Figs. 4, 5, 6). The consistent result may due to the limited
smaller events recorded in a short period in the dataset and,
on the other hand, suggests robust and reliable stress
inversion in Yunnan with the damped inversion method in
this study.
In order to directly compare the present stress filed in
the crust to that determined with GPS observations and
mantle strain field inferred from shear-wave splitting
Fig. 3 a 239 focal mechanism solutions obtained in the present study. The red, blue, and black symbols denote the reverse, normal, and strike-
slip type events, respectively. The sizes of the symbols denote the magnitude of the events with the scale shown in the bottom-left inset. The
statistics of the depths is showed in the bottom-right inset. b The same as (a) but for the 447 focal mechanism solutions collected from previous
studies (Xu et al. 2010; Zhao et al. 2013; Luo et al. 2014) and the gCMT catalogue (1976–2015). For other labelings, see Fig. 1
Fig. 4 Orientations of a P and b T axes of the 686 focal mechanism solutions showed in Fig. 3. The black and blue bars denote the results of the
239 events determined in the present study and the 447 events of previous studies, respectively. The lengths of the show bars denote the plunges
of the axes as shown in the bottom-right inset. For other labelings, see Fig. 1
Earthq Sci (2016) 29(2):105–115 109
123
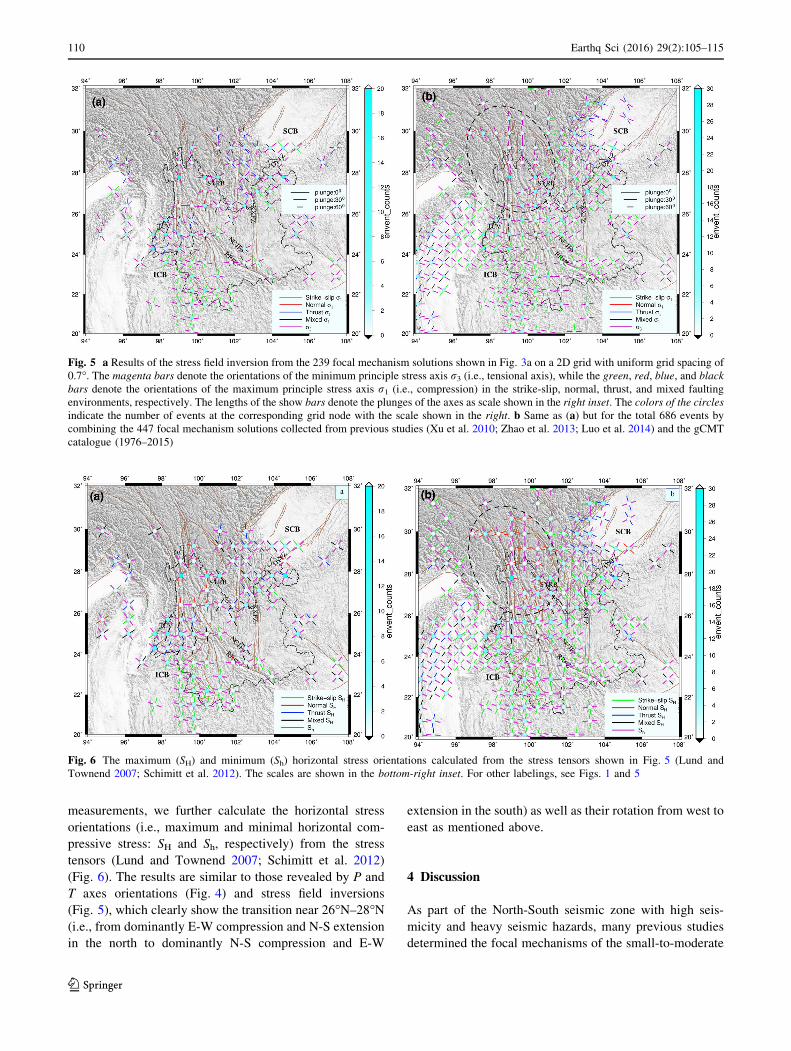
measurements, we further calculate the horizontal stress
orientations (i.e., maximum and minimal horizontal com-
pressive stress: SH and Sh, respectively) from the stress
tensors (Lund and Townend 2007; Schimitt et al. 2012)
(Fig. 6). The results are similar to those revealed by P and
T axes orientations (Fig. 4) and stress field inversions
(Fig. 5), which clearly show the transition near 26�N–28�N(i.e., from dominantly E-W compression and N-S extension
in the north to dominantly N-S compression and E-W
extension in the south) as well as their rotation from west to
east as mentioned above.
4 Discussion
As part of the North-South seismic zone with high seis-
micity and heavy seismic hazards, many previous studies
determined the focal mechanisms of the small-to-moderate
Fig. 5 a Results of the stress field inversion from the 239 focal mechanism solutions shown in Fig. 3a on a 2D grid with uniform grid spacing of
0.7�. The magenta bars denote the orientations of the minimum principle stress axis r3 (i.e., tensional axis), while the green, red, blue, and black
bars denote the orientations of the maximum principle stress axis r1 (i.e., compression) in the strike-slip, normal, thrust, and mixed faulting
environments, respectively. The lengths of the show bars denote the plunges of the axes as scale shown in the right inset. The colors of the circles
indicate the number of events at the corresponding grid node with the scale shown in the right. b Same as (a) but for the total 686 events by
combining the 447 focal mechanism solutions collected from previous studies (Xu et al. 2010; Zhao et al. 2013; Luo et al. 2014) and the gCMT
catalogue (1976–2015)
Fig. 6 The maximum (SH) and minimum (Sh) horizontal stress orientations calculated from the stress tensors shown in Fig. 5 (Lund and
Townend 2007; Schimitt et al. 2012). The scales are shown in the bottom-right inset. For other labelings, see Figs. 1 and 5
110 Earthq Sci (2016) 29(2):105–115
123
events and discussed the crustal stress field in Yunnan and
adjacent regions (e.g., Xu et al. 1987, 2010; Qian et al.
2011; Cui et al. 2006; Ma et al. 2008; Luo et al. 2014). In
spite of the general pattern of the crustal stress field in
Yunnan SE to Tibet from these earthquake focal mecha-
nisms (Xu et al. 1987; Luo et al. 2014), these studies
mainly revealed different stress orientations in different
blocks separated by the active faults as well as the influ-
ence of these active faults (e.g., Xie et al. 1993; Qian et al.
2011; Cui et al. 2006; Xu et al. 2010). In this study, we
applied the damped linear inversion (Hardebeck and
Michael 2006) and inverted for the focal mechanism
solutions for a smoothed regional crustal stress field in
Yunnan (Figs. 5, 6). Unlike many previous studies, we
focused on revealing the first-order pattern of stress/strain
field in the crust under Yunnan. We tried to compare the
tectonic deformation styles in the crust and upper mantle
that were inferred in this study and from shear-wave
splitting observations, respectively. The result is important
for understanding the lithospheric dynamics in SE Tibet.
The stress field and kinematics of the crust in Yunnan
have also been calculated with GPS observations and
Quaternary fault slip rate data (Fig. 7) (e.g., Flesch et al.
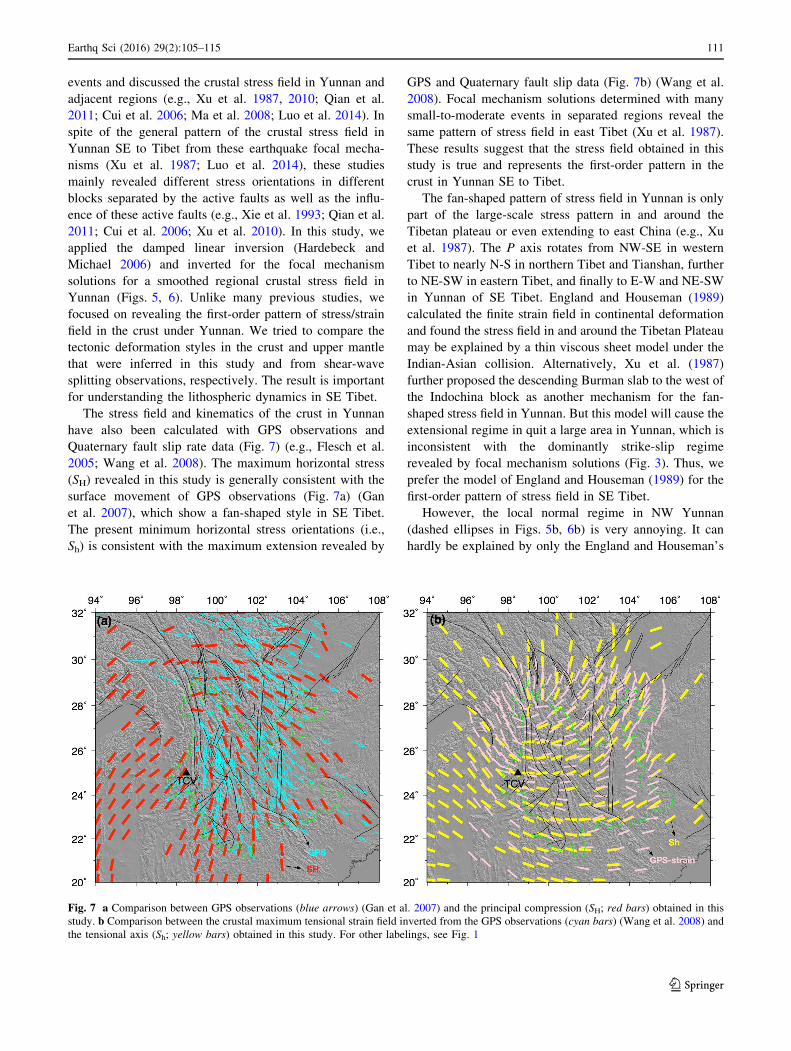
2005; Wang et al. 2008). The maximum horizontal stress
(SH) revealed in this study is generally consistent with the
surface movement of GPS observations (Fig. 7a) (Gan
et al. 2007), which show a fan-shaped style in SE Tibet.
The present minimum horizontal stress orientations (i.e.,
Sh) is consistent with the maximum extension revealed by
GPS and Quaternary fault slip data (Fig. 7b) (Wang et al.
2008). Focal mechanism solutions determined with many
small-to-moderate events in separated regions reveal the
same pattern of stress field in east Tibet (Xu et al. 1987).
These results suggest that the stress field obtained in this
study is true and represents the first-order pattern in the
crust in Yunnan SE to Tibet.
The fan-shaped pattern of stress field in Yunnan is only
part of the large-scale stress pattern in and around the
Tibetan plateau or even extending to east China (e.g., Xu
et al. 1987). The P axis rotates from NW-SE in western
Tibet to nearly N-S in northern Tibet and Tianshan, further
to NE-SW in eastern Tibet, and finally to E-W and NE-SW
in Yunnan of SE Tibet. England and Houseman (1989)
calculated the finite strain field in continental deformation
and found the stress field in and around the Tibetan Plateau
may be explained by a thin viscous sheet model under the
Indian-Asian collision. Alternatively, Xu et al. (1987)
further proposed the descending Burman slab to the west of
the Indochina block as another mechanism for the fan-
shaped stress field in Yunnan. But this model will cause the
extensional regime in quit a large area in Yunnan, which is
inconsistent with the dominantly strike-slip regime
revealed by focal mechanism solutions (Fig. 3). Thus, we
prefer the model of England and Houseman (1989) for the
first-order pattern of stress field in SE Tibet.
However, the local normal regime in NW Yunnan
(dashed ellipses in Figs. 5b, 6b) is very annoying. It can
hardly be explained by only the England and Houseman’s
Fig. 7 a Comparison between GPS observations (blue arrows) (Gan et al. 2007) and the principal compression (SH; red bars) obtained in this
study. b Comparison between the crustal maximum tensional strain field inverted from the GPS observations (cyan bars) (Wang et al. 2008) and
the tensional axis (Sh; yellow bars) obtained in this study. For other labelings, see Fig. 1
Earthq Sci (2016) 29(2):105–115 111
123

(1989) model. Seismic tomography shows important
extensive low-velocity zones in the upper mantle under
Yunnan which are proposed as back-arc spreading due to
the subduction of the Indian or Burman Plate (e.g., Ni et al.
1989; Li et al. 2008; Lei et al. 2009; Wang et al. 2010; Wei
et al. 2012; Huang et al. 2015b). There is possible
asthenospheric flow from SE Tibet to eastern China (e.g.,
Li et al. 2008; Lei et al. 2014; Huang et al. 2015b, c) that
may probably help the lithosphere of the Indochina and
South China blocks above it move southeastward (e.g.,
Tapponnier et al. 1982, 2001). Such mechanism may
induce extensional regional in the whole lithosphere
between Tibet (belongs to Eurasian plate) and Yunnan
(belongs to Indochina and South China blocks). Another
mechanism may arise from the gravity potential and
instability in Yunnan. When the Tibetan plateau grows,
there is great gravity potential energy at the edge of the
high plateau. Thus the change is expected that from topo-
graphic gradient-parallel extension at high elevations to
topographic gradient-parallel shortening at lower eleva-
tions as the collapsing lithosphere encounters resistance
from surrounding regions (e.g., Flesch et al. 2005; Wang
et al. 2008). The mechanisms are well supported by our
results that show dominant N-S horizontal extension (i.e.,
Sh) at elevation greater than 3000 m and gradient-normal
Sh at elevation lower than 3000 m (Fig. 8). A fundament
difference between the two mechanisms is that the exten-
sional regime is located in the whole lithosphere for the
first mechanism while only in the shallow part (e.g., crust)
for the second mechanism (e.g., Wang et al. 2008).
Therefore, it is necessary to study the stress field in the
lithospheric mantle to better explain the tectonics and
dynamics in east Tibet.
Whatever the specific mechanism is, both previous and
present studies confirm the first-order pattern of the stress/
strain field in the crust under Yunnan. The mantle strain
field is usually inferred from teleseismic shear-wave (e.g.,
SKS) splitting observations where the fast polarization
directions of the fast S wave is parallel to the maximum
strain axes (e.g., Mainprice 2007; Karato et al. 2008). The
average delay times of SKS splitting in Yunnan are of the
order of 1.0–1.5 s (e.g., Flesch et al. 2005; Lev et al. 2006;
Huang et al. 2007, 2011a, 2015a; Sol et al. 2007; Wang
et al. 2008, 2013). Contribution of crustal anisotropy
inferred from Pms splitting (Sun et al. 2013) and surface
wave inversion (Yao et al. 2010) is generally \0.3 s in
most Yunnan in spite of some larger delay time to the north
of 26�N (Sun et al. 2012). Thus the SKS splitting obser-
vations mainly reflect strain field in the upper mantle in
Yunnan, in particular to the south of 26�N. Comparison
between the crustal stress/strain field and SKS splitting
measurements shows that the strain fields in the crust and
upper mantle are the same in Yunnan but different in other
regions (Fig. 9). The result suggests that the crust and
upper mantle under Yunnan are probably coupled and the
observed shear-wave splitting can be partly explained by
Fig. 8 a Comparison between topography and the horizontal minimum stress (i.e., tensional axis Sh; yellow bars) obtained in this study. b Same
as (a) but for a smoothed topography. For other labelings, see Fig. 1
112 Earthq Sci (2016) 29(2):105–115
123
the pure-shear deformation in the lithosphere (e.g., Huang
et al. 2015a). Therefore, the model of lateral lithospheric
extrusion (e.g., Tapponnier et al. 1982, 2001) or thickening
Asian crust (England and Houseman 1989) is potential
model for the tectonics and dynamics in Yunnan SE to
Tibet while ductile mid-lower crustal flow (e.g., Royden
et al. 1997, 2008) does not exist to the south of 26�N in
Yunnan.
5 Conclusions
We determined the focal mechanism solutions of 239
events (3:0�MW � 6:0) with the waveforms recorded by
the dense ChinArray stations deployed in Yunnan from
August 2011 to December 2013. Then we combined our
dataset with 447 focal mechanisms determined in previous
studies and inverted the total of 686 focal mechanisms for
the first-order pattern of stress field in the crust of Yunnan
with a damped linear inversion. Overall, the results indicate
dominantly strike-slip environment in Yunnan as both the
maximum (r1) and minimum (r3) principal stress axes aresub-horizontal while an extensional regime is found in
northwest Yunnan.
We further calculated the horizontal stress orientations
and identified the maximum and minimum horizontal
compressive stress axes (SH and Sh, respectively) in the
crust. The horizontal stress axes change abruptly near
*26�N. To the north, SH aligns NW-SE to nearly E-W
while Sh aligns nearly N-S. In contrast, to the south, both
SH and Sh rotate laterally and show dominantly fan-shaped
patterns. SH rotates from NE-SW to the west of Tengchong
volcano gradually to nearly N-S in west Yunnan, and fur-
ther to NW-SE in the South China block in the east.
Similarly, Sh rotates from NW-SE in the west to nearly
E-W in the middle, and further to NE-SW in the east. The
Sh axis (consistent with maximum horizontal strain) in the
crust is consistent with that inverted from GPS observa-
tions, whereas the maximum strain is normal to the GPS
observations. The maximum strain is also normal to the
gradients of the topography, suggesting the stress field in
the crust mainly arises from the gravity potential and
instability near the edge of the high plateau. The crustal
strain field is consistent with the upper mantle strain field
inferred from shear-wave splitting observations in Yunnan
but not in other regions. Thus the crust and upper mantle in
Yunnan are coupled and suffering vertically coherent pure-
shear deformation in the lithosphere, which partly
explained the observed shear-wave splitting.
Acknowledgments The waveform data was provided by China
Seismic Array Data Management Center at Institute of Geophysics,
China Earthquake Administration. Two anonymous reviewers pro-
vided constructive comments and suggestions that greatly improved
the manuscript. This work was supported by the National Natural
Science Foundations of China (No. 41204040) and China National
Special Fund for Earthquake Scientific Research in Public Interest
(Nos. 201008001, 201308011). Most figures were made using GMT
(Wessel et al. 2013).
Open Access This article is distributed under the terms of the
Creative Commons Attribution 4.0 International License (http://crea
tivecommons.org/licenses/by/4.0/), which permits unrestricted use,
distribution, and reproduction in any medium, provided you give
appropriate credit to the original author(s) and the source, provide a
link to the Creative Commons license, and indicate if changes were
made.
References
Aki K, Richards PG (2002) Quantitative seismology, 2nd edn.
University Science Books, California
Cui X, Xie F, Zhang H (2006) Recent tectonic stress field zoning in
Sichuan Yunnan region and it dynamic interest. Acta Seismol
Sin 28:451–461 (in Chinese with English abstract)England P, Houseman G (1989) Extension during continental
convergence: with application to the Tibetan Plateau. J Geophys
Res 94:17561–17579
Flesch L, Holt W, Silver P, Stephenson M, Wang C, Chan W (2005)
Constraining the extent of crust–mantle coupling in central Asia
using GPS, geologic, and shear wave splitting data. Earth Planet
Sci Lett 238:248–268
Gan W, Zhang P, Shen ZK, Niu Z, Wang M, Wan Y, Zhou D, Cheng
J (2007) Present-day crustal motion within the Tibetan Plateau
inferred from GPS measurements. J Geophys Res 112:B08416
Gephart JW, Forsyth DW (1984) An improved method for determin-
ing the regional stress tensor using earthquake focal mechanism
Fig. 9 Comparison between teleseismic shear-wave (e.g., SKS)
splitting observations (orange and red bars) and the tensional axis
(Sh; yellow bars) obtained in this study. The orange bars are the
individual shear-wave splitting measurements in this region (e.g.,
Flesch et al. 2005; Huang et al. 2007, 2011a, 2015a; Lev et al. 2006;
Sol et al. 2007; Wang et al. 2008, 2013) while the red bars are the
smoothed averages in 2� 9 2� areas surrounding the grid node
Earthq Sci (2016) 29(2):105–115 113
123
data: application to the San Fernando earthquake sequence.
J Geophys Res 89:B119305
Hardebeck J, Hauksson E (2001) Crustal stress field in southern
California and its implications for fault mechanics. J Geophys
Res 106:21859–21882
Hardebeck JL, Michael AJ (2006) Damped regional-scale stress
inversions: methodology and examples for southern California
and the Coalinga aftershock sequence. J Geophys Res
111(11):1–11
Huang Z, Wang L, Xu M, Liu J, Mi N, Liu S (2007) Shear wave
splitting across the Ailao Shan-Red River fault zone, SW China.
Geophys Res Lett 34:L20301
Huang Z, Wang L, Zhao D, Mi N, Xu M (2011a) Seismic anisotropy
and mantle dynamics beneath China. Earth Planet Sci Lett
306:105–117
Huang Z, Zhao D, Wang L (2011b) Stress field in the 2008 Iwate-
Miyagi earthquake (M7.2) area. Geochem Geophys Geosyst
12:Q06006
Huang Z, Wang L, Xu M, Ding Z, Wu Y, Wang P, Mi N, Yu D, Li H
(2015a) Teleseismic shear-wave splitting in SE Tibet: insight
into complex crust and upper-mantle deformation. Earth Planet
Sci Lett 432:354–362
Huang Z, Wang P, Xu M, Wang L, Ding Z, Wu Y, Xu M, Mi N, Yu
D, Li H (2015b) Mantle structure and dynamics beneath SE
Tibet revealed by new seismic images. Earth Planet Sci Lett
411:100–111
Huang Z, Zhao D, Wang L (2015c) P wave tomography and
anisotropy beneath Southeast Asia: insight into mantle dynam-
ics. J Geophys Res 120:5154–5174
Karato S, Jung H, Katayama I, Skemer P (2008) Geodynamic
significance of seismic anisotropy of the upper mantle: new
insights from laboratory studies. Annu Rev Earth Planet Sci
36:59–95
Lei JS, Zhao DP, Su YJ (2009) Insight into the origin of the
Tengchong intraplate volcano and seismotectonics in southwest
China from local and teleseismic data. J Geophys Res
114:B05302
Lei JS, Li Y, Xie FR, Teng JW, Zhang GW, Sun CQ, Zha XH (2014)
Pn anisotropic tomography and dynamics under eastern Tibetan
plateau. J Geophys Res 119:2174–2198
Lev E, Long MD, Van der Hilst R (2006) Seismic anisotropy in
Eastern Tibet from shear wave splitting reveals changes in
lithospheric deformation. Earth Planet Sci Lett 251:293–304
Li C, Van der Hilst RD, Meltzer AS (2008) Subduction of the Indian
lithosphere beneath the Tibetan Plateau and Burma. Earth Planet
Sci Lett 274:157–168
Lund B, Townend J (2007) Calculating horizontal stress orientations
with full or partial knowledge of the tectonic stress tensor.
Geophys J Int 170:1328–1335
Luo J, Zhao C, Zhou L (2014) Characteristics of focal mechanisms
and stress field of the Chuan-Dian rhombic block and it adjacent
regions. Seismol Geol 36:405–421. (in Chinese with Englishabstract)
Ma W, Xu X, Cao Z, Yu G, Li H, Xu C (2008) Classification of focal
mechanism solutions and characteristics of latest crustal defor-
mation of Sichuan-Yunnan region and it adjacency. Seismol
Geol 30:926–934 (in Chinese with English abstract)Mainprice D (2007) Seismic anisotropy of the deep Earth from a
mineral and rock physics perspective. Treatise Geophys
2:437–491
Martinez-Garzon P, Kwiatek G, Ickrath M, Bohnhoff M (2014)
MSATSI: a MATLAB package for stress inversion combining
solid classic methodology, a new simplified user-handling, and a
visualization tool. Seismol Res Lett 85(4):896–904
Michael AJ (1987) Use of focal mechanisms to determine stress: a
control study. J Geophys Res 92:B1357
Ni JF, Guzmanspeziale M, Bevis M, Holt WE, Wallace TC, Seager
WR (1989) Accretionary tectonics of Burma and the 3-dimen-
sional geometry for the Burma subduction zone. Geology
17:68–71
Qian X, Qin J, Liu L (2011) Study on recent tectonic stress field in
Yunnan region. Seismol Geol 33:91–106 (in Chinese withEnglish abstract)
Ren J (1999) Tectonic map of China and adjacent regions 1:
5,000,000. Geological Publishing House, Beijing
Royden LH, Burchfiel BC, King RW, Wang E, Chen Z, Shen F, Liu Y
(1997) Surface deformation and lower crustal flow in eastern
Tibet. Science 27:788–790
Royden LH, Burchfiel BC, Van der Hilst RD (2008) The geological
evolution of the Tibetan Plateau. Science 321:1054–1058
Schimitt DR, Currie CA, Zhang L (2012) Crustal stress determination
from boreholes and rock cores: fundamental principles. Tectono-
physics 580:1–26
Scholz CH (2002) The mechanics of earthquakes and faulting, 1st
edn. Cambridge University Press, Cambridge
Sol S, Meltzer A, Burgmann R, Van der Hilst RD, King R, Chen Z,
Koons PO, Lev E, Liu YP, Zeitler PK, Zhang X, Zhang J, Zurek
B (2007) Geodynamics of the southeastern Tibetan Plateau from
seismic anisotropy and geodesy. Geology 35:563–566
Sun Y, Niu F, Liu H, Chen Y, Liu J (2012) Crustal structure and
deformation of the SE Tibetan plateau revealed by receiver
function data. Earth Planet Sci Lett 349–350:186–197
Sun C, Lei J, Li C, Zhang G, Zha X, Li F (2013) Crustal anisotropy
beneath the Yunnan region and dynamic implications. Chin J
Geophys 12:4095–4105 (in Chinese with English abstract)Tapponnier P, Peltzer G, Dain AY, Le Armijo R, Jussieu P, Cobbold
P (1982) Propagating extrusion tectonics in Asia: new insights
from simple experiments with plasticine. Geology 10:611–616
Tapponnier P, Zhiqin X, Roger F, Meyer B, Arnaud N, Wittlinger G,
Jingsui Y (2001) Oblique stepwise rise and growth of the Tibet
plateau. Science 294:1671–1677
Wan Y (2010) Contemporary tectonic stress field in China. Earthq Sci
23:377–386
Wang CY, Chan WW, Mooney WD (2003) Three-dimensional
velocity structure of crust and upper mantle in southwestern
China and its tectonic implications. J Geophys Res 108:B92442
Wang CY, Flesch LM, Silver PG, Chang L, Chan W (2008) Evidence
for mechanically coupled lithosphere in central Asia and
resulting implications. Geology 36:363–366
Wang CY, Zhu LP, Lou H, Huang BS, Yao ZX, Lou XH (2010)
Crustal thickness and Poisson’s ratios in the eastern Tibetan
Plateau and their tectonic implications. J Geophys Res
115:B11301
Wang CY, Flesch LM, Chang L, Zheng T (2013) Evidence of active
mantle flow beneath South China. Geophys Res Lett
40:5137–5141
Wei W, Xu J, Zhao D, Shi Y (2012) East Asia mantle tomography:
new insight into plate subduction and intraplate volcanism.
J Asian Earth Sci 60:88–103
Wessel P, Smith WHF, Scharroo R, Luis J, Wobbe F (2013) Generic
mapping tools: improved version released. EOS Trans AGU
94:409–410
Xie F, Zhu J, Liang H, Liu G (1993) Tectonic stress in southeast
China. Acta Seismol Sin 15:407–417 (in Chinese with Englishabstract)
Xu Z, Wang S, Huang Y, Gao A, Jin X, Chang X (1987) Directions of
mean stress axes in southwestern China deduced from micro-
earthquake data. Acta Geophys Sin 30:476–486 (in Chinesewith English abstract)
Xu Y, Herrmann RB, Koper KD (2010) Source parameters of regional
small-to-moderate earthquakes in the Yunnan-Sichuan region of
China. Bull Seismol Soc Am 100(5B):2518–2531
114 Earthq Sci (2016) 29(2):105–115
123

Yao H, van der Hilst RD, Montagner JP (2010) Heterogeneity and
anisotropy of the lithosphere of SE Tibet from surface wave
array tomography. J Geophys Res 115:B12307
Zhao L, Helmberger D (1994) Source estimation from broadband
regional seismograms. Bull Seismol Soc Am 84(1):91–104
Zhao L, Luo Y, Liu T, Luo YJ (2013) Earthquake focal mechanisms
in Yunnan and their inference on the regional stress field. Bull
Seismol Soc Am 103(4):2498–2507
Zhu L, Ben-Zion Y (2013) Parametrization of general seismic
potency and moment tensors for source inversion of seismic
waveform data. Geophys J Int 194:839–843
Zhu L, Helmberger DV (1996) Advancement in source estimation
techniques using broadband regional seismograms. Bull Seismol
Soc Am 86(5):1634–1641
Zhu L, Rivera LA (2002) A note on the dynamic and static
displacements from a point source in multilayered media.
Geophys J Int 148:619–627
Earthq Sci (2016) 29(2):105–115 115
123


![The Great Invention: Seismoscope by Sissi Liu. The differences between a seismometer and a seismoscope. What is a seismoscope? [seismocope vs seismometer]](https://static.fdocuments.in/doc/165x107/56649de55503460f94addeb9/the-great-invention-seismoscope-by-sissi-liu-the-differences-between-a-seismometer.jpg)