Cross-section excess electricity production integration ......of energy consumption in almost equal...
79
Cross-section excess electricity production integration into heating and transport sectors in Germany for 2030 Aalborg University-Spring semester 2018 Master thesis Written by Justinas Gegeckas Supervisor Peter Sorknæs Sustainable Energy Planning and Management program
Transcript of Cross-section excess electricity production integration ......of energy consumption in almost equal...

Cross-section excess electricity production integration into heating and transport sectors in Germany for 2030
Aalborg University-Spring semester 2018 Master thesis
Written by Justinas Gegeckas
Supervisor Peter Sorknæs Sustainable Energy Planning and Management program

Acknowledgements
I would like to say thanks to my supervisor Peter Sorknæs and interviewed energy experts
Philip Litz and Heinz-Uwe Lewe. All of them to some extent had contributed to this work.


Cross-section excess electricity production integration
into heating and transport sectors in Germany for 2030
Author: Justinas Gegeckas Supervisor: Peter Sorknæs Program: Sustainable Energy Planning and Management Semester: Spring 2018
Abstract
It is argued that future energy systems will be based on two rapidly developing
technologies, wind and solar PV. This situation will demand much more flexibility in the
system. Conventional power plants used for backup capacity will be gradually changed with
more intelligent, decentralized and fast responding technologies.
This study will try to provide more flexibility in Germans future energy system by integrating
excess electricity production from intermittent renewable energy sources into heating and
transport sectors. To do that, in total three technologies will be employed. These are heat
pumps, thermal storage and electric vehicles.
With EnergyPlan software the reference scenario for 2030 will be designed. Next, on this
reference scenario, four new cross-section models with will be added. The generated
outputs will be compared between reference and cross-section scenarios mainly based on
three parameters: CO2 emissions, total annual costs and critical excess electricity
production.
After, in the sensitivity analysis two different cases will be tested. First part will decrease the
prices, while the second will increase the capacities for the heat pumps and electric vehicles.
In general, this study will try to prove that cross-section electricity integration approach can
have lower costs for the whole energy system, could cut more CO2 emissions, thus help to
meet climate goals and finally reduce the surplus electricity production and utilize exported
electricity in domestic markets in a cost-effective way.

Table of content
1.0 INTRODUCTION ......................................................................................................................................... 1
1.1 ELECTRICITY SECTOR ........................................................................................................................................... 2
1.2 HEAT SECTOR ................................................................................................................................................... 3
1.3 TRANSPORT SECTOR ........................................................................................................................................... 4
1.4 CURRENT ELECTRICITY STORAGE SITUATION IN GERMANY .......................................................................................... 4
1.5 PROBLEM FORMULATION .................................................................................................................................... 5
1.5.1 Excess electricity production ................................................................................................................. 5
1.5.2 CO2 emissions ....................................................................................................................................... 7
1.5.3 Costs for the whole energy system ....................................................................................................... 8
1.6 RESEARCH QUESTION ......................................................................................................................................... 8
1.7 DELIMITATIONS ................................................................................................................................................. 9
1.8 PROJECTS STRUCTURE....................................................................................................................................... 12
2.0 METHODOLOGY ...................................................................................................................................... 13
2.1 ENERGYPLAN .................................................................................................................................................. 13
2.1.1 Technical Simulation ........................................................................................................................... 14
2.1.2 Market-economic simulation .............................................................................................................. 14
2.1.3 The strategy for the project ................................................................................................................ 14
2.1.4 Literature review of similar studies done with EnergyPlan ................................................................. 16
2.2 INTERVIEWS ................................................................................................................................................... 16
3.0 THEORETICAL CHAPTER ABOUT THE EXCESS ELECTRICITY INTEGRATION ................................................. 17
4.0 TECHNOLOGIES ....................................................................................................................................... 21
4.1 CHP PLANTS AND THERMAL STORAGE.................................................................................................................. 21
4.2 HEAT PUMPS .................................................................................................................................................. 22
4.2.1 Large-scale heat pumps ...................................................................................................................... 22
4.2.2 Individual HP ....................................................................................................................................... 23
4.3 ELECTRIC VEHICLES........................................................................................................................................... 23
5.0 THE DATA FOR THE SCENARIOS ............................................................................................................... 25
5.1 REFERENCE SCENARIO ...................................................................................................................................... 25
5.1.1 Energy demands ................................................................................................................................. 26
5.1.2 Electricity demand .............................................................................................................................. 26
5.1.3 Heating demand ................................................................................................................................. 27
5.1.4 Cooling demand .................................................................................................................................. 28
5.1.5 Industry demand and fuel ................................................................................................................... 28
5.1.6 Transport demand .............................................................................................................................. 28
5.1.7 Electrical cars ...................................................................................................................................... 28
5.1.8 Supply .................................................................................................................................................. 29
5.1.9 Heat and electricity ............................................................................................................................. 29
5.1.10 Electricity only ................................................................................................................................... 30
5.1.11 Heat only ........................................................................................................................................... 30
5.1.12 Fuel distribution ................................................................................................................................ 30
5.1.13 CO2 ................................................................................................................................................... 30

5.1.14 Balancing and storage ..................................................................................................................... 30
5.1.15 Electricity storage ............................................................................................................................ 31
5.1.16 Critical excess electricity production ................................................................................................ 31
5.1.17 Electricity grid stabilization requirements........................................................................................ 31
5.1.18 Electricity storage capacity .............................................................................................................. 31
5.1.19 Thermal storage ............................................................................................................................... 32
5.1.20 Costs ................................................................................................................................................. 32
5.1.21 Verifying reference scenario models data ........................................................................................ 32
5.2 CROSS-SECTION INTEGRATION SCENARIO ............................................................................................................. 33
5.2.1 V2G..................................................................................................................................................... 34
5.2.2 HP ....................................................................................................................................................... 34
5.2.3 Storage ............................................................................................................................................... 35
6.0 TECHNICAL-ECONOMICAL ANALYSIS AND THE RESULTS .......................................................................... 36
6.1 CO2 AND TOTAL FUEL CONSUMPTION ................................................................................................................ 36
6.2 CENTRAL POWER PLANTS PRODUCTION ............................................................................................................... 38
6.3 ELECTRICITY MARKET PARAMETERS ..................................................................................................................... 39
6.4 TOTAL ANNUAL COSTS ..................................................................................................................................... 40
7.0 SENSITIVITY ANALYSIS............................................................................................................................. 42
7.1 PRICE REDUCTION ........................................................................................................................................... 42
7.2 CAPACITY EXPANSION ...................................................................................................................................... 43
8.0 DISCUSSION ............................................................................................................................................ 44
8.1 VALIDITY ....................................................................................................................................................... 44
8.2 FUTURE STUDIES ............................................................................................................................................. 44
9.0 CONCLUSION........................................................................................................................................... 46
BIBLIOGRAPHY .............................................................................................................................................. 48

List of figures
Figure 1: Germany’s Energy mix 2017: Energy sources share in primary energy consumption ............ 2
Figure 2: Structure of gross electricity generation in Germany ............................................................ 3
Figure 3: The development of renewables-based heat consumption in Germany ................................ 3
Figure 4: Renewable energy use in Germany’s transport sector, 2000-2013 ........................................ 4
Figure 5: Stationary energy storage power capacity by technology type and country, GW.................. 5
Figure 6: The falling costs of key energy transition technologies since 2008 ........................................ 5
Figure 7: Load curve (red) and wind power (blue) in the Vattenfall grid (north-east Germany):charge
and discharge volume in 2030 in comparison with pumped hydro storage capacity ........................... 6
Figure 8: Greenhouse gas emission by sector, 1990 - 2016, together with reduction targets for 2020
and 2030 ................................................................................................................................................. 7
Figure 9: The research question illustrated by the graph ...................................................................... 9
Figure 10: Project’s structure ............................................................................................................... 12
Figure 11: The relationship between the input and output data in EnergyPlan .................................. 13
Figure 12: Simulation strategy for EnergyPlan ..................................................................................... 15
Figure 13: Smart Energy Systems’ schematic drawing ......................................................................... 18
Figure 14: The relevance for different storage technologies in Germany by 2030 ............................. 19
Figure 15: Energy system with district heating and thermal energy storage during (a) a low wind
scenario and (b) a high wind scenario .................................................................................................. 21
Figure 16: The day ahead prices the energy sources used for power demand in one weeks period in
Germany in 2017 .................................................................................................................................. 22
Figure 17: The links among different scenarios and analysis plan of the study ................................... 25
Figure 18: The data for the heat demand ............................................................................................ 27
Figure 19: Utilization of back-up capacity in Germany with different variable renewable energy
shares ................................................................................................................................................... 29
Figure 20: Options to deal with the critical excess electricity production ........................................... 31
Figure 21: The fuel consumption and CO2 emissions comparison among reference scenario and
cross-section scenarios ......................................................................................................................... 36
Figure 22: PP and CHP comparison among reference scenario and cross-section scenarios .............. 38
Figure 23: Electricity export/import, EEP, CEEP comparison among reference scenario and cross-
section scenarios .................................................................................................................................. 39
Figure 24: The comparison of EEP,CEEP and import parameters among reference and
V2G+HP+Storage scenarios .................................................................................................................. 40
Figure 25: Total annual costs comparison among reference scenario and cross-section scenarios ... 40
Figure 26: Total annual costs comparison among reference scenario, V2G+HP+Storage and 20%, 50%
price reduction ..................................................................................................................................... 42

List of tables
Table 1: Reference model’s verification .............................................................................................. 33
Table 2: The changes in individual heating after expanding HP capacity ............................................ 35
Table 3: Fuel balance for all scenarios ................................................................................................. 37
Table 4: The capacity of PP units among reference scenario and cross-section scenarios ................. 38
Table 5: The final comparison of CO2 emissions and total annual costs among all the scenarios made
in the study .......................................................................................................................................... 47

Abbreviations
RES - Renewable Energy Sources
EEP - Excess Electricity Production
HP - Heat Pumps
EVs - Electric vehicles
DH - District Heating
CHP - Combined Heat and Power
TS - Thermal Storage
V2G - Vehicle to Grid
G2V - Grid to Vehicle
VRE - Variable Renewable Energy
PP - Power plants
CEEP - Critical Excess Electricity Production


1
1.0 Introduction This chapter will introduce to the basics of Germany’s energy system and gradually will
move to the problem formulation where it will be narrowed down to the research question.
Next, in the delimitations sub-chapter, the project will be placed into boundaries. And
finally it will be finished with the project structure where every chapter shortly will be
described.
Germany’s energy system transformation is referred to a concept called Energiewende,
which literally means energy transition. It is a long-term strategy to meet the outlined goals
for climate and energy. The climate goals are to reduce CO2 emissions 40% by 2020, 55% by
2030 and 80-95% by 2050 compared to 1990 level. While the aims for energy sector is to
increase renewable energy share in final energy consumption to 18% by 2020, 30% by 2030
and at least 60% by 2050. Furthermore, this transformation includes nuclear power plants
phase-out by 2022, and the reduction of primary energy consumption by half in 2050
compared to 2008 figures. These objectives partly illustrate the four main pillars of
Energiewende: CO2 emissions reduction, increased energy security, nuclear power
decommission and the guarantee the competitiveness and growth for the industry (Agora
Energiewende, 2015 (a)).
Basically Energiewende resembles the transition from the energy generation based on fossil
fuel to the energy production which increasingly relies on intermittent renewable energy
sources (RES). It means gradual phased out of coal and nuclear power plants from energy
system and installing more capacity of RES technologies, mainly solar PV and wind power.
In order to have a brief look into how the Germany’s energy system looks like, the total
energy consumption is a good place to start (Figure 1). In fact, Germany is the largest user
of energy in the EU, responsible for around 20% of total energy consumption (Irena, 2015).

2
Figure 1: Germany’s Energy mix 2017: Energy sources share in primary energy consumption
It can be seen from the figure above that the fossil fuels are the dominant energy source
(AG Energiebilanzen, 2017). The biggest share takes oil, followed by natural gas, coal (hard
coal and lignite), RES and nuclear power. Biomass has the highest share in the renewable
sector.
When it comes to the final energy consumption by sectors, the most energy is used in
buildings, around half of all energy. While the transport and industry sectors share the rest
of energy consumption in almost equal parts (Irena, 2015).
This project will give a strong emphasis on sector integration. Therefore, it is relevant to
introduce electricity, heat and transport segments separately.
1.1 Electricity sector
Since the introduction of feed-in-tariff scheme in 2000, the renewable share started to
climb while other fuels like coal, lignite and oil started to decline (Figure 2). Currently RE
share in gross electricity consumption is around 30% and constantly growing (Irena, 2015)

3
Figure 2: Structure of gross electricity generation in Germany
Most of the renewable energy in 2015 was generated by wind turbines, followed by
biomass, photovoltaic’s and hydropower sources (Agora Energiewende, 2015 (b)).
1.2 Heat sector
Heat sector has the biggest demand for energy in Germany. Natural gas dominates in this
sector, especially is true for building where gas-fired boilers takes the biggest share (Agora
Energiewende, 2017). Despite the fossil fuel dominance, RES started to grow as well (Figure
3).
Figure 3: The development of renewables-based heat consumption in Germany

4
Biomass is the main fuel when it comes to RES consumption (Irena, 2015). However, in
recent years more of solar thermal and HP are installed. The district heating (DH) is not so
widespread in Germany compared to other Nordic countries, such as Denmark for example.
Due to the widespread areas (low heat density) and the fact that in the past the heat was
based on coal and individual boilers, the DH share in Germany stands only at 10% (Litz, P.)
1.3 Transport sector
Germany has one of the biggest car ownership rates in the world. However, when it comes
to RES, this sector is the most problematic. It has the lowest RES share, standing around 6%.
Biofuels takes the biggest share in this percent (Figure 4).
Figure 4: Renewable energy use in Germany’s transport sector, 2000-2013
However the number of cars which uses biofulels stopped growing, where electric cars (EVs)
numbers currently grow the fastest, but not enough to reach 1 million targets by 2020
(Irena, 2015).
1.4 Current electricity storage situation in Germany
Besides the focus on cross-section electricity integration, these projects also will focus on
different electricity storage technologies. At this moment, like in most countries around the
world, pumped hydro power is the most widespread electricity energy storage mode (Figure
5).

5
Figure 5: Stationary energy storage power capacity by technology type and country, GW
It can be seen than other storage modes, like thermal storage and batteries numbers are
almost insignificant (Irena, 2017). However, this numbers should change in the upcoming
decades. There are many discussions what kind and how much of electricity storage
technologies are needed in Germany, where intermittent RES will play the biggest role in
the future.
The increasing hours of excess electricity production (EEP) from RES will demand more
flexibility in the system, thus automatically the need for energy storage will grow. This
future situation will be the center of this study and will be elaborated more in the following
chapters.
1.5 Problem formulation
1.5.1 Excess electricity production
It is expected that by 2030 RES share in the electricity sector in Germany will reach 65%,
and in total energy consumption will go up to around 30% (Irena, 2015). One of the reasons
of this rapid RES capacity expansion is falling cost of technologies (Figure 6, Agora
Energiewende, 2018).
Figure 6: The falling costs of key energy transition technologies since 2008

6
In addition to this, after changing the feed-in-tariff system to the auction system in
Germany, where the lowest bid wins the auction, prices were pushed even further down. In
the latest auctions the price for the solar PV projects fell below 5 ct euro’s per kWh
(cleanenergywire). Basically it means that wind power and solar PV now could be
considered competitive with conventional power generators.
The increasing penetration of RES, primarily wind and solar PV, will create the situation in
the electricity sector where at times of high wind and solar resources, there will be hours of
excess electricity production. And to deal with this amount of surplus generation, different
solutions will be needed. One study had simulated the wind power load curve for 2030, and
then compared to 2008 load curve (Figure 7). Also in the same figure it was try to show that
the pumped hydro capacity will not be adequate. It will cover partly one day’s excess
production of wind power (IEC, n/a).
Figure 7: Load curve (red) and wind power (blue) in the Vattenfall grid (north-east Germany):charge and discharge volume in 2030 in comparison with pumped hydro storage capacity
This study also concluded that for balancing the system at least 8,4 TWh of storage capacity
will be needed by 2030. Therefore, it can be assumed that there is room for more storage
technologies in the upcoming decades.

7
1.5.2 CO2 emissions
When the weather conditions are unfavorable for RE technologies, then the electricity
demand will be covered mostly by conventional power plants which in most cases are based
on fossil fuel. This backup capacity production emits harmful CO2 gases to the atmosphere.
Coal alone accounts for 42% of all CO2 emissions in Germany, followed by petroleum and
natural gas, which emits 33% and 20% respectively (Agora Energiewende, 2018).
For the last decade, even though many carbon-friendly measures were implemented, CO2
emissions level in Germany remained almost stable (Figure 8, Agora Energiewende, 2018).
In order to meet climate goals for 2020 and 2030, the transformation to more carbon-
neutral energy system will be needed.
Figure 8: Greenhouse gas emission by sector, 1990 - 2016, together with reduction targets for 2020 and 2030
One of the reasons for this situation is the inefficient control of CO2 emissions in the
transport and heating sectors. Indeed, the transport segment is the only sector where CO
emissions are rising compared to 1990 level, while the heating sector is considered to be
Achilles’ heel of the Energiewende until 2030 (Irena, 2015). Furthermore, if there will not be
given more focus for these two sectors, all these plans to implement the outlined goals can
become the lost legislation (Litz, P.).
Moreover, coal power plants, which due to the cheap fuel and favorable carbon tax system
are competitive with less polluted power units are responsible for around 40% of CO2
emissions in energy sector, thus focus only on one sector, as it was done in the past, will not
solve the emissions problem (Agora Energiewende, 2017). This could be one of the
arguments to focus more on cross-section integration, where for example in the heat sector
heat pumps (HP) and electric vehicles (EVs) in the transport sector would possibly reduce
the carbon footprint for these segments.

8
1.5.3 Costs for the whole energy system
In order to meet energy and climate targets, and to transform energy system from fossil
fuel based to the system which will rely on RES in the future, considerable amount of
investment will be required. First, new capacities of RES will have to be installed, which will
require to install new cable lines on a local level (for high share of solar PV), in a country
itself (lines from North to South to balance wind and solar PV production) and lastly on a
cross-border level (to export EEP and import electricity when the production from RES will
fall). Furthermore, even though the share of RES will grow, still the back-up capacity will be
required, and with the minimized of hours of production additional support to keep these
energy units financially alive will be needed. In addition, the new technologies expansion of
EVs park for example, will demand more charging stations and new infrastructure in roads.
All these changes will be hungry for new investments.
In general, this project will try to give answers for a few problems, how to reduce the costs,
CO2 emissions and the amount EEP for the whole energy system.
1.6 Research question
This study will try to find a cost-effective ways how to integrate EEP mainly from wind
power and solar PV. The possibility will be examined to utilize this surplus electricity
domestically to other sectors instead of exporting electricity at lower price through the
interconnectors to neighboring countries. Electricity storage technologies will connect the
link between electricity and other sectors, such as heat and transport, which are responsible
for a significant amount of total CO2 emissions.
In addition, integrated electricity should decrease the working hours of conventional power
plants fed on fossil fuels, and thus the CO2 emission level possibly should decline as well.
Overall, cross-sector integration approach should reduce the fuel consumption and the cost
for the whole system (Mathiesen, Lund, 2015).
After indentifying energy problems and considering possible ways to solve these problems
the research question can be formulated:
To what extent cross-sector excess electricity integration into heating and
transport sectors could reduce the CO2 emissions and the costs for the whole energy
system in Germany by 2030?
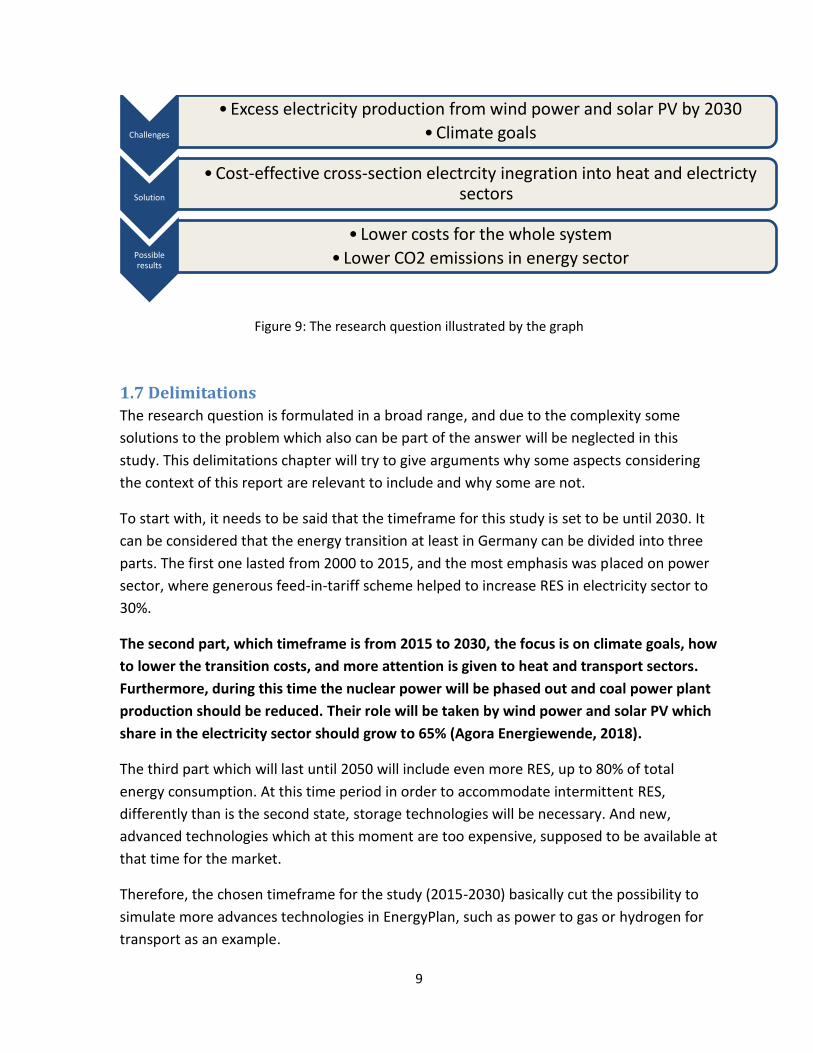
The research question is illustrated by graph (Figure 9), where challenges, solutions and
possible results are indicated.
9
Figure 9: The research question illustrated by the graph
1.7 Delimitations
The research question is formulated in a broad range, and due to the complexity some
solutions to the problem which also can be part of the answer will be neglected in this
study. This delimitations chapter will try to give arguments why some aspects considering
the context of this report are relevant to include and why some are not.
To start with, it needs to be said that the timeframe for this study is set to be until 2030. It
can be considered that the energy transition at least in Germany can be divided into three
parts. The first one lasted from 2000 to 2015, and the most emphasis was placed on power
sector, where generous feed-in-tariff scheme helped to increase RES in electricity sector to
30%.
The second part, which timeframe is from 2015 to 2030, the focus is on climate goals, how
to lower the transition costs, and more attention is given to heat and transport sectors.
Furthermore, during this time the nuclear power will be phased out and coal power plant
production should be reduced. Their role will be taken by wind power and solar PV which
share in the electricity sector should grow to 65% (Agora Energiewende, 2018).
The third part which will last until 2050 will include even more RES, up to 80% of total
energy consumption. At this time period in order to accommodate intermittent RES,
differently than is the second state, storage technologies will be necessary. And new,
advanced technologies which at this moment are too expensive, supposed to be available at
that time for the market.
Therefore, the chosen timeframe for the study (2015-2030) basically cut the possibility to
simulate more advances technologies in EnergyPlan, such as power to gas or hydrogen for
transport as an example.
Challenges
• Excess electricity production from wind power and solar PV by 2030
• Climate goals
Solution
• Cost-effective cross-section electrcity inegration into heat and electricty sectors
Possible results
• Lower costs for the whole system
• Lower CO2 emissions in energy sector

10
Most of the sources claim that advanced electricity storage technologies are still too
expensive to be installed on the market, and cheaper, tested options already exist (Agora
Energiewende 2014; Irena 2015; Mathiesen, Lund, 2015). The second argument why there
is no need for additional storage technologies is that the RES by 2030 will not exceed 70%
share in the electricity sector, thus the demand for so called advanced technologies will
grow faster only after this period, where much more flexibility will be needed. Also at that
time they will be more developed and more competitive.
Even some technologies are not suitable for this project context, still some considerations
about them will be given. To start with hydrogen, one study claims that if excess electricity
will be used to produce hydrogen which will be injected into natural gas grids (10%), and
then would be used for gas power plants, this approach would let to have approximately 8,2
TWh of flexibility in the system by 2030. This amount can be equaled to one month’s
needed electricity storage demand by 2030 (IEC, n/a). Another application of hydrogen in
the future can be found in the transport sector. Hydrogen can be produced much cheaper,
1-2 EUR cent/kWh in countries located close to the equator where there are plenty of
available sun resources. Thus, inexpensive hydrogen could be imported into Germany and
could outcompete other transport inputs such as electricity, diesel or petrol (Lewe, H-U).
Next, electricity storage technology which will be not included in this project is batteries.
And for this storage mode it’s hard to find arguments why it cannot be part of the energy
models. Currently the price to store electricity in batteries is too expensive compared with
other alternatives (Lund, Østergaard, 2016; Irena, 2015). However by 2030, especially in
combination with solar PV, in terms of the capacity, batteries will rank second after pumped
hydro power, and will play a big role to balance electricity spikes (Irena, 2015). Even though
they can be competitive to HP or EV at that time (2030), the project will focus on cross-
section integration. Therefore, batteries will be placed over project’s boundaries.
Nevertheless, in some models the expansion of EVs capacity will be analyzed, which
contains batteries as well. So the impact for the system can be assumed will be similar if the
small scale batteries capacity would be increased.
One technology which is fully developed, competitive and can be carbon-neural is DH and
CHP units. The reason why this technology will not be discussed further in this study is
because due to historical reasons heating in Germany was based on individual heating. And
now to install new pipe systems under already established cities could be not economically
viable solution on a big scale (Litz, P). Nevertheless, DH projects are implemented mostly in
North of the Germany where there are plenty of wind power production and cities are more
dense.

11
Moving to the next boundary, it needs to be noted that Germany is well connected to
neighboring countries, thus the security of supply is rather high (Litz, P). Even though
Germany has many benefits of importing and exporting electricity through interconnectors,
this project, as it was already few times mentioned, will focus only on cross-section
integration. And in particular the emphasis will be given to electrification. Therefore, even
technologies ready for the market such as biofuels in the transport sector or solar thermal
in heating sector will not be discussed.
Finally, this study will focus only on technologies which by 2030 suppose to be competitive
to produce energy without support from the outside. Thus, there will not be policies
discussed which could bring new technologies to the market.

12
1.8 Projects structure
In total the project will consist of nine chapters
(Figure 10):
Chapter 1: Introduction will present Germans
energy system in general, then problems will be
identified from which research question will be
formulated. Finally, it will be ended with the
delimitations sub-chapter where projects
boundaries will be outlined. Chapter 2:
Methodology will consist of two parts, EnergyPlan
software program and interviews. EnergyPlan
working principles will be explain in details, and the
reasons will be given why particular simulation
strategy is more suitable for this study. Chapter 3:
Theory chapter about the electricity integration
will try to stand on other studies shoulders to prove
that considering studies problem formulation some
technologies are more relevant to use, while other
are not competitive yet. Chapter 4: Technologies
will give a brief description of HP and EVs. Chapter
5: The data for the scenarios will give arguments of
particular choices of the information used to build
the models. In addition, the reference scenario will
be verified in comparison to other studies results.
Chapter 6: Technical-economical analysis and
results will compare all models outputs and will
argue why they are different from each other.
Chapter 7: Sensitivity Analysis will test two
possibilities of increasing the HP and V2G cars
capacity and reducing prices of the same
technologies. Chapter 8: Discussion will discuss the
validity of the results and give some insights for
possible future studies. Chapter 10: Conclusion will
answer the research question and conclude all studies work.
Figure 10: Project’s structure
1 • Introduction
2 •Methodology
3
•Theory chapter about excess electricity inegration
4 •Technologies
5 •The data for the scenarious
6
•Technical-economical analysis and the results
7 •Sensitivity analysis
8 •Discussion
9 •Conlusion

13
2.0 Methodology This chapter will be comprised of two methodologies: interviews and modeling program.
The software, EnergyPlan, will be described and reasons will be given to justify programs
applicability for this study needs. Then interviewed people view on the future energy
systems in Germany will be presented.
2.1 EnergyPlan
This energy modeling program was developed at Aalborg University and continuously
updated since 1999. This program is designed to model different energy systems on a
countries/national level. Though local energy systems had been simulated as well (Lund,
2017).
Analysis in the program is carried out on hourly basis for a period of one year. The
simulations are based on input/output data. The inputs can be energy demands, costs,
capacities, different energy strategies, while the outputs are energy balances, annual fuel
consumption, CO2 emissions, total system costs etc. Figure 11 illustrates the relationships in
EnergyPlan between inputs, outputs and regulation strategies (Connolly, Lund, 2010).
Figure 11: The relationship between the input and output data in EnergyPlan

14
There are two main strategies in EnergyPlan to carry out energy analysis: Technical
simulation and Market-economic simulation.
2.1.1 Technical Simulation
For the technical simulation inputs such as energy demands, efficiencies, capacities are
necessary, while the generated outputs are annual energy balances, fuel consumption and
CO2 emissions. Basically in this strategy the demand has to be met by the supply.
If it not the case, than electricity is imported from the external energy market, and if there
is a surplus electricity production then the energy is exported. However, this simulation
seeks to reduce the amount of imported electricity (Lund, 2017)
2.1.2 Market-economic simulation
The market simulation focuses more on supply side than demand. Meaning than the priority
is set to optimize the production in order to generate the highest profitability for energy
units. While the impact for the whole system, such as the lowest fuel cost for example is not
considered. For the profitability calculations, differently than in technical simulation
variable costs are needed. This simulation when the production is based on marginal
production cost resembles NordPool electricity market. Furthermore, in the market
simulation electricity exchange markets are included. Therefore, the calculations are made
if it is more beneficial in terms of profitability for the energy system to import electricity
from abroad or to produce energy domestically (Lund, 2017)
2.1.3 The strategy for the project
In order to set the right simulation strategy for the project, first the desired results should
be outlined. In this project case, the research question is formulated in a way that the
outputs of the modeled scenarios should identify the lowest fuel-consumption
(automatically CO2 emissions as well) and the lowest costs for the whole energy system.
Technical simulation is designed to reduce the fuel cost for the whole system, where market
simulation optimizes focus on specific energy plant to produce energy at the lowest price
possible (Connolly, 2015). And finally technical simulations can model future energy
systems, which will be based on high share of intermittent RES, more accurate than market
simulation because by including capital costs, not only variable costs can identify the least
cost solution for the whole system.
After considering different arguments, technical simulation was opted over market-
economic simulation. And now technical simulation will be explain in detail.

15
Technical simulation has four options to choose from (Figure 12):
Balancing heat
Balancing heat and electricity
Balancing heat and electricity (plus grid stabilization)
Balancing heat demands using triple tariff
Figure 12: Simulation strategy for EnergyPlan
For this project technical simulation strategy number 3, Balancing both heat and electricity
demands (Reducing CHP also when needed for grid stabilization) had been chosen. Basically
it means at times when there is an excess electricity production in the system CHP
production is reduced. Also the production is reduced when there is a need for grid
stabilization (Connolly, 2015)
However, technical simulation is just one part of this study. The second part is to calculate
socio-economic costs, which include fuel costs, variable operational costs, investment costs,
fixed operational costs and CO2 costs. The main reason for this calculation is to find out the
least cost solution for the whole system which is related to technical simulation (Lund,
2017). The difference between socio-economic simulation and market simulation is that the
first one excludes taxes why the market simulation includes.
There are even more simulation options to choose from (Figure 12). It was chosen that HP
and V2G will utilize all electricity export, not only critical excess electricity production.

16
2.1.4 Literature review of similar studies done with EnergyPlan
Only the literature which is related to the EnergyPlan software and the technologies
described in this study will be introduced. The reviewed literature should contribute to the
methodologies, specifically to prove that EnergyPlan program is a suitable choice for this
project.
Few studies by employing EnergyPlan had tested the feasibility to integrate variable
electricity production from RES sources. One study made a comparison between cross-
sector and cross border integration. For cross-border integration technologies such as HP,
CHP with thermal storage and EVs had been used to prove that that this way to deal with
excess electricity production from RES can reduce fuel consumption considering the whole
energy system (Thellufsen, Lund, 2017). The next study had investigated the possibility to
transform Croatia’s energy system based on 100% RES production. To accomplish that
various energy storage technologies had been considered, such as hydro storage, thermal
storage, heat pumps and EVs. It was found that with these measures is it possible to reduce
CO2 emissions for the whole country (Krajacic, Duic, 2011). The other study also concluded
that by integrating excess electricity from large-scale wind power to energy storage
technologies is it possible to reduce CO2 emissions (Lund, 2005)
2.2 Interviews
In total two interviews were taken from energy experts in Germany. The first person to
interview was Philip Litz, advisor of independent and non-profit organization named Agora
Energiewende. It is a think tank and policy institute, which different publications were
widely used in this study.
The second person who shared the knowledge about future energy system was Heinz-Uwe
Lewe, Policy Officer. He is working at the Ministry of economic affairs, Innovation,
Digitalization and Energy division of the state of North Rhine Westphalia.
The information gathered during interviews will be used in this work. Full interviews, with
all the questions and answers can be found in Appendix.
17
3.0 Theoretical chapter about the excess electricity integration This chapter will start with the basic introduction of electricity storage technologies. Then
the description of Smart Energy System will be given to prove that the choice of
technologies for the timeframe of this study is relevant. Next, other studies related to
Germany’s energy future energy systems, and storage in particular, will be analyzed for the
same reason as it was did for Smart Energy Systems, try to show that chosen approach how
to deal with surplus of electricity is based on already tested methods.
In order cost-effectively utilize large amounts of surplus electricity generation in the future
some kind of storage modes will be needed. Therefore, first the introduction of energy
storage in general to start with will be given.
Energy can be considered primarily stored or secondary stored (Agora Energiewende,
2014). The first one, which accounts around 80% of all power generation, is fossil fuels.
They are stored in chemical energy, and are charged only once, through photosynthesis
when in the past were converted naturally into hydrocarbons. Then discharged again only
once when are burned in energy units. While the secondary stored group can be charged,
stored and discharged many times. These technologies can store electricity in many forms.
It can be done electrochemically (batteries), mechanically (pumped hydro), chemically
(hydrogen), electrically (superconducting magnets) or thermally (electric boilers, hot water
tanks). The application rate depends on many factors such as the cost, geographical
conditions, availability of resources etc (IEC, n/a).
In the past energy system was consisted of three main segments: production, distribution
and consumption. Now, at the era of rapidly growing share of intermittent energy sources,
the demand for storage technologies due to the increasing need for the flexibility is
growing. Thus, in the upcoming years storage technologies can be considered the forth
pillar of energy systems (Agora Energiewende, 2014):
Generation: power plant flexibility, cogeneration plants, renewable energy plants
(including curtailment)
Network: network expansion, network conversion
Consumption: demand side management in the electricity sector and across sectors
Storage technologies: sectoral energy storage, cross-sectoral energy storage
It can be seen that in the last section storage technologies, the energy storage is separated
into two parts: sectoral and cross-sectoral. As it was mentioned in previous chapters, this
study will exclude considerations of storing electricity directly to the batteries for example,
or will not take into consideration pumped hydro power which probably due to the
landscape restrictions, public acceptance will not be expanded (Litz, P., Lewe, H-U.).

18
The following paragraph will be based on so called Smart Energy System theory, and one of
the definitions could sound like this (Connolly, D., Lund, H., 2013), (Figure 12):
‘Smart Energy System is defined as an approach in which smart Electricity, Thermal and
Gas Grids are combined and coordinated to identify synergies between them in order to
achieve an optimal solution for each individual sector as well as for the overall energy
system’
Figure 13: Smart Energy Systems’ schematic drawing
According to the Smart Energy Systems theory different RE share for the optimal fuel
consumption requires different storage technologies. In one of the studies, different RES
shares were tested, and different technologies were used accordingly to prove that by
connecting different sectors the fuel consumption and the CO2 emissions for the whole
energy system can be reduced (Mathiesen, Lund, 2015). For example when variable RE
sources produced electricity doesn’t exceed 25% share in the power sector, than the system
was capable to integrate this amount without significantly affected electricity grid.
However, for fuel-efficient it is recommended to have CHP systems with thermal storage
tanks. When the 25% percent is exceeded then it is suggested to connect the electricity and
heat sector by installing large scale heat pumps in densely populated areas and individual
heat pumps in remote areas in individual houses. Finally, when RE share stands at more
than 45% for optimal integration transport sectors needs to be electrified. This integration
theory can be broken down into these steps (Thellufsen, Lund, 2017):
19
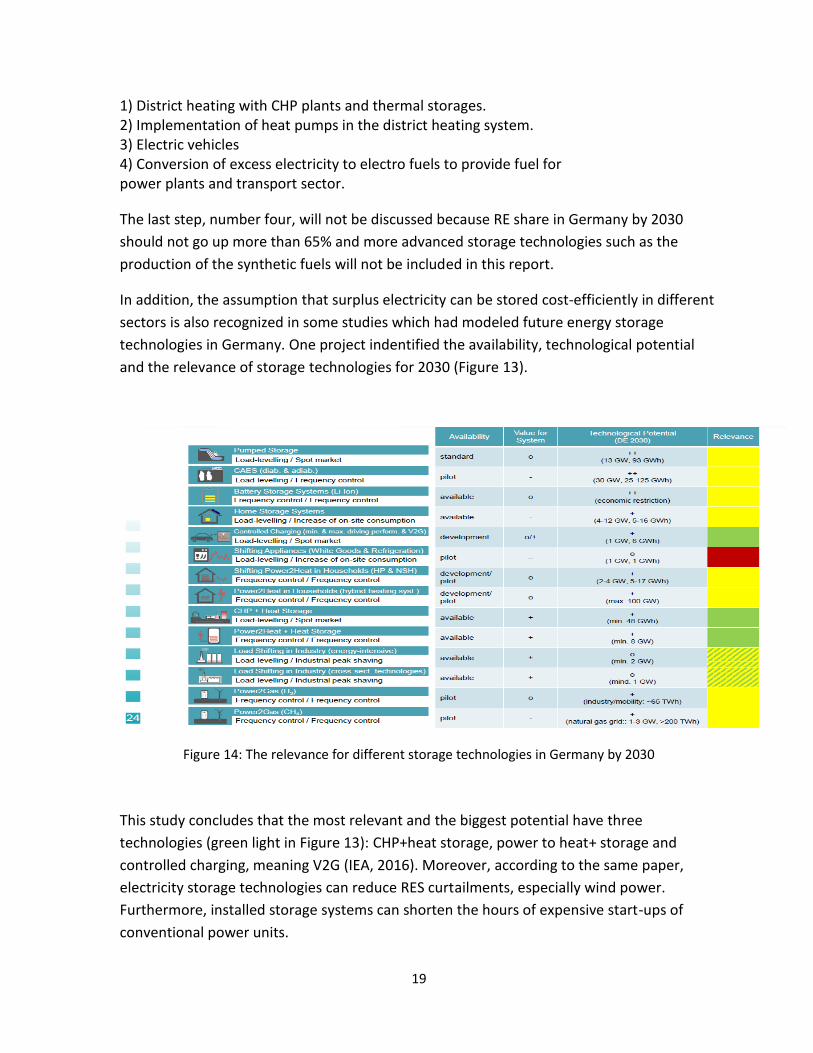
1) District heating with CHP plants and thermal storages. 2) Implementation of heat pumps in the district heating system. 3) Electric vehicles 4) Conversion of excess electricity to electro fuels to provide fuel for power plants and transport sector.
The last step, number four, will not be discussed because RE share in Germany by 2030
should not go up more than 65% and more advanced storage technologies such as the
production of the synthetic fuels will not be included in this report.
In addition, the assumption that surplus electricity can be stored cost-efficiently in different
sectors is also recognized in some studies which had modeled future energy storage
technologies in Germany. One project indentified the availability, technological potential
and the relevance of storage technologies for 2030 (Figure 13).
Figure 14: The relevance for different storage technologies in Germany by 2030
This study concludes that the most relevant and the biggest potential have three
technologies (green light in Figure 13): CHP+heat storage, power to heat+ storage and
controlled charging, meaning V2G (IEA, 2016). Moreover, according to the same paper,
electricity storage technologies can reduce RES curtailments, especially wind power.
Furthermore, installed storage systems can shorten the hours of expensive start-ups of
conventional power units.

20
Finally, it states that the most relevant storage modes by 2030 can lower overall system
cots, integrate more RES and reduce the CO2 emissions in the long-term. All of these
mentioned parameters will be the main outputs of the scenarios in this study.
Other studies came up for similar conclusions. In order to install and integrate electricity
from intermittent RES in a cost-effective way, first heat and electricity sectors needs to be
electrified. In heat sector DH systems should be based on CHP units installed together with
hot water tanks and large-scale HP, where in individual sector inefficient boilers fed on
fossil fuel needs to be changed with small-scale HP, and lastly more V2G cars should be seen
on the roads to balance the grid (Irena 2015)

21
4.0 Technologies In this chapter three technologies (HP,TS and V2G) simulated in this project will be
presented.
4.1 CHP plants and thermal storage
Even though CHP units will not be included in alternative energy models in this project, it is
worth to discuss the combination of CHP and TS, as it can significantly contribute for the
balancing of energy systems.
The CHP plants participate in two markets, heat and electricity. Depending on the demand,
the CHP role in the markets constantly changes. At times of reduced production from
intermittent energy sources CHP units assist as a backup capacity and cover both, the heat
and electricity demand. If the electricity demand is covered by cheaper production modes,
like wind power and solar PV, then the heat demand is covered by thermal storage, which
could be filled up during hours when the heat demand was lower than the electricity
demand. This process can be better illustrated in Figure 14.
Figure 15: Energy system with district heating and thermal energy storage during (a) a low wind scenario and (b) a high wind scenario
Thermal storage adds the flexibility for CHP units and thus reduces the total fuel
consumption. This figure above resembles already discussed technical simulation strategy
number 3 (Connoly, 2015). Furthermore, it is of the cheapest way of storing energy.
According to the one study, to store energy in thermal storage tanks is approximately 100
times cheaper compared to the electricity storage technologies such as batteries for
example (Lund, Østergaard, 2016).

22
4.2 Heat pumps
There are two main types, compression and absorption HP. The main difference is that
compression HP for input uses electricity while absorption HP utilizes some form of heat in
a form of steam, flue gas or hot water. Compression HP is more efficient. They coefficient of
performance (COP) is around 3-5 while absorption HP is approximately 1,7 (Energinet,
2018).
HP is the technology which in the future can work in synergy together with the increasing
number of RES. Installation of heat pumps in energy systems would utilize excess electricity
generation from power units such as wind or solar PV. This would reduce the amount of
exported electricity to neighboring countries, and reduce the overalls cost for the whole
system, and finally will make wind power production more valuable (Mathiesen, Lund,
2015; Mathiesen, Lund, 2009). The reasons for these benefits is that at hours of surplus
electricity production, the market prices drop significantly (sometimes to even negative
prices), therefore it is cost-effective to transfer cheap electricity into heat energy. This can
be illustrated by figure 15, where it is shown that when wind and solar PV production takes
over, the day ahead power prices fall down (Bloomberg New Energy Finance).
Figure 16: The day ahead prices the energy sources used for power demand in one weeks period in Germany in 2017
4.2.1 Large-scale heat pumps
Large-scale heat pumps can be a part of DH systems. They could provide flexibility for CHP
plants and for the whole system which is based on variable RES (Averfalk, Ingvarsson, 2017).
Increasing penetration of intermittent RES will increase the amount of hours of surplus
electricity production. Large-scale HP could utilize this inexpensive electricity and transform
into heat in an efficient way.

23
Moreover, assuming that large-scale HP would take some operating hours from CHP units,
fuel consumption would be reduced, automatically CO2 emissions as well. If renewable
energy source such as biomass are burned in CHP plants, it is also beneficial for the society
to lower its consumption as it is predicted shortages of this resource in the future (Irena,
2015).
4.2.2 Individual HP
Individual HP similarly as large-scale HP can utilize excess electricity production from wind
power or solar PV. There are few types of individual HP such as air to air, air to water and
ground-sources. The most efficient is considered to be ground-sauce HP. Also this type of
HP can be installed together with a thermal storage which at hours of expensive electricity
can cover the heat demand without using any inputs (DAE, 2016).
Individual HP can play a big role in the future energy systems. In rural areas where due to
low energy density DH projects cannot be economically feasible, small HP could change
individual boilers based on fossil fuel. Furthermore, new stricter regulations in EU will force
new house owners to install HP in order to meet energy efficient standards (Lewe, H-U).
4.3 Electric vehicles
There are two types of electric cars. One type use only batteries, while other type, hybrids,
can run either on batteries or get the energy from the fuel system similar to the
conventional cars. Also cars which are running only on batteries can be divided into two
categories like grid to vehicle (G2V) and vehicle to grid (V2G). The main difference is that
V2G due to the technological update can do both, charged the battery from the grid and
discharge electricity back to the grid, while G2V has only one charging mode.
According to the different research papers EVs can facilitate in the integration of
intermittent RES. Already mentioned Smart Energy Systems theory claims that by increasing
the number of EVs on the roads would increase the fuel efficiency (Mathiesen, Lund, 2015).
Thus, reduced fuel consumption (which is mostly fossil fuel in the transport sector) also cuts
CO2 emissions and costs for the whole system. To elaborate more on this statement, the
conventional cars are not as efficient as EVs. Conventional cars which running on diesel or
petroleum coverts fuel into useful energy with 20-30% efficiency, while EVs energy
utilization is 90-95%. When it comes to RES integration it is foreseen that G2V will play a big
role in so called demand side management (DSM).
Stored electricity in batteries could be recharged to the grid in order to regulate the
frequency, cover the peak loads or in general compensate the electricity production
shortage in the system (Irena, 2017).

24
Another important aspect related to the feeding the grid from G2V is the flexibility. It is
assumed that is near future consumers will get signals when is more beneficial financially
for them to recharged they car batteries. This flexibility should help to ensure that the
electricity demand every hour is met.
When it comes to CO2 emissions, the saving really depends on what kind of fuel was burned
to produce electricity which was used to charge the batteries. It is accounted that in order
for EVs to have a positive carbon footprint compare to the hybrid cars, the amount of CO2
should not be exceeded by 600 grams per 1 kWh of produced electricity (Irena, 2017).The
trend is moving towards the energy systems with increasing share of RES, therefore it can
be assumed that the carbon footprint of EVs in the future will only decline.

25
5.0 The data for the scenarios In this chapter the data used for the reference and the cross-section scenarios will be
presented. Cross-section scenario will contain four models: V2G, HP, HP+Storage and
V2G+HP+Storage. The inputs, necessary to build the models will be explained and
arguments of particular choices will be given. Figure 16 below illustrates how different
models are related to each other, and also show the analysis plan for this study.
Figure 17: The links among different scenarios and analysis plan of the study
It needs to be noted that this chapter will describe only reference and cross-section
scenarios. Sensitivity analysis results will be compared with the previous models in Chapter
7.
5.1 Reference scenario
The first model is the reference scenario. This scenario should resemble most possible
energy system in Germany by 2030. One of the purposes of the reference scenario is to
have a starting point, the foundation on which other models can be built. Also the reference
model will be compared to other four models to find out if they could improve the energy
system parameters, such as CO2 and annual costs.

26
This scenario will be built on already existing model (EnergyPLan file). This file was used for
the study, which analyzed the feasibility of thermal solar systems in the future energy
systems in four different countries (Mathiesen, Hansen, 2017).
One of the countries was Germany, therefore all the data, including the distribution files,
will be used as the starting point for this scenario as well. Off course borrowed file in
EnergyPlan will be updated. This study is designed for 2030, while the borrowed model is
for 2015.
The data for the reference scenario had been taken mostly from two studies (Agora
Energiewende, 2018; Irena, 2015). These studies were made to predict how Germans
energy system could like for 2030. Moreover, a strong emphasis was placed on RES,
different sectors development and climate targets. Basically, these studies modeled future
energy systems which could be able to match energy and climate goals. It means that the
reference scenario will not be typical business as usual case. And the argument for this is to
build a starting model which would be as close to the reality as possible, even though future
predications will always include uncertainties.
However, the data used to build the models was taken from other papers as well.
EnergyPlan software requires rather specific information for some sections, which is hard to
obtain from only few sources.
5.1.1 Energy demands
Before starting to describe the specific energy demands for every sector, it needs to be
noted that due to the expected efficiency measures, such as building retrofitting and
general different efficiency policies, it is predicted that primary energy consumption should
drop around 30% compared to 2015 level (Agora Energiewende, 2018).
5.1.2 Electricity demand
The total electricity demand for 2030 was set to be 568,5 TWh (excluding import/export),
(Irena 2015). In this number electricity needs for transport (2,5 TWh), electricity needs for
individual HP (40 TWh) and electric cooling (17,7 TWh) are included. After adding fixed
import/export (44 TWh) number, it resulted that the total electricity demand is 612,5 TWh .
One of the reasons why electricity demand for 2030 dropped insignificantly compared to
2015 data, is that the electrification of the heating and transport sectors reduces the
efficiency measures in this sector (Agora Energiewende, 2018)

27
5.1.3 Heating demand
The heating demand in EnergyPlan software is divided into two parts: individual and DH.
Starting with the individual heating, first the average demand for households needs to be
set. The average heating demand in 2030 supposes to be 25% lower compared to 2015 heat
demand (Agora Energiewende, 2017). It resulted that the expected average need for space
heating and hot water will be around 11250 kWh/year.
EnergyPlan program, by knowing average household consumption and total heat demand,
calculates automatically the number of individual houses (Lund, 2017).
After that, fuel inputs (measured in TWh/year) and the efficiencies of different boiler types
such as coal, oil, natural gas and biomass boilers are specified (Figure 17).
Figure 18: The data for the heat demand
The basic trend from 2015 to 2030 is that the oil fired boilers numbers will be reduced
significantly, while the share of gas-fired boilers will remain almost the same. The biggest
change will be for HP technology, it is predicted that they share in total heating demand will
grow from 1% to 22%, and by 2030 around five millions of HP will be installed (Agora
Energiewende, 2017).

28
There are three different groups for district heating sector. The first one represents the
energy system where only heat boilers cover DH demand, the second group indicates
decentralized CHP plants and the third centralized CHP plants (Lund, 2017). The DH demand
for 2030 was set to be 110 TWh. It results that the total demand for total heat demand is
547 TWh (Agora Energiewende, 2017).
The solar thermal by 2030 should supply around 24,45 TWh of heat (Irena, 2015)
5.1.4 Cooling demand
Only annual cooling demand was specified, which is 17,73 TWh/year (BluePrint Germany,
2009).
5.1.5 Industry demand and fuel
The information about energy consumption for industry by energy source was taken from
one of the reports about future Germany’s energy system (BluePrint Germany, 2009). It is
predicated that by 2030 the industry will be fueled mainly on natural gas.
5.1.6 Transport demand
The energy usage in the transport sector due to the efficiency measures and the reduced
numbers of cars which run of fossil should be 30% lower by 2030 compared to 2015 level
(Agora Energiwende, 2018). However, still by 2030 most of the cars will be based on petrol
and diesel. When it comes to renewable fuels, biofuels and EVs, numbers will stand at 30,0
and 2,5 TWh respectively (BluePrint Germany, 2009; Agora Energiwende; Irena, 2015). In
total 1 million EVs will be in the roads, and 60% of them suppose to run only on batteries
(IEC, n/a). Its need to be noted, that the number of EVs choice is rather conservative,
different sources estimates different predictions, ranging from 1 to 12 millions.
Nevertheless, higher EVs figures will be tested in cross-sections models.
5.1.7 Electrical cars
There are two options how EVs can be charged, fixed (Dump charge) or flexible (Smart
charge). For this reference scenario fixed mode had been chosen. The technical simulation
will consider the electricity demand for EVs as fixed and will base it on distribution file
(Lund, 2017).

29
5.1.8 Supply
5.1.9 Heat and electricity
Currently Germany has the overcapacity in power plants fleet (Agora Energiewende, 2015
(b)). However, in the future when the renewable energy source capacity will be expanded,
the need for the back-up capacity will decline significantly, approximately by half (World
Wild Fund, 2017). It can be economically difficult for back-up capacity power plants to
generate returns on investments with less hours available (Figure 18, Bloomberg New Energy
Finance)
Figure 19: Utilization of back-up capacity in Germany with different variable renewable energy shares
This figure shows that when the variable renewable energy (VRE) sources will reach 60% the
need for back-up capacity will drop approximately by half compared to the current RES
penetration.
Therefore, for the reference scenario for 2030 the power plant capacity will be halved
compared with 2015 models data (Mathiesen, Hansen, 2017). Nevertheless, it will not be
the case for central condensing power plants (PP). If the capacity of PP is reduced too much
in the system, EnergyPlan starts to show warnings that more capacity in needed or the
transmission line capacity is not adequate (Lund, 2017). The optimal number of PP plants
for the reference scenario was set to be 52000 MW.

30
5.1.10 Electricity only
One of the big changes in the electricity sector by 2030 is that the nuclear power will be
already phased-out from the system. Nuclear plants production share will be compensated
by increased number of wind power turbines (onshore and offshore) and solar PV power
plants (91 GW, 20 GW and 86 GW respectively).
It is assumed that the renewable share in the electricity sector will be around 60-65%
(Agora Energiewende, 2018).
Furthermore, it is predicted that by 2030 the pumped hydro capacity will be around 5,4 GW
and the production from storage will amount approximately 22000 GWh (Irena, 2015).
If it will not be significant delays, the transmission capacity in Germany should be expanded
significantly, and reach 31,3 GW (Agora Energiewende, 2015 (b)).
5.1.11 Heat only
This section in EnergyPlan software requires specify mostly renewable heat supply sources,
such as solar thermal, HP and excessive heat from industries. The solar thermal share in DH
systems was found to be only 0,55 TWh per year (Irena, 2015). Large-scale HP will be
introduced into the system in the later models.
5.1.12 Fuel distribution
There are two options how to define the fuel distribution in power plants; the distribution
can be fixed or variable. The option fixed indicates how much exactly the specific group of
power plants consumed energy, and the option variable shows the ratio among fuels (Lund,
2017). Due to the lack of data of how much every group of energy units will use fuel in the
future, it was chosen to use variable option. The most used fuel for heat and electricity
production units for 2030 will be natural gas followed by coal and biomass, the ratio goes
accordingly 114:66:27 (World Wild Fund, 2017). One of the reasons why biomass will not be
the dominate source at the market in the future, because it interferes with food production
and the production for renewable fuel (Irena, 2015).
5.1.13 CO2
It was specified how much every fuel after being burned emits CO2 gases (BluePrint
Germany, 2009). Off course, coal is the most unclean fuel to burn (emits 103 kg/GJ), while in
comparison natural gas emits roughly two times less as coal.
5.1.14 Balancing and storage
In total there are three storage groups: electricity, heat, and liquid and gas fuel.

31
5.1.15 Electricity storage
5.1.16 Critical excess electricity production
In case there is CEEP in the system (a surplus electricity production when there are
bottlenecks in the transmission lines) there are different options in EnergyPlan to choose
from of how to deal with this problem (Figure 19). In order to avoid critical excess electricity
production, the system can shut down renewable energy plants, replace CHP energy units
with boilers, use HP instead of boilers etc. (Lund, 2017).
Figure 20: Options to deal with the critical excess electricity production
However, for this study different approach was chosen. CEEP will not be regulated, and the
reason for this it to check if cross-section models are able to reduce the possible
bottlenecks in the future energy systems.
5.1.17 Electricity grid stabilization requirements
There are few options to choose from how to stabilize the grid. However, due to the
complexity only one option, minimum grid stabilization share was set to be 30%. It is
recommended share for power units (CHP, hydro power, geothermal) to ensure that the
grid is balanced (Lund, 2017).
5.1.18 Electricity storage capacity
In the future it is expected that electricity storage capacity in Germany will be around 8,4
GW (Irena, 2015; IEC, n/a). The biggest share of this number will be taken by pumped hydro
power and the rest will go for batteries.

32
There is also an option to allow simultaneous operation between turbine and pump. It was
chosen to allow simultaneous operation, because not only old pumped hydro plants are in
this category, which in the past was designed to operate in a way that at night when
electricity is cheap to pump water upwards and then release water through the turbine
during the day when the electricity price is higher, but also batteries which can be charged
and discharged at the same moment.
5.1.19 Thermal storage
Thermal storage in the reference scenario was set to be zero, as the current and future
capacity for 2030 is predicted to be insignificant.
5.1.20 Costs
All the costs for this project such as investments, operation and maintenance, fuels, and
lifetimes for the 2030 period is incorporated from cost database made by Aalborg University
researchers (EnergyPlan, cost database).
5.1.21 Verifying reference scenario models data
Reference scenario was built on already existing energy model, which was already verified
in the study about future thermal energy systems in four different countries, including
Germany (Mathiesen, Hansen, 2017). The outputs of the model in this study were similar to
the real Germany’s energy system data for 2015. Therefore, it can be assumed that the
starting model is closely resembles real life energy system.
Before starting to verify the reference scenario for 2030, first the accuracy of the data
needs to be checked. And to do that, one paper outlines which parameters in particular to
follow (Connolly, 2015). These parameters are: energy demands, consumption, energy
production for the specific plants, efficiencies and fuel consumption. The input/output final
document can be found in Appendix.
In order to verify the reference scenario for 2030, the models outputs will be compared to
the two studies data, which were mainly used to build this scenario (Agora Energiewende,
2018; Irena, 2015). Table 1 compares the final outputs of the three studies.

33
CO2 emissions,
mln, t
Primary enregy
consumption, TWh/year
RES share, percent of
primary energy, %
RES share, percent in electrcity sector,%
Renewable electricity
production, TWh, year
Energiewende, Big Picture
2030
424 2600 31 60 370
Renewable Energy
Prospects: Germany
439 2041 37,1 65 376
Reference scenario
460 2342 23,9 63 324
Table 1: Reference model’s verification
The main parameters in the table more or less comply with previous studies data. However, one
output which is not close is RES share of primary energy. Even though the RES capacities are
mostly identical, in this study reference scenario it was assumed that by 2030 most power
plants still will run on mainly natural gas and coal. And at times when weather conditions are
not favorable for intermitted RES production, fossil fuel consumption will take the biggest
share. Another assumption is that other studies for future models for electricity storage
considered higher capacities of battery storage, while this study considered rather conservative
numbers, and focused more on cross-sector integration.
Overall, it needs to be noted that there is no one right model for 2030. Future projections
always will be uncertain. However reliable data gathering can bring energy models closer to the
real situation in future energy systems.
5.2 Cross-section integration scenario
The aim of the alternative scenarios is to find out if the integration of surplus electricity
production into the heating and transport sectors can reduce the cost and CO2 emissions
for the whole Germany’s energy system by 2030. To do that, these new models will have to
be compared to the previously discussed reference scenario. It needs to be noted that not
only two previously mentioned parameters will be compared, but other criteria such as
CEEP, EEP, total fuel consumption, PP and CHP electricity production and PP capacity. By
considering these criteria, the analysis will be given based on how the energy system
(reference scenario) responds to the made changes.

34
The cross-section scenario basically will be the same as the reference scenario, except that
different changes will be made in heating and transport sectors. In first model, more V2G
cars will be added to the transport section. Next, individual and large-scale HP capacities in
heating section will be expanded. In the third model heat storage will be included to
balance HP and CHP units. And finally all of these changes will be included in one model to
have a full picture of how and why the cross-section scenario is different from the reference
scenario.
5.2.1 V2G
To start with the transport sector, additionally 11 million of V2G cars will be added to the
system. It is 30 TWh/year of added electricity demand for energy system (Agora
Enegiewende, 2018). The same demand will be removed from petrol section assuming that
the e number of cars on the roads by 2030 will be same (44000). Even though it’s rather
ambitious number to reach, still majority of cars by 2030 will be run on fossil fuel, such as
diesel or petrol.
EnergyPlan, in order to calculate how much V2G cars will demand electricity and how much
of electricity will be needed for a specific time period asks specific information. This
information are maximum share of cars during peak demand (0,2), capacity of grid to
battery connection, share of parked cars grid connected (0,7), efficiencies of grid to battery
and battery to grid (0,9), battery capacity.
Most of this information was taken from the EnergyPlan documentation (Lund, 2017). The
rest, such as batter battery capacity was calculated assuming that 12 million cars average
battery capacity is 20 kWh and 30% of these cars are available to charge/discharge (IEC,
n/a). It resulted that the available battery capacity of 12 million V2G cars is equal to 72
GWh.
5.2.2 HP
In the heating sector, individual HP capacity will be expanded, while large-scale HP will be
added to this model (reference scenario didn’t had large-scale HP). The number of HP will
be doubled, 5 million HP will be added in this model. 10 million of individual HP is almost
half of the total heating demand. The increased heat production from HP will take the same
share from oil-fired and gas-fired boilers (Table 2).

35
Individual heating Reference scenario, TWh year HP scenario, TWh, year Change, TWh/year
Coal boilers 0 0 0
Oil boilers 43,76 0 -43,76
Ngas boilers 218,45 141,95 -76,50
Biomass boilers 54,60 54,60 0
HP 120 240 120
Table 2: The changes in individual heating after expanding HP capacity
Indeed, boilers based on coal will be totally removed from the system. For group 3 (central
CHP plants) 3000 large-scale HP supply will be included. This number represents the
predicted heat production by 2030 of this technology (Irena, 2015).
5.2.3 Storage
In the next model, HP and CHP heat units will be connected to the hot water tanks.
Assuming that one house will contain optimal size of thermal storage equal to 100l, the
total capacity of thermal storage for 10 million HP will be 87,7 TWh/year.
Both HP and CHP in group 3 will have a capacity of hot water tanks equal to 286 GWh
energy, while group CHP plants due to the small number, will contain only 5,1 GWh.
The storage capacity for individual, large-scale HP and CHP units were calculated according
to these assumptions:
1m3 of stored water in thermal storage has contains 87,7 kWh of energy (Energy
storage)
Optimal storage capacity for a typical house is 100l (Danish Energy Agency)
The optimal thermal storage capacity for 1 MWel CHP unit is 125m3 (Streckiene, G.,
Martinaitis, V., 2009
Finally, the last model of cross-section scenarios will contain all above mentioned added
capacities of V2G, HP and Storage. The reason for this is to check how all the technologies
work together, and if it can be the best model in terms of CO2 emissions and annual costs
for the whole system.

36
6.0 Technical-economical analysis and the results This chapter will graphically illustrate the outputs from all the simulated models of this
study. Then different parameters will be compared, and finally the results will be analyzed
to find out if cross-section excess electricity integration in different energy sectors can
improve the reference scenario.
6.1 CO2 and total fuel consumption
The first two parameters are total fuel consumption and CO2 emissions (Figure 20). As it
was mentioned in previous chapters, technical simulation is designed to find out the least
fuel-consuming solution, which consequently leads to low CO2 emissions as well (Lund,
2017)
Figure 21: The fuel consumption and CO2 emissions comparison among reference scenario and cross-section scenarios
From this figure it can be seen that the most CO2 friendly scenario is HP+Storage. This
reduction occurred for several reasons. Firstly, increased capacity of individual HP reduced
the share of gas-fired and totally excluded oil-fired boilers.
0 500 1000 1500 2000 2500
Fuel consumption, TWh year
CO2, Mt
Fuel consumption, TWh year CO2, Mt
V2G+HP+Storage 2290.82 447.98
HP+Storage 2239.01 437.87
HP 2300.44 451.92
V2G 2372.09 465.56
Reference 2342.6 460.57
Total fuel consumption and CO2 emissions

37
Secondly, the introduction of large-scale HP into the model changed heat-only boilers,
which were fed on natural gas (the technical simulation for heat-only boilers gives the last
priority). And last but not the least, thermal storage capacity further reduced CO2 emissions
and fuel consumption. To explain this, hot water tanks in technical simulation is used to
minimize EEP and PP (Lund 2017). When PP electricity production drops, fuel consumption
and CO2 emissions follow similar pattern as well. To illustrate this in numbers, compared to
the reference scenario fuel usage of fuel and CO2 emissions in HP+storage scenario fall by
103,59 TWh/year and 22,7 million tones accordingly. Approximately for both parameters it
is a 5% reduction.
In addition, table 3 shows which kind of fuel consumption for all five scenarios had
increased and which had declined. The basic trends moving from reference to the
V2G+HP+Storage models were that coal and biomass numbers grew up, oil and natural gas
declined, while renewable remained almost stable. The coal numbers increased because
after added new capacity, electricity demand went up, thus PP production as well. While oil
and natural gas followed different pattern because added capacity of HP, V2G cars also
changed boilers based on natural gas and oil, and cars based on oil. The least fuel-consumed
model with all technologies saved 54,85 TWh/year oil and 75,57 TWh/year natural gas
compared with the reference scenario.
Coal Oil Natural Gas Biomass Renewables
Reference 301,51 574,29 907,99 250,46 308,35
V2G 320,53 544,14 940,83 258,24 308,36
HP 344,39 519,44 835,32 261,07 304,02
HP+Storage 327 519,44 832,42 260,89 304,02
V2G+HP+Storage 353 489,44 878,24 271,52 304,02
Table 3: Fuel balance for all the scenarios
One cross-section scenario had opposite trends that the rest of the models. Increased V2G
cars had a negative impact for the fuel consumption and CO2 emissions. One of the reasons
is that increased demand for electricity resulted in higher PP production (Figure 21).

38
6.2 Central power plants production
Figure 22: PP and CHP comparison among reference scenario and cross-section scenarios
The figure above shows that by adding extra capacity in the models, automatically PP
generation in order to meet the increased electricity demand is growing, except in the
model with the thermal storage (HP+Storage), where the electricity generation declined
from PP.
However, the figure 21 doesn’t explain the full picture when it comes to PP electricity
production. For every new model different capacities of PP units were set in order to avoid
warnings, such as grid stabilization problem or PP/import problem. In order to avoid these
signals in EnergyPlan the user has either to expand transmission line capacity, PP
production or increase the minimum share of large CHP and PP (Lund, 2017).
Table 4 illustrates that with the increasing electricity demand in order to keep the energy
system stable, additional capacity of PP units are required, again except in HP+Storage
scenario.
Scenarios The capacity of PP units, MW
Reference scenario 52000
V2G 57000
HP 70000
HP+Storage 61000
V2G+HP+Storage 72000
Table 4: The capacity of PP units among reference scenario and cross-section scenarios
0 50 100 150 200 250 300
PP, TWh/year
PP production, TWh/year
V2G+HP+Storage
HP+Storage
HP
V2G
Reference
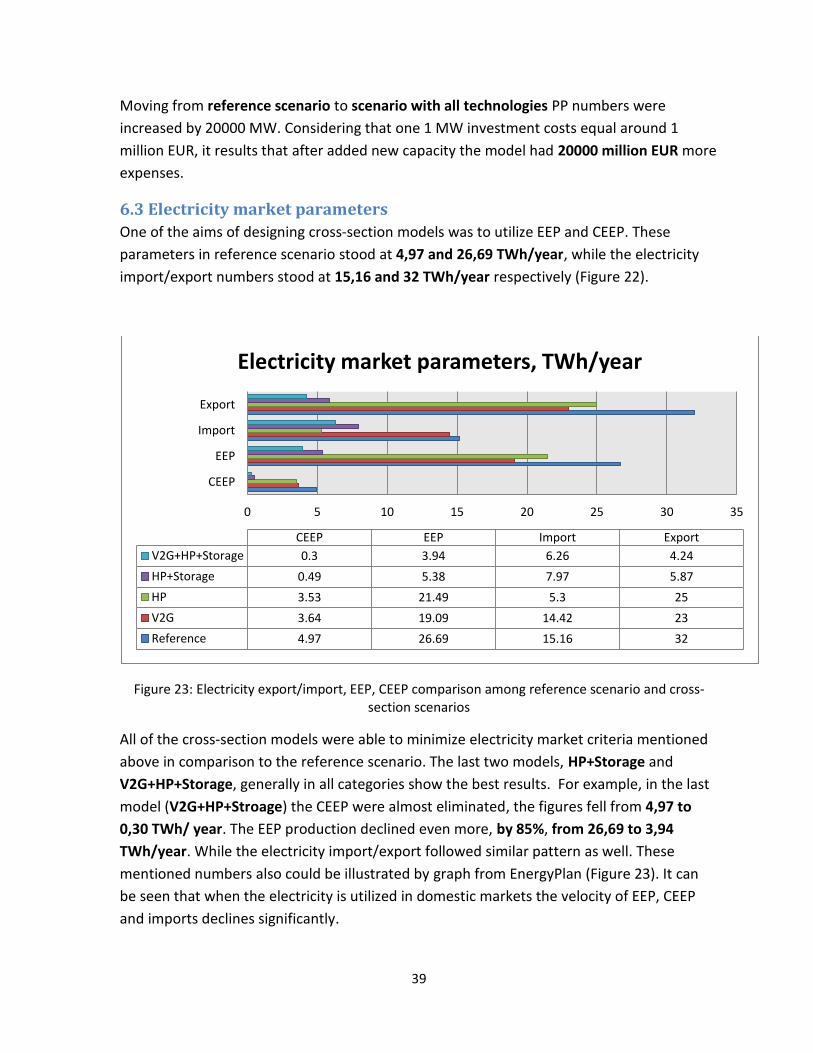
39
Moving from reference scenario to scenario with all technologies PP numbers were
increased by 20000 MW. Considering that one 1 MW investment costs equal around 1
million EUR, it results that after added new capacity the model had 20000 million EUR more
expenses.
6.3 Electricity market parameters
One of the aims of designing cross-section models was to utilize EEP and CEEP. These
parameters in reference scenario stood at 4,97 and 26,69 TWh/year, while the electricity
import/export numbers stood at 15,16 and 32 TWh/year respectively (Figure 22).
Figure 23: Electricity export/import, EEP, CEEP comparison among reference scenario and cross-section scenarios
All of the cross-section models were able to minimize electricity market criteria mentioned
above in comparison to the reference scenario. The last two models, HP+Storage and
V2G+HP+Storage, generally in all categories show the best results. For example, in the last
model (V2G+HP+Stroage) the CEEP were almost eliminated, the figures fell from 4,97 to
0,30 TWh/ year. The EEP production declined even more, by 85%, from 26,69 to 3,94
TWh/year. While the electricity import/export followed similar pattern as well. These
mentioned numbers also could be illustrated by graph from EnergyPlan (Figure 23). It can
be seen that when the electricity is utilized in domestic markets the velocity of EEP, CEEP
and imports declines significantly.
0 5 10 15 20 25 30 35
CEEP
EEP
Import
Export
CEEP EEP Import Export
V2G+HP+Storage 0.3 3.94 6.26 4.24
HP+Storage 0.49 5.38 7.97 5.87
HP 3.53 21.49 5.3 25
V2G 3.64 19.09 14.42 23
Reference 4.97 26.69 15.16 32
Electricity market parameters, TWh/year

40
Figure 24: The comparison of EEP,CEEP and import parameters among reference and V2G+HP+Storage scenarios
6.4 Total annual costs
The last but not the least parameter to evaluate different models is total annual costs. It
consists of total variable, fixed operation and annual investment costs (Figure 24).
Figure 25: Total annual costs comparison among reference scenario and cross-section scenarios
Compared to the reference scenario, the lowest cost for the whole energy system was
generated by the scenario where all three technologies are included, V2G, HP and thermal
storage. This scenario total costs stand at 433336 million EUR, while the reference scenario
had 435767 million EUR costs, the difference of 2431 million EUR. The cheapest model in
terms of the lowest total annual costs was followed by V2G, HP+Storage, Reference and HP
scenarios.
Reference V2G HP HP+Storag
e V2G+HP+S
torage
Annual investments costs 192975 191053 198721 198298 196697
Fixed operation costs 137296 136722 138277 138004 137615
Total variable costs 105496 105993 99880 98387 99023
0
100000
200000
300000
400000
500000 Total annual costs, mln EUR

41
Annual investments costs grew in all cross-section models, while total variable costs
declined, except for V2G scenario. This can be explained that new investments to more
advanced technologies are more expensive but total variable costs (which mostly are fuel)
are lower. The V2G had shown opposite trends because it is predicted that investments
costs by 2030 to buy EVs will be cheaper than cars which uses fossil fuel.

42
7.0 Sensitivity Analysis This chapter will further simulate cross-section, V2G+HP+Storage scenario, in order to find
out how the parameters of energy system will be changed compared to the reference
scenario if different prices and different capacities will be tested.
7.1 Price reduction
In recent decade, the price of new technologies gets cheaper and develops faster than
different institutions had predicted in the past. Therefore, it can be considered as a valid
argument to use this indicator for the first part of sensitivity analysis to check how much the
total annual costs for the whole energy system in Germany will be reduced if the costs for
EVs and HP will be reduced by 20% and 50% (Figure 24).
Figure 26: Total annual costs comparison among reference scenario, V2G+HP+Storage and 20%, 50% price reduction
The figure shows that the total annual costs after 50% and 20% price cut dropped by
10,16% and 3,8% respectively compared to the reference scenario. Thus, if due to the
economies of scale technologies will further develop, it can be expected that EEP
integration into heating and transport sectors can become even more economically
feasible.
390000 400000 410000 420000 430000 440000
Total annual costs, mln EUR
Total annual costs, mln EUR
50% price reduction 409557
20% price reduction 423795
V2G+HP+Storage 433336
Reference 435767
Total annual costs, mln EUR

43
7.2 Capacity expansion
The second part of the sensitivity analysis will test the feasibility of expanding HP and V2G
cars capacity. The same as in previous part, capacities will be increased by 50% and 20%. In
this part, after made adjustments, not only one parameter changed, like total annual costs
in price reduction part, but changes were seen for the most of criteria (Table 4).
Fue
l con
sum
ptio
n,
TWh
year
CO
2, M
t
CEEP
EEP
Imp
ort
Expo
rt
Total A
nn
ual co
sts
PP
, TW
h/ye
ar
RES in
prim
ary e
ne
rgy, %
RES in
ele
ctricity se
ctor, %
Electricity p
rod
uctio
n
from
RES, TW
h/ye
ar
CH
P, TW
h/ye
ar
Reference 2342.6
460.57 4.97 26.69 15.16 32 435767 216.54 23.9 63.7 324.9 102.11
V2G+HP+Storage 2290.82 447.98 0.3 3.94 6.26 4.24 433336 266.73 25.1 60.7 322.6 110.63
20% capacity expansion
2291 448.94 0.13 2.59 4.74 2.71 409192 288.15 25.3 60.5 335.6 112.15
50% capacity expansion
2280 451.66 0.84 1.59 3.08 1.62 410928 321.7 25.5 60.2 340.2 113.7
Table 4: Different parameter comparison among reference scenario, V2G+HP+Storage and 20%, 50% capacity expansion for HP and V2G cars
From the table 4 it can be seen that the 20% capacity expansion at least in terms of CO2
emissions and total annual costs shows better results that 50% capacity expansion scenario.
Compared with the reference scenario, the cost was lower by 25,575 million EUR. This
comparison proves that there are some economical limits to expand specific technology in
the system.

44
8.0 Discussion This chapter will discuss the limitations of the chosen approach used to solve the outlined
problems in this study. Different considerations will be given to question the validity of the
generated results from the simulated models. Next, the proposals for the future studies will
be suggested.
8.1 Validity
The basic idea of this study was to build a reference scenario and the try to improve it by
building alternative models, which slightly different energy systems. To do that, the data for
building these scenarios was taken from different studies. Taking into account that these
studies were made for future energy systems as well, it can be assumed that a lot of
uncertainty already exists in this project. Furthermore, inserted data was digested by
EnergyPlan software and then the results were generated. These results were determined
by many factors, but probably most important is simulation strategy. Technical simulation
over market-economic simulation for already explained reasons in previous chapters was
chosen. However, in real life energy systems don’t work in closed systems. It can be argued,
that without operating electricity market, the validity of the results of this study can be
questionable. Moreover, counter arguments could be given that when technologies were
added separately, market-economic simulation could be used to compare different
technologies individually. With market-economic solution the least-cost solution would be
found for every technology, but not for the whole system.
The next point for discussion is the reference scenario. Instead of being made business as
usual case, the reference scenario basically was designed in a way which already would
meet all climate and goals targets. On top of that, this model (except high numbers of EVs)
already contains high numbers of RES. Thus, it was hard to find new ways how significantly
further improve the outputs. Despite that, this study was able to prove that cross-section
integration could further, even though insignificantly, produce better results. And again, the
reason for the choice of the reference scenario with high share of RES is because is more
realistic considering how fast the prices to install new technologies is falling down, and how
fast technologies improves.
8.2 Future studies
This study aimed to reduce CO2 emissions, CEEP and costs for the whole system only by
using few technologies. If the boundaries would be expanded than more tools will be
available to solve the same problems. One tool or technology, and probably most realistic
until 2030, would be to expand DH and CHP systems. In this project analysis section it was
seen that at times when back up capacity (mostly PP) had to cover electricity demand, most
of the fossil fuel were used.

45
Therefore, increased number of CHP would increase energy efficiency, and less fuel for the
whole system would be consumed. However, the technical-economic calculations need to
be made to find out if it is worth to invest into new DH infrastructure.
In transport sector probably the alternative to cars which run on fossil fuel will not be one
silver bullet solution. But rather few alternative technologies will play some part in the
future sustainable transport development (Lewe, H-U). Thus, next studies, besides the
electrification described in this project, could investigate the further feasibility of biofuels,
hydrogen or other synthetic fuels. First, hydrogen production could be almost carbon
neutral and second the price of electricity could drop further, thus this technology could
become more competitive. The other option is to explore possibilities for different synthetic
fuels. This fuel had a big advantage because the fuel can directly be used in combustion
engines, and no additional investment is needed. Considering the fact that most of the car
park currently is running on combustion engines, synthetic fuels could play an important
role to help reduce GHG emissions.
This study was able to minimize CO2 emissions. But if the new study would be needed to
find out the most cost-effective way to do that until 2030, probably it would be the coal
power plant fuel conversion to natural gas (Lewe, H-U).
Germany, the same as EU, imports vast amounts of fossil fuel from outside the EU borders
(mainly Russia). This study proved that is possible to save fossil fuel. The future studies
could calculate how much less fossil fuel would be needed to import, and how much money
Germany would save. In addition, different study could calculate how much value is created
when is investing in domestic markets and sustainable technologies are installed. The value
could be measured in job creation, less pollution, lower health costs etc.

46
9.0 Conclusion The present study had examined energy system in Germany where the growing share of
two particular technologies, wind and solar PV, will be the backbone of energy production
in the future. This project took a different approach how to deal with the overproduction of
the electricity from intermittent RES sources. Instead of focusing on expanding
interconnector’s capacity to neighboring countries, the surplus electricity production was
integrated into heat and transport sectors. Three technologies, HP, TS and V2G cars, had
been employed for this task. They applicability were determined by a few number of studies
and theories, which stresses that these technologies in particular are relevant to use for
cross-section integration in the period set in this study.
However, to change the direction of the electricity flow was not the main aim of this study.
At the beginning of this work also few problems were outlined, one of them is CO2
emissions, which directly can be linked to the fossil fuel consumption. This problem
basically determined that in Energyplan software, technical simulation strategy was chosen,
which optimizes the energy production in a way that the least fuel is used. The second
outlined parameter was the cost for the whole system. This is based on the assumption that
energy production in future energy systems will increasingly be shift from centralized
systems based on fossil fuel to the decentralized systems based on RES. This transformation
definitely will have significant costs. To put into this study context, the socio-economic
feasibility was tested if the benefits of expanding RES capacity and then integrating some
amount of surplus electricity domestically can be also a cost-effective solution.
And the best way to find out if the studies goals were implemented is to answer the
research question:
To what extent cross-sector excess electricity integration into heating and
transport sectors could reduce the CO2 emissions and the costs for the whole energy
system in Germany by 2030?
According to the results for the CO2 emissions and total annual costs, it can be concluded
that basically almost all energy models showed better results that the reference scenario
(Table 5).

47
Scenarios CO2 emissions, Mln,t Total annual costs, Mln EUR EEP, TWh/year
CEEP, TWh/year
Reference 460,57 435767 26,69 4,97
V2G 465,56 433368 19,09 3,64
HP 451,92 436877 21,49 3,53
HP+Storage 437,87 434689 5,38 0,49
V2G+HP+Storage 447,98 433336 3,94 0,3
20% price reduction 447,98 423795 3,94 0,3
50% price reduction 447,98 409557 3,94 0,3
20% capacity expansion 448,94 409192 2,59 0,13
50% capacity expansion 451,66 410928 1,59 0,04
Table 5: The final comparison of CO2 emissions and total annual costs among all the scenarios made in the study
The best results for CO2 emissions and the total costs were generated by HP+Storage and
20% capacity expansion respectively. This proves, that heat sector in particular could play
an important role to meet Germans climate goals, considering the fact that currently most
of the heating is based on inefficient energy units fed on fossil fuel.
Table 5 also confirms that if the capacity increased, technologies are able to utilize
overproduction of electricity. And consequently, the electricity markets parameters, such as
EEP and CEEP falls accordingly. This situation can benefit Germany energy system in
different ways. First, reduced amount of EEP means that instead of exported electricity at
the cheap price neighboring countries, integrated domestically could have a bigger value
economically. In most cases to import electricity, due to simply laws of demand and supply,
cost more than to export. Secondly, reduced number of CEEP gives promises in the future,
that cross-section integration could play a part in the planning of future grid systems to
avoid the bottlenecks.
Overall, this study had showed from different angles that cross-section electricity
integration can have positive effects on future energy system in Germany. And together
with other flexibility measures can be a solution to balance electricity production from solar
PV and wind power.

48
Bibliography Agora Energiewende, 2015 (a). Understanding the Energiewende.
Available online at: https://www.agora-
energiewende.de/fileadmin2/Projekte/2015/Understanding_the_EW/Agora_Understanding
_the_Energiewende.pdf
Irena, 2015. Renewable energy prospects, Germany.
Available online at: http://www.irena.org/publications/2015/Nov/Renewable-Energy-
Prospects-Germany
AG Energiebilanzen, 2017.
Available online at: https://ag-energiebilanzen.de/6-0-Primaerenergieverbrauch.html
Agora Energiewende, 2015 (b). Report on the German power system.
Avialable online at: https://www.agora-
energiewende.de/fileadmin/downloads/publikationen/CountryProfiles/Agora_CP_Germany
_web.pdf
Agora Energiewende, 2017. Heat transition 2030. Key technologies for reaching the
intermediate and long-term climate targets in the building sector
Available online at: https://www.agora-
energiewende.de/fileadmin/Projekte/2016/Sektoruebergreifende_EW/Heat-Transition-
2030_Summary-WEB.pdf
Agora Energiewende, 2018. Energiewende 2030-The Big Picture.
Available online at: https://www.agora-
energiewende.de/fileadmin2/Projekte/2017/Big_Picture/134_Big-Picture_EN_WEB.pdf
Cleanenergywire. Auctions bring solar power price to new record low.
Available online at: https://www.cleanenergywire.org/news/auctions-bring-german-solar-
power-price-new-record-low
IEC, n/a. Electrical Energy Storage.
Available online at: http://www.iec.ch/whitepaper/pdf/iecWP-energystorage-LR-en.pdf

49
Mathiesen, Lund, 2015. Mathiesen BV, Lund H, Connolly D, Wenzel H, Østergaard PA,
M€oller B, et al. Smart energy systems for coherent 100% renewable energy and transport
solutions. Appl Energy 2015;145:139e54.
Availabline online at: http://dx.doi.org/10.1016/j.apenergy.2015.01.075.
Agora Energiewende, 2014. Electricity Storage in the German Energy Transition.
Available online at: https://www.agora-
energiewende.de/fileadmin/Projekte/2013/speicher-in-der-
energiewende/Agora_Speicherstudie_EN_web.pdf
Lund, Østergaard, 2016. Energy Storage and Smart Energy Systems
Available online at: https://journals.aau.dk/index.php/sepm/article/view/1574
Lund, 2017. EnergyPlan. Advanced Energy System Analysis Computer Model.
Availabe online at: http://www.energyplan.eu/wp
content/uploads/2017/11/documentation.pdf
Connolly, Lund, 2010. Connolly D, Lund H, Mathiesen BV, Leahy M. Modelling the existing
Irish energy-system to identify future energy costs and the maximum wind penetration
feasible. Energy 2010;35(5):2164e73.
Availabe online at:
https://www.sciencedirect.com/science/article/pii/S0360544210000484?via%3Dihub
Connolly, 2015. Finding and Inputting Data into EnergyPlan
Available online at: http://www.energyplan.eu/wp-content/uploads/2013/06/Finding-and-
Inputting-Data-into-the-EnergyPLAN-Tool-v5.pdf
Thellufsen, Lund, 2017. Thellufsen, J., S., Lund, H. Cross-border versus cross-sector
interconnectivity in renewable energy systems. Energy. Volume 124, 1 April 2017, Pages
492-501
Available online at:
https://www.sciencedirect.com/science/article/pii/S0360544217302943?via%3Dihub

50
Krajacic, Duic, 2011. Krajacic, G., Duic, N., Zmijarevic, Z., Mathiesen, B., V., Vucininic, A., V.,
Carvalho. M., G.Planning for a 100% independent energy system based on smart energy
storage for integration of renewables and CO2 emissions reduction. Applied Thermal
Engineering 31 (2011) 2073-2083.
Available online at:
https://www.sciencedirect.com/science/article/pii/S1359431111001463
Lund, 2005. Lund, H. Large-scale integration of wind power into different energy systems.
Energy 2005;30:2402e12.
Available online at: http://dx.doi.org/10.1016/j.energy.2004.11.001
Agora Energiewende, 2014. Electricity Storage in the German Energy Transition.
Available online at: https://www.agora-
energiewende.de/fileadmin/Projekte/2013/speicher-in-der-
energiewende/Agora_Speicherstudie_EN_web.pdf
Connolly, D., Lund, H., 2013. Holistic and Integrated Energy Systems for the era of 100%
Renewable Energy.
Available online at:
http://vbn.aau.dk/files/78422810/Smart_Energy_Systems_Aalborg_University.pdf
IEA, 2016. The role of electricity storage in the German energy system of the future
Available online at:
https://www.iea.org/media/workshops/2016/energystorageeuwp/Theroleofelectricitystora
geintheGermanenergysystemofthefuture.pdf
Lund, Østergaard, 2016. Energy Storage and Smart Energy Systems
Available online at: https://journals.aau.dk/index.php/sepm/article/view/1574
Energinet, 2018. Technology Data for Energy Plants for Electricity and District heating
generation.
Available online at:
https://ens.dk/sites/ens.dk/files/Analyser/technology_data_catalogue_for_energy_plants_
el_and_dh_-_aug_2016_update_march2018.pdf

51
Mathiesen, Lund, 2009. Mathiesen BV, Lund H. Comparative analyses of seven technologies
to facilitate the integration of fluctuating renewable energy sources. IET RenewPower Gen
2009/6;3:190–204.
Bloomberg New Energy Finance. Flexibility and Power Market design
Availabe online at: https://about.bnef.com/future-energy-summit/new-york-
videos/?vid=263981217
Averfalk, Ingvarsson, 2017. Averfalk, H., Ingvarsson, U., Persson, U., Gong, M., Werner, S.,
(2017). Large heat pumps in Swedish district heating systems.
Available online at: http://www.sciencedirect.com/science/article/pii/S1364032117307839
DAE, 2016. Technology Data for Individual Heating Plants and Energy Transport
https://ens.dk/sites/ens.dk/files/Analyser/technology_data_catalogue_for_individual_heati
ng_plants_october_2017.pdf
Mathiesen, Hansen, 2017. Mathiesen, B., V., Hansen, K. The role of Solar thermal in Future
Energy Systems
Available online at:
http://vbn.aau.dk/files/265304574/IEA_SHC_Task_52_STA_AAU_report_20170914.pdf
BluePrint Germany, 2009. A Strategy for a Climate Safe 2050.
Available online at: http://www.wwf.de/fileadmin/fm-wwf/Publikationen-
PDF/WWF_Blueprint_Germany.pdf
World Wild Fund, 2017. Germany’s Electric Future. Coal phase-out 2035.
Available online at: https://www.oeko.de/fileadmin/oekodoc/Coal-phase-out-2035.pdf
EnergyPLan, costdatabase.
Available online at: http://www.energyplan.eu/resourcesbycountry/

Output specifications Reference scenario.txt The EnergyPLAN model 13.0District Heating Production
Gr.1 Gr.2 Gr.3 RES specification
JanuaryFebruaryMarchAprilMayJuneJulyAugustSeptemberOctoberNovemberDecember
AverageMaximumMinimum
Total for the whole yearTWh/year
District heating
MW
000000000000
000
0.00
Solar MW
000000000000
000
0.00
CSHP MW
000000000000
000
0.00
DHP MW
000000000000
000
0.00
District heating
MW
000000000000
000
0.00
Solar MW
000000000000
000
0.00
CSHP MW
000000000000
000
0.00
CHP MW
000000000000
000
0.00
HP MW
000000000000
000
0.00
ELT MW
000000000000
000
0.00
Boiler MW
000000000000
000
0.00
EH MW
000000000000
000
0.00
Stor- age MW
000000000000
000
Ba- lance MW
000000000000
000
0.00
District heating
MW
33353315172648318838382926612661266126612661
1949631352
14800516592661
130.00
Solar MW
183471
10010695778478542712
63434
0
0.55
CSHP MW
000000000000
000
0.00
CHP MW
20612186131920014664345123572383234124152525
1500515576
989521303
0
86.92
HP MW
000000000000
000
0.00
ELT MW
000000000000
000
0.00
Boiler MW
12622119657139407427320920123616881
437314586
464726000
0
40.82
EH MW
000000000000
000
0.00
Stor- age MW
000000000000
000
Ba- lance MW
101905740000000
921178
19417115
0
1.70
RES1 Wind
GW
14211214119
131011151231
14910
126
RES2 Photo Voltaic
GW
138
12139888521
6860
56
RES3 Offshore Wind
GW
79477677788
12
8200
66
RES 4-7
GW
000000000000
000
0
Total
GW
223324333125282526282244
28127
1
249
Own use of heat from industrial CHP: 0.00 TWh/year
NATURAL GAS EXCHANGEANNUAL COSTS (Million EUR)Total Fuel ex Ngas exchange = Uranium = Coal = FuelOil = Gasoil/Diesel= Petrol/JP = Gas handling = Biomass = Food income = Waste =
Total Ngas Exchange costs =
Marginal operation costs =
Total Electricity exchange = Import = Export = Bottleneck = Fixed imp/ex=
Total CO2 emission costs =
Total variable costs = Fixed operation costs =
Annual Investment costs =
TOTAL ANNUAL COSTS =
03473924
218311649544057499
00
679-1423
2162009
54628
32436
1015
1481
15936
105496137296
192975
435767
JanuaryFebruaryMarchAprilMayJuneJulyAugustSeptemberOctoberNovemberDecember
AverageMaximumMinimum
Total for the whole yearTWh/year
DHP &Boilers MW
14849140768398479332124623627719796
514417160
546730588
0
48.03
CHP2CHP3 MW
32526293723029823139544637193761369438113984
2367824579
1561533617
0
137.16
PPCAES MW
309992998429992302474267341390441684259948201425743623519955
3659476772
0
321.45
Indi-vidual MW
64223590124552329185433922622458257529003313
3621860837
25983102125
0
228.23
Transport MW
000000000000
000
0.00
Indu.Var. MW
169021690216902169021690216902169021690216902169021690216902
169021690216902
148.47
Demand Sum MW
159500149348131113104267696816452067526660477201166870
118177139433
10056222327330273
883.34
Bio- gas MW
000000000000
000
0.00
Syn- gas MW
000000000000
000
0.00
CO2Hy gas MW
000000000000
000
0.00
SynHy gas MW
000000000000
000
0.00
SynHy gas MW
000000000000
000
0.00
Stor- age MW
000
-876-30881-3516
0000
2222413623
080090
-66253
0.00
Sum MW
159500149348131113105142100562680366752666047720116687095952
125810
10056222327330273
883.34
Im- port MW
159500149348131113105142100562680366752666047720116687095952
125810
10056222327330273
883.34
Ex- port MW
000000000000
000
0.00
RES Share: 23.9 Percent of Primary Energy 63.7 Percent of Electricity 324.9 TWh electricity from RES 01-June-2018 [08:19]

Output specifications Reference scenario+V2G.txt The EnergyPLAN model 13.0District Heating Production
Gr.1 Gr.2 Gr.3 RES specification
JanuaryFebruaryMarchAprilMayJuneJulyAugustSeptemberOctoberNovemberDecember
AverageMaximumMinimum
Total for the whole yearTWh/year
District heating
MW
000000000000
000
0.00
Solar MW
000000000000
000
0.00
CSHP MW
000000000000
000
0.00
DHP MW
000000000000
000
0.00
District heating
MW
000000000000
000
0.00
Solar MW
000000000000
000
0.00
CSHP MW
000000000000
000
0.00
CHP MW
000000000000
000
0.00
HP MW
000000000000
000
0.00
ELT MW
000000000000
000
0.00
Boiler MW
000000000000
000
0.00
EH MW
000000000000
000
0.00
Stor- age MW
000000000000
000
Ba- lance MW
000000000000
000
0.00
District heating
MW
33353315172648318838382926612661266126612661
1949631352
14800516592661
130.00
Solar MW
183471
10010695778478542712
63434
0
0.55
CSHP MW
000000000000
000
0.00
CHP MW
20612186131920014664345123572383234124152525
1500515576
989521303
0
86.92
HP MW
000000000000
000
0.00
ELT MW
000000000000
000
0.00
Boiler MW
12622119657139407427320920123616881
437314586
464726000
0
40.82
EH MW
000000000000
000
0.00
Stor- age MW
000000000000
000
Ba- lance MW
101905740000000
921178
19417115
0
1.70
RES1 Wind
GW
14211214119
131011151231
14910
126
RES2 Photo Voltaic
GW
138
12139888521
6860
56
RES3 Offshore Wind
GW
79477677788
12
8200
66
RES 4-7
GW
000000000000
000
0
Total
GW
223324333125282526282244
28127
1
249
Own use of heat from industrial CHP: 0.00 TWh/year
NATURAL GAS EXCHANGEANNUAL COSTS (Million EUR)Total Fuel ex Ngas exchange = Uranium = Coal = FuelOil = Gasoil/Diesel= Petrol/JP = Gas handling = Biomass = Food income = Waste =
Total Ngas Exchange costs =
Marginal operation costs =
Total Electricity exchange = Import = Export = Bottleneck = Fixed imp/ex=
Total CO2 emission costs =
Total variable costs = Fixed operation costs =
Annual Investment costs =
TOTAL ANNUAL COSTS =
03692924
218311435844537723
00
648-1030
1582009
52982
33642
1074
1786
16108
105593136722
191053
433368
JanuaryFebruaryMarchAprilMayJuneJulyAugustSeptemberOctoberNovemberDecember
AverageMaximumMinimum
Total for the whole yearTWh/year
DHP &Boilers MW
14849140768398479332124623627719796
514417160
546730588
0
48.03
CHP2CHP3 MW
32526293723029823139544637193761369438113984
2367824579
1561533617
0
137.16
PPCAES MW
363673430934304332134543444945472644592351972462074094823042
4033480576
0
354.29
Indi-vidual MW
64223590124552329185433922622458257529003313
3621860837
25983102125
0
228.23
Transport MW
000000000000
000
0.00
Indu.Var. MW
169021690216902169021690216902169021690216902169021690216902
169021690216902
148.47
Demand Sum MW
164868153672135425107233724426807570621693727578270503
122890142520
10430123069520841
916.18
Bio- gas MW
000000000000
000
0.00
Syn- gas MW
000000000000
000
0.00
CO2Hy gas MW
000000000000
000
0.00
SynHy gas MW
000000000000
000
0.00
SynHy gas MW
000000000000
000
0.00
Stor- age MW
000
-959-31859-2422
0000
2295012921
082011
-83460
0.00
Sum MW
164868153672135425108191104301704977062169372757827050399941
129599
10430123069520964
916.18
Im- port MW
164868153672135425108191104301704977062169372757827050399941
129599
10430123069520964
916.18
Ex- port MW
000000000000
000
0.00
RES Share: 23.9 Percent of Primary Energy 60.6 Percent of Electricity 327.8 TWh electricity from RES 01-June-2018 [08:24]

Output specifications Reference scenario+HP.txt The EnergyPLAN model 13.0District Heating Production
Gr.1 Gr.2 Gr.3 RES specification
JanuaryFebruaryMarchAprilMayJuneJulyAugustSeptemberOctoberNovemberDecember
AverageMaximumMinimum
Total for the whole yearTWh/year
District heating
MW
000000000000
000
0.00
Solar MW
000000000000
000
0.00
CSHP MW
000000000000
000
0.00
DHP MW
000000000000
000
0.00
District heating
MW
000000000000
000
0.00
Solar MW
000000000000
000
0.00
CSHP MW
000000000000
000
0.00
CHP MW
000000000000
000
0.00
HP MW
000000000000
000
0.00
ELT MW
000000000000
000
0.00
Boiler MW
000000000000
000
0.00
EH MW
000000000000
000
0.00
Stor- age MW
000000000000
000
Ba- lance MW
000000000000
000
0.00
District heating
MW
33353315172648318838382926612661266126612661
1949631352
14800516592661
130.00
Solar MW
183471
10010695778478542712
63434
0
0.55
CSHP MW
000000000000
000
0.00
CHP MW
21021198651996315515349823672399236324262540
1557618794
1049321303
0
92.17
HP MW
74576894503526331381111041248840
29027498
27449000
0
24.10
ELT MW
000000000000
000
0.00
Boiler MW
485746931414590888881906826
9915048
149726000
0
13.15
EH MW
000000000000
000
0.00
Stor- age MW
000000000000
000
Ba- lance MW
0300000000000
23546
0
0.02
RES1 Wind
GW
14211214119
131011151231
14910
126
RES2 Photo Voltaic
GW
138
12139888521
6860
56
RES3 Offshore Wind
GW
79477677788
12
8200
66
RES 4-7
GW
000000000000
000
0
Total
GW
223324333125282526282244
28127
1
249
Own use of heat from industrial CHP: 0.00 TWh/year
NATURAL GAS EXCHANGEANNUAL COSTS (Million EUR)Total Fuel ex Ngas exchange = Uranium = Coal = FuelOil = Gasoil/Diesel= Petrol/JP = Gas handling = Biomass = Food income = Waste =
Total Ngas Exchange costs =
Marginal operation costs =
Total Electricity exchange = Import = Export = Bottleneck = Fixed imp/ex=
Total CO2 emission costs =
Total variable costs = Fixed operation costs =
Annual Investment costs =
TOTAL ANNUAL COSTS =
03967924
180731648435038004
00
240-1101
1482009
50957
30843
1147
1297
15637
99880138277
198721
436877
JanuaryFebruaryMarchAprilMayJuneJulyAugustSeptemberOctoberNovemberDecember
AverageMaximumMinimum
Total for the whole yearTWh/year
DHP &Boilers MW
57145522166469410310396
1058031
11665939
176130588
0
15.47
CHP2CHP3 MW
33172313483150124483552037353786372938284009
2457929657
1655933617
0
145.45
PPCAES MW
529384481644909389534474842418455694388550469442404822127996
4408399270
0
387.22
Indi-vidual MW
41133372442768317490266013571473158618042073
2282439131
1631866362
0
143.33
Transport MW
000000000000
000
0.00
Indu.Var. MW
169021690216902169021690216902169021690216902169021690216902
169021690216902
148.47
Demand Sum MW
14985913583112265998523699336451667826662087308467254
113692119626
9562220876431008
839.95
Bio- gas MW
000000000000
000
0.00
Syn- gas MW
000000000000
000
0.00
CO2Hy gas MW
000000000000
000
0.00
SynHy gas MW
000000000000
000
0.00
SynHy gas MW
000000000000
000
0.00
Stor- age MW
00
-152-1521
-25689-8078
0188
-152-41
2140514416
082722
-61317
0.00
Sum MW
14985913583112281110004495622725946782666020732366729592287
105210
9562220876431008
839.95
Im- port MW
14985913583112281110004495622725946782666020732366729592287
105210
9562220876431008
839.95
Ex- port MW
000000000000
000
0.00
RES Share: 24.9 Percent of Primary Energy 64.1 Percent of Electricity 331.5 TWh electricity from RES 01-June-2018 [08:26]

Output specifications Reference scenario+HP+Storage.txt The EnergyPLAN model 13.0District Heating Production
Gr.1 Gr.2 Gr.3 RES specification
JanuaryFebruaryMarchAprilMayJuneJulyAugustSeptemberOctoberNovemberDecember
AverageMaximumMinimum
Total for the whole yearTWh/year
District heating
MW
000000000000
000
0.00
Solar MW
000000000000
000
0.00
CSHP MW
000000000000
000
0.00
DHP MW
000000000000
000
0.00
District heating
MW
000000000000
000
0.00
Solar MW
000000000000
000
0.00
CSHP MW
000000000000
000
0.00
CHP MW
000000000000
000
0.00
HP MW
000000000000
000
0.00
ELT MW
000000000000
000
0.00
Boiler MW
000000000000
000
0.00
EH MW
000000000000
000
0.00
Stor- age MW
000000000000
000
Ba- lance MW
000000000000
000
0.00
District heating
MW
33353315172648318838382926612661266126612661
1949631352
14800516592661
130.00
Solar MW
183471
10010695778478542712
63434
0
0.55
CSHP MW
000000000000
000
0.00
CHP MW
21093200362071116280380823672411236324262540
1606318813
1070821303
0
94.06
HP MW
745768944410202726718717321315766
24067518
26419000
0
23.20
ELT MW
000000000000
000
0.00
Boiler MW
485046081285314
000000
6634982
138725521
0
12.18
EH MW
000000000000
000
0.00
Stor- age GW
43992
130262279273271272272182
8
174286
0
Ba- lance MW
-66-55
7117
-3521201
-10
33727
112861
-15578
0.01
RES1 Wind
GW
14211214119
131011151231
14910
126
RES2 Photo Voltaic
GW
138
12139888521
6860
56
RES3 Offshore Wind
GW
79477677788
12
8200
66
RES 4-7
GW
000000000000
000
0
Total
GW
223324333125282526282244
28127
1
249
Own use of heat from industrial CHP: 0.00 TWh/year
NATURAL GAS EXCHANGEANNUAL COSTS (Million EUR)Total Fuel ex Ngas exchange = Uranium = Coal = FuelOil = Gasoil/Diesel= Petrol/JP = Gas handling = Biomass = Food income = Waste =
Total Ngas Exchange costs =
Marginal operation costs =
Total Electricity exchange = Import = Export = Bottleneck = Fixed imp/ex=
Total CO2 emission costs =
Total variable costs = Fixed operation costs =
Annual Investment costs =
TOTAL ANNUAL COSTS =
03815924
180731648434687848
00
42-263
212009
50613
29962
1107
1810
15300
98791138283
198779
435853
JanuaryFebruaryMarchAprilMayJuneJulyAugustSeptemberOctoberNovemberDecember
AverageMaximumMinimum
Total for the whole yearTWh/year
DHP &Boilers MW
570654211511370
000000
7805861
163230025
0
14.33
CHP2CHP3 MW
33286316173268225690600937353805372938284009
2534829687
1689733617
0
148.42
PPCAES MW
438764175442525330604324142020451114351350119439144148223211
4114398328
0
361.40
Indi-vidual MW
41133372442768317490266013571473158618042073
2282439131
1631866362
0
143.33
Transport MW
000000000000
000
0.00
Indu.Var. MW
169021690216902169021690216902169021690216902169021690216902
169021690216902
148.47
Demand Sum MW
14090313293912130493512688146401567291657307265366898
107335114793
9289220646128578
815.96
Bio- gas MW
000000000000
000
0.00
Syn- gas MW
000000000000
000
0.00
CO2Hy gas MW
000000000000
000
0.00
SynHy gas MW
000000000000
000
0.00
SynHy gas MW
000000000000
000
0.00
Stor- age MW
00
-83-2494
-24078-8841
0241
-181-67
1730718382
083770
-59614
0.00
Sum MW
140903132939121387960069289272856672916548972834669649002996411
9289220646128578
815.96
Im- port MW
140903132939121387960069289272856672916548972834669649002996411
9289220646128578
815.96
Ex- port MW
000000000000
000
0.00
RES Share: 25.1 Percent of Primary Energy 63.7 Percent of Electricity 329.5 TWh electricity from RES 01-June-2018 [14:26]

Output specifications Reference scenario+HP+Storage+EVs.txt The EnergyPLAN model 13.0District Heating Production
Gr.1 Gr.2 Gr.3 RES specification
JanuaryFebruaryMarchAprilMayJuneJulyAugustSeptemberOctoberNovemberDecember
AverageMaximumMinimum
Total for the whole yearTWh/year
District heating
MW
000000000000
000
0.00
Solar MW
000000000000
000
0.00
CSHP MW
000000000000
000
0.00
DHP MW
000000000000
000
0.00
District heating
MW
000000000000
000
0.00
Solar MW
000000000000
000
0.00
CSHP MW
000000000000
000
0.00
CHP MW
000000000000
000
0.00
HP MW
000000000000
000
0.00
ELT MW
000000000000
000
0.00
Boiler MW
000000000000
000
0.00
EH MW
000000000000
000
0.00
Stor- age MW
000000000000
000
Ba- lance MW
000000000000
000
0.00
District heating
MW
33353315172648318838382926612661266126612661
1949631352
14800516592661
130.00
Solar MW
183471
10010695778478542712
63434
0
0.55
CSHP MW
000000000000
000
0.00
CHP MW
21098200412072416333385223672399236324262540
1606118867
1072121303
0
94.17
HP MW
747169004402197122219818819315665
24377517
26369000
0
23.15
ELT MW
000000000000
000
0.00
Boiler MW
483246011275314
000000
6504925
137825465
0
12.10
EH MW
000000000000
000
0.00
Stor- age GW
73994
13225927627226726226318214
172286
0
Ba- lance MW
-66-5911
120-350
1-32101
32231
212861
-14704
0.01
RES1 Wind
GW
14211214119
131011151231
14910
126
RES2 Photo Voltaic
GW
138
12139888521
6860
56
RES3 Offshore Wind
GW
79477677788
12
8200
66
RES 4-7
GW
000000000000
000
0
Total
GW
223324333125282526282244
28127
1
249
Own use of heat from industrial CHP: 0.00 TWh/year
NATURAL GAS EXCHANGEANNUAL COSTS (Million EUR)Total Fuel ex Ngas exchange = Uranium = Coal = FuelOil = Gasoil/Diesel= Petrol/JP = Gas handling = Biomass = Food income = Waste =
Total Ngas Exchange costs =
Marginal operation costs =
Total Electricity exchange = Import = Export = Bottleneck = Fixed imp/ex=
Total CO2 emission costs =
Total variable costs = Fixed operation costs =
Annual Investment costs =
TOTAL ANNUAL COSTS =
04047924
180731435835198085
00
280-188
132009
49007
31234
1168
2115
15500
99023137615
196697
433336
JanuaryFebruaryMarchAprilMayJuneJulyAugustSeptemberOctoberNovemberDecember
AverageMaximumMinimum
Total for the whole yearTWh/year
DHP &Boilers MW
568554131500369
000000
7645794
162129958
0
14.24
CHP2CHP3 MW
33293316243270225774607837353786372938284009
2534429772
1691833617
0
148.61
PPCAES MW
561414729746900367804554844941475494614653001467624290626987
45075102303
0
395.94
Indi-vidual MW
41133372442768317490266013571473158618042073
2282439131
1631866362
0
143.33
Transport MW
000000000000
000
0.00
Indu.Var. MW
169021690216902169021690216902169021690216902169021690216902
169021690216902
148.47
Demand Sum MW
15315413848012568897315711896693669710683647553569745
108740118586
9683421153620913
850.59
Bio- gas MW
000000000000
000
0.00
Syn- gas MW
000000000000
000
0.00
CO2Hy gas MW
000000000000
000
0.00
SynHy gas MW
000000000000
000
0.00
SynHy gas MW
000000000000
000
0.00
Stor- age MW
000
-2167-25645-7634
0289
-206-90
1477620831
084233
-74147
0.00
Sum MW
153154138480125688994839683474570697106807475742698359396497755
9683421153620913
850.59
Im- port MW
153154138480125688994839683474570697106807475742698359396497755
9683421153620913
850.59
Ex- port MW
000000000000
000
0.00
RES Share: 25.1 Percent of Primary Energy 60.7 Percent of Electricity 332.6 TWh electricity from RES 01-June-2018 [14:28]

Output specifications 20% price reduction.txt The EnergyPLAN model 13.0District Heating Production
Gr.1 Gr.2 Gr.3 RES specification
JanuaryFebruaryMarchAprilMayJuneJulyAugustSeptemberOctoberNovemberDecember
AverageMaximumMinimum
Total for the whole yearTWh/year
District heating
MW
000000000000
000
0.00
Solar MW
000000000000
000
0.00
CSHP MW
000000000000
000
0.00
DHP MW
000000000000
000
0.00
District heating
MW
000000000000
000
0.00
Solar MW
000000000000
000
0.00
CSHP MW
000000000000
000
0.00
CHP MW
000000000000
000
0.00
HP MW
000000000000
000
0.00
ELT MW
000000000000
000
0.00
Boiler MW
000000000000
000
0.00
EH MW
000000000000
000
0.00
Stor- age MW
000000000000
000
Ba- lance MW
000000000000
000
0.00
District heating
MW
33353315172648318838382926612661266126612661
1949631352
14800516592661
130.00
Solar MW
183471
10010695778478542712
63434
0
0.55
CSHP MW
000000000000
000
0.00
CHP MW
21098200412072416333385223672399236324262540
1606118867
1072121303
0
94.17
HP MW
747169004402197122219818819315665
24377517
26369000
0
23.15
ELT MW
000000000000
000
0.00
Boiler MW
483246011275314
000000
6504925
137825465
0
12.10
EH MW
000000000000
000
0.00
Stor- age GW
73994
13225927627226726226318214
172286
0
Ba- lance MW
-66-5911
120-350
1-32101
32231
212861
-14704
0.01
RES1 Wind
GW
14211214119
131011151231
14910
126
RES2 Photo Voltaic
GW
138
12139888521
6860
56
RES3 Offshore Wind
GW
79477677788
12
8200
66
RES 4-7
GW
000000000000
000
0
Total
GW
223324333125282526282244
28127
1
249
Own use of heat from industrial CHP: 0.00 TWh/year
NATURAL GAS EXCHANGEANNUAL COSTS (Million EUR)Total Fuel ex Ngas exchange = Uranium = Coal = FuelOil = Gasoil/Diesel= Petrol/JP = Gas handling = Biomass = Food income = Waste =
Total Ngas Exchange costs =
Marginal operation costs =
Total Electricity exchange = Import = Export = Bottleneck = Fixed imp/ex=
Total CO2 emission costs =
Total variable costs = Fixed operation costs =
Annual Investment costs =
TOTAL ANNUAL COSTS =
04047924
180731435835198085
00
280-188
132009
49007
31234
1168
2115
15500
99023134962
189810
423795
JanuaryFebruaryMarchAprilMayJuneJulyAugustSeptemberOctoberNovemberDecember
AverageMaximumMinimum
Total for the whole yearTWh/year
DHP &Boilers MW
568554131500369
000000
7645794
162129958
0
14.24
CHP2CHP3 MW
33293316243270225774607837353786372938284009
2534429772
1691833617
0
148.61
PPCAES MW
561414729746900367804554844941475494614653001467624290626987
45075102303
0
395.94
Indi-vidual MW
41133372442768317490266013571473158618042073
2282439131
1631866362
0
143.33
Transport MW
000000000000
000
0.00
Indu.Var. MW
169021690216902169021690216902169021690216902169021690216902
169021690216902
148.47
Demand Sum MW
15315413848012568897315711896693669710683647553569745
108740118586
9683421153620913
850.59
Bio- gas MW
000000000000
000
0.00
Syn- gas MW
000000000000
000
0.00
CO2Hy gas MW
000000000000
000
0.00
SynHy gas MW
000000000000
000
0.00
SynHy gas MW
000000000000
000
0.00
Stor- age MW
000
-2167-25645-7634
0289
-206-90
1477620831
084233
-74147
0.00
Sum MW
153154138480125688994839683474570697106807475742698359396497755
9683421153620913
850.59
Im- port MW
153154138480125688994839683474570697106807475742698359396497755
9683421153620913
850.59
Ex- port MW
000000000000
000
0.00
RES Share: 25.1 Percent of Primary Energy 60.7 Percent of Electricity 332.6 TWh electricity from RES 01-June-2018 [14:33]
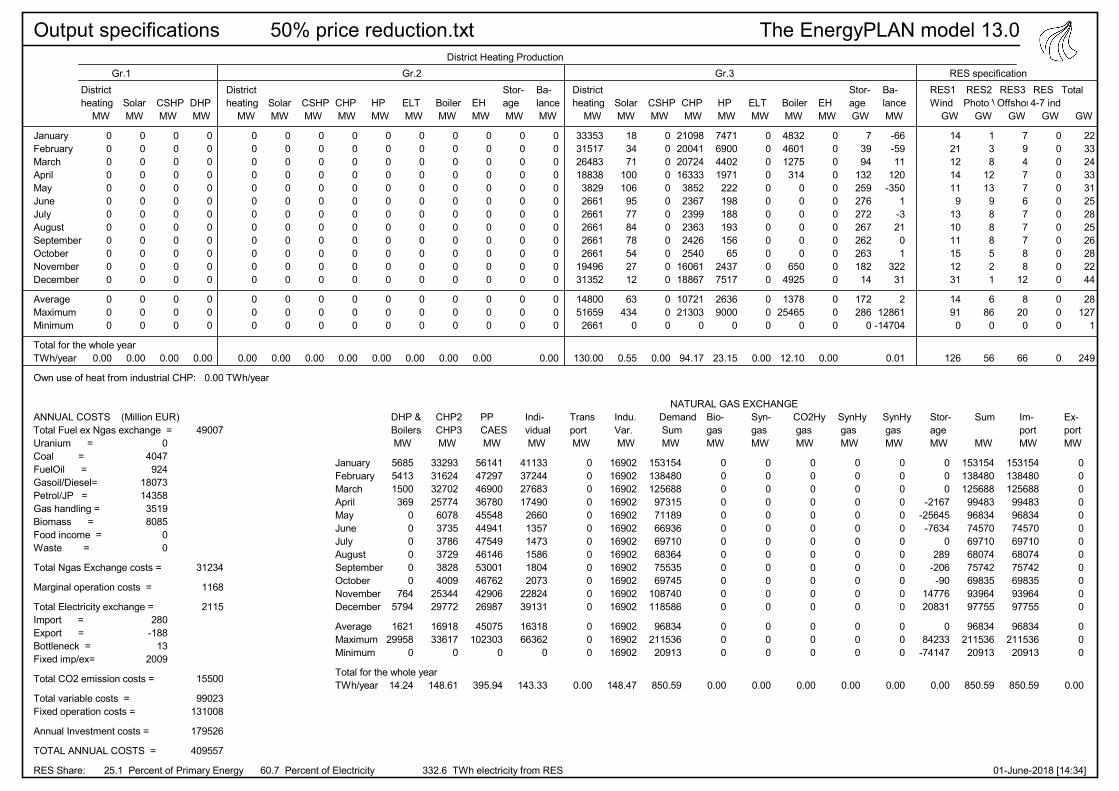
Output specifications 50% price reduction.txt The EnergyPLAN model 13.0District Heating Production
Gr.1 Gr.2 Gr.3 RES specification
JanuaryFebruaryMarchAprilMayJuneJulyAugustSeptemberOctoberNovemberDecember
AverageMaximumMinimum
Total for the whole yearTWh/year
District heating
MW
000000000000
000
0.00
Solar MW
000000000000
000
0.00
CSHP MW
000000000000
000
0.00
DHP MW
000000000000
000
0.00
District heating
MW
000000000000
000
0.00
Solar MW
000000000000
000
0.00
CSHP MW
000000000000
000
0.00
CHP MW
000000000000
000
0.00
HP MW
000000000000
000
0.00
ELT MW
000000000000
000
0.00
Boiler MW
000000000000
000
0.00
EH MW
000000000000
000
0.00
Stor- age MW
000000000000
000
Ba- lance MW
000000000000
000
0.00
District heating
MW
33353315172648318838382926612661266126612661
1949631352
14800516592661
130.00
Solar MW
183471
10010695778478542712
63434
0
0.55
CSHP MW
000000000000
000
0.00
CHP MW
21098200412072416333385223672399236324262540
1606118867
1072121303
0
94.17
HP MW
747169004402197122219818819315665
24377517
26369000
0
23.15
ELT MW
000000000000
000
0.00
Boiler MW
483246011275314
000000
6504925
137825465
0
12.10
EH MW
000000000000
000
0.00
Stor- age GW
73994
13225927627226726226318214
172286
0
Ba- lance MW
-66-5911
120-350
1-32101
32231
212861
-14704
0.01
RES1 Wind
GW
14211214119
131011151231
14910
126
RES2 Photo Voltaic
GW
138
12139888521
6860
56
RES3 Offshore Wind
GW
79477677788
12
8200
66
RES 4-7
GW
000000000000
000
0
Total
GW
223324333125282526282244
28127
1
249
Own use of heat from industrial CHP: 0.00 TWh/year
NATURAL GAS EXCHANGEANNUAL COSTS (Million EUR)Total Fuel ex Ngas exchange = Uranium = Coal = FuelOil = Gasoil/Diesel= Petrol/JP = Gas handling = Biomass = Food income = Waste =
Total Ngas Exchange costs =
Marginal operation costs =
Total Electricity exchange = Import = Export = Bottleneck = Fixed imp/ex=
Total CO2 emission costs =
Total variable costs = Fixed operation costs =
Annual Investment costs =
TOTAL ANNUAL COSTS =
04047924
180731435835198085
00
280-188
132009
49007
31234
1168
2115
15500
99023131008
179526
409557
JanuaryFebruaryMarchAprilMayJuneJulyAugustSeptemberOctoberNovemberDecember
AverageMaximumMinimum
Total for the whole yearTWh/year
DHP &Boilers MW
568554131500369
000000
7645794
162129958
0
14.24
CHP2CHP3 MW
33293316243270225774607837353786372938284009
2534429772
1691833617
0
148.61
PPCAES MW
561414729746900367804554844941475494614653001467624290626987
45075102303
0
395.94
Indi-vidual MW
41133372442768317490266013571473158618042073
2282439131
1631866362
0
143.33
Transport MW
000000000000
000
0.00
Indu.Var. MW
169021690216902169021690216902169021690216902169021690216902
169021690216902
148.47
Demand Sum MW
15315413848012568897315711896693669710683647553569745
108740118586
9683421153620913
850.59
Bio- gas MW
000000000000
000
0.00
Syn- gas MW
000000000000
000
0.00
CO2Hy gas MW
000000000000
000
0.00
SynHy gas MW
000000000000
000
0.00
SynHy gas MW
000000000000
000
0.00
Stor- age MW
000
-2167-25645-7634
0289
-206-90
1477620831
084233
-74147
0.00
Sum MW
153154138480125688994839683474570697106807475742698359396497755
9683421153620913
850.59
Im- port MW
153154138480125688994839683474570697106807475742698359396497755
9683421153620913
850.59
Ex- port MW
000000000000
000
0.00
RES Share: 25.1 Percent of Primary Energy 60.7 Percent of Electricity 332.6 TWh electricity from RES 01-June-2018 [14:34]

Output specifications 20% HP and V2F capacity expansion.txt The EnergyPLAN model 13.0District Heating Production
Gr.1 Gr.2 Gr.3 RES specification
JanuaryFebruaryMarchAprilMayJuneJulyAugustSeptemberOctoberNovemberDecember
AverageMaximumMinimum
Total for the whole yearTWh/year
District heating
MW
000000000000
000
0.00
Solar MW
000000000000
000
0.00
CSHP MW
000000000000
000
0.00
DHP MW
000000000000
000
0.00
District heating
MW
000000000000
000
0.00
Solar MW
000000000000
000
0.00
CSHP MW
000000000000
000
0.00
CHP MW
000000000000
000
0.00
HP MW
000000000000
000
0.00
ELT MW
000000000000
000
0.00
Boiler MW
000000000000
000
0.00
EH MW
000000000000
000
0.00
Stor- age MW
000000000000
000
Ba- lance MW
000000000000
000
0.00
District heating
MW
33353315172648318838382926612661266126612661
1949631352
14800516592661
130.00
Solar MW
183471
10010695778478542712
63434
0
0.55
CSHP MW
000000000000
000
0.00
CHP MW
21149204062090616536395223692406236924292545
1623819648
1087821303
0
95.55
HP MW
852078434703188119319717118815261
25338553
290810800
0
25.55
ELT MW
000000000000
000
0.00
Boiler MW
37323324759237
000000
3013120
95223362
0
8.36
EH MW
000000000000
000
0.00
Stor- age GW
64088
16130733132731731231220822
203343
0
Ba- lance MW
-66-904383
-42107
1921
39720
-110605
-14554
-0.01
RES1 Wind
GW
14211214119
131011151231
14910
126
RES2 Photo Voltaic
GW
138
12139888521
6860
56
RES3 Offshore Wind
GW
79477677788
12
8200
66
RES 4-7
GW
000000000000
000
0
Total
GW
223324333125282526282244
28127
1
249
Own use of heat from industrial CHP: 0.00 TWh/year
NATURAL GAS EXCHANGEANNUAL COSTS (Million EUR)Total Fuel ex Ngas exchange = Uranium = Coal = FuelOil = Gasoil/Diesel= Petrol/JP = Gas handling = Biomass = Food income = Waste =
Total Ngas Exchange costs =
Marginal operation costs =
Total Electricity exchange = Import = Export = Bottleneck = Fixed imp/ex=
Total CO2 emission costs =
Total variable costs = Fixed operation costs =
Annual Investment costs =
TOTAL ANNUAL COSTS =
04273924
180731393329698316
00
216-119
52009
48489
30395
1229
2112
15533
97758129385
182049
409192
JanuaryFebruaryMarchAprilMayJuneJulyAugustSeptemberOctoberNovemberDecember
AverageMaximumMinimum
Total for the whole yearTWh/year
DHP &Boilers MW
43913910893279
000000
3543670
112027484
0
9.84
CHP2CHP3 MW
33374322023299126093623637393796373938334016
2562331004
1716533617
0
150.78
PPCAES MW
653875385453269401804584945549483134675453888476164926034564
48695112868
0
427.74
Indi-vidual MW
265092370116978107241666842913
100411461325
1444525385
1035343711
0
90.94
Transport MW
000000000000
000
0.00
Indu.Var. MW
169021690216902169021690216902169021690216902169021690216902
169021690216902
148.47
Demand Sum MW
14656413056912103294179706536703269925683997576969860
106584111526
9423519872220723
827.76
Bio- gas MW
000000000000
000
0.00
Syn- gas MW
000000000000
000
0.00
CO2Hy gas MW
000000000000
000
0.00
SynHy gas MW
000000000000
000
0.00
SynHy gas MW
000000000000
000
0.00
Stor- age MW
36370
-70-2488
-23582-9373
7375-67
-3171467617291
079224
-73415
0.00
Sum MW
142926130569121103966679423576404699176802475836701779190894235
9423519872220723
827.76
Im- port MW
142926130569121103966679423576404699176802475836701779190894235
9423519872220723
827.76
Ex- port MW
000000000000
000
0.00
RES Share: 25.3 Percent of Primary Energy 60.5 Percent of Electricity 335.6 TWh electricity from RES 01-June-2018 [14:37]

Output specifications 50% HP and V2F capacity expansion.txt The EnergyPLAN model 13.0District Heating Production
Gr.1 Gr.2 Gr.3 RES specification
JanuaryFebruaryMarchAprilMayJuneJulyAugustSeptemberOctoberNovemberDecember
AverageMaximumMinimum
Total for the whole yearTWh/year
District heating
MW
000000000000
000
0.00
Solar MW
000000000000
000
0.00
CSHP MW
000000000000
000
0.00
DHP MW
000000000000
000
0.00
District heating
MW
000000000000
000
0.00
Solar MW
000000000000
000
0.00
CSHP MW
000000000000
000
0.00
CHP MW
000000000000
000
0.00
HP MW
000000000000
000
0.00
ELT MW
000000000000
000
0.00
Boiler MW
000000000000
000
0.00
EH MW
000000000000
000
0.00
Stor- age MW
000000000000
000
Ba- lance MW
000000000000
000
0.00
District heating
MW
33353315172648318838382926612661266126612661
1949631352
14800516592661
130.00
Solar MW
183471
10010695778478542712
63434
0
0.55
CSHP MW
000000000000
000
0.00
CHP MW
21227208632108016727398523742415237924332552
1647020469
1104521303
0
97.02
HP MW
11240101955207187218519718018914654
253110628
354118000
0
31.11
ELT MW
000000000000
000
0.00
Boiler MW
93651856790000000
286
15611550
0
1.37
EH MW
000000000000
000
0.00
Stor- age GW
134186
20532235535735935535624265
230429
0
Ba- lance MW
-67-936960
-446-5
-11930
467-43
-614574
-16579
-0.05
RES1 Wind
GW
14211214119
131011151231
14910
126
RES2 Photo Voltaic
GW
138
12139888521
6860
56
RES3 Offshore Wind
GW
79477677788
12
8200
66
RES 4-7
GW
000000000000
000
0
Total
GW
223324333125282526282244
28127
1
249
Own use of heat from industrial CHP: 0.00 TWh/year
NATURAL GAS EXCHANGEANNUAL COSTS (Million EUR)Total Fuel ex Ngas exchange = Uranium = Coal = FuelOil = Gasoil/Diesel= Petrol/JP = Gas handling = Biomass = Food income = Waste =
Total Ngas Exchange costs =
Marginal operation costs =
Total Electricity exchange = Import = Export = Bottleneck = Fixed imp/ex=
Total CO2 emission costs =
Total variable costs = Fixed operation costs =
Annual Investment costs =
TOTAL ANNUAL COSTS =
04621924
180731329622058671
00
144-72
22009
47790
29324
1321
2084
15627
96147129811
184970
410928
JanuaryFebruaryMarchAprilMayJuneJulyAugustSeptemberOctoberNovemberDecember
AverageMaximumMinimum
Total for the whole yearTWh/year
DHP &Boilers MW
110160966930000000
337
18313588
0
1.61
CHP2CHP3 MW
33496329223326526396628837463811375438394028
2599032300
1742933617
0
153.10
PPCAES MW
790666404962514461294789047360498614835455408493385840244310
54365116495
0
477.55
Indi-vidual MW
5258464431692045325167178207245284
28235143
20349934
0
17.87
Transport MW
000000000000
000
0.00
Indu.Var. MW
169021690216902169021690216902169021690216902169021690216902
169021690216902
148.47
Demand Sum MW
13582411912611591791565714056817670753692187639470552
10411898992
9091417345920747
798.59
Bio- gas MW
000000000000
000
0.00
Syn- gas MW
000000000000
000
0.00
CO2Hy gas MW
000000000000
000
0.00
SynHy gas MW
000000000000
000
0.00
SynHy gas MW
000000000000
000
0.00
Stor- age MW
128990
-121-2495
-19509-13522
125423534
-1030145918077
080799
-70167
0.00
Sum MW
122925119126116038940609091481697706286879575860715838952790914
9091417345920852
798.59
Im- port MW
122925119126116038940609091481697706286879575860715838952790914
9091417345920852
798.59
Ex- port MW
000000000000
000
0.00
RES Share: 25.5 Percent of Primary Energy 60.2 Percent of Electricity 340.2 TWh electricity from RES 01-June-2018 [14:41]

Appendix Interview with Philip Litz, Agora Energiewende
What is yours general view on how Germany’s energy system could like by 2030? And then can you
talk about different energy sectors such as transport, heat and electricity?
First off all, the description will be given how we defined the energy system by 2030. We include
sustainability, climate, policy, cost-efficient and security of supply targets. We specified them as clear
as possible and then take a look at different scenarios which are already existent from environmental,
economical ministries, different organizations, and then took a deep look to see what they have in
common. All of the models are cost-efficient, marginal cost based energy models. More or less these
energy models come with similar conclusions by 2030. The main take away message is that by 2030
there are 3 main strategies. The first one is in order to reduce GHG emissions by 55% the coal and
lignite production has to be cut by half, while natural by 20%. The second strategy is to reduce the
energy efficiency by 30%. And the last aim is to double the renewable share to 30% in total energy
mix.
Now let’s break it down to different sectors, and first start with the electricity sector. Even though
the production of coal power plants will reduce, they still suppose to be be in the system by 2030.
Renewable share should double to 60% in the electricity share. However, this number can be even
higher because new government set to increase this share to 65%. Off course at that time nuclear
power will be phased out. Even though the electricity will be used more efficiently, but due to sector
coupling and the demand from electrified heat and transport sectors, the power demand should
remain stable.
In the heat sector will be seen significant energy reduction. Currently the heat sector is dominated
heated mainly by natural gas, but in the future the share will be slowly taken by renewable sources,
which should supply one-third of heating needs by 2030. Also the heating sector will be electrified,
and it expected to have 5-6 millions of heating pumps.
Before starting to describe transport sector, it needs to be said that different sectors such as heat,
electricity and transport have their own targets which by being accomplished meets the overall
countries goals.
Currently the transport sector in Germany is mainly running on fossil fuel, and it is the only sector
with the increasing emissions. The targets by 2030 are to reduce the oil consumption by 40% and the
efficiency by 30%. Conventional cars with 35-40% efficiency lose a significant amount of energy.
Therefore, by 2030 these cars should be changed with more efficient cars, such as electrical cars.

Now I would like to ask the following questions for every sector. Can you say if it is possible to
reach 10-12 million electrical cars by 2030?
Yes it can be done. Looking to the growth rates in California, China, Norway it is definitely possible,
and it is not a technical question but more political one. Also considering the production car capacities
in Germany with the right strategies it can be done, even though its ambitious target.
At this moment electrical cars are not competitive with cars which are running on fossil fuel. If
there are any estimates, when electrical cars could become competitive in the future?
It basically depends on the batteries cost, how fast the prices will fall down. However, the Bloomberg
Energy Finances predict that electrical cars will reach market equilibrium by 2025, while other
organization forecasts this to happen few years later. Even though the electrical cars will become
competitive by 2025 they still will need additional policies, or taxes on the other side, such as CO2 tax
for example.
Moving back to the heating sector, it seems that a lot of effort will be made to electrify the sector.
High number of heat pumps will have to be introduced. The question would be if HP is competitive
at the moment, and if not do they need incentives?
First of all they need incentives. When the energy models are made for the future, the results shows
that the cheapest option for home needs are HP. However, to reach these numbers there are some
obstacles. People who used to install heating systems in the homes are used to install gas-fired
boilers, and now to change the technology some time is needed for this transition. And also new set
up programs needs to be designed.
Compared with Denmark, the DH share in Germany is rather low, and it doesn’t seem that DH will
be expanded in the future. Can you give reasons for this?
First point is that Germany has many countryside areas where to introduce DH systems doesn’t make
sense economically. For example, Bavaria region has 8 million people and only 1 million are living in
the city. The second point is that historically the heating in Germany was based on coal in individual
boilers. So differently than in Denmark, new DH needs to be build. However, where houses are old or
have high energy needs to install new grid systems can be economically feasible.

How the Germany is preparing to deal with the increasing number of variable renewable energy
sources in the future? What steps needs to be taken to smoother this transition looking from
system operator’s point of view?
There are few things to consider. First is if 60-65% of renewable to cover electricity needs will be
placed in the system, coal power plants, at least half of them needs to be phased out. If this not
happen, than Germany will be forced to export electricity in significant amounts. The other thing is
grid infrastructure. Three new lines from North to South needs to be build in order to move wind
production to south, and vice versus when it comes to the solar PV production. However, overall it
shouldn’t be a problem. Indeed, we didn’t have even one day when all electricity demand was
covered only by renewable energy sources.
Most experts agree that coal power plant needs to be reduced, but is it realistic to do that by 2030?
In order to meet climate goals the coal capacity needs to be phased out by half. But when it happens
and how much of coal power plants will be shut down at this moment is not clear as the government
currently discuss this issue. This question depends on political will. And if the government gives the
signal for the market by introducing the instruments such as higher carbon tax, then naturally the
capacity of power plants will decline.
However, from energy economics points of view there is not a problem to have coal power plants in
the system by 2030. They production can be combined with renewable energy and if the surplus
productions are in the system the good connections to neighboring countries lets to export this
excess electricity production.
How is realistic to meet climate goals by 2020 and 2030?
First it needs to be distinguished, is it realistic politically and then technically. The target for 2020 is -
40%. It is basically unreachable target. Most of the coal power plants will have to be shutdown. And it
is too fast to do that by companies, system operator.
In coal industry around 30000 people currently are employed, and if it happens in one day all these
people will lose their jobs. However, in a period of 10-15 years is possible to solve this problem.
The logic step would be removed the overcapacity of coal power plants which is 5-7 GW, and then the
rest will be removed the next decade. Even the coal power plants will be phased out totally, they are
responsible only for one third of the total emissions, where heat and transport sectors can be blamed
for the rest. These sectors can be a big problem for Germany when it comes to reach climate goals in
the future.

Do Germany’s energy system needs additional storage technologies for variable renewable energy
integration by 2030?
I will talk about long-term storage, not short-term storage such as batteries for example, which are
used for primary or secondary reserve markets. I don’t see them as an option, together electrical cars
which can give back electricity to the grid, for long-term storage.
One of the key questions for what we need this additional storage? We have only around 1000 hours
per year for over exceeding capacity. Plus when we taking into the consideration interconnection
capacity which is around 50% higher compared with other countries, and then the overcapacity of
power plants, where natural gas capacity alone consist of 30 GW. So basically the question if
additional storage is needed, it depends of the flexibility options, which option can be the cheapest.
There is definitely no potential for pumped hydro power, and mainly because Germany has so much
flexibility in the system. Therefore, they are not used so often. I don’t see if there will be specific
projects for storage technologies by 2030. But where I see potential is for big cities which have
extended DH system and wind power. Therefore, cities like Berlin, Bremen, Hamburg are planning to
go for heat to power.
The second option is power to gas or power to liquid. However, what it can be seen from the models
is more expensive compared with direct use of electricity. They can become competitive after 2030.
Do you see a potential for batteries combined with solar PV for home needs?
The batteries become cheaper and solar PV become cheaper. Plus the levies or taces system is
designed that it’s cheaper for customers to get the electricity from own system than from the grid.
Therefore, to make solar PV+batteries more competitive, other fuels needs with additional taxes
become expensive. Overall message would be that off course there would be houses which would
install solar PV and batteries, but it’s more of contributing to the energy transition than making
significant profit from this investment.
It’s a broad question, but maybe you can compare two different approaches of integrating surplus
electricity production from RES. One way would be is to extend interconnectors capacity lines,
while the other is to integrate electricity domestically into different sectors such as heat and
transport. Can you say what are the benefits and drawbacks of these approaches?
Exporting electricity abroad its not only the cheap option, but also it gives high security of supply. So
when you combine these two benefits its becomes a better option compared of electricity integration
regionally in heat and transport sectors. So you have double plus. In Germany new capacity lines are
built to extend the grid. There is a target for grid operators which are 50% interconnector’s capacity
of the overall future maximum load. Thus it results that in the future Germany will have around 25

GW of interconnectors capacity. Now the capacity is around 17-18 GW. From our organization
perspective is really clever way to deal with overproduction of electricity, because you can integrate
RES and reduce the conventional power plants capacity.
Some countries will profit from cheap electricity, others not so much. Germany now is a net exporter,
exporting 50 TWh of electricity annually to neighboring countries. Its 10% of annual electricity
production.
Can Germany profit from exporting high amounts of cheap electricity to neighboring countries?
It’s the question who in Germany will lose or profit. The main driver its not interconnectors, but more
policies. For example, if coal power plants will not be phased out that they can produce electricity and
export the surplus. For consumers it’s a win-win situation, with less capacity, consumers can get the
electricity really cheap, or benefit from negative wholesale prices.

Interview with Heinz-Uwe Lewe, Policy Officer
What is yours general view on how Germany’s energy system could like by 2030? And then can you
talk about different energy sectors such as transport, heat and electricity?
I will start with electricity sector. We have around 35% renewable sources in electricity sector. The
expansion of renewable sources in the past was based on EEG policy; it is basically a feed-in-tariff.
Every consumer pays the price for this and the producer for every kWh produced earns additional
money. Now this system was changed with auction system. Now the government controls the speed
of how much renewable sources will be in the future. Some people argue that the auctions with the
maximum capacity to win will not help to archive 2030 RES targets. But theoretically, the
governments can count how much capacity can be given for auctions, and thus it can be controlled. In
the past feed-in-tariff system ensures long-term security for the investors, now investors by bidding
the lowest price to win the auction cannot be so secured. However, from economic point of view this
auction system can lower the price for the whole system.
So in general to meet the 2030 targets, you need to expand the renewable share and the grid. The
new lines from North to South needs to be build to transport wind power down and solar PV up. Also
low and medium voltage lines need to be expanded.
Heating sector
The biggest renewable source for heating is biomass, and gradually HP takes the bigger share in this
market. We as the government body give a a public support for people who invest in this technology.
With the incentives HP almost become competitive with gas-fired boilers. However, the expansion of
HP will not be about incentives but it will be about new building regulations. Basically for new houses
it will be impossible to install a gas fired boiler because you will never achieve the standard. On the
other hand the gas is super cheap.
Another problem in the heating sector is experience related with HP installation. Plumbers used to
install gas-fired boilers for 10-15 years, and have a good knowledge about these systems.
The Germany wants to increase the efficiency of the houses. However the goal usually is set to high,
2% of houses per year should be renovated but in reality this number usually is lower. There is not
enough workers.
DH has share of around 10%. In northern Germany we have cities with DH systems which are supplied
by CHP plats fed on coal, waste heat and little biomass. The problem is that for new buildings its not
economical to install the grid because there is not enough demand. It works for cities with old
buildings. In cities with already established DH grids, coal or natural gas can be changed with
renewable energy sources. In the future DH share should remain the same.

In the future for DH system deep geothermal as the sources can be used, or large scale HP. Solar
thermal capacity will not be significant as well. Biomass could be used for industrial process, where
high temperatures are needed.
In Denmark, almost all CHP plants are building together with thermal storage. In Germany is not the
case at all. The problem with CHP and DH is that most of them are based on fossil fuel. So if you want
to phase out them from the electricity sector, they are still connected to DH grid. Therefore you have
dependencies.
Transport sector
Transport sector has 5% of renewable, and the last 20 years basically didn’t do basically anything to
increase this number. The CO2 emissions in this sector are increasing.
Can you say if it is possible to reach 10-12 million electrical cars by 2030?
It will be hard to reach this target. For this number you need a lot of charging stations and significant
grid expansion. There is discussion which direction should go future transport, be electrified or be
based on synthetic gas. Some people say that the future transport will be still based on combustion
engines, only with renewable gas such as hydrogen for example. In the desert, electricity from solar
PV can be produced in the future as 1 euro cent per kWh. Therefore synthetic fuel then could be
exported to Germany. On the other hands the price of batteries also can go really down. But even if it
the case, still you have to pay grid fees. Its open question, and probably will be mix of different fuels.
Its hard to predict how fast the technologies will be developed.
How the Germany is preparing to deal with the increasing number of variable renewable energy
sources in the future? What steps needs to be taken to smoother this transition looking from
system operator’s point of view?
There are definitely needed some efforts to smoothen this transition. Grid expansion is really
important. The grid expansion is delayed due to public acceptance. Politicians have to explain that
more and more renewable will be installed, and the landscape will be changed. Smart grid also will
play a big role. Its important, and if possible, to balance the system on low level.
Do Germany’s energy system needs additional storage technologies for variable renewable energy
integration by 2030?
In the last couple of years, it was seen that for short-term battery storage between1-5 MW, could be
competitive in the balancing market. And people until the supply exceeded demand could make some
money.

Potential for hydro pumped power is limited because of the public acceptance. On the other hand
they don’t make a lot of money because the market its not in favor for this technology.
Batteries with storage for home needs are quite popular at this time. People can supply 60-70% of
their needs with this combination of technologies, which is much cheaper than the electricity from
the grid. However, even though if lets say 99% of home demand will be cover by batteries and solar
PV, you still need to maintain the grid, and this one percent can be really expensive. Now this system
work for people, and they can make money out of it, however in the long-term someone will have to
pay for the grid.
How is realistic to meet climate goals by 2020 and 2030? And why coal power plants still
competitive? Is it realistic to phased out coal power plants completely.
In the last couple of years the CO2 emissions are constant. Its most likely that the 2020 climate target
will not be archived. Now the new commission has to come up with the plan when to phased out coal
power plant completely. My guess it could happen by 2035-2045. Before 2035 it will not be realistic.
There are few studies which claimed that the most cost-efficient way to reduce CO2 emissions it to
change coal with natural gas. However, after the nuclear phase-out the share will take coal power
plants which increase the CO2 emissions.
Now why coal are so competitive. A lot of coal power plants are 30 years old, and the capital costs are
already paid. Coal are imported from Australia, South Africa at the cheap price and the carbon tax is
rather low. One study in Germany concludes that in order for natural gas to outcompete coal the
carbon tax should be around 20-30 euros at least. The coal competitiveness is basically determined by
variable costs, which is fuel, and when the price is low, the price to produce the electricity is rather
low as well.
Coal is responsible only for one-third of CO2 emissions. What about heat and transport sectors? It
seems that the biggest focus is for electricity sector.
Most emphasizes is for electricity sector. But when it comes sector coupling it make sense to do that,
because the electricity can be used for HP and batteries in electrical cars can charge the grid.

It’s a broad question, but maybe you can compare two different approaches of integrating surplus
electricity production from RES. One way would be is to extend interconnectors capacity lines,
while the other is to integrate electricity domestically into different sectors such as heat and
transport. Can you say what are the benefits and drawbacks of these approaches?
The drawbacks of interconnectors approach that when Germany has surplus of lets say wind
production, countries like Denmark have similar situation. Therefore, when there is no big demand
the electricity is exported at the cheap price. Interconnector lines expansion can be beneficial when
your neighbors have different energy systems, such as Norway for example.
The way it can be compared, it could be a calculation and the price comparison between the price of
interconnector’s capacity and the price of integrating electricity domestically.