Cross Rolling: A Metal Forming Process
25
Chapter 2 Cross Rolling: A Metal Forming Process Matruprasad Rout, Surjya K. Pal and Shiv B. Singh Abstract The chapter deals with cross rolling where the workpiece is rotated by 90° in the rolling plane after each rolling pass. The chapter begins with basics of metal rolling, and later on focuses on cross rolling. A short introduction to texture and its representation is presented followed by an overview of the formation of deformation texture in various materials after cross rolling. Review of some of the research works on cross rolling in last few decades has also been included. A case study has been provided at the end of this chapter. 2.1 Introduction Rolling is one of the bulk metal forming processes, where metal is deformed plastically by allowing it to flow between two rollers, rotating in opposite direc- tions. Plastic deformation reduces the initial thickness of the workpiece to a pre- defined final thickness, and the gap between the two rotating rolls, which is less than the initial thickness, determines the final thickness. Because of the constancy of volume of material before and after rolling, the amount of reduction in material thickness governs the elongation in length. The change in width is negligible since it is much larger as compared to its thickness. Frictional force, f between workpiece and rolls is responsible for dragging the workpiece into the roll gap. Rolling process not only reduces the thickness, but also enhances material properties like strength, toughness, surface morphology, etc. Contour of the rolls governs the shape of the rolled product. Rolling is the most widely used forming process, which produces M. Rout S.K. Pal (&) Department of Mechanical Engineering, Indian Institute of Technology, Kharagpur 721302, India e-mail: [email protected] S.B. Singh Department of Metallurgical and Materials Engineering, Indian Institute of Technology, Kharagpur 721302, India © Springer International Publishing Switzerland 2015 J.P. Davim (ed.), Modern Manufacturing Engineering, Materials Forming, Machining and Tribology, DOI 10.1007/978-3-319-20152-8_2 41
Transcript of Cross Rolling: A Metal Forming Process

Chapter 2Cross Rolling: A Metal Forming Process
Matruprasad Rout, Surjya K. Pal and Shiv B. Singh
Abstract The chapter deals with cross rolling where the workpiece is rotated by90° in the rolling plane after each rolling pass. The chapter begins with basics ofmetal rolling, and later on focuses on cross rolling. A short introduction to textureand its representation is presented followed by an overview of the formation ofdeformation texture in various materials after cross rolling. Review of some of theresearch works on cross rolling in last few decades has also been included. A casestudy has been provided at the end of this chapter.
2.1 Introduction
Rolling is one of the bulk metal forming processes, where metal is deformedplastically by allowing it to flow between two rollers, rotating in opposite direc-tions. Plastic deformation reduces the initial thickness of the workpiece to a pre-defined final thickness, and the gap between the two rotating rolls, which is lessthan the initial thickness, determines the final thickness. Because of the constancyof volume of material before and after rolling, the amount of reduction in materialthickness governs the elongation in length. The change in width is negligible sinceit is much larger as compared to its thickness. Frictional force, f between workpieceand rolls is responsible for dragging the workpiece into the roll gap. Rolling processnot only reduces the thickness, but also enhances material properties like strength,toughness, surface morphology, etc. Contour of the rolls governs the shape of therolled product. Rolling is the most widely used forming process, which produces
M. Rout � S.K. Pal (&)Department of Mechanical Engineering, Indian Institute of Technology,Kharagpur 721302, Indiae-mail: [email protected]
S.B. SinghDepartment of Metallurgical and Materials Engineering,Indian Institute of Technology, Kharagpur 721302, India
© Springer International Publishing Switzerland 2015J.P. Davim (ed.), Modern Manufacturing Engineering, Materials Forming,Machining and Tribology, DOI 10.1007/978-3-319-20152-8_2
41

products like bloom, billet, slab, plate, strip, sheet, etc. In order to increase theflowability of the metal during rolling, the process is generally performed at hightemperature and consequently the load requirement reduces. Figure 2.1 shows aschematic diagram of a rolling process, where a strip of thickness, h0 enters the rollgap and is reduced to hf by a pair of rolls, rotating in opposite directions. Thesurface speed of the roll is Vrð¼ x� RÞ. The linear speed of the workpieceincreases from its initial value, V0 as it moves through the roll gap and attains ahighest value, Vf at the exit of the roll gap.
Friction plays an important role in rolling as it always opposes relative move-ment between two surfaces sliding against each other. At the point where workpieceenters the roll gap, the surface speed of the rolls is higher than that of the workpiece.So, the direction of friction is in the direction of the workpiece movement and thisfriction force drags it into the roll gap. During rolling, velocity of the workpieceincreases as material flow rate remains same all throughout the deformation.Material velocity is equal to the surface speed of the rolls at a plane, called theneutral plane. From the entry point to the neutral point, the deformation zone isnamed as the lagging zone. Beyond the neutral plane, i.e., in the leading zone, thespeed of the deforming workpiece is faster than the peripheral speed of the rolls anddirection of friction quickly changes to oppose this. In order to make the analysis offlat rolling process simple, assumptions like plane strain deformation, volumeconstancy principle, constant coefficient of friction, constant surface velocity of therolls, etc., are considered. Out of all varieties of the rolling processes, the flat rollingis the most practical one which produces around 40–60 % of the total rolledproducts [1]. This attracts several researchers to work in this area to improve thequality and quantity of products through optimizing the process parameters. Crossrolling, by changing the workpiece orientation and hence changing the deformationpath, is a way of tailoring texture development to reduce the anisotropic propertiesof the workpiece.
Fig. 2.1 Flat rolling process
42 M. Rout et al.

2.1.1 Cross rolling
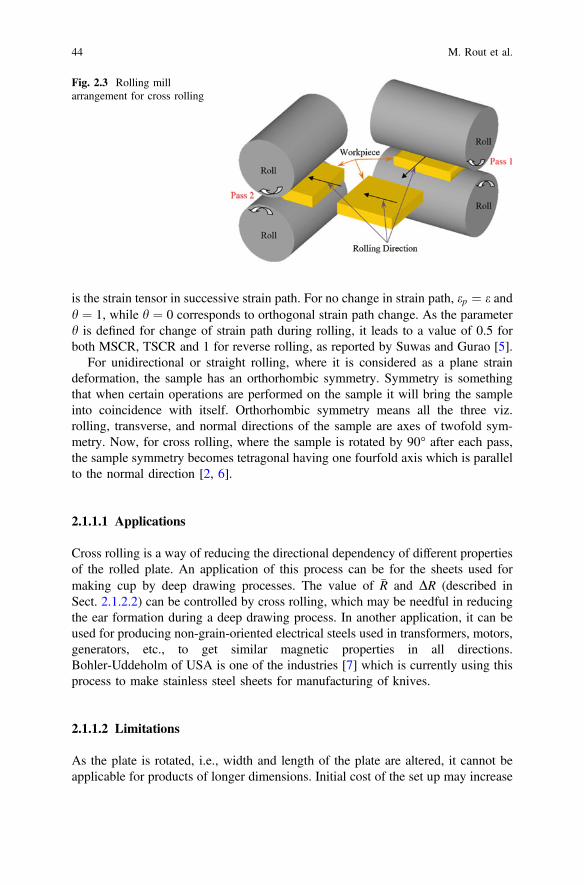
Cross rolling (CR) is normally done on samples of comparatively lesser dimension,by changing the rolling direction (RD). The sample, on the rolling plane, is rotatedby 90° about the normal direction (ND). There is no standardized sequence ofstages of cross rolling but the sequences followed by most of the researchers aremainly of two types: Two-step cross rolling (TSCR), also known as pseudo-cross-rolling, where direction is changed after achieving 50 % of the total reduction(Fig. 2.2a). Second, Multistep cross rolling (MSCR), also known as true crossrolling, where direction is changed after each pass (Fig. 2.2b) [2]. Clock rolling(Fig. 2.2c) may be one more way of achieving cross rolling, by continuouslychanging the rolling direction by 90° about ND, and if the rotation is 180° insteadof 90°, it is called as reverse rolling. Change in rolling direction or deformation pathchanges the substructure formed in the previous path of deformation, and henceaffects the deformation texture. Cross rolling leads to rolled product of compara-tively uniform mechanical properties in all directions (Fig. 2.3).
Schmitt et al. [3] have studied the effect of critical resolved shear stress (CRSS)value on yield locus for polycrystalline material. Different values of CRSS wereobtained by prestraining the material in different directions and the degree ofchange in strain path, is defined by a scalar parameter, a ¼ dep � de; where dep andde are the unit vectors in two different strain paths. They have observed that theyield stress value increases with a varying from 1 to 0 and decreases when a variesfrom 0 to −1. Gurao et al. [4] defined the above-mentioned parameter in a differentway as h ¼ ep : e
� �= ep�� �� ekk� �
; where ep is strain tensor in the prestrain path and e
90°
(b)
(a)
(c)
Fig. 2.2 Cross rolling sequences; a Two-step cross-rolling (TSCR), b Multistep cross-rolling(MSCR) and c Clock rolling
2 Cross Rolling: A Metal Forming Process 43
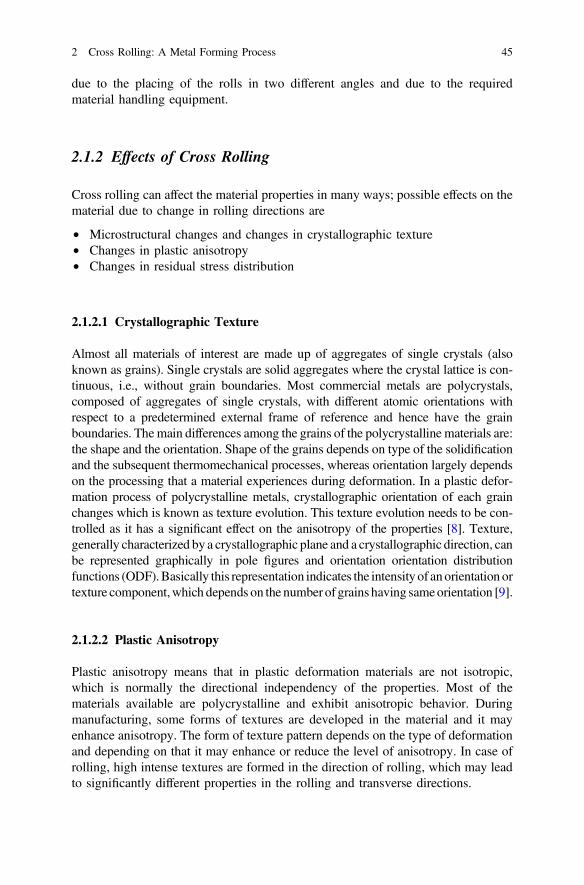
is the strain tensor in successive strain path. For no change in strain path, ep ¼ e andh ¼ 1, while h ¼ 0 corresponds to orthogonal strain path change. As the parameterh is defined for change of strain path during rolling, it leads to a value of 0.5 forboth MSCR, TSCR and 1 for reverse rolling, as reported by Suwas and Gurao [5].
For unidirectional or straight rolling, where it is considered as a plane straindeformation, the sample has an orthorhombic symmetry. Symmetry is somethingthat when certain operations are performed on the sample it will bring the sampleinto coincidence with itself. Orthorhombic symmetry means all the three viz.rolling, transverse, and normal directions of the sample are axes of twofold sym-metry. Now, for cross rolling, where the sample is rotated by 90° after each pass,the sample symmetry becomes tetragonal having one fourfold axis which is parallelto the normal direction [2, 6].
2.1.1.1 Applications
Cross rolling is a way of reducing the directional dependency of different propertiesof the rolled plate. An application of this process can be for the sheets used formaking cup by deep drawing processes. The value of �R and DR (described inSect. 2.1.2.2) can be controlled by cross rolling, which may be needful in reducingthe ear formation during a deep drawing process. In another application, it can beused for producing non-grain-oriented electrical steels used in transformers, motors,generators, etc., to get similar magnetic properties in all directions.Bohler-Uddeholm of USA is one of the industries [7] which is currently using thisprocess to make stainless steel sheets for manufacturing of knives.
2.1.1.2 Limitations
As the plate is rotated, i.e., width and length of the plate are altered, it cannot beapplicable for products of longer dimensions. Initial cost of the set up may increase
Fig. 2.3 Rolling millarrangement for cross rolling
44 M. Rout et al.
due to the placing of the rolls in two different angles and due to the requiredmaterial handling equipment.
2.1.2 Effects of Cross Rolling
Cross rolling can affect the material properties in many ways; possible effects on thematerial due to change in rolling directions are
• Microstructural changes and changes in crystallographic texture• Changes in plastic anisotropy• Changes in residual stress distribution
2.1.2.1 Crystallographic Texture
Almost all materials of interest are made up of aggregates of single crystals (alsoknown as grains). Single crystals are solid aggregates where the crystal lattice is con-tinuous, i.e., without grain boundaries. Most commercial metals are polycrystals,composed of aggregates of single crystals, with different atomic orientations withrespect to a predetermined external frame of reference and hence have the grainboundaries. Themain differences among the grains of the polycrystalline materials are:the shape and the orientation. Shape of the grains depends on type of the solidificationand the subsequent thermomechanical processes, whereas orientation largely dependson the processing that a material experiences during deformation. In a plastic defor-mation process of polycrystalline metals, crystallographic orientation of each grainchanges which is known as texture evolution. This texture evolution needs to be con-trolled as it has a significant effect on the anisotropy of the properties [8]. Texture,generally characterized by a crystallographic plane and a crystallographic direction, canbe represented graphically in pole figures and orientation orientation distributionfunctions (ODF).Basically this representation indicates the intensity of anorientation ortexture component,which depends on the number of grains having sameorientation [9].
2.1.2.2 Plastic Anisotropy
Plastic anisotropy means that in plastic deformation materials are not isotropic,which is normally the directional independency of the properties. Most of thematerials available are polycrystalline and exhibit anisotropic behavior. Duringmanufacturing, some forms of textures are developed in the material and it mayenhance anisotropy. The form of texture pattern depends on the type of deformationand depending on that it may enhance or reduce the level of anisotropy. In case ofrolling, high intense textures are formed in the direction of rolling, which may leadto significantly different properties in the rolling and transverse directions.
2 Cross Rolling: A Metal Forming Process 45

Lankford coefficient, R, defines plastic anisotropy by the ratio of strain in widthdirection (ew) to the strain in thickness direction (et) in the uniaxial tensile test.Higher value of R indicates high resistance of the material to thinning and hence thematerial can be drawn into a greater height. The Lankford coefficient depends onthe orientation of tensile axis with reference to the rolling direction, in the rollingplane and defined by the angle a, and hence R ¼ Ra. In general, materials areanisotropic and defined by average �R(ASTM E517):
R ¼ 14
R0� þ 2R45� þR90
�� � ð2:1Þ
Variation of the Ra in the plane of the sheet is also important and it is describedby the coefficient of planar anisotropy,
DR ¼ 12
R0� � 2R45� þR90
�� � ð2:2Þ
Planar anisotropy relates to the formation of ears in deep drawn cups or in otherwords DR is the degree of the tendency of the sheet to form ears. If DR[ 0, thenears form at 0° and 90° to the rolling direction, and if DR\0, ears form at 45°.These two coefficients are dependent on crystallographic texture.
2.1.2.3 Residual Stress
Stresseswhich remain in the solidmaterial even after the removal of the cause of stressare called as residual stress. The cause of the stressmay be external mechanical load orit may be the thermal load and for the latter case, the residual stress is normally calledas thermal stress. During hot rolling, the material is subjected to both the types ofloading; and due to the nonuniformity in deformation and presence of temperaturegradients; the residual stress distribution in the material after rolling is not uniform.Residual stress may distort the shape of the rolled material and it also has significanteffect on further processing of the rolled product. Thus, the residual stresses distri-bution in rolled sheet cannot be ignored. Residual stresses, which may be a com-pressive or a tensile type, are sometimes desirable also. For brittle fracture by crackpropagation in a material having compressive residual stress is little difficult. Now forcross rolling, where the deformation path changes, the temperature and plastic straindistribution in the material will be different to that of a material rolled in a singledirection and hence the residual stress distribution will also change. Very few liter-atures are available on residual stress distribution for the cross-rolled material. Natureof the residual stress developed in the rolled product can be changed, i.e., from tensileto compressive, by cross rolling [10].
46 M. Rout et al.
2.2 Texture or Preferred Orientation
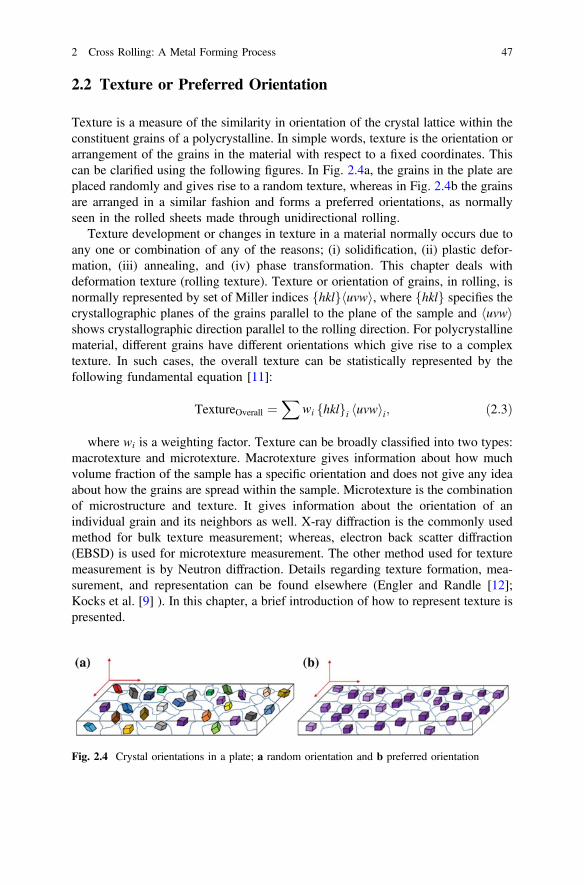
Texture is a measure of the similarity in orientation of the crystal lattice within theconstituent grains of a polycrystalline. In simple words, texture is the orientation orarrangement of the grains in the material with respect to a fixed coordinates. Thiscan be clarified using the following figures. In Fig. 2.4a, the grains in the plate areplaced randomly and gives rise to a random texture, whereas in Fig. 2.4b the grainsare arranged in a similar fashion and forms a preferred orientations, as normallyseen in the rolled sheets made through unidirectional rolling.
Texture development or changes in texture in a material normally occurs due toany one or combination of any of the reasons; (i) solidification, (ii) plastic defor-mation, (iii) annealing, and (iv) phase transformation. This chapter deals withdeformation texture (rolling texture). Texture or orientation of grains, in rolling, isnormally represented by set of Miller indices hklf g uvwh i, where hklf g specifies thecrystallographic planes of the grains parallel to the plane of the sample and uvwh ishows crystallographic direction parallel to the rolling direction. For polycrystallinematerial, different grains have different orientations which give rise to a complextexture. In such cases, the overall texture can be statistically represented by thefollowing fundamental equation [11]:
TextureOverall ¼X
wi hklf gi uvwh ii; ð2:3Þ
where wi is a weighting factor. Texture can be broadly classified into two types:macrotexture and microtexture. Macrotexture gives information about how muchvolume fraction of the sample has a specific orientation and does not give any ideaabout how the grains are spread within the sample. Microtexture is the combinationof microstructure and texture. It gives information about the orientation of anindividual grain and its neighbors as well. X-ray diffraction is the commonly usedmethod for bulk texture measurement; whereas, electron back scatter diffraction(EBSD) is used for microtexture measurement. The other method used for texturemeasurement is by Neutron diffraction. Details regarding texture formation, mea-surement, and representation can be found elsewhere (Engler and Randle [12];Kocks et al. [9] ). In this chapter, a brief introduction of how to represent texture ispresented.
Fig. 2.4 Crystal orientations in a plate; a random orientation and b preferred orientation
2 Cross Rolling: A Metal Forming Process 47
2.2.1 Reference System
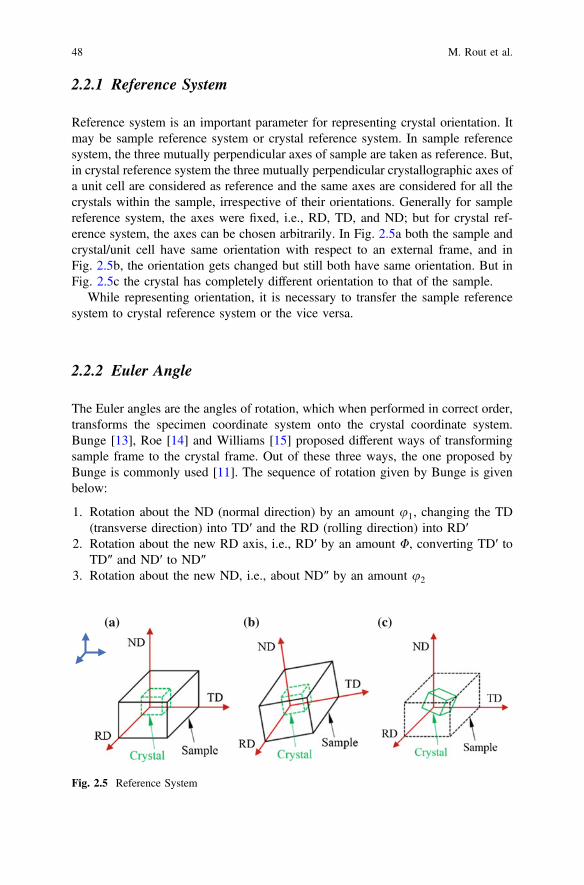
Reference system is an important parameter for representing crystal orientation. Itmay be sample reference system or crystal reference system. In sample referencesystem, the three mutually perpendicular axes of sample are taken as reference. But,in crystal reference system the three mutually perpendicular crystallographic axes ofa unit cell are considered as reference and the same axes are considered for all thecrystals within the sample, irrespective of their orientations. Generally for samplereference system, the axes were fixed, i.e., RD, TD, and ND; but for crystal ref-erence system, the axes can be chosen arbitrarily. In Fig. 2.5a both the sample andcrystal/unit cell have same orientation with respect to an external frame, and inFig. 2.5b, the orientation gets changed but still both have same orientation. But inFig. 2.5c the crystal has completely different orientation to that of the sample.
While representing orientation, it is necessary to transfer the sample referencesystem to crystal reference system or the vice versa.
2.2.2 Euler Angle
The Euler angles are the angles of rotation, which when performed in correct order,transforms the specimen coordinate system onto the crystal coordinate system.Bunge [13], Roe [14] and Williams [15] proposed different ways of transformingsample frame to the crystal frame. Out of these three ways, the one proposed byBunge is commonly used [11]. The sequence of rotation given by Bunge is givenbelow:
1. Rotation about the ND (normal direction) by an amount u1, changing the TD(transverse direction) into TD′ and the RD (rolling direction) into RD′
2. Rotation about the new RD axis, i.e., RD′ by an amount U, converting TD′ toTD″ and ND′ to ND″
3. Rotation about the new ND, i.e., about ND″ by an amount u2
(a) (b) (c)
Fig. 2.5 Reference System
48 M. Rout et al.

where u1;U and u2 are the Euler angles. The sequence of rotation is representedgraphically in Fig. 2.6 [16].
2.2.3 Representation of Texture
Graphically, texture can be represented by any of the following ways: pole figureshowing the distribution of a specific crystallographic direction in the assembly ofgrains of the specimen in sample reference system; inverse pole figure (IPF) showingthe frequency with which a particular crystallographic direction coincides with axesof the specimen; and orientation distribution function (ODF) which shows the full3D representation of crystallographic texture calculated from a set of pole figures.
2.2.3.1 Pole Figure
Orientation of a plane can be represented by a line normal to it. If a sphere, termed asreference sphere, is drawn with the center on the plane, then the circle formed at theintersection of the plane and the sphere is called trace [17]. Now, if the line normal to
Fig. 2.6 Euler anglesproposed by Bunge [13]
2 Cross Rolling: A Metal Forming Process 49
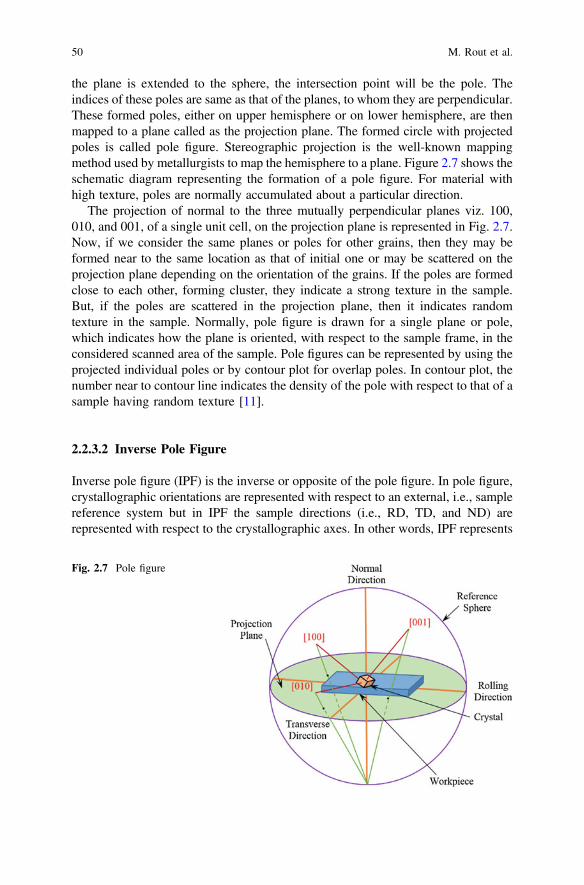
the plane is extended to the sphere, the intersection point will be the pole. Theindices of these poles are same as that of the planes, to whom they are perpendicular.These formed poles, either on upper hemisphere or on lower hemisphere, are thenmapped to a plane called as the projection plane. The formed circle with projectedpoles is called pole figure. Stereographic projection is the well-known mappingmethod used by metallurgists to map the hemisphere to a plane. Figure 2.7 shows theschematic diagram representing the formation of a pole figure. For material withhigh texture, poles are normally accumulated about a particular direction.
The projection of normal to the three mutually perpendicular planes viz. 100,010, and 001, of a single unit cell, on the projection plane is represented in Fig. 2.7.Now, if we consider the same planes or poles for other grains, then they may beformed near to the same location as that of initial one or may be scattered on theprojection plane depending on the orientation of the grains. If the poles are formedclose to each other, forming cluster, they indicate a strong texture in the sample.But, if the poles are scattered in the projection plane, then it indicates randomtexture in the sample. Normally, pole figure is drawn for a single plane or pole,which indicates how the plane is oriented, with respect to the sample frame, in theconsidered scanned area of the sample. Pole figures can be represented by using theprojected individual poles or by contour plot for overlap poles. In contour plot, thenumber near to contour line indicates the density of the pole with respect to that of asample having random texture [11].
2.2.3.2 Inverse Pole Figure
Inverse pole figure (IPF) is the inverse or opposite of the pole figure. In pole figure,crystallographic orientations are represented with respect to an external, i.e., samplereference system but in IPF the sample directions (i.e., RD, TD, and ND) arerepresented with respect to the crystallographic axes. In other words, IPF represents
Fig. 2.7 Pole figure
50 M. Rout et al.
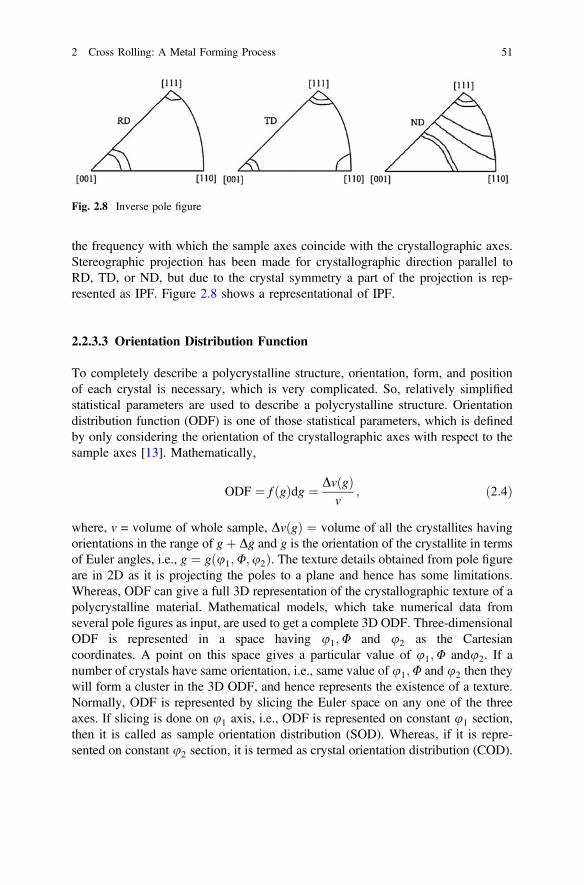
the frequency with which the sample axes coincide with the crystallographic axes.Stereographic projection has been made for crystallographic direction parallel toRD, TD, or ND, but due to the crystal symmetry a part of the projection is rep-resented as IPF. Figure 2.8 shows a representational of IPF.
2.2.3.3 Orientation Distribution Function
To completely describe a polycrystalline structure, orientation, form, and positionof each crystal is necessary, which is very complicated. So, relatively simplifiedstatistical parameters are used to describe a polycrystalline structure. Orientationdistribution function (ODF) is one of those statistical parameters, which is definedby only considering the orientation of the crystallographic axes with respect to thesample axes [13]. Mathematically,
ODF ¼ f gð Þdg ¼ Dv gð Þv
; ð2:4Þ
where, v = volume of whole sample, Dv gð Þ ¼ volume of all the crystallites havingorientations in the range of gþ Dg and g is the orientation of the crystallite in termsof Euler angles, i.e., g ¼ gðu1;U;u2Þ. The texture details obtained from pole figureare in 2D as it is projecting the poles to a plane and hence has some limitations.Whereas, ODF can give a full 3D representation of the crystallographic texture of apolycrystalline material. Mathematical models, which take numerical data fromseveral pole figures as input, are used to get a complete 3D ODF. Three-dimensionalODF is represented in a space having u1;U and u2 as the Cartesiancoordinates. A point on this space gives a particular value of u1;U andu2. If anumber of crystals have same orientation, i.e., same value of u1;U and u2 then theywill form a cluster in the 3D ODF, and hence represents the existence of a texture.Normally, ODF is represented by slicing the Euler space on any one of the threeaxes. If slicing is done on u1 axis, i.e., ODF is represented on constant u1 section,then it is called as sample orientation distribution (SOD). Whereas, if it is repre-sented on constant u2 section, it is termed as crystal orientation distribution (COD).
Fig. 2.8 Inverse pole figure
2 Cross Rolling: A Metal Forming Process 51

As per Bunge, an orientation distribution function can be described by followingseries [5]:
f ¼ u1;U;u2ð Þ ¼X1l¼0
Xþ1
m¼�1
Xþ1
n¼�1
Cmn1 Pmn
1 Uð Þ � exp im u2ð Þ exp in u1ð Þ; ð2:5Þ
where Cmn1 is the series coefficients and Pmn
1 ðUÞ are certain generalizations ofassociated Legendre functions.
2.2.4 Ideal Orientations
Ideal orientations are the orientations of the grains or texture components, which arenormally observed in rolled materials. Some of these components are named afterthe metal or alloys in which they were observed for the first time. Apart from theideal orientations, there are some texture fibers, which are nothing but the linesjoining the texture components having a range of orientations with a single degreeof freedom about a fixed axis, has also been observed [9]. Followings are the list ofideal orientations for materials with different crystal structures presented in tabularforms (Tables 2.1, 2.2).
2.2.5 Prediction of Texture
Various mathematical models are used to predict the deformation mechanism andhence deformation texture during rolling. Basically these models consider the
Table 2.1 Ideal orientations in BCC materials [5]
Components Miller indiceshklf g uvwh i
Euler angles (°)(φ1, Φ, φ2)
Cube (C) 100f g 001h i 45, 0, 45
Rotated cube 001f g 110h i 0, 0, 45
Goss (G) 110f g 001h i 90, 90, 45
Table 2.2 Ideal orientations in FCC materials [5, 9]
Components Miller indices hklf g uvwh i Euler angles (°) (φ1, Φ, φ2)
Copper (Cu) 112f g 111h i 90, 35, 45
Brass (Bs) 110f g 112h i 35, 45, 0
Cube (C) 100f g 001h i 0, 0, 0
Goss (G) 110f g 001h i 0, 45, 0
S 123f g 634h i 59, 29, 63
52 M. Rout et al.

behavior of the materials, which are normally polycrystalline, as a statisticalfunction of the behavior of distinct grains. Some of the models are: Taylor model,Sachs’ model, LAMEL, ALAMEL, GIA, CPFEM, viscoplastic self-consistentmodel and many more. The basics of these models start with deriving mathematicalequation which transfers or relates the stresses and strains, the sample is subjectedto, at the grain level. Now, these microlevel stresses and strains are linked to slipand twining systems, by some constitutive equations, for the initiation of plasticdeformation. The fundamental equation is shown below [11]
DC ¼ _eXS
mS : rC
sS
��������mS sgn mS : rC
� � ð2:6Þ
whereDc: Strain rate in a crystal_e : Scaling factorrc: Stress in a crystalss: Critical resolved shear stress (CRSS)ms : Schmid tensor
mS ¼ 1=2� �
bSi nSj þ bSj n
Si
� �ð2:7Þ
s : slip and twining systemsb : Slip directionn : Normal to the slip planeSlip in a system will occur when the resolved shear stress ms : rc approaches ss
and the plane on which slip occurs, which were identified by simultaneouslysolving the equation for a single crystal as well as interaction between the crystals.Plastic deformation causes lattice rotation and can be calculated after inputting theactivated slip system which is well known for different crystal structure materials.The obtained lattice rotations are used in deriving the deformation texture. Thesedeformation models are also implemented to cross rolling to predict the deformationtexture, by different authors, but the number of research papers available on this isnot too high. Some of the works on the predicted deformation texture for crossrolling is given in Sect. 2.3.2.
2.3 Cross Rolling Texture: An Overview
2.3.1 Experimental Observation
Texture or preferred orientation, which affects material properties, contains infor-mation about the interrelation between processing parameters and material perfor-mance. It provides essential feedback for tuning the thermomechanical history to
2 Cross Rolling: A Metal Forming Process 53

get desired properties in the finished product [9]. This makes texture developmentan important field of research for researchers. Changing the deformation path bychanging the rolling direction may be one way of tuning the thermomechanicalprocessing route to get the required orientation, and hence required properties.Some of the available earlier articles on cross rolling are by, Custers andRiemersma [18], Merlin and Beck [19], Wassermann and Grewen [20], Yeung andDuggan [21], on materials with face centered cubic (FCC), body centered cubic(BCC), and hexagonal close packed (HCP) crystal structures. But it is in the lastfew decades, where there is a significant progress in the research on cross rolling,which is mainly due to the advancement in technology to detect and analyzetextures in materials. Recently, some research works have been carried out usingcrystal plasticity finite element models to simulate the deformation mechanismduring the process. Literatures are available where rolling has been done by placingthe work-rolls at some angle in the rolling plane and termed as cross rolling. Thistype of rolling has not been discussed in the current chapter. Some of the researchworks, which are experimentally carried out on cross rolling, are discussed below.
2.3.1.1 Body Centered and Face Centered Cubic Materials
Due to the wide industrial application of BCC and FCC structure metals and alloys,a lot of research works has been carried out for texture evolution. Vanderschuerenet al. [22] experimentally studied the effect of change in rolling direction on themagnetic properties of nonoriented 0.6 % Si steel. Nonoriented electrical steels,which are normally used in rotor and starter of comparatively smaller electricalmachines, requires low core loss and high permeability to give an efficient per-formance to the machine. Hysteresis loss and eddy current loss are the two whichmutually do the core loss. Eddy current loss is related to resistivity and can becontrolled by the composition of the material but the hysteresis loss depends on themagnetic anisotropy, which depends on the orientation or texture of the materialand can be modified during the processing of the material. The authors have studiedthe direction effect by changing the rolling direction to 90°(TD) during cold rollingand after which the sheets were subjected to annealing and decarburization.Cross-cold rolling changes the initial hot-rolling texture components and produces astrong 001f g 110h i component. The texture data were correlated to the magneticproperties, and found that, hysteresis loss was 80 % of the total loss and it was dueto texture and grain size. Bocker et al. [2, 6] reported the texture development,through ODF, for two different materials namely Armco iron (BCC) and AlMn1alloy (FCC) in two separate articles. The same rolling sequence consisting of aMSCR and TSCR was followed for both the materials. They concluded that forMSCR, the deformation path follows a tetragonal symmetry; whereas for TSCR, itis a broken path as the deformation path changes at 50 % of total reduction but boththe parts of deformation has orthorhombic symmetry. For AlMn1, they found that,TSCR produces texture which has tube orientation extending between orientation Aand B, whereas MSCR gives rise texture with ideal orientation C.
54 M. Rout et al.

The high-temperature withstanding capacity of molybdenum (Mo) makes it anexcellent refractory material and find its application in furnace, nuclear industry, etc.It is a well-known fact that rolling produces preferred orientation in the material in therolling direction and molybdenum (BCC) is not an exception. Oertel et al. [23]investigated the influence of cross rolling as well as heat treatment on texture andformability of Mo sheet. The investigations were made at different stages (early stageand late stage) of the processing route and the rolling direction was changed in largervarieties, like 45°, 90°, and 135°. Texture produced in different sheets made bydifferent rolling sequences are independent of cross-rolling steps and gives rise to anincomplete α-fiber with maximum strengths sited at the rotated cube component.However, the intensities of the texture for sheets with complex rolling sequences aremuch less as compared to others. Cross rolling done at the early stage, produces sheetswith high mechanical anisotropy as compare to the sheets produced by processingwhere cross rolling is implemented at the later stage. This indicates the disappearanceof effect of cross rolling, which is due to the subsequent rolling in one direction.Sheets produced by changing the rolling direction in complex manner give lowerplanar anisotropy (ΔR). The reported value shows the parameter Z, which is related tothe earing formed during deep drawing, increases with the increase in ΔR value.
Aluminum alloys found a wide application due to its good strength, high duc-tility, high corrosion resistance, and low weight. But while doing sheet metalforming, like deep drawing of aluminum alloys, the chances of formation of earingis quite high due to its high plastic anisotropic properties. A good number ofresearchers have done cross rolling on various aluminum alloys to study thisanisotropy parameter, as well as deformation texture. Liu et al. [24] studied thetexture development in AA 3105 aluminum alloy (FCC), which has a strong β fiberrolling texture. They used a two-stage cross-cold-rolling process, where the rollingwas done in original TD and reduced the 2 mm sheet to different thickness, max-imum up to 90 %. The initial texture components present in the materials like B, S,and C get rotated and transform to B’, S’, and C’, respectively. With increase inrolling reduction, intensities of components like B and S get increased, whereasthere is no significant increase in the component C. They also made a quantitativeanalysis for texture by calculating the volume fraction of different texture com-ponents and correlated them with true rolling strain. In another paper, Liu et al. [25]reported the recrystallization texture of continuous cast AA 5005 aluminum alloy,where, the samples were annealed after rolled by pseudo-cross-cold-rolling process.Mondal et al. [26] makes a detailed analysis of cross rolling on AA 7010 aluminumalloys. They concluded that, cross rolling leads to the formation of β fiber in thealuminum alloy and with increasing number of cross rolling steps, the strength ofthe rotated-Bs component increases while that of rotated-Cu component reduces. Inanother study [27], made by same authors for a different kind of aluminum alloy,the authors found a strong rotated-Bs texture in the hot cross-rolled alloy.
Wronski et al. [10] studied the effect of cross rolling for pure copper (FCC) andlow carbon ferritic steel (BCC), by increasing the strain level for the second pass,where it is rotated by 90°. Texture formation by cross rolling gets symmetrized withincrease in strain value and becomes highest, when the amount of strain in both the
2 Cross Rolling: A Metal Forming Process 55
direction becomes equal. Symmetrization of the texture forms two more new axesof symmetry. With further increase in strain value, the symmetry of texture getreduced and start to form textures with characteristic same as that formed whenrolled in one direction, i.e., the effect of cross rolling disappears. Due to the dif-ferent slip system, the obtained rolling textures were different from each other. Theideal texture components which were observed for straight rolling of copper are S,C, B, and G, whereas for cross rolling, the B component becomes stable and theothers are absent. Similarly for ferritic steel, straight rolling produces componentslike RW, A, Y, and Z, whereas in cross rolling, except component A all othercomponents remain stable, but with different intensities. The authors also studiedthe plastic anisotropy parameter for cross-rolled plate. For copper, cross rollingmakes the material more isotropic as the normal anisotropy approaches 1 and planaranisotropy reduces from 0.54 to 0.3 which is beneficial for deep drawing. But forferritic steel, cross rolling causes increase in anisotropy which was due to theformation of α- fiber texture.
2.3.1.2 Hexagonal Close Packed Materials
A few literature is available on the study on texture development for HCP structurematerials, as a function of rolling mode, as compared to BCC and FCC structurematerials. Texture development in these materials depends on the c/a ratio; andcommonly observed textures are R-type and T-type. Magnesium, which has a HCPstructure and normally forms basal texture in rolling, is difficult to be deformedplastically as the resolve shear stress value is basically zero in the basal plane [26, 27].It also has a high anisotropy as compared to aluminum. Al-Samman and Gosttein[28], demonstrated for AZ31 magnesium alloy with initial basal texture, formation ofbasal texture in rolling was independent of the path of deformation (CR & UR), butcross rolling can reduce the strength of the developed basal texture. In cross rolling,due to continuous change in rolling direction, the samples obtained have lesserinternal misorientation than that obtained in unidirectional rolling. They also con-cluded that, for high reduction per pass, cross rolling gives high surface quality andgreater rollability, whereas for unidirectional rolling with the same reduction per passsurface cracks are observed. Li et al. [30] also observed same kind of results forME20 magnesium alloy. The intensity ratio of the basal and non-basal texturesreduced in cross rolling, and thus enhances the formability of the sheet. Cross rollinggives rise to sheets offiner microstructure but of lower yield strength, which is due tothe weaker texture where basal poles get scattered from ND. Plastic anisotropy alsogot improved by CR. Xing-pin et al. [29] did experimental investigation on AZ31magnesium alloy by rotating the plate by 90° after every five passes, with interme-diate heating. For this rolling schedule, cross rolling gives symmetric but highintensity basal texture. Cross-rolling produces magnesium sheets with high and moreuniform yield strength and percentage elongation; whereas for unidirectional rolling,the material shows high anisotropy with reasonably different percentage elongation,in all three principle directions. The difference in percentage elongation, for
56 M. Rout et al.
unidirectional rolling, is basically due to the distribution of basal poles which aremuch closer to RD than TD. Xiong et al. [31] investigated the effect of cross rollingfor Mg 0.6 wt% Zr sheet and compared with that of unidirectional. In both the modesof deformation, Schmid factor has higher value along RD but gradually reducestoward TD. This gives lower yield strength along RD. The other reported results areof similar kind to that of observed by other researchers for different Mg alloys.
Gurao et al. [32] studied texture evolution for metastable β titanium alloy usingunidirectional and multistep cross rolling, with a constant true strain/pass. Alongwith different mode of rolling, they did recrystallization and aging of the rolledsample to study all types of texture evolution, viz. deformation texture, recrystal-lization texture, and transformation texture. Premkumar et al. [33] did experimentalstudy on different sequences of rolling, including unidirectional rolling and differentcross rolling, on multifunctional β titanium alloy (HCP) and reported the resultingtexture as well as yield locus anisotropy. The developed textures were representedby two fiber textures; viz. α and γ. With the increase in rolling reduction, theintensities of γ fiber for all modes of rolling, i.e., two-step, multistep, and clockrolling, decrease. The intensity distribution is also not the same for all the cases.The authors conducted tensile as well as compression tests to get the yield loci ofthe rolled samples. Obtained anisotropy is minimum for clock rolling, whereas, it ismaximum for multistep cross rolling. Moreover, the type of deformation texturecomponents formed by rolling may remain the same but the intensities and dis-tribution of these components get changed, in cross rolling, due to the rotation ofthe plate and these variations are functions of amount reduction per pass and thecross rolling sequences.
2.3.2 Prediction of Cross Rolling Texture
One of the earliest available researches on this field is by Wierzbanowski in 1979[34]. He predicted the texture of FCC and BCC materials during cross rolling aswell as under compression, by using Sachs model and Taylor model. Both themodels gave a close prediction to experimental results. He found that, due to crossrolling some new orientation, like 001f g 100h i orientation, was introduced for FCCmaterial, as this was not observed for simple rolling; and the predicted textures werehighly symmetric. Yeung and Duggan [21] studied the texture development due tocross rolling in α brass. They used the program written by Dillamore [35] with a slipsystem of 111f g 110h i for the FCC material, as used in Taylor-Bishop-Hill theory.The simulated result shows the stability of 110f g 223h i component in cross rolling,whereas, the same component was unstable for straight rolling. Stability of thecomponent was studied by plotting Euler angles for different rolling strains. Liu andHoutte [36] implemented full constraint and relaxed constraint Taylor-Bishop-Hillmodels to predict the deformation texture developed by cross-cold rolling, as wellas by simple cold rolling, for molybdenum sheet. The considered slip systems were110f g 111h i and 112f g 111h i, for the BCC structure material. For cross rolling, in
2 Cross Rolling: A Metal Forming Process 57

order to get the input texture, the texture of previous pass was taken with respect toa new sample frame, obtained by rotating the sample reference frame about ND by90°. In relaxed constraint model, they have considered different version of Taylormodel, viz. the lath model, the Pancake model, and the three relaxations models[37] and found that Pancake model gave much more accurate result than the othermodels; whereas, for lower % reduction, the effect of cross rolling was not sig-nificant for full constrained model.
Suwas and Singh [38] used the relaxed constraint Taylor model to predict thetexture obtained by a two-step cross rolling and unidirectional rolling for Cu alloys.The predicted results show instability of β fiber due to cross rolling. In case of crossrolling, texture intensity does not depend too much on % reduction per pass. Thishas been reported earlier by Al-samman and Gottestien [28]. They considered fullconstraint Taylor model with ratios of critical resolved shear stress as 1:38:50(basal: prismatic: pyramidal) and simulated the rolling texture for both unidirec-tional and cross-rolling operations of magnesium alloy, with different reductions perpass. They compared results for both the modes of rolling, by plotting intensity offormed texture with respect to reduction per pass, and demonstrated that as com-pared to unidirectional rolling, cross rolling has low intensity texture and also doesnot depend on reduction per pass. The said model for texture prediction does notaccommodate microstructure part like recrystallization, recovery, etc., due to whichthere is a difference between computed and experimental results as well. For crossrolling, the input texture was taken by changing the strain tensor of previous path;whereas for unidirectional rolling, it was taken without any change. Wronski et al.[10] predicted cross rolling as well as unidirectional rolling textures for low carbonsteel and copper, by considering a deformation model with the interaction betweengrain and its surrounding as elasto-plastic. The plastic stress and strain at grain levelwere correlated to that of sample. Plastic deformation was initiated by slip, at planeswhere the values of shear stresses cross the critical resolved shear stress value. Slipsystems considered were 111f g 110h i for copper and 110f g 111h i for steel. Themodel also considers hardening during deformation which is due to the interactionsof slip systems. Stability of the texture components was also examined by thedeformation model. Gurao et al. 2011 [4] used viscoplastic self-consistent formu-lation to study texture development by different modes of rolling for copper andnickel. A rate-dependent viscoplastic law, which correlates strain rate in grain tograin stress, was used.
2.4 Case Study
A case study for cross rolling on AISI 304 stainless steel is presented in thischapter. For better understanding, cross rolling is compared with the unidirectionalrolling. The effect of change in direction is a function of percentage reduction perpass and the sequences in which the rolling is carried out. This case study is donefor a three-pass rolling with equal amount of reduction in each pass.
58 M. Rout et al.
2.4.1 Rolling
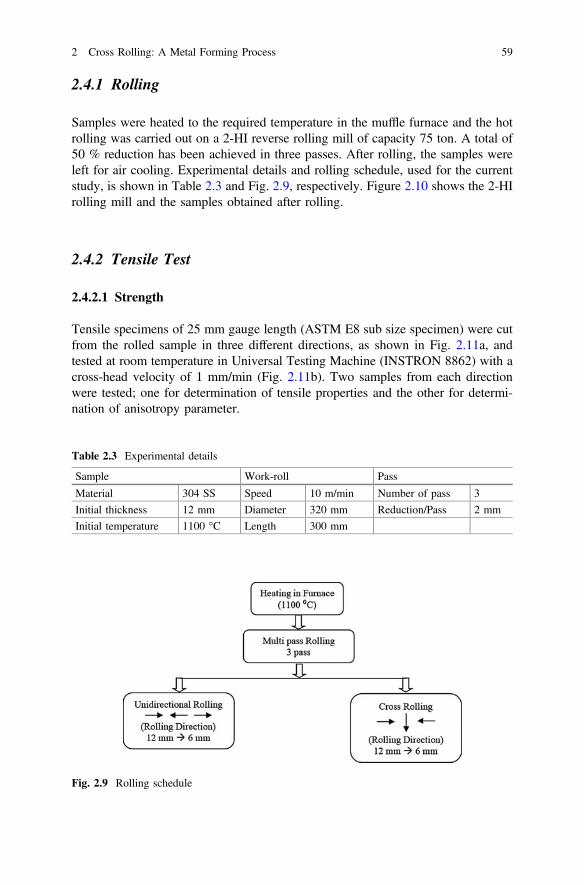
Samples were heated to the required temperature in the muffle furnace and the hotrolling was carried out on a 2-HI reverse rolling mill of capacity 75 ton. A total of50 % reduction has been achieved in three passes. After rolling, the samples wereleft for air cooling. Experimental details and rolling schedule, used for the currentstudy, is shown in Table 2.3 and Fig. 2.9, respectively. Figure 2.10 shows the 2-HIrolling mill and the samples obtained after rolling.
2.4.2 Tensile Test
2.4.2.1 Strength
Tensile specimens of 25 mm gauge length (ASTM E8 sub size specimen) were cutfrom the rolled sample in three different directions, as shown in Fig. 2.11a, andtested at room temperature in Universal Testing Machine (INSTRON 8862) with across-head velocity of 1 mm/min (Fig. 2.11b). Two samples from each directionwere tested; one for determination of tensile properties and the other for determi-nation of anisotropy parameter.
Table 2.3 Experimental details
Sample Work-roll Pass
Material 304 SS Speed 10 m/min Number of pass 3
Initial thickness 12 mm Diameter 320 mm Reduction/Pass 2 mm
Initial temperature 1100 °C Length 300 mm
Fig. 2.9 Rolling schedule
2 Cross Rolling: A Metal Forming Process 59

For Cross Rolling (CR), RD1 = Rolling Direction (RD) of Unidirectional Rolling(UR), and RD2 = Transverse Direction (TD) of Unidirectional Rolling.
Figure 2.12a, b show the Stress–Strain (engineering) plot for UR and CR. Theresults of the tensile tests are summarized in Tables 2.4, 2.5. By changing therolling direction UTS reduces (in RD direction) from 916 MPa, as in unidirectionalrolling, to 867 MPa. But it increases the % elongation along 45° direction from 56to 65 %. In brief, it can be mentioned that cross rolling produces a plate with moreisotropic properties in different directions as compared to unidirectional rolling.
CR
UR
(a) (b)
Fig. 2.10 a 2-HI Rolling mill and b Rolled samples
RD1
RD2
45
(a) (b)
Fig. 2.11 a Tensile sample orientation and b Sample during testing on INSTRON
60 M. Rout et al.
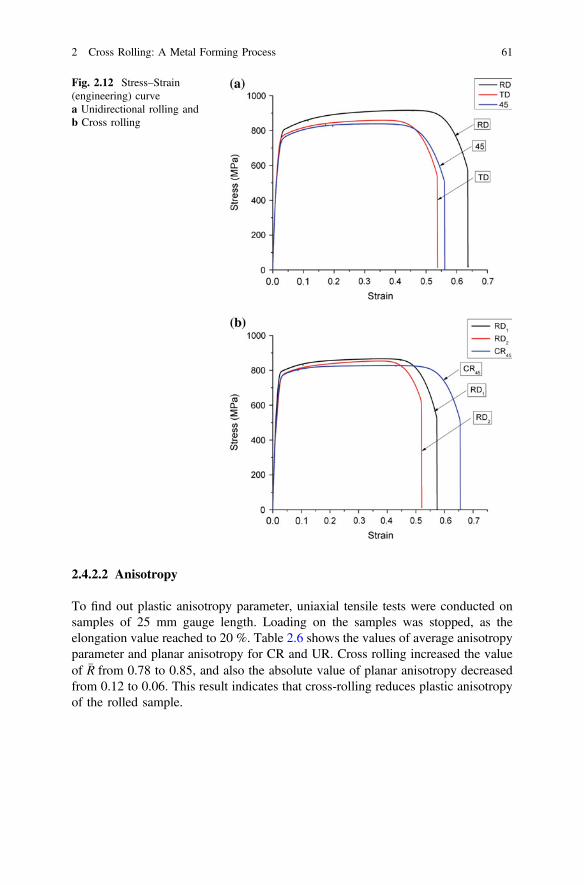
2.4.2.2 Anisotropy
To find out plastic anisotropy parameter, uniaxial tensile tests were conducted onsamples of 25 mm gauge length. Loading on the samples was stopped, as theelongation value reached to 20 %. Table 2.6 shows the values of average anisotropyparameter and planar anisotropy for CR and UR. Cross rolling increased the valueof �R from 0.78 to 0.85, and also the absolute value of planar anisotropy decreasedfrom 0.12 to 0.06. This result indicates that cross-rolling reduces plastic anisotropyof the rolled sample.
Fig. 2.12 Stress–Strain(engineering) curvea Unidirectional rolling andb Cross rolling
2 Cross Rolling: A Metal Forming Process 61

2.5 Conclusion
Change in the direction of rolling during rolling is not a new process and it has beenstudied for many decades. However, it is only in the last two decades that extensiveresearch work has been done in this area and thanks to the development of newtechnologies to detect and analyze the texture of a material very critically. Still,there are many areas which need to be explored further so that the application ofcross-rolled material can be extended to a much wider field. An in-depth study ofthe correlation among microstructure, texture, and material properties is obviouslyrequired for successful commercial exploitation of the process. Moreover, theapplication of cross rolling to different alloys as well as composites can be studiedin future.
References
1. Shahani AR, Setayeshi S, Nodamaie SA, Asadi MA, Rezaie S (2009) Prediction of influenceparameters on the hot rolling process using finite element method and neural network. J MaterProcess Technol 209(4):1920–1935
2. Bocker A, Klein H, Bunge HJ (1990) Development of cross-rolling textures in ARMCO-IRON. Textures Microstruct 12:103–123
Table 2.4 Yield strength and ultimate tensile strength
Direction Unidirectional rolling Cross rolling
UTS (MPa) YS (MPa) UTS (MPa) YS (MPa)
RD 916 427 867 502
45° 839 442 828 431
TD 860 518 854 432
Table 2.5 Percentageelongation
Direction Unidirectionalrolling
Cross rolling
TE (%) UE (%) TE (%) UE (%)
RD 63 44 57 34
45° 56 32 65 43
TD 53 35 52 38
TE: Total Elongation, UE: Uniform Elongation
Table 2.6 Plastic anisotropy Plastic anisotropy Cross rolling Unidirectional rolling�R 0.85375 0.78625
DR 0.0695 −0.1275
62 M. Rout et al.
3. Schmitt JH, Aernoudt E, Baudelet B (1985) Yield loci for polycrystalline metals withouttexture. Mater Sci Eng 75:13–20
4. Gurao NPP, Sethuraman S, Suwas S (2011) Effect of strain path change on the evolution oftexture and microstructure during rolling of copper and nickel. Mater Sci Eng A 528(25–26):7739–7750
5. Suwas S, Gurao NP (2014) Development of microstructures and textures by cross rolling.Compr Mater Process 3(30):81–107
6. Bocker A, Klein H, Bunge HJ (1990) Development of cross-rolling textures in AIMn1.Textures Microstruct 12:155–174
7. Bohler-Uddeholm U.S.A. http://www.bucorp.com/index.htm. Accessed 12 Mar 20158. Davenport SB, Higginson RL (2000) Strain path effects under hot working: an introduction.
J Mater Process Technol 98:267–291, Feb 19989. Kocks UF, Tome CN, Wenk HR (1998) Texture and anisotropy10. Wronski S, Wrobel M, Baczmanski A, Wierzbanowski K (2013) Effects of cross-rolling on
residual stress, texture and plastic anisotropy in f. c. c. and b. c. c. metals. Mater Charact77:116–126
11. Suwas S, Ray RK (2014) Crystallographic Texture of Materials. Springer, New York, p 26012. Engler O, Randle V (2010) Introduction to texture analysis. CRC Press, Florida p 49013. Bunge HJ, Morris PR (1982) Texture Analysis in Materials Science. Butterworths, London
p 60214. Roe RJ (1965) Description of crystallite orientation in polycrystalline materials. III. General
solution to pole figure inversion. J Appl Phys 36(1965):2024–203115. Williams RO (1968) Analytical methods for representing complex textures by biaxial pole
figures. J Appl Phys 39(1968):4329–433516. Rollett AD (2014) Texture, microstructure & anisotropy. http://neon.mems.cmu.edu/rollett/
27750/27750.html. Accessed 23 Mar 201517. Cullity BD (1957) Elements of X-ray diffraction. Addison Wesley Publishing Company,
London p 51418. Custers JFH, Riemersma JC (1946) The textures of straight-rolled and of cross-rolled
molybedenum. Phys XII 4:195–20819. Merlini A, Beck PA (1953) Study of the origin of cube texture. Acta Metall 1:598–60620. Wassermann G, Grewen J (1962) Texturen metallischer Wekstoffe. Springer, Heidelberg,
p 80821. Yeung WY, Duggan BJ (1986) Texture and structure development in cross-rolled α brass.
Acta Met 34(4):653–66022. Vanderschueren D, Kestens L, Van Houtte P, Aernoudt E, Dilewijns J, Meers U (1991) The
effect of cross rolling on texture and magnetic properties of non oriented electrical steels.Textures Microstruct 14–18:921–926
23. Oertel C, Hünsche I, Skrotzki W, Lorich A, Knabl W, Resch J, Trenkwalder T (2010)Influence of cross rolling and heat treatment on texture and forming properties of molybdenumsheets. Int J Refract Met Hard Mater 28(6):722–727
24. Liu W, Kong X, Chen M, Li J, Yuan H, Yang Q (2009) Texture development in a pseudocross-rolled AA 3105 aluminum alloy. Mater Sci Eng A 516(1–2):263–269
25. Liu W, Li X, Meng X (2009) Effect of pseudo cross-rolling on the recrystallization texture of acontinuous cast Al–Mg alloy. Scr Mater 60(9):768–771
26. Mondal C, Singh AK, Mukhopadhyay AK, Chattopadhyay K (2013) Effects of differentmodes of hot cross-rolling in 7010 aluminum alloy: Part I. Evolution of microstructure andtexture. Metall Mater Trans A 44(6):2746–2763
27. Mondal C, Singh AK, Mukhopadhyay AK, Chattopadhyay K (2011) Formation of a single,rotated-Brass {110} ⟨5 5 6⟩ texture by hot cross-rolling of an Al–Zn–Mg–Cu–Zr alloy. ScrMater 64(5):446–449
28. Al-Samman T, Gottstein G (2008) Influence of strain path change on the rolling behavior oftwin roll cast magnesium alloy. Scr Mater 59(7):760–763
2 Cross Rolling: A Metal Forming Process 63
29. Xing-pin C, Du S, Rui X, Guang-jie H, Qing L (2010) Influence of rolling wayson microstructure and anisotropy of AZ31 alloy sheet. Trans Nonferrous Met Soc China 20:s589–s593
30. Li X, Al-Samman T, Gottstein G (2011) Mechanical properties and anisotropy of ME20magnesium sheet produced by unidirectional and cross rolling. Mater Des 32(8–9):4385–4393
31. Xiong J, Chen Z, Yi L, Hu S, Chen T, Liu C (2014) Microstructure and mechanical propertiesof annealed Mg–0.6 wt % Zr sheets by unidirectional and cross rolling. Mater Sci Eng A590:60–65
32. Gurao NP, Ali AA, Suwas S (2000) Study of texture evolution in metastable β-Ti alloy as afunction of strain path and its effect on α transformation texture. Mater Sci Eng A 504(1–2):24–35
33. Premkumar M, Himabindu VS, Banumathy S, Bhattacharjee A, Singh AK (2012) Effect ofmode of deformation by rolling on texture evolution and yield locus anisotropy in amultifunctional β titanium alloy. Mater Sci Eng A 552:15–23
34. Wierzbanowski K (1979) Numerical prediction of cross rolling and compression textures. ScrMater 13:1117–1120
35. Dillamore IL, Roberts WT (1965) Preferred orientation in wrought and annealed metals.Metall Rev 10(39):271–380
36. Liu YS, Van Houtte P (2001) Simulation of deformation textures in cold-rolled molybdenumsheets by the taylor–bishop–hill theory. Int J Refract Met Hard Mater 19(3):209–216
37. Van Houtte P (1982) On the equivalence of the relaxed taylor theory and the bishop-hill theoryfor partially constrained plastic deformation of crystals. Mater Sci Eng 55:69–77
38. Suwas S, Singh AK (2003) Role of strain path change in texture development. Mater SciEng A 356(1–2):368–371
64 M. Rout et al.

http://www.springer.com/978-3-319-20151-1