Crops Grown For Bioenergy in England and the UK: 2015 · market. 1 million ... Cereal and Oilseed...
34
Enquiries on this publication to: Alison Wray, Department for Environment, Food and Rural Affairs, 201 Foss House, Kings Pool, 1-2, Peasholme Green, York YO1 7PX. Tel: 020 802 66119. Email: [email protected] These statistics are produced free from any political interference. You can find information about National Statistics on the internet at www.statistics.gov.uk. Published 8 th December 2016 Crops Grown For Bioenergy in England and the UK: 2015 About this release This release contains information on the area of non-food crops grown in the UK including: Areas of oilseed rape, sugar beet and wheat used for producing biofuels and maize for use in anaerobic digestion. Areas of miscanthus, short rotation coppice and straw crops grown as plant biomass. Key Messages 93 thousand hectares of agricultural land was used for bioenergy in the UK in 2015. The area of crops grown for bioenergy equated to just under 2% of all arable land in the UK in 2015. 53% of land used for bioenergy in 2015 was for biofuel for the UK road transport market. 1 million tonnes of UK crops were produced for the UK road transport market Figures relating to biofuel used for road transport in 2015/16 (year runs mid-April to mid-April) are provisional based on data currently available. These shows that, of the total volume of renewable fuel supplied in 2015/16, 99% (1,546 million litres) has so far been demonstrated to meet the sustainability requirements (see Annex B for more details). A dataset covering longer time series for selected data tables has been published alongside this statistics release and is available here. The next update to this statistical release is anticipated in Autumn 2017 and will be published here. Revisions Section 1: volumes of biofuels supplied to the UK road transport market in 2014/15 have been revised to reflect the final estimates. There have been no other revisions to previously published estimates.
Transcript of Crops Grown For Bioenergy in England and the UK: 2015 · market. 1 million ... Cereal and Oilseed...

Enquiries on this publication to: Alison Wray, Department for Environment, Food and Rural Affairs, 201 Foss House,
Kings Pool, 1-2, Peasholme Green, York YO1 7PX. Tel: 020 802 66119. Email: [email protected] These statistics are produced free from any political interference. You can find information about National Statistics on the internet at www.statistics.gov.uk.
Published 8th December 2016
Crops Grown For Bioenergy in England and the UK: 2015
About this release
This release contains information on the area of non-food crops grown in the UK including:
Areas of oilseed rape, sugar beet and wheat used for producing biofuels and
maize for use in anaerobic digestion.
Areas of miscanthus, short rotation coppice and straw crops grown as plant biomass.
Key Messages
93 thousand hectares of agricultural land was used for bioenergy in the UK in
2015.
The area of crops grown for bioenergy equated to just under 2% of all arable land
in the UK in 2015.
53% of land used for bioenergy in 2015 was for biofuel for the UK road transport
market.
1 million tonnes of UK crops were produced for the UK road transport market
Figures relating to biofuel used for road transport in 2015/16 (year runs mid-April to mid-April) are
provisional based on data currently available. These shows that, of the total volume of renewable fuel
supplied in 2015/16, 99% (1,546 million litres) has so far been demonstrated to meet the sustainability
requirements (see Annex B for more details).
A dataset covering longer time series for selected data tables has been published alongside this
statistics release and is available here.
The next update to this statistical release is anticipated in Autumn 2017 and will be published here.
Revisions
Section 1: volumes of biofuels supplied to the UK road transport market in 2014/15 have been revised
to reflect the final estimates. There have been no other revisions to previously published estimates.

2
Contents
Use of the statistics .............................................................................................................................. 3
Data sources ........................................................................................................................................ 3
Overview of agricultural area used for bioenergy crops ........................................................................ 5
1. Biofuels ....................................................................................................................................... 6
1.1 UK grown crops used for production of biofuels for supply to the UK road transport market ....... 6
1.2 Implied crop areas based on supply of biofuel to the road transport market ................................ 7
1.3 Biofuels from crops supplied to the UK for the road transport market 2015/16 ............................ 9
1.4 Comparison of biofuels to all fuels used for road transport ........................................................ 12
1.5 Renewable Energy STATistics (RESTATS) Questionnaire ....................................................... 14
2. Plant biomass: miscanthus and Short Rotation Coppice ........................................................... 16
2.1 Miscanthus areas ...................................................................................................................... 16
2.2 Miscanthus yields / production .................................................................................................. 17
2.3 Miscanthus usage ..................................................................................................................... 18
2.4 Short Rotation Coppice (SRC) - willow or poplar areas ............................................................. 19
2.5 Short Rotation Coppice yields/production .................................................................................. 20
2.6 Short Rotation Coppice usage................................................................................................... 21
2.7 Volumes of biomass used in the UK for energy ......................................................................... 22
3. Plant biomass: straw ................................................................................................................. 23
3.1 UK Straw availability and usage ................................................................................................ 23
3.2 Power station usage of straw ................................................................................................... 25
4. Anaerobic digestion .................................................................................................................. 27
4.1 Types of crops used as feedstocks ........................................................................................... 27
4.2 Use of purpose grown crops as feedstocks for AD .................................................................... 28
Annex A: Glossary of terms and conversion factors ........................................................................... 29
Annex B: Background information on key data sources ..................................................................... 30
B.1 Renewable Transport Fuels Obligation (RTFO) ........................................................................ 30
B.2 Renewable Energy STATistics (RESTATS) Questionnaire ....................................................... 31
B3. Cereal and Oilseed Rape Production Survey ............................................................................ 32
B4. Energy crops scheme ............................................................................................................... 32
B5. Ofgem Renewable Obligation Annual Report - Biomass Sustainability Dataset ........................ 32
B6. WRAP Organics Recycling Survey 2012 ................................................................................... 33
B7. WRAP Survey of the UK anaerobic Digestion industry in 2013 ................................................. 33
Annex C: Background information on crops used for bioenergy ........................................................ 34
C1. Sugar beet ................................................................................................................................ 34
3
Use of the statistics
Annual estimates of crop areas of oilseed rape, sugar beet, wheat, maize, miscanthus, short rotation
coppice and straw crops grown in the UK for use as bioenergy are used by government policy
advisors, non-food crop promoters and processors.
Blended in small quantities with fossil fuels, bioethanol (used in petrol) and biodiesel (used in diesel)
can be used in today’s road vehicles. These biofuels play an important role in the UK plan to meet the
target set in the European Renewable Energy Directive 2009 (EU Directive 2009/28/EC
http://ec.europa.eu/energy/renewables/biofuels/biofuels_en.htm) for 10% of final energy consumption
in the transport sector to be supplied from renewable sources by 2020.
The Renewable Transport Fuels Obligation (RTFO) is one of the Government’s main policies for
reducing greenhouse gas emissions from road transport in the UK by encouraging the supply of
renewable fuels. Obligated suppliers must supply a certain percentage1 of their road transport fuel as
biofuel, or purchase Renewable Transport Fuel Certificates or pay in to the buy-out fund for the
shortfall. Further details can be found at: https://www.gov.uk/renewable-transport-fuels-obligation
The use of biofuels also supports other Government objectives to improve security of energy supply
and rural development2.
Data sources
These statistics, which are from a range of sources, are a secondary analysis of data that have
already been published. Although much of the source data are published as National Statistics, there
are limitations to these statistics and these are described within each section.
This section gives details of the three main data sources, more detailed information on these and the
other sources used can be found in Annex B
The June Survey of Agriculture and Horticulture collects information from farmers on the area of
crops grown in the UK at the 1st June each year. In general farmers are not asked about their
intended end use for the crops. For crops such as oilseed rape, wheat and sugar beet, where
there are multiple end uses, reference has been made to other existing data sources on usage in
order to try and establish the crop production and area associated with crops grown for bioenergy
by applying appropriate conversion factors to the data collected on biofuel production. From 2014
the June Survey asked farmers to indicate the intended end use of their maize to help determine
the proportion intended for used as an anaerobic digestion feedstock.
1Rising from 2.5% in 2008/09 to 4.75% from 2013/14 onwards. From 15 April 2013, the end uses covered by the Renewable
Transport Fuels Obligation were amended to include non-road mobile machinery (including inland waterways vessels),
agriculture and forestry tractors and recreational craft when not at sea (known collectively as NRMM). To keep the supply of
biofuel broadly consistent the biofuel target level was changed from 5% to 4.75% based on data supplied by industry on the
volume of low sulphur gas oil used for NRMM end uses.
2 https://www.gov.uk/government/policies/maintaining-uk-energy-security--2 https://www.gov.uk/government/news/15m-
fund-for-rural-energy-projects-opens-to-applications

4
The latest June Survey UK results can be found at:
https://www.gov.uk/government/statistics/farming-statistics-provisional-crop-areas-and-livestock-
populations-at-june-2016-united-kingdom
Renewable Transport Fuels Obligation data (collected by the Department for Transport). This data
source provides information on the volume of biofuel supplied to the UK road transport market. It
includes a breakdown of information by fuel type (e.g. biodiesel, bioethanol) and by feedstock
used (e.g. oilseed rape, used cooking oil, sugar beet) and the country of origin of the feedstock.
By applying relevant conversion factors, it is possible to derive the equivalent UK crop tonnages
used (for oilseed rape, sugar beet and wheat) and UK crop areas.
Data are supplied by obligated companies supplying more than 450,000 litres of road transport
fuel in a given year (the reporting year runs mid-April to mid-April). These obligated companies
supply more than 95% of the biofuels in the UK market. The main limitation of the data is that it
does not include UK crops or biofuel produced from UK crops which may be exported and used
outside the UK or that goes to end uses other than road transport. Questions included in the
Renewable Energy STATistics (RESTATS) Questionnaire (see below) help give an indication of
the fuller picture.
Renewable Energy STATistics (RESTATS) Questionnaire (collected by the Department for
Business, Energy and Industrial Strategy). The purpose of this survey is to determine UK
production of biofuels. Since 2012, the survey has also asked questions on the type and origin of
feedstocks for the first time. This provides an indication of the volume of UK grown crops which
are processed into biofuels for use other than road transport and any that may be produced for
export. With the data reported under the RTFO (described above) it helps build a more complete
overall picture.

5
Overview of agricultural area used for bioenergy crops
Figure 1: Total area of crops grown for bioenergy, 2008 - 2015
(a) Data for maize only available from 2014.
93 thousand hectares of agricultural land was used for bioenergy crops in the UK in 2015
comprising: 41 of wheat, 34 of maize, 9 of sugar beet, 7 of miscanthus, 3 of short rotation coppice
and 0.3 of oilseed rape.
Arable land3 used for bioenergy crops in the UK fell by 23% in 2015 and accounted for 1.6% of the
total arable area.
Just over half (53%) the land used for bioenergy in 2015 was for biofuel (biodiesel and bioethanol)
crops for the UK road transport market.
In terms of area, 10% of sugar beet, 2% of wheat and less than 1% of oilseed rape was used for
biofuel production in the UK in 2015.
A detailed breakdown of all figures for 2008 to 2015 can be found in Table A of the crops for bioenergy
dataset.
3 Arable area is defined as the area of arable crops, uncropped arable land and temporary grassland.

6
1. Biofuels
1.1 UK grown crops used for production of biofuels for supply to the UK road transport market
Figure 2 summarises UK sourced biofuels reported under the Renewable Transport Fuels Obligation
(i.e. the biofuels used in the UK that are made from UK feedstocks). Crops and by-products have been
included to show differing proportions of feedstocks.
Figure 2: Volume of UK sourced biofuels supplied to the UK road transport market by crop type and waste / residue, 2015/16(a)(b)
0
20
40
60
80
100
120
140
160
Biomethane Off roaddiesel
Sources: Department for Transport RTFO data
Million litres / kilogrammes (c)
Biodiesel Bioethanol
Brown grease (d)
Oilseed rape
Tallow (by-product)
Used cookingoil (by-product)
Corn
Sugarbeet
Wheat
Other (e)
(a) 2015/16 figures are as of 3rd November 2016 and are subject to revision.
(b) Year relates to 15th April 2015 - 14th April 2016.
(c) Biodiesel, bioethanol and pure vegetable oil volumes are reported in litres and biogas volumes are reported in kilograms.
(d) Brown grease is fat and oil removed from grease traps and sewers.
(e) Other is food waste and soapstock acid oil contaminated with sulphur.
The total volume of UK sourced biofuels used in the UK in 2015/16 was 386.3 million litres, a
decrease of 22% compared to 2014/15.
The volume of UK sourced biodiesel and bioethanol for UK road transport both decreased by a
similar percentage in 2015/16; biodiesel fell by 22% to 188.3 million litres and bioethanol by 23%
to 195 million litres.
A detailed breakdown from 2008/09 can be found in Table B of the crops for bioenergy dataset.
7
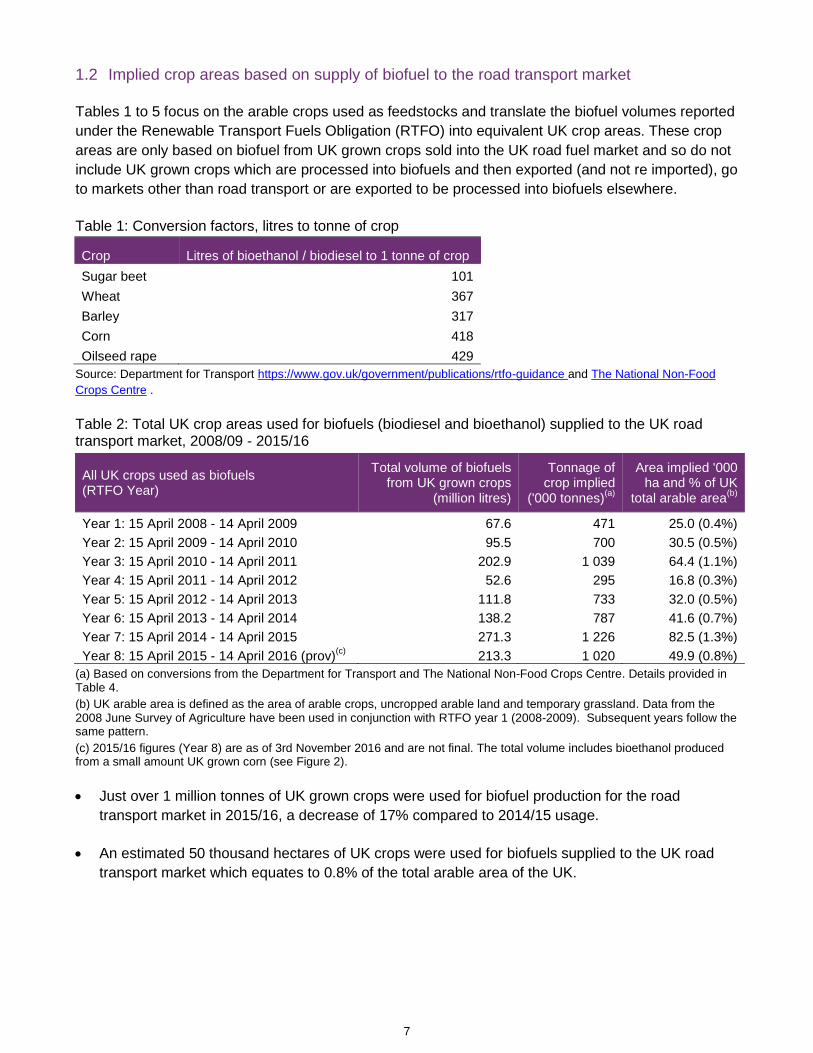
1.2 Implied crop areas based on supply of biofuel to the road transport market
Tables 1 to 5 focus on the arable crops used as feedstocks and translate the biofuel volumes reported
under the Renewable Transport Fuels Obligation (RTFO) into equivalent UK crop areas. These crop
areas are only based on biofuel from UK grown crops sold into the UK road fuel market and so do not
include UK grown crops which are processed into biofuels and then exported (and not re imported), go
to markets other than road transport or are exported to be processed into biofuels elsewhere.
Table 1: Conversion factors, litres to tonne of crop
Crop Litres of bioethanol / biodiesel to 1 tonne of crop
Sugar beet 101
Wheat 367
Barley 317
Corn 418
Oilseed rape 429
Source: Department for Transport https://www.gov.uk/government/publications/rtfo-guidance and The National Non-Food
Crops Centre .
Table 2: Total UK crop areas used for biofuels (biodiesel and bioethanol) supplied to the UK road transport market, 2008/09 - 2015/16
All UK crops used as biofuels (RTFO Year)
Total volume of biofuels from UK grown crops
(million litres)
Tonnage of crop implied
('000 tonnes)(a)
Area implied '000 ha and % of UK
total arable area(b)
Year 1: 15 April 2008 - 14 April 2009 67.6 471 25.0 (0.4%)
Year 2: 15 April 2009 - 14 April 2010 95.5 700 30.5 (0.5%)
Year 3: 15 April 2010 - 14 April 2011 202.9 1 039 64.4 (1.1%)
Year 4: 15 April 2011 - 14 April 2012 52.6 295 16.8 (0.3%)
Year 5: 15 April 2012 - 14 April 2013 111.8 733 32.0 (0.5%)
Year 6: 15 April 2013 - 14 April 2014 138.2 787 41.6 (0.7%)
Year 7: 15 April 2014 - 14 April 2015 271.3 1 226 82.5 (1.3%)
Year 8: 15 April 2015 - 14 April 2016 (prov)(c)
213.3 1 020 49.9 (0.8%)
(a) Based on conversions from the Department for Transport and The National Non-Food Crops Centre. Details provided in Table 4.
(b) UK arable area is defined as the area of arable crops, uncropped arable land and temporary grassland. Data from the 2008 June Survey of Agriculture have been used in conjunction with RTFO year 1 (2008-2009). Subsequent years follow the same pattern.
(c) 2015/16 figures (Year 8) are as of 3rd November 2016 and are not final. The total volume includes bioethanol produced from a small amount UK grown corn (see Figure 2).
Just over 1 million tonnes of UK grown crops were used for biofuel production for the road
transport market in 2015/16, a decrease of 17% compared to 2014/15 usage.
An estimated 50 thousand hectares of UK crops were used for biofuels supplied to the UK road
transport market which equates to 0.8% of the total arable area of the UK.
8
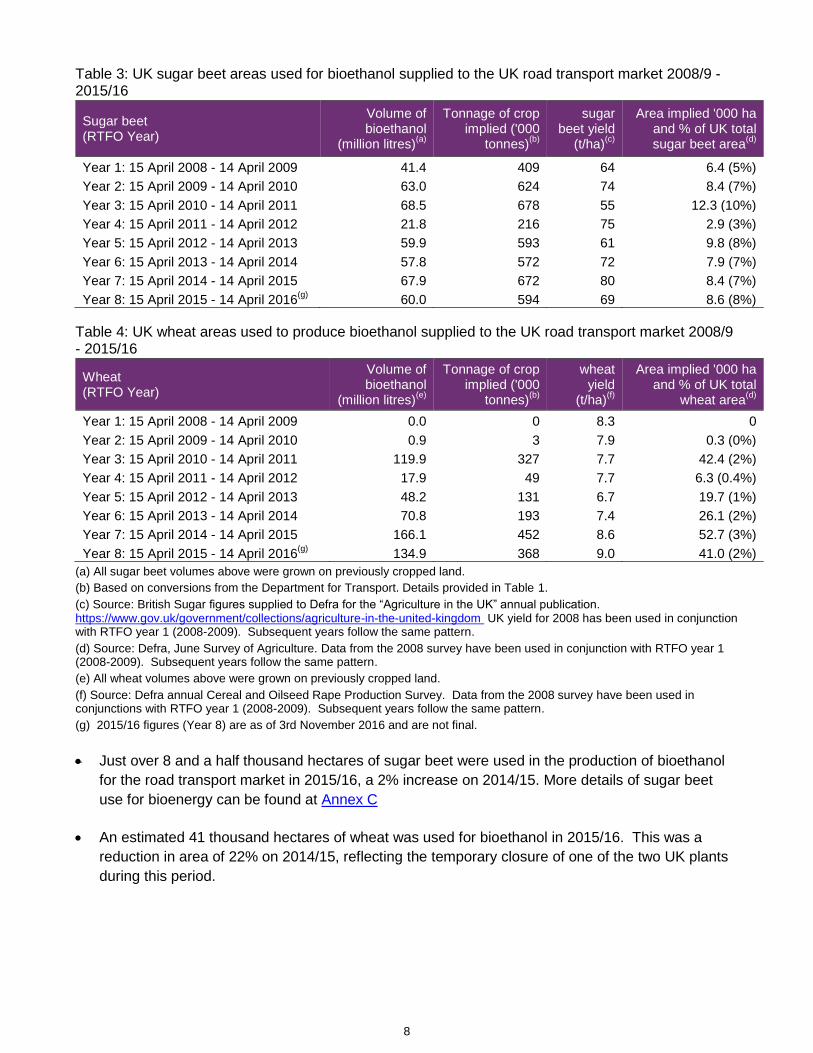
Table 3: UK sugar beet areas used for bioethanol supplied to the UK road transport market 2008/9 - 2015/16
Sugar beet (RTFO Year)
Volume of bioethanol
(million litres)(a)
Tonnage of crop implied ('000
tonnes)(b)
sugar beet yield
(t/ha)(c)
Area implied '000 ha and % of UK total sugar beet area
(d)
Year 1: 15 April 2008 - 14 April 2009 41.4 409 64 6.4 (5%)
Year 2: 15 April 2009 - 14 April 2010 63.0 624 74 8.4 (7%)
Year 3: 15 April 2010 - 14 April 2011 68.5 678 55 12.3 (10%)
Year 4: 15 April 2011 - 14 April 2012 21.8 216 75 2.9 (3%)
Year 5: 15 April 2012 - 14 April 2013 59.9 593 61 9.8 (8%)
Year 6: 15 April 2013 - 14 April 2014 57.8 572 72 7.9 (7%)
Year 7: 15 April 2014 - 14 April 2015 67.9 672 80 8.4 (7%)
Year 8: 15 April 2015 - 14 April 2016(g)
60.0 594 69 8.6 (8%)
Table 4: UK wheat areas used to produce bioethanol supplied to the UK road transport market 2008/9 - 2015/16
Wheat (RTFO Year)
Volume of bioethanol
(million litres)(e)
Tonnage of crop implied ('000
tonnes)(b)
wheat yield
(t/ha)(f)
Area implied '000 ha and % of UK total
wheat area(d)
Year 1: 15 April 2008 - 14 April 2009 0.0 0 8.3 0
Year 2: 15 April 2009 - 14 April 2010 0.9 3 7.9 0.3 (0%)
Year 3: 15 April 2010 - 14 April 2011 119.9 327 7.7 42.4 (2%)
Year 4: 15 April 2011 - 14 April 2012 17.9 49 7.7 6.3 (0.4%)
Year 5: 15 April 2012 - 14 April 2013 48.2 131 6.7 19.7 (1%)
Year 6: 15 April 2013 - 14 April 2014 70.8 193 7.4 26.1 (2%)
Year 7: 15 April 2014 - 14 April 2015 166.1 452 8.6 52.7 (3%)
Year 8: 15 April 2015 - 14 April 2016(g)
134.9 368 9.0 41.0 (2%)
(a) All sugar beet volumes above were grown on previously cropped land.
(b) Based on conversions from the Department for Transport. Details provided in Table 1.
(c) Source: British Sugar figures supplied to Defra for the “Agriculture in the UK” annual publication. https://www.gov.uk/government/collections/agriculture-in-the-united-kingdom UK yield for 2008 has been used in conjunction with RTFO year 1 (2008-2009). Subsequent years follow the same pattern.
(d) Source: Defra, June Survey of Agriculture. Data from the 2008 survey have been used in conjunction with RTFO year 1 (2008-2009). Subsequent years follow the same pattern.
(e) All wheat volumes above were grown on previously cropped land.
(f) Source: Defra annual Cereal and Oilseed Rape Production Survey. Data from the 2008 survey have been used in conjunctions with RTFO year 1 (2008-2009). Subsequent years follow the same pattern.
(g) 2015/16 figures (Year 8) are as of 3rd November 2016 and are not final.
Just over 8 and a half thousand hectares of sugar beet were used in the production of bioethanol
for the road transport market in 2015/16, a 2% increase on 2014/15. More details of sugar beet
use for bioenergy can be found at Annex C
An estimated 41 thousand hectares of wheat was used for bioethanol in 2015/16. This was a
reduction in area of 22% on 2014/15, reflecting the temporary closure of one of the two UK plants
during this period.

9
Table 5: UK oilseed rape areas used for biodiesel supplied to the UK road transport market, 2008/09 - 2015/16
Oilseed Rape (RTFO Year)
Volume of biodiesel (million litres)
Tonnage of crop implied
('000 tonnes)
(c)
OSR yield (t/ha)
(d)
Area implied
'000 ha and % of UK
total OSR area
(e)
UK grown
crop
of which: on
previously cropped
land (a)
of which: Voluntary scheme - met land criteria
(b)
Year 1: 15 April 2008 - 14 April 2009 26.3 14.5 61 3.3 18.6 (3%)
Year 2: 15 April 2009 - 14 April 2010 31.6 21.7 74 3.4 21.7 (4%)
Year 3: 15 April 2010 - 14 April 2011 14.5 5.1 34 3.5 9.7 (2%)
Year 4: 15 April 2011 - 14 April 2012 12.8 3.4 1.7 30 3.9 7.6 (1%)
Year 5: 15 April 2012 - 14 April 2013 3.7 1.0 2.7 9 3.4 2.6 (0.3%)
Year 6: 15 April 2013 - 14 April 2014 9.6 5.3 4.4 22 3.0 7.5 (1%)
Year 7: 15 April 2014 - 14 April 2015 19.3 12.7 6.6 45 3.6 12.5 (2%)
Year 8: 15 April 2015 - 16 April 2015(f)
0.5 0.0 0.5 1 3.9 0.3 (0.04%)
(a) Previously cropped land is the use of land prior to 1 Jan 2008.
(b) In some cases voluntary schemes recognised by the European Commission as demonstrating compliance with the land criteria do not pass information down the chain of custody on the previous land use of the biofuel, only that the land criteria were met. In these cases it is permitted to report ‘voluntary scheme - met land criteria’ as the land use would have been some type of crop land.
(c) Based on conversions from the Department for Transport. Details provided in Table 1.
(d) Source: Defra annual Cereal and Oilseed Rape Production Survey. Data from the 2008 survey have been used in conjunctions with RTFO year 1 (2008-2009). Subsequent years follow the same pattern.
(e) Source: Defra June Survey of Agriculture. Data from the 2008 survey have been used in conjunction with RTFO year 1 (2008-2009). Subsequent years follow the same pattern.
(f) 2015/16 figures (Year 8) are as of 3rd
November 2016 and are not final.
An estimated 282 hectares of oilseed rape was used for biodiesel in 2015/16. It is likely that this
was exported for processing and then re-imported for use as results from the Renewable Energy
STATistics (RESTATS) Questionnaire (see Section 1.5) suggest no oilseed rape was processed in
the UK in 2015.
This significant reduction on the 2014/15 area reflects a longer term shift in feedstock type with
increasing use of wastes and less crop biodiesel compared to the early years of the RTFO.
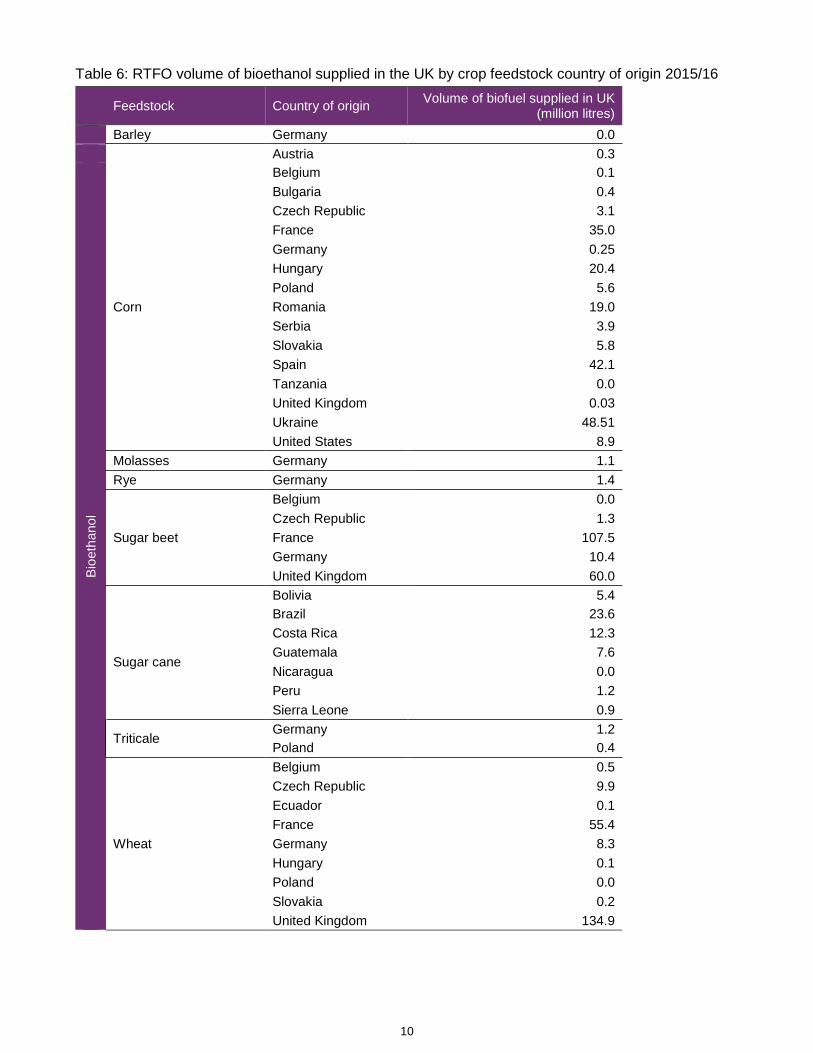
1.3 Biofuels from crops supplied to the UK for the road transport market 2015/16
In 2015/16, the majority of crop derived biofuels for road transport originated from crops grown
outside the UK. An estimated 30% originated from crops grown in the UK, this was little change
on the 2014/15 percentage. See Figure 1 for areas by type of crop.
10
Table 6: RTFO volume of bioethanol supplied in the UK by crop feedstock country of origin 2015/16
Feedstock Country of origin
Volume of biofuel supplied in UK (million litres)
Barley Germany 0.0
Austria 0.3
Bio
eth
ano
l
Corn
Belgium 0.1
Bulgaria 0.4
Czech Republic 3.1
France 35.0
Germany 0.25
Hungary 20.4
Poland 5.6
Romania 19.0
Serbia 3.9
Slovakia 5.8
Spain 42.1
Tanzania 0.0
United Kingdom 0.03
Ukraine 48.51
United States 8.9
Molasses Germany 1.1
Rye Germany 1.4
Sugar beet
Belgium 0.0
Czech Republic 1.3
France 107.5
Germany 10.4
United Kingdom 60.0
Bolivia 5.4
Sugar cane
Brazil 23.6
Costa Rica 12.3
Guatemala 7.6
Nicaragua 0.0
Peru 1.2
Sierra Leone 0.9
Triticale Germany 1.2
Poland 0.4
Wheat
Belgium 0.5
Czech Republic 9.9
Ecuador 0.1
France 55.4
Germany 8.3
Hungary 0.1
Poland 0.0
Slovakia 0.2
United Kingdom 134.9

11
Table 7: RTFO volume of biodiesel supplied in the UK by crop feedstock and country of origin 2015/16
Feedstock Country of origin
Volume of biofuel supplied in UK (million litres)
Bio
die
sel Oilseed rape
Australia 1.1
Belgium 0.1
France 0.1
Germany 3.4
Lithuania 0.0
Ukraine 0.5
United Kingdom 0.5
Palm Indonesia 0.02
Soy Argentina 0.1
Brazil 0.5
Total biodiesel and bioethanol 637.2
% from UK feedstocks 30%

12
1.4 Comparison of biofuels to all fuels used for road transport
Tables 8 and 9 compare the volume of biofuel used in UK road transport to the total of all fuels
supplied for road transport. They also show the proportion of biofuels that are UK sourced. The years
run mid-April to mid-April.
Table 8: RTFO Year 7 (2014/15) figures for biofuel from UK feedstocks
Million litres or kg(a)
UK sourced biofuels as a proportion of total biofuels
supplied to UK
Biofuels as a proportion of
total road transport fuels supplied to UK Fuel type
Volume UK
sourced biofuels 2014/15
Total volume biofuels
supplied to UK
2014/15(b)
Total volume of road transport
fossil fuels supplied to UK
2014/15
Biodiesel of which: 243 837 27 172 29% 3%
Brown grease(c)
2
Oilseed rape 19
Tallow (by-product) 62
Used cooking oil (by-product) 159
Other(d)
0.4
Bioethanol of which: 252 808 16 697 31% 5%
Barley 18
Corn 0.1
Sugar beet 68
Wheat 166
Biogas 2 2 100%
Biomethanol 0 22 0%
HVO (renewable portion) 0 0 0%
Off road diesel 1 2 100%
Total 498 1 671 49 211 30% 3.3%(e)
Annual target(f)
4.75%
(a) Biodiesel, bioethanol and pure vegetable oil volumes are reported in litres and biogas volumes are reported in kilograms.
(b) Includes volumes of biofuel from other feedstocks in addition to those listed here e.g. palm oil.
(c) Brown grease is fat and oil removed from grease traps and sewers.
(d) “Other” is food waste and soapstock acid oil contaminated with sulphur.
(e) The difference in the percentage shown and the annual target is due to some Renewable Transport Fuel Certificates (RTFCs) being issued to double counting feedstocks. Biofuels produced from wastes, non-agricultural residues, non-food cellulosic material, and ligno-cellulosic material receive two RTFCs per litre/kg meaning suppliers using these feedstocks only have to supply half the volume to meet their obligation.
(f) Rising from 2.5% in 2008/09 to 4.75% from 2013/14 onwards. From 15 April 2013, the end uses covered by the Renewable Transport Fuels Obligation were amended to include non-road mobile machinery (including inland waterways vessels), agriculture and forestry tractors and recreational craft when not at sea (known collectively as NRMM). To keep the supply of biofuel broadly consistent the biofuel target level was changed from 5% to 4.75% based on data supplied by industry on the volume of low sulphur gas oil used for NRMM end uses.
1,671 million litres of biofuel fuel were supplied to the UK in 2014/15. The obligation on biofuel
supplied for 2014/15 was 2,503 million litres. Obligated suppliers must supply a certain
percentage of their road transport fuel as biofuel, or purchase Renewable Transport Fuel
Certificates (RTFCs) or pay in to the buy-out fund for the shortfall4.
All suppliers met their obligations in full in 2014/15 through the redemption of RTFCs5.
4 Further details can be found at: https://www.gov.uk/renewable-transport-fuels-obligation
5 https://www.gov.uk/government/uploads/system/uploads/attachment_data/file/497775/rtfo-year-7-report-6.pdf
13
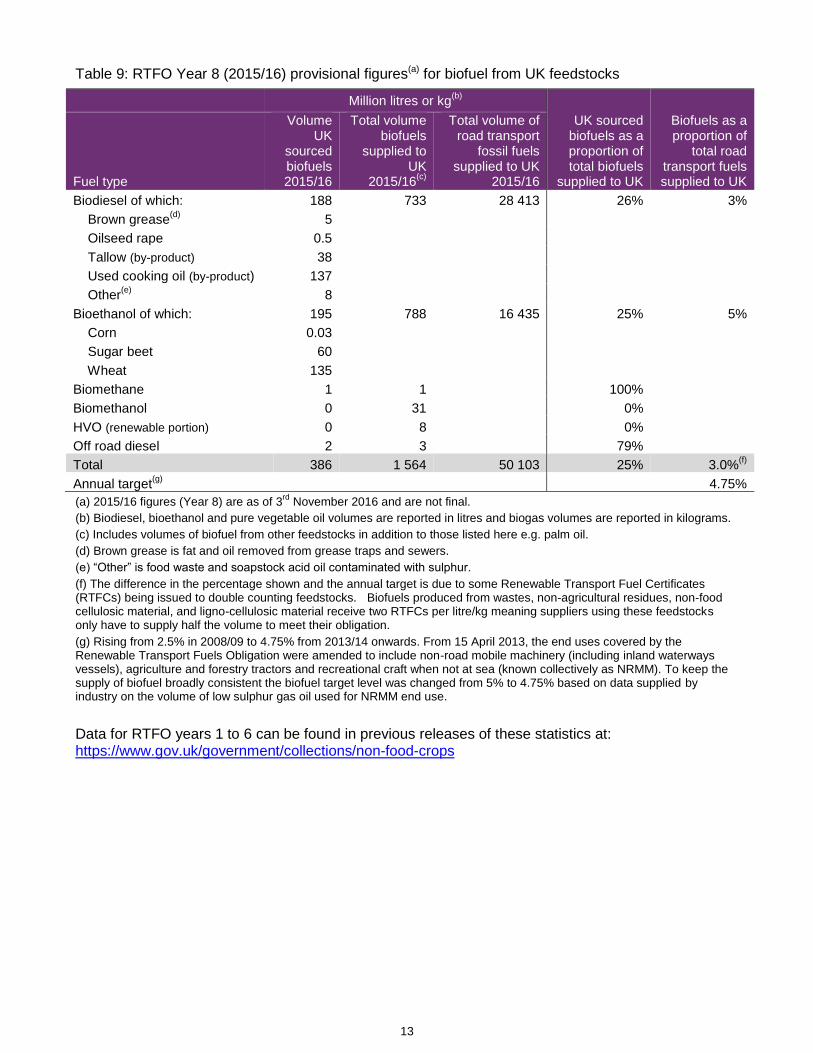
Table 9: RTFO Year 8 (2015/16) provisional figures(a) for biofuel from UK feedstocks
Million litres or kg(b)
UK sourced biofuels as a proportion of total biofuels
supplied to UK
Biofuels as a proportion of
total road transport fuels supplied to UK Fuel type
Volume UK
sourced biofuels 2015/16
Total volume biofuels
supplied to UK
2015/16(c)
Total volume of road transport
fossil fuels supplied to UK
2015/16
Biodiesel of which: 188 733 28 413 26% 3%
Brown grease(d)
5
Oilseed rape 0.5
Tallow (by-product) 38
Used cooking oil (by-product) 137
Other(e)
8
Bioethanol of which: 195 788 16 435 25% 5%
Corn 0.03
Sugar beet 60
Wheat 135
Biomethane 1 1 100%
Biomethanol 0 31 0%
HVO (renewable portion) 0 8 0%
Off road diesel 2 3 79%
Total 386 1 564 50 103 25% 3.0%(f)
Annual target(g)
4.75%
(a) 2015/16 figures (Year 8) are as of 3rd
November 2016 and are not final.
(b) Biodiesel, bioethanol and pure vegetable oil volumes are reported in litres and biogas volumes are reported in kilograms.
(c) Includes volumes of biofuel from other feedstocks in addition to those listed here e.g. palm oil.
(d) Brown grease is fat and oil removed from grease traps and sewers.
(e) “Other” is food waste and soapstock acid oil contaminated with sulphur.
(f) The difference in the percentage shown and the annual target is due to some Renewable Transport Fuel Certificates (RTFCs) being issued to double counting feedstocks. Biofuels produced from wastes, non-agricultural residues, non-food cellulosic material, and ligno-cellulosic material receive two RTFCs per litre/kg meaning suppliers using these feedstocks only have to supply half the volume to meet their obligation.
(g) Rising from 2.5% in 2008/09 to 4.75% from 2013/14 onwards. From 15 April 2013, the end uses covered by the Renewable Transport Fuels Obligation were amended to include non-road mobile machinery (including inland waterways vessels), agriculture and forestry tractors and recreational craft when not at sea (known collectively as NRMM). To keep the supply of biofuel broadly consistent the biofuel target level was changed from 5% to 4.75% based on data supplied by industry on the volume of low sulphur gas oil used for NRMM end use.
Data for RTFO years 1 to 6 can be found in previous releases of these statistics at: https://www.gov.uk/government/collections/non-food-crops

14
1.5 Renewable Energy STATistics (RESTATS) Questionnaire
The Department for Business, Energy and Industrial Strategy (BEIS, formally DECC) conduct an
annual survey of large scale biofuel production (see Annex B for more details). The survey aims to
determine total UK production of biofuels and, from 2012, included questions on the quantity and
origin of crops used in UK biofuel production.
Because the survey covers all biofuel production (including that subsequently exported and for
markets other than road transport) the data can help build a more complete picture of usage of UK
crops for biofuel. Table 10 compares total UK biofuel production to total biofuel supplied to the UK
road transport market while Tables 11 and 12 give an estimate of the proportion of UK biofuel
production from crop feedstocks and also the proportion of biofuel supplied by end use. The survey is
based on calendar years.
Table 10: UK biofuel production and biofuel supply to UK road transport market, 2010 - 2015
Million litres
2012 2013 2014 2015
Biodiesel
Total UK production 280 300 160 167
Total biodiesel supplied to UK road transport market 634 766 955 674
Bioethanol
Total UK production 154 524 516 333
Total bioethanol supplied to UK road transport market
775 820 812 797
Source: Renewable Energy Survey / Digest of UK Energy Statistics
UK production of biodiesel increased by 4% in 2015 while for bioethanol there was a decrease of
35% over the same period. Data from 2010 are available in Table C of the crops for bioenergy
dataset.
Table 11: Renewable Energy Survey UK biodiesel production and supply (from UK production), 2012 -
2015
Biodiesel
2012 2013 2014 2015
% of UK biodiesel production derived from crop feedstocks 5% 44% 0% 0%
% of those crop feedstocks that are UK produced 98% 100% 0% 0%
% of biodiesel supply to:
UK road transport 99% 96% 73% 74%
UK Non-Road Transport 0% 0% 1% 2%
UK Heat and Power 1% 1% 1% 2%
Exported(a)
na 3% 3% 22%
Other 0% 0% 22% 0%
(a) Proportion exported not included as a separate supply category in the 2012 survey.
15
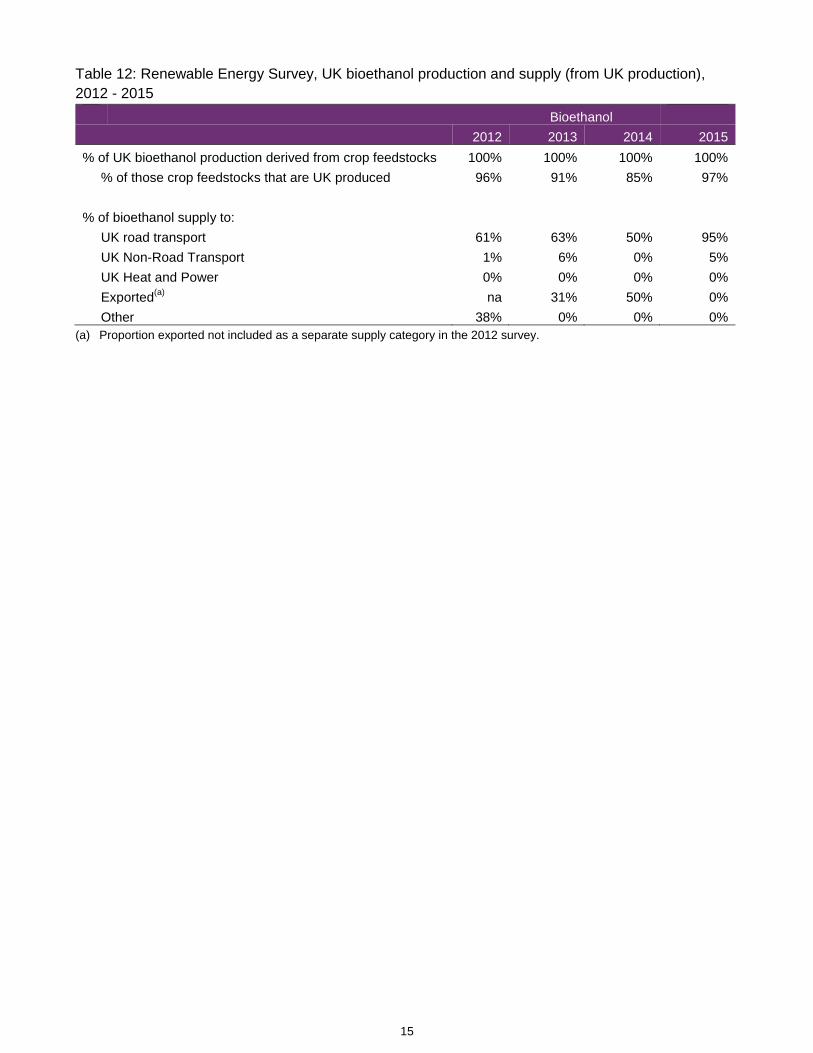
Table 12: Renewable Energy Survey, UK bioethanol production and supply (from UK production),
2012 - 2015
Bioethanol
2012 2013 2014 2015
% of UK bioethanol production derived from crop feedstocks 100% 100% 100% 100%
% of those crop feedstocks that are UK produced 96% 91% 85% 97%
% of bioethanol supply to:
UK road transport 61% 63% 50% 95%
UK Non-Road Transport 1% 6% 0% 5%
UK Heat and Power 0% 0% 0% 0%
Exported(a)
na 31% 50% 0%
Other 38% 0% 0% 0%
(a) Proportion exported not included as a separate supply category in the 2012 survey.
16
2. Plant biomass: miscanthus and Short Rotation Coppice
Miscanthus and Short Rotation Coppice (SRC) are grown as energy crops intended for the heat and
electricity energy markets. They are burnt in power stations, combined heat and power units or
heating systems.
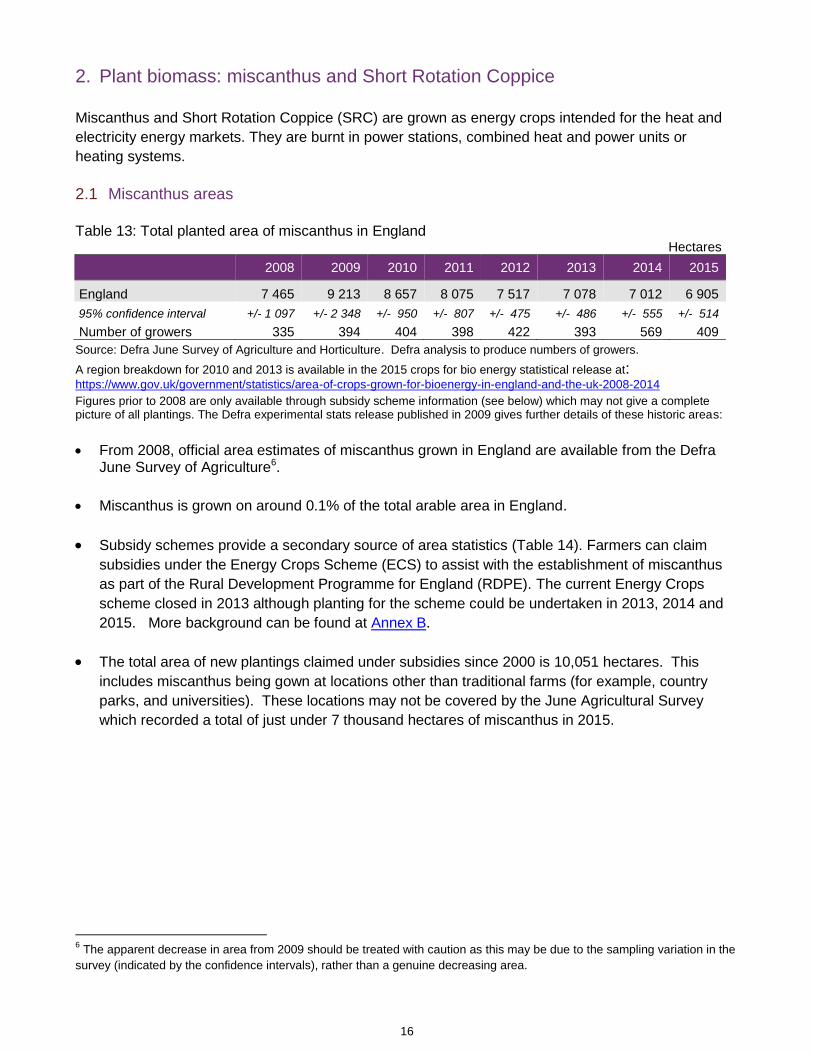
2.1 Miscanthus areas
Table 13: Total planted area of miscanthus in England
Hectares
2008 2009 2010 2011 2012 2013 2014 2015
England 7 465 9 213 8 657 8 075 7 517 7 078 7 012 6 905
95% confidence interval +/- 1 097 +/- 2 348 +/- 950 +/- 807 +/- 475 +/- 486 +/- 555 +/- 514
Number of growers 335 394 404 398 422 393 569 409
Source: Defra June Survey of Agriculture and Horticulture. Defra analysis to produce numbers of growers.
A region breakdown for 2010 and 2013 is available in the 2015 crops for bio energy statistical release at: https://www.gov.uk/government/statistics/area-of-crops-grown-for-bioenergy-in-england-and-the-uk-2008-2014
Figures prior to 2008 are only available through subsidy scheme information (see below) which may not give a complete picture of all plantings. The Defra experimental stats release published in 2009 gives further details of these historic areas:
From 2008, official area estimates of miscanthus grown in England are available from the Defra June Survey of Agriculture6.
Miscanthus is grown on around 0.1% of the total arable area in England.
Subsidy schemes provide a secondary source of area statistics (Table 14). Farmers can claim
subsidies under the Energy Crops Scheme (ECS) to assist with the establishment of miscanthus
as part of the Rural Development Programme for England (RDPE). The current Energy Crops
scheme closed in 2013 although planting for the scheme could be undertaken in 2013, 2014 and
2015. More background can be found at Annex B.
The total area of new plantings claimed under subsidies since 2000 is 10,051 hectares. This
includes miscanthus being gown at locations other than traditional farms (for example, country
parks, and universities). These locations may not be covered by the June Agricultural Survey
which recorded a total of just under 7 thousand hectares of miscanthus in 2015.
6 The apparent decrease in area from 2009 should be treated with caution as this may be due to the sampling variation in the
survey (indicated by the confidence intervals), rather than a genuine decreasing area.

17
Table 14: Area of Miscanthus new plantings under the Energy Crops Scheme: England Hectares
ECS2: 2008-2015 area(b)(c)
ECS2: 2008-2015 total area
(c)
Total area claimed
under ECS 2000
(a) - 2015
Region
2008 2009 2010 2011 2012 2013 2014 2015
North East 0 0 0 0 0 0 0 0 0 0
North West 0 0 0 14 14 61 35 0 124 187 Yorkshire & The Humber 32 43 83 132 102 98 49 39 578 2 421
East Midlands 45 100 91 119 242 174 23 56 850 2 740
West Midlands 24 90 81 180 376 306 8 8 1 072 1 931
East of England 0 0 34 83 67 71 41 15 296 677
South East 9 36 42 21 42 33 51 0 235 539
South West 22 211 114 40 21 25 53 20 506 1 542
England total 132 480 445 589 864 768 260 137 3 675 10 051
(a) ECS1: 2000-2006/7: Summary of area planted and establishment grant payments made for the duration of the scheme. Includes agreements accepted for 2007. Figures from the Natural England website: http://www.naturalengland.org.uk/ourwork/farming/funding/ecs/default.aspx.
(b) ECS2: 2008-2015: Additional area to that under ECS1. Summary of area under agreement. Figures supplied direct from Natural England and show the position at December 2015.
(c) Areas may be subject to change in future.
2.2 Miscanthus yields / production
Although much research has been done on miscanthus yields, as yet no official estimates of achieved
yields are available. Yields vary greatly depending on a number of factors such as planting method,
species, site conditions, as well as the standard variations of region, annual weather conditions. The
first year’s growth is not suitable to harvest; the crop reaches maturity at around 5 years and can
continue to be harvested for 15-20 years.
Table 15: Miscanthus production based on upper and lower yield estimates(a)
Thousand oven dried tonnes
2008 2009 2010 2011 2012 2013 2014 2015
Lower estimate 75 92 87 81 75 71 70 69
Upper estimate 112 138 130 121 113 106 105 104
Source: Yield information taken from National Non-Food Crops Centre (NNFCC) miscanthus fact sheet at: http://www.nnfcc.co.uk/publications/nnfcc-crop-factsheet-miscanthus and on direct conversations with growers and end users. (a) Estimates based on areas from the June Survey of Agriculture and Horticulture and yields of 10 to 15 oven dried tonnes
per hectare
Some industry experts estimate that current miscanthus yields average between 12-15 oven dried
tonnes (odt) per hectare (equating to 15-18 fresh tonnes per hectare) although other industry
bodies suggest a lower figure of 10 odt per hectare.
The estimated annual volume of miscanthus produced in England based on both the upper and
lower yield estimates from industry sources should be treated as broad estimates because of the
yield uncertainties and the assumption that the whole of the area planted is productive, which will
not be the case for recently planted crops.
18
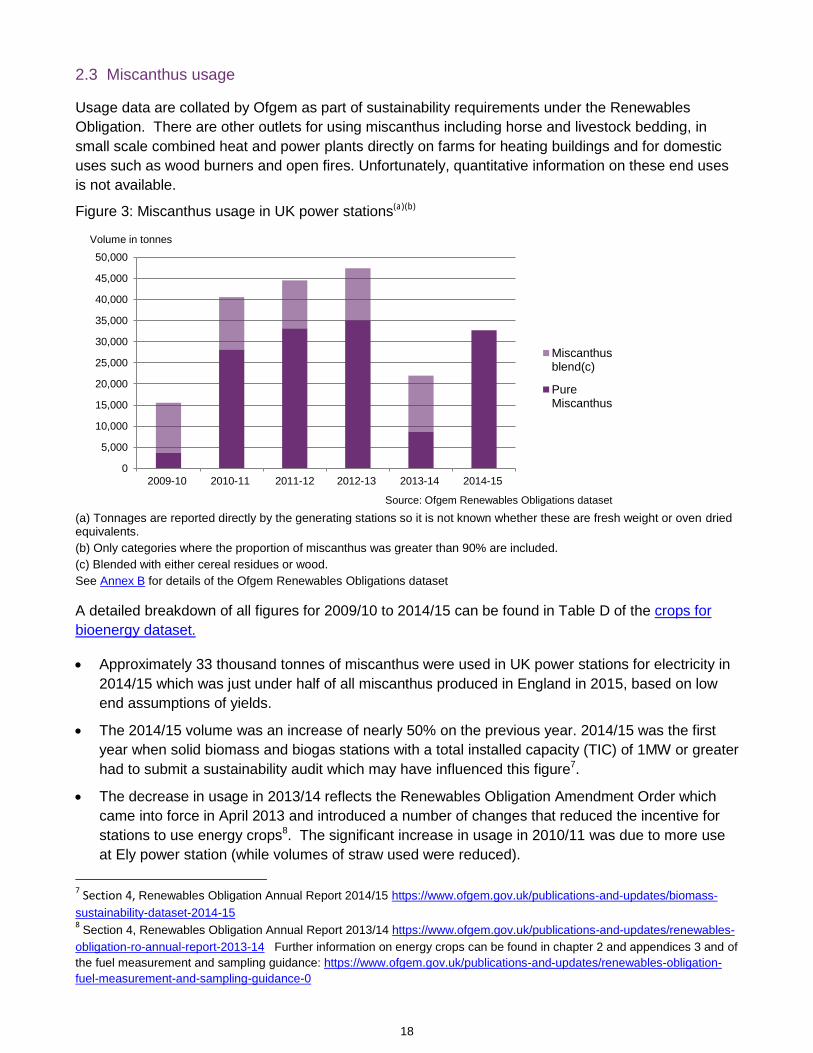
2.3 Miscanthus usage
Usage data are collated by Ofgem as part of sustainability requirements under the Renewables
Obligation. There are other outlets for using miscanthus including horse and livestock bedding, in
small scale combined heat and power plants directly on farms for heating buildings and for domestic
uses such as wood burners and open fires. Unfortunately, quantitative information on these end uses
is not available.
Figure 3: Miscanthus usage in UK power stations(a)(b)
0
5,000
10,000
15,000
20,000
25,000
30,000
35,000
40,000
45,000
50,000
2009-10 2010-11 2011-12 2012-13 2013-14 2014-15
Miscanthusblend(c)
PureMiscanthus
Volume in tonnes
Source: Ofgem Renewables Obligations dataset (a) Tonnages are reported directly by the generating stations so it is not known whether these are fresh weight or oven dried equivalents.
(b) Only categories where the proportion of miscanthus was greater than 90% are included.
(c) Blended with either cereal residues or wood.
See Annex B for details of the Ofgem Renewables Obligations dataset
A detailed breakdown of all figures for 2009/10 to 2014/15 can be found in Table D of the crops for
bioenergy dataset.
Approximately 33 thousand tonnes of miscanthus were used in UK power stations for electricity in
2014/15 which was just under half of all miscanthus produced in England in 2015, based on low
end assumptions of yields.
The 2014/15 volume was an increase of nearly 50% on the previous year. 2014/15 was the first
year when solid biomass and biogas stations with a total installed capacity (TIC) of 1MW or greater
had to submit a sustainability audit which may have influenced this figure7.
The decrease in usage in 2013/14 reflects the Renewables Obligation Amendment Order which
came into force in April 2013 and introduced a number of changes that reduced the incentive for
stations to use energy crops8. The significant increase in usage in 2010/11 was due to more use
at Ely power station (while volumes of straw used were reduced).
7 Section 4, Renewables Obligation Annual Report 2014/15 https://www.ofgem.gov.uk/publications-and-updates/biomass-
sustainability-dataset-2014-15 8 Section 4, Renewables Obligation Annual Report 2013/14 https://www.ofgem.gov.uk/publications-and-updates/renewables-
obligation-ro-annual-report-2013-14 Further information on energy crops can be found in chapter 2 and appendices 3 and of
the fuel measurement and sampling guidance: https://www.ofgem.gov.uk/publications-and-updates/renewables-obligation-
fuel-measurement-and-sampling-guidance-0

19
2.4 Short Rotation Coppice (SRC) - willow or poplar areas
Table 16: Total planted area of Short Rotation Coppice grown in England Hectares
2008 2009 2010 2011 2012 2013 2014 2015
England total 6 216 3 721 2 591 2 720 2 551 2 650 2 849 2885
95% confidence interval +/- 2 839 +/- 1 349 +/- 416 +/- 768 +/- 702 +/- 218 +/- 503 +/- 656
Number of growers 373 381 251 228 186 230 182 361
Source: Defra June Survey of Agriculture and Horticulture Defra analysis to produce regional figures and numbers of growers.
A region breakdown for 2010 and 2013 is available in the 2015 crops for bio energy statistical release at: https://www.gov.uk/government/statistics/area-of-crops-grown-for-bioenergy-in-england-and-the-uk-2008-2014
SRC (since 2009) represents less than 0.1% of the total arable area in England.
Since 2009, the picture has been relatively stable. It is suspected that the apparent large fall in
area between 2008 and 2009 is due to reduced data robustness in 2008, the first year of this data
collection.
A secondary source of area statistics is the Energy Crops Scheme (ECS) subsidy data (Table 17).
The current Energy Crops scheme closed in 2013 although planting for the scheme could be
undertaken in 2013, 2014 and 2015. More background can be found at Annex B.
Comparing the total area of new plantings claimed under subsidies since 2000 (2,489 hectares) to
the 2015 Defra June Survey area (2,885 hectares) suggests that the vast majority of SRC is grown
within the subsidy payment scheme.
Table 17: Area of SRC new plantings under the Energy Crops Scheme: England Hectares
ECS2: 2008-2015 area(a)(b)
ECS2: 2008 -2015 total
area(b)
Total area claimed under
ECS 2000-2015 (c)
English Region 2008 2009 2010 2011 2012 2013 2014 2015
North East 0 0 0 0 0 0 0 0 0 228
North West 0 0 0 0 0 22 25 0 47 172
Yorkshire & The Humber 11 3 29 61 33 2 1 0 140 604
East Midlands 49 91 91 34 42 3 3 5 318 927
West Midlands 0 0 0 0 0 0 26 0 26 52
East of England 0 14 6 21 30 11 0 0 82 158
South East 3 15 5 0 0 7 6 3 39 296
South West 3 5 2 0 0 0 8 4 22 52
England total 66 128 133 116 105 45 69 12 674 2 489
(a) ECS2: 2008-2015: Additional area to that under ECS1. Summary of area under agreement. Figures supplied direct from Natural England and show the position at December 2015.
(b) Areas may be subject to change in future.
(c) ECS1: 2000-2006/7: Summary of area planted and establishment grant payments made for the duration of the scheme. Includes agreements accepted for 2007. Figures from the Natural England website: http://www.naturalengland.org.uk/ourwork/farming/funding/ecs/default.aspx.
20
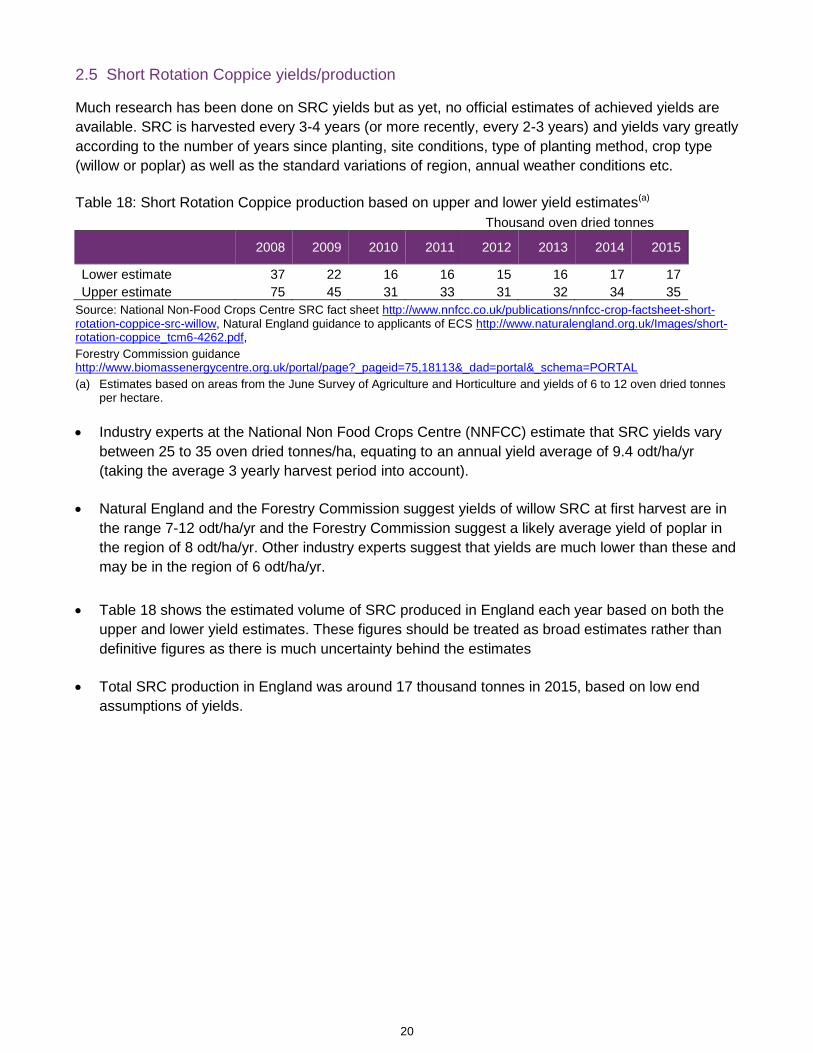
2.5 Short Rotation Coppice yields/production
Much research has been done on SRC yields but as yet, no official estimates of achieved yields are
available. SRC is harvested every 3-4 years (or more recently, every 2-3 years) and yields vary greatly
according to the number of years since planting, site conditions, type of planting method, crop type
(willow or poplar) as well as the standard variations of region, annual weather conditions etc.
Table 18: Short Rotation Coppice production based on upper and lower yield estimates(a)
Thousand oven dried tonnes
2008 2009 2010 2011 2012 2013 2014 2015
Lower estimate 37 22 16 16 15 16 17 17
Upper estimate 75 45 31 33 31 32 34 35
Source: National Non-Food Crops Centre SRC fact sheet http://www.nnfcc.co.uk/publications/nnfcc-crop-factsheet-short-rotation-coppice-src-willow, Natural England guidance to applicants of ECS http://www.naturalengland.org.uk/Images/short-rotation-coppice_tcm6-4262.pdf,
Forestry Commission guidance http://www.biomassenergycentre.org.uk/portal/page?_pageid=75,18113&_dad=portal&_schema=PORTAL
(a) Estimates based on areas from the June Survey of Agriculture and Horticulture and yields of 6 to 12 oven dried tonnes per hectare.
Industry experts at the National Non Food Crops Centre (NNFCC) estimate that SRC yields vary
between 25 to 35 oven dried tonnes/ha, equating to an annual yield average of 9.4 odt/ha/yr
(taking the average 3 yearly harvest period into account).
Natural England and the Forestry Commission suggest yields of willow SRC at first harvest are in
the range 7-12 odt/ha/yr and the Forestry Commission suggest a likely average yield of poplar in
the region of 8 odt/ha/yr. Other industry experts suggest that yields are much lower than these and
may be in the region of 6 odt/ha/yr.
Table 18 shows the estimated volume of SRC produced in England each year based on both the
upper and lower yield estimates. These figures should be treated as broad estimates rather than
definitive figures as there is much uncertainty behind the estimates
Total SRC production in England was around 17 thousand tonnes in 2015, based on low end
assumptions of yields.
21
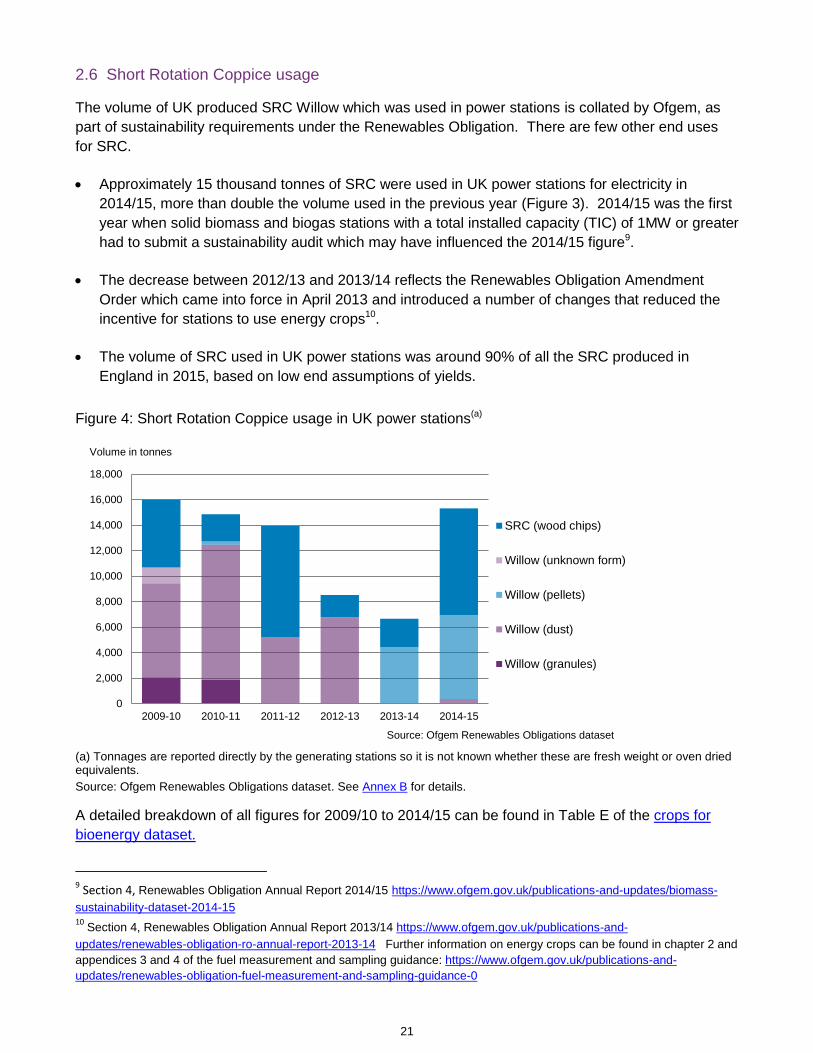
2.6 Short Rotation Coppice usage
The volume of UK produced SRC Willow which was used in power stations is collated by Ofgem, as
part of sustainability requirements under the Renewables Obligation. There are few other end uses
for SRC.
Approximately 15 thousand tonnes of SRC were used in UK power stations for electricity in
2014/15, more than double the volume used in the previous year (Figure 3). 2014/15 was the first
year when solid biomass and biogas stations with a total installed capacity (TIC) of 1MW or greater
had to submit a sustainability audit which may have influenced the 2014/15 figure9.
The decrease between 2012/13 and 2013/14 reflects the Renewables Obligation Amendment
Order which came into force in April 2013 and introduced a number of changes that reduced the
incentive for stations to use energy crops10.
The volume of SRC used in UK power stations was around 90% of all the SRC produced in
England in 2015, based on low end assumptions of yields.
Figure 4: Short Rotation Coppice usage in UK power stations(a)
0
2,000
4,000
6,000
8,000
10,000
12,000
14,000
16,000
18,000
2009-10 2010-11 2011-12 2012-13 2013-14 2014-15
SRC (wood chips)
Willow (unknown form)
Willow (pellets)
Willow (dust)
Willow (granules)
Volume in tonnes
Source: Ofgem Renewables Obligations dataset
(a) Tonnages are reported directly by the generating stations so it is not known whether these are fresh weight or oven dried equivalents.
Source: Ofgem Renewables Obligations dataset. See Annex B for details.
A detailed breakdown of all figures for 2009/10 to 2014/15 can be found in Table E of the crops for
bioenergy dataset.
9 Section 4, Renewables Obligation Annual Report 2014/15 https://www.ofgem.gov.uk/publications-and-updates/biomass-
sustainability-dataset-2014-15 10
Section 4, Renewables Obligation Annual Report 2013/14 https://www.ofgem.gov.uk/publications-and-
updates/renewables-obligation-ro-annual-report-2013-14 Further information on energy crops can be found in chapter 2 and
appendices 3 and 4 of the fuel measurement and sampling guidance: https://www.ofgem.gov.uk/publications-and-
updates/renewables-obligation-fuel-measurement-and-sampling-guidance-0

22
2.7 Volumes of biomass used in the UK for energy
Data from the Department for Business, Energy and Industrial Strategy (BEIS, formally DECC) in the
Digest of UK Energy Statistics, “DUKES”, publication show the volumes of plant biomass used in the
UK for energy (the figures represent the energy content of the fuel used). These figures cover all plant
biomass, not just miscanthus and SRC.
As plant biomass comprises a variety of materials, it is not possible to convert these DUKES values
from tonnes of oil equivalent to volumes in tonnes. Nevertheless, these data are useful for showing
trends in plant biomass usage over time.
Table 19: Trends in plant biomass used in the UK to generate heat and electricity: 2011 to 2015 Thousand tonnes of oil equivalent
2011 2012 2013 2014 2015
% change 2014/15
Total plant biomass used for heat /electricity 1 607 1 739 2 404 3 311 4 245 28
Of which:
Used to generate electricity 1 317 1 463 2 063 2 938 3 885 32
Co-firing with fossil fuels 764 401 54 25 38 50
Plant Biomass (a)
554 1 062 2 009 2 913 3 848 32
Used to generate heat (plant biomass only)(b)
290 277 346 379 359 -5
Percentage used for electricity 82% 84% 86% 89% 92%
Source: Table 6.6 from Chapter 6 of the DECC Digest of UK Energy Statistics (DUKES) 2016 https://www.gov.uk/government/statistics/renewable-sources-of-energy-chapter-6-digest-of-united-kingdom-energy-statistics-dukes
(a) Includes straw combustion and energy crops.
(b) Includes heat from straw, energy crops, paper and packaging.
For a time series from 2009 see Table F in the crops for bioenergy dataset.
Around 80-90% of plant biomass is used for generating electricity.
There was a 28% increase in the volume of plant biomass used to generate electricity in 2015,
reflecting continued conversions from previously coal-fired capacity to biomass, Figure 5.
Figure 5: Volume of plant biomass used for electricity: 2000 to 2015
0
500
1,000
1,500
2,000
2,500
3,000
3,500
4,000
4,500
2000 2002 2004 2006 2008 2010 2012 2014
Co-firing with fossil fuels Plant Biomass (a)
Tonnes of oil equivalent ('000)
Source: Digest of UK Energy Statistics (a) Includes straw combustion and energy crops

23
3. Plant biomass: straw
Straw is a by-product of the cereals industry. It is used for animal bedding, as animal feed and, to a
small extent, as an energy crop to be burnt for heating and electricity in power stations and combined
heat and power units.
3.1 UK Straw availability and usage
Table 20: Selected UK cereal areas at June each year Thousand hectares
2008 2009 2010 2011 2012 2013 2014 2015
Wheat 2 080 1 775 1 939 1 969 1 992 1 615 1 936 1 832
Barley 1 032 1 143 921 970 1 002 1 213 1 080 1 101
Oats 135 129 124 109 122 177 137 131
Total 3 247 3 047 2 984 3 048 3 116 3 004 3 153 3 064
Source: June Survey of Agriculture.
Table 21: UK estimates of cereal straw production based on survey areas and typical straw yields Thousand tonnes
2008 2009 2010 2011 2012 2013 2014 2015
Wheat 7 281 6 214 6 785 6 893 6 972 5 651 6 775 6 413
Barley 2 838 3 143 2 533 2 667 2 756 3 336 2 970 3 028
Oats 473 452 436 380 427 618 480 459
Total 10 591 9 809 9 754 9 940 10 154 9 604 10 225 9 900
Table 20 gives some broad estimates of production (yields can vary by up to 30% depending on
harvest conditions).
Cereal straw production is generally around 9 to 10 million tonnes per year with typical yields 3.5
tonnes/ha for wheat and oats and 2.75 tonnes/ha for barley. These yields are based on industry
information and qualitative expert opinion.
A longer time series for cereal areas and estimated yields can be found in the crops for bioenergy
dataset, Tables G and H.
Since 2014, Defra’s Cereal and Oilseed Production Survey, which covers England, has included
questions on straw yield. The results are shown in Table 22 and provide a useful comparison to the
UK level industry information in Table 23.

24
Table 22: Estimates of cereal straw production, England
2014 2015 2016
Area (thousand hectares) 866 724 751
Wheat Production (thousand tonnes) 3,527 3,021 3118
Yield (tonnes per hectare) 4.1 4.2 4.2
Area (thousand hectares) 532 585 566
Barley Production (thousand tonnes) 2,037 2,347 2115
Yield (tonnes per hectare) 3.8 4.0 3.7
Area (thousand hectares) 71 50 55
Oats Production (thousand tonnes) 270 196 240
Yield (tonnes per hectare) 3.8 3.9 4.4
Area (thousand hectares) 48 37
Oilseed rape Production (thousand tonnes) 119 115 106
Yield (tonnes per hectare) 2.5 3.1 2.7
Source: Defra Cereal & Oilseed Production Survey
Table 23: Estimates of cereal straw supply and demand in the UK, 2015
UK Supply/Demand Thousand
tonnes % of cereal straw
production Implied cereal area
('000 ha)(a)
Cereal straw availability(b)
10 400 3 064
Cereal straw usage:
Animal bedding(b)
5 800 56% 1 709
Animal feed(b)
2 000 19% 589
Mushroom industry(c)
40 0% 12
Carrots(d)
405 4% 119
Power stations(e)
404 4% 119
Surplus cereal straw resource available in the UK for other markets
1 751 17% 516
(a) Area of wheat, barley and oats. Implied areas are calculated as the % of cereal straw production multiplied by the 2015 cereal area.
(b) Tonnages sourced from AEA, 2010: AEA 2010 UK and Global Bioenergy Resource. Annex 1 report: details of analysis http://www.decc.gov.uk/assets/decc/What%20we%20do/UK%20energy%20supply/Energy%20mix/Renewable%20energy/policy/1465-aea-2010-uk-and-global-bioenergy-annex.pdf
(c) Tonnages sourced from CSL, 2008: National and regional supply/demand balance for agricultural straw in Great Britain http://www.nnfcc.co.uk/tools/national-and-regional-supply-demand-balance-for-agricultural-straw-in-great-britain via http://www.northwoods.org.uk/files/northwoods/StrawAvailabilityinGreatBritain.pdf
(d) Agriculture and Horticulture Development Board http://www.ahdb.org.uk/projects/straw.aspx
(e) Tonnages sourced from Ofgem: https://www.ofgem.gov.uk/publications-and-updates/biomass-sustainability-dataset-2014-15
It is estimated that around 10 million tonnes of cereal straw is produced in the UK each year.
Normally around 60% of the straw produced can be baled and used; the remaining stubble is
incorporated back into the soil. The two main uses of straw are livestock bedding and feed.
Around 404 thousand tonnes of straw (4% of total straw production) was used as fuel in biomass
power stations in England in 2014/15. The figures suggest a net surplus of straw availability in the
UK. However, as straw is bulky and costly to transport, much straw usage occurs close to the
source so there can be much greater regional variation in the supply/demand balance11.
11
Regional surpluses of straw occur in the largely arable Eastern regions of the UK. The Western, and typically livestock
regions need to bring in straw to meet local demand. More details of regional variation can be found in Section 3.2 at :
https://www.gov.uk/government/statistics/area-of-crops-grown-for-bioenergy-in-england-and-the-uk-2008-2012

25
Table 24: End use of cereal straw England, 2014 - 2016
% of straw production
End usage(a)
2014 2015 2016
Home use bedding / feed 40% 51% 37%
Home use biomass 0.3% 0.3% 1%
Home use for other purposes 1% 0.5% 1%
Sold / exchanged for feed / bedding 42% 36% 41%
Sold for biomass 5% 3% 5%
Sold for other purposes 11% 9% 15%
Source: Defra Cereal and Oilseed Production Survey
(a) End usage includes a small number of holdings with Rye straw tonnages
From 2014 Defra’s Cereal and Oilseed Production Survey has included questions on the end use
of straw. Table 24 shows the proportion of straw by end use. Whilst these figures cover England
only they broadly in line with the UK estimates in Table 23.
3.2 Power station usage of straw
Figure 6: Straw usage in UK power stations(a)
0
50000
100000
150000
200000
250000
300000
350000
400000
450000
2009-10 2010-11 2011-12 2012-13 2013-14 2014-15
Cereal straw
Pellets or dust
Volume in tonnes
Source: Ofgem Renewables Obligations dataset
(a) Tonnages are reported directly by the generating stations so it is not known whether these are fresh weight or oven dried equivalents.
For more details of the Ofgem Annual Sustainability dataset and report see Annex B.
Data collated by Ofgem as part of sustainability requirements in the Renewables Obligation
indicate that in 2014/15, 404 thousand tonnes where used by power stations (these were all in
England). This was almost double the usage in 2013/14 and was influenced by a number of
factors including: new power plants, conversion of previously coal-fired capacity to biomass and
the new requirement that solid biomass and biogas stations with a total installed capacity (TIC) of
1MW or greater had to submit a sustainability audit12
12
Section 4, Renewables Obligation Annual Report 2014/15 https://www.ofgem.gov.uk/publications-and-updates/biomass-
sustainability-dataset-2014-15

26
A detailed breakdown of all figures for 2009/10 to 2014/15 can be found in Table I of the crops for
bioenergy dataset.
There are proposals for further straw burning power stations in England which are either the
planning state or already have planning permission. Table 25 shows the approximate volumes of
straw that each intend to use (based on information supplied on the individual websites). All these
plants are located in the mainly arable Eastern counties.
Table 25: Potential straw usage for proposed biomass power stations
Power station name When operational (if known) Planned straw consumption
(thousand tonnes)
Brigg, East Yorkshire Operational 2016 240
Generation Park Norwich Operational 2017 150
Snetterton, Norfolk Operational 2017 250
Wetwang, Yorkshire Outline planning granted 2013 78
Total 718
Sources:
Brigg straw power station http://www.briggrep.co.uk/
Generation Park Norwich http://www.generationparknorwich.com/faqs.php
Snetterton biomass plant http://www.eco2uk.com/en/news_events/news_detail.asp?news_id=309
Wetwang: http://www.eastriding.gov.uk/padocs/AUGUST2011/68D93C0E3CB211DF98B4AC53E757C93D.pdf
27
4. Anaerobic digestion
Waste and purpose-grown crops can be used to produce bioenergy through the process of anaerobic
digestion. Anaerobic digestion (AD) is a natural process in which plant and animal materials are
converted into useful products by micro-organisms in the absence of air. The process releases a
methane rich gas which can be used to provide heat and power while the remaining material is rich in
nutrient and can be used as a fertiliser. The types of materials suitable for AD include food waste,
slurry and manure, crops and crop residues.
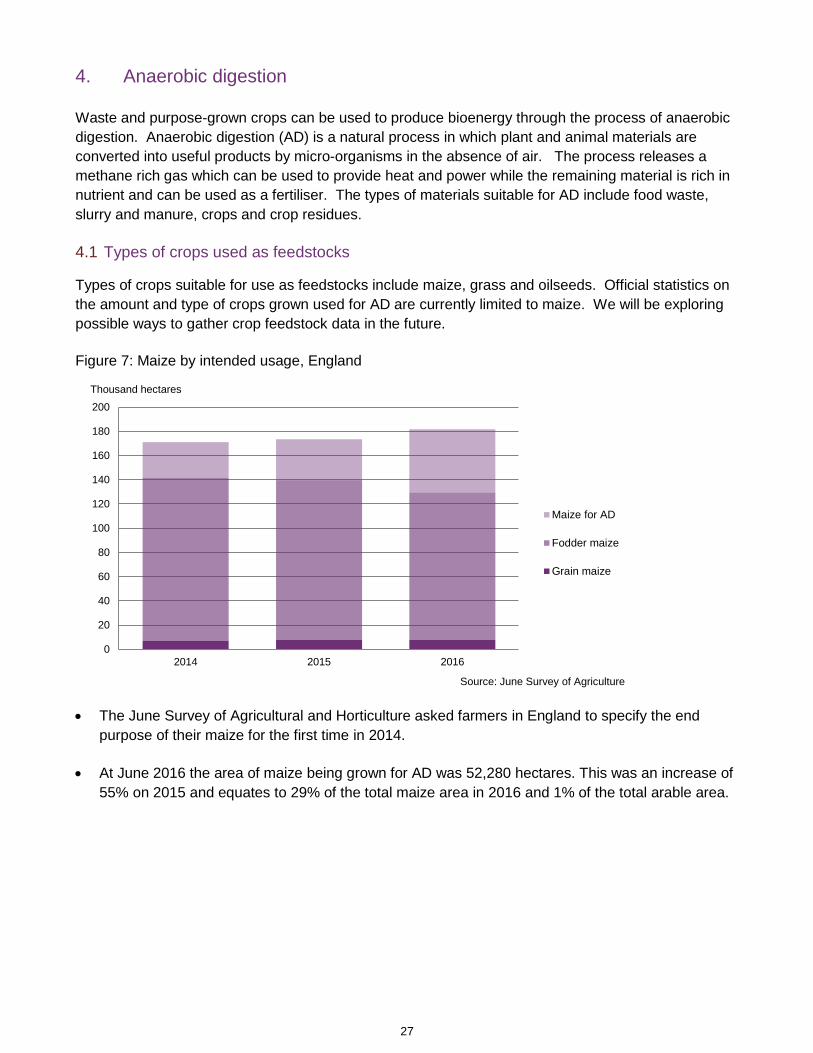
4.1 Types of crops used as feedstocks
Types of crops suitable for use as feedstocks include maize, grass and oilseeds. Official statistics on
the amount and type of crops grown used for AD are currently limited to maize. We will be exploring
possible ways to gather crop feedstock data in the future.
Figure 7: Maize by intended usage, England
0
20
40
60
80
100
120
140
160
180
200
2014 2015 2016
Maize for AD
Fodder maize
Grain maize
Thousand hectares
Source: June Survey of Agriculture
The June Survey of Agricultural and Horticulture asked farmers in England to specify the end
purpose of their maize for the first time in 2014.
At June 2016 the area of maize being grown for AD was 52,280 hectares. This was an increase of
55% on 2015 and equates to 29% of the total maize area in 2016 and 1% of the total arable area.

28
4.2 Use of purpose grown crops as feedstocks for AD Latest data available on crops grown crops for AD feedstocks are for 2013.
Figure 8: Reported tonnages of feedstock by type
0
100
200
300
400
500
600
700
800
900
Purpose grown(energy) crops
Other Manures Separatedsolid food
Liquids Mixed food &green material
2012
2013
Thousand tonnes
(Excludes feedstocks for industrial facilities that discharge treated water to sewer)
Source: WRAP A Survey of the UK Organics Recycling Industry in 2012, WRAP Survey of the UK anaerobic Digestion industry in 2013 (see Annex B for details)
Reported tonnages of purpose grown crops used as feedstock for AD increased by 50% between
2012 and 2013 to 300 thousand tonnes. This equates to 15% of all AD feedstock.
There is variation in the feedstocks used across different facility types with farm based sites mainly
using purpose grown crops and manures, commercial sites mainly separated food wastes and
liquids and industrial sites liquids.
In 2013, the grossed capacity estimate13 for on-farm AD sites was just over a million tonnes while
the grossed estimate for inputs to on-farm sites was 820 thousand tonnes, a 30% increase on
2012 estimated inputs.
13
Calculated by grossing up survey responses (to make allowance for sites which did not respond to the survey). These
figures are described as “grossed tonnages”. Other tonnages reported by the sample of sites responding to the survey are
“reported tonnages”.

29
Annex A: Glossary of terms and conversion factors
Definition of biodiesel and bioethanol (Source: Chapter 6, paragraph 6.125 and 6.126 of DUKES 2016)
In the UK biodiesel is defined for taxation purposes as diesel quality liquid fuel produced from biomass
or waste vegetable and animal oils and fats, the ester content of which is not less than 96.5 per cent
by weight and the sulphur content of which does not exceed 0.005 per cent by weight or is nil.
Bioethanol is defined for taxation purposes as a liquid fuel consisting of ethanol produced from
biomass and capable of being used for the same purposes as light oil. For further information, see
HMRC Notice179E: Biofuels and other fuel substitutes, October 2009, available at:
https://www.gov.uk/government/publications/excise-notice-179e-biofuels-and-other-fuel-substitutes/excise-notice-179e-biofuels-and-other-fuel-substitutes
Diesel fuel currently sold at retail outlets in the UK can contain up to 7 per cent biodiesel. Petrol
currently sold at retail outlets in the UK can contain up to 5% bioethanol. Since March 2013 a revised
petrol standard (EN228) allows retailers to sell petrol containing up to 10% ethanol by volume
(E10), if appropriately labelled14.
Conversions
Tonnes of oil equivalent to gigajoules
1 tonne of oil equivalent=41.868 gigajoules.
Source DUKES Chapter 1 (Energy) paragraph 1.29. https://www.gov.uk/government/statistics/energy-chapter-1-digest-of-united-kingdom-energy-statistics-dukes
Calorific values of fuels to convert gigajoules to tonnes are available at Annex A of DUKES, A.1 and A.2: https://www.gov.uk/government/uploads/system/uploads/attachment_data/file/541006/Annex_A_web.pdf Megajoules to litres
Bioethanol= 23.6 megajoules per litre,
Biodiesel= 34.4 megajoules per litre.
Source: Direct from DECC Energy Statistics team
Litres to tonnes 429 litres biodiesel = 1 tonne oilseed rape
101 litres bioethanol = 1 tonne sugar beet
367 litres bioethanol = 1 tonne wheat grain (at 15% moisture)
317 litres of bioethanol = 1 tonne of barley
418 litres of bioethanol = I tonne of corn
Source: Department for Transport https://www.gov.uk/government/publications/rtfo-guidance
and The National Non-Food Crops Centre
14
www.gov.uk/government/uploads/system/uploads/attachment_data/file/232126/petrol-protection-extention-ia.pdf

30
Annex B: Background information on key data sources
B.1 Renewable Transport Fuels Obligation (RTFO)
The Department for Transport (and the Renewable Fuels Agency pre-2011) produce statistics on the
volumes of biofuels supplied to the UK road market under the Renewable Transport Fuels Obligation
(RTFO). Published reports include information on the volumes of fuel supplied to the UK road market:
by fuel type (e.g. biodiesel, bioethanol);
by feedstock (e.g. oilseed rape, used cooking oil, sugar beet);
by country of origin (e.g. UK); and
whether it meets sustainability standards and the lifecycle greenhouse gas savings of fuels.
Therefore it is possible to derive information on the volumes of UK grown crops and equivalent crop
areas which have been used to supply biofuel to the UK road transport market.
Prior to December 2011 these data were supplied monthly to the RTFO Administrator by fuel suppliers
and were verified annually. Reports are released quarterly. Verified year 1 (April 2008 to March 2009),
verified year 2 (April 2009 to March 2010) are available and verified year 3 (April 2010 to March 2011)
data are all available on the Department for Transport website at: https://www.gov.uk/renewable-
transport-fuels-obligation.
Since the implementation of the Renewable Energy Directive15 in December 2011 data must be
verified prior to submission to the RTFO Administrator. The verified data for 2011/12 (Year 4) are
available at https://www.gov.uk/government/statistics/biofuel-statistics-year-5-2012-to-2013-report-6
for 2013/12 (Year 5) at https://www.gov.uk/government/statistics/biofuel-statistics-year-5-2012-to-
2013-report-6 for 2013/14 (Year 6) at https://www.gov.uk/government/statistics/biofuel-statistics-year-
6-2013-to-2014-report-6 and for 2013/15 (Year 7) at: https://www.gov.uk/government/statistics/biofuel-
statistics-year-7-2014-to-2015-report-6
The RTFO data include:
Biofuels from UK grown and imported crops (these are presented separately in the tables)
Biofuels supplied to the UK road transport sector
Data from organisations that supply more than 450,000 litres of road transport fuel in a given
year. These obligated companies supply more than 95% of the biofuels in the UK market.
Data from suppliers of less than 450,000 litres a year where they have chosen to apply for Renewable Transport Fuel Certificates.
The RTFO data exclude:
UK biofuel or biofuel feedstock production which may subsequently be exported.
15
This is a European Directive which sets out sustainability criteria which biofuels must meet in order to count towards
Member State’s targets. These criteria cover protection of land (carbon stocks and biodiversity) and set minimum
greenhouse gas savings that increase over time. http://eur-
lex.europa.eu/LexUriServ/LexUriServ.do?uri=Oj:L:2009:140:0016:0062:en:PDF

31
Producers of less than 450,000 litres of road transport fuel per year who do not claim
Renewable Transport Fuel Certificates (RTFCs). However it is not expected that there are
many small producers excluded from the RTFO statistics.
Prior to the implementation of the Renewable Energy Directive16 (RED) in December 2011,
biofuel producers who did not use any fossil fuels (i.e. only supplied biofuels) and did not claim
Renewable Transport Fuel Certificates were excluded. For the same reason as above, it is not
expected that there were many of these excluded from the RTFO statistics. Following the
implementation of the RED only biofuel producers who supply less than 450,000 litres are
excluded.
B.2 Renewable Energy STATistics (RESTATS) Questionnaire
From 2010, to estimate the volume of biofuels produced in the UK, an annual renewable energy
survey has been carried out by The Department for Business, Energy and Industrial Strategy (formally
The Department for Energy and Climate Change). Neither HMRC or RTFO figures can be used for
this purpose since they include both UK produced fuels and imports. The survey is carried out by
Ricardo Energy & Environment on behalf of BEIS. The production companies are contacted directly in
combination with a survey of UK biofuels production capacity that is required by the EU (Reg.
833/2010). The data include estimates for very small scale production (for personal use), though this
makes a very small contribution to the totals.
The reports include UK production of biodiesel and bioethanol, the proportion supplied to the UK road
market and the percent of biofuel from UK sources together with information on production capacity.
Results or 2010 can be found in DECC/Ricardo-AEA Ltd “RESTATS: UK Production of Biofuels for
transport in 2010 - Abstract” at:
https://restats.decc.gov.uk/cms/assets/Uploads/Results_2010/ABSTRACT-
UKBiofuelsProduction2010v2.pdf
For 2011 in DECC/Ricardo-AEA Ltd “RESTATS: UK Production of Biofuels for transport in 2011 -
Abstract” at: https://restats.decc.gov.uk/cms/assets/Uploads/Results_2011/ABSTRACT-UK-Biofuels-
Production-2011v1FINAL.pdf
For 2012 in DECC/Ricardo-AEA Ltd “RESTATS: UK Production of Biofuels for transport in 2012 -
Abstract” at: https://restats.decc.gov.uk/cms/assets/Uploads/Results_2012/ABSTRACTS-UK-Biofuels-
Production-2012-v1.pdf
Further details on the Liquid Biofuels survey are available on page 7 at:
http://www.decc.gov.uk/assets/decc/statistics/source/renewables/60-renewable-statistics-methodology.pdf Data from the renewable energy survey also feeds into the Digest of UK Energy Statistics (DUKES)
which is again produced by The Department for Business, Energy and Industrial Strategy. The digest
is a comprehensive source of energy information and can be found at:
https://www.gov.uk/government/collections/digest-of-uk-energy-statistics-dukes
16
This is a European Directive which sets out sustainability criteria which biofuels must meet in order to count towards
Member State’s targets. These criteria cover protection of land (carbon stocks and biodiversity) and set minimum
greenhouse gas savings that increase over time. http://eur-
lex.europa.eu/LexUriServ/LexUriServ.do?uri=Oj:L:2009:140:0016:0062:en:PDF
32
B3. Cereal and Oilseed Rape Production Survey
The Cereal and Oilseed Rape Production Survey gathers data on production tonnages and moisture
content for various cereal and oilseed crops. It also verifies data gathered from the June Survey of
Agriculture on planted areas for these crops. These data are then used to calculate average yield
estimates for each crop type. These were used in calculations of the areas of crops used for biofuel
production. In 2014 questions were on straw production and usage where introduced. The latest
results from the cereal and oilseed rape production survey can be found at:
https://www.gov.uk/government/statistics/farming-statistics-provisional-crop-areas-and-livestock-
populations-at-june-2016-united-kingdom
B4. Energy crops scheme
Farmers can claim subsidies under the Energy Crops Scheme (ECS) to assist with the establishment
of miscanthus and short rotation coppice as part of the Rural Development Programme for England
(RDPE). This scheme is administered by Natural England and comprises two rounds:
ECS1 (2000-2006/7) which paid a flat rate to help farmers establish new plantings of the crop.
ECS2 (2007-2013) which pays 50% of all costs incurred in establishing the crop.
The current Energy Crops scheme closed in 2013 although planting for the scheme could be
undertaken in 2013, 2014 and 2015. More details on the scheme are on the Natural England website
at: http://www.naturalengland.org.uk/ourwork/farming/funding/ecs/default.aspx.
The Energy Aid Payment Scheme (EAPS), also known as the Aid for Energy Crops Scheme was also
offered from 2005 until 2009 but was then subsumed into the Single Payment scheme. EAPS offered
farmers €45 per hectare, paid alongside the Single Farm Payment, for producing crops for energy
(heat, electricity or transport fuels). This scheme was administered by the Rural Payments Agency.
Farmers were able to claim under both EAPS and the ECS for the same crop and it is expected that
most claimants would have applied for both payments. The EAPS data is thus not considered in this
release as an additional area.
B5. Ofgem Renewable Obligation Annual Report - Biomass Sustainability Dataset
The concept of sustainability was introduced into the Renewables Obligation (RO) in April 2009 and
required operators to submit information on the sustainability of their fuels to Ofgem. The report
contains profiling information submitted by the operator regarding the sustainability characteristics of
their fuel such as: type of biomass, form of biomass, country of origin and whether it conforms to any
environmental quality assurance standards. Datasets for each year are available as follows:
http://www.ofgem.gov.uk/Pages/MoreInformation.aspx?docid=318&refer=Sustainability/Environment/RenewablObl/FuelledStations/ro-sustainability (2010/11 data)
http://www.ofgem.gov.uk/Pages/MoreInformation.aspx?docid=248&refer=Sustainability/Environment/RenewablObl/FuelledStations/ro-sustainability (2009/10 data)
https://www.ofgem.gov.uk/publications-and-updates/annual-sustainability-report-2011-2012 (2011/12 data)
https://www.ofgem.gov.uk/publications-and-updates/biomass-sustainability-dataset-2012-13 (2012/13 data)
https://www.ofgem.gov.uk/publications-and-updates/biomass-sustainability-dataset-2013-14 (2013/14 data)
https://www.ofgem.gov.uk/publications-and-updates/biomass-sustainability-dataset-2014-15 (2014/15 data)

33
B6. WRAP Organics Recycling Survey 2012
The WRAP Organics Recycling Survey 201217 aimed to quantify the processing of organic wastes in
the UK through a survey of key facilities including AD plants. For AD, a telephone survey achieved
results from 61 of the 87 sites operational during 2012 (based on information from the official AD
Information Portal Map18 but excluding AD facilities used for waste water treatment). Results were
raised to cover non-responding AD plants.
Previous reports have covered 2009 and 2010, but the 2012 AD results are not comparable with 2010
due to methodology changes and the small number of responses in that year. http://www.wrap.org.uk/sites/files/wrap/ASORI%202012.pdf
B7. WRAP Survey of the UK anaerobic Digestion industry in 2013
The purpose of the 2013 study19 was to quantify the processing of organic material via anaerobic
digestion (AD) in the UK using a survey of AD operators. A telephone survey between February and
April of 2014 (collecting data on the calendar year 2013) achieved a response rate of 75%. 88 sites
answered at least some of the survey questions, out of an operational population (during 2013) of 117
sites. This compares to a response rate of 70% (61 out of 87 operational sites) in the survey of 2012.
17
2012 WRAP Survey of UK Organics Recycling Industry: http://www.wrap.org.uk/sites/files/wrap/ASORI%202012.pdf 18
Available at: www.biogas-info.co.uk 19
http://www.wrap.org.uk/content/survey-uk-anaerobic-digestion-industry-2013

34
Annex C: Background information on crops used for bioenergy
C1. Sugar beet
Production of sugar from beet in the UK is governed by EU regulations, collectively known as the EU
sugar regime. In 2006 there was substantial reform of the EU sugar regime, aimed at reducing EU
sugar production to more sustainable levels. Key changes included reductions in beet sugar
production quotas and changes in the rules applying to any sugar made in excess of the quotas.
British Sugar are the sole quota holder in the UK and the reforms led to significant restructuring of
their business, with closure of the Allscott and York factories after the 2006/07 campaign and contract
tonnage re-allocated to growers closer to the remaining four factories. Furthermore, the UK’s first
bioethanol plant was constructed at the Wissington factory. Opening in November 2007, it provides an
outlet for sugar beet produced above the quota. From 2008/9 onwards the quota has been 1,056,474
tonnes of sugar (equivalent to around 6 million tonnes of sugar beet). This quota will apply until 30
September 2017 after which sugar production quotas will be abolished.
Sugar produced from excess beet would probably previously have been exported to the world market,
but these exports are no longer routinely permitted under the reformed regime. Sugar for biofuel,
chemical and pharmaceutical industries is excluded from quota.
Data reported under the RTFO have been used to estimate the equivalent tonnage and crop area of
sugar beet grown above the quota and diverted to produce bioethanol (Table 3).