Cropping for Reduced Climate Change: reducing emissions from nitrogen fertiliser - Daniel Kindred...
29
www.adas.co.uk Cropping for reduced climate change: reducing emissions from N fertiliser use Daniel Kindred, ADAS Boxworth [email protected] Farming Futures event 5 March 2010
-
Upload
farming-futures -
Category
Technology
-
view
383 -
download
0
Transcript of Cropping for Reduced Climate Change: reducing emissions from nitrogen fertiliser - Daniel Kindred...

www.adas.co.uk
Cropping for reduced climate change: reducing emissions
from N fertiliser useDaniel Kindred, ADAS Boxworth
Farming Futures event 5 March 2010

Agenda
The problem – N fertiliser
Possible solutions
Revising N management
Low N varieties / species
Designing N efficient systems
Conclusions

Simple N cycle
Deposition
soil organic matter
Offtake
SoilMineral N
MineralisationImmobilisation
Volatilisation
Denitrification
Nfertiliser
organicmanures
LeachingSoil N Supply = N available for crop uptake through the season, but notcoming from N fertiliser or manure in that season
Fixation

GHG costs for crop products
1 tonne wheat grain
Seed + Agchems
Diesel use
Drying
non-N fertilisers
N fertiliser manufacture
Soil N2O -fert N
Soil N2O - residues
Seed/ Ag chems
Diesel use
Grain drying Non-N
fertilisers
N fertiliser manufacture
Soil N2O emissions
from N fertiliser use
Soil N2O emissions from crop residues
LARGE UNCERTAINTIES
Tonne of Wheat Grain
Loaf of white Bread
Packaging
Transport
Processing
Waste
other wheat costs
N fertilisermanufactureSoil N2O
raw materials
Loaf of white bread
Other raw materials
Packaging
TransportProcessing
Other wheat costs?
? ?

The problem – N fertiliser
Energy intensive manufactureN2O emissions from nitric acid production
N2O from soilsAssumed to be linearly related to N fertiliser applications
… plus emissions from incorporating crop residues
Need ‘smart’ emission factors to reflect ‘true’ emissions from UK arable crops & different crop systems
Current work seeking to develop these

Minimising nitrous oxide emissions from arable crops - MIN-NO
MINNO aims: To improve estimates of N2O emissions
For UK GHG inventoryFor GHG accounting
MINNO activitiesN response experiments with N2O measurements in main arable cropsModelling soil N2O emissionsLife cycle analysis for key arable products
SA LINK LK09128; HGCA project 3474

N Fertiliser rates to minimise GHGs?
How much N should we apply if we want to minimise GHG emissions?

0
200
400
600
800
1000
1200
0 50 100 150 200 250 300 350 400
N fertliser applied (kg/ha)
GH
G e
mis
sion
s (k
g C
O2
e/t)
0
2
4
6
8
10
12
Yie
ld (t
/ha)
Operations Agrochemicals
Grain yield
N effects on GHG emissions
Farm Diesel useAg Chems & non-N fert
Grain yield
Kindred et al. (2008) Aspects of Applied Biology 88

0
200
400
600
800
1000
1200
0 50 100 150 200 250 300 350 400
N fertliser applied (kg/ha)
GH
G e
mis
sion
s (k
g C
O2
e/t)
0
2
4
6
8
10
12
Yie
ld (t
/ha)
N fertiliser emissions
Agrochemicals
Operations
Grain yield
N effects on GHG emissions
N fertiliser - manufacture
Grain yield
Farm Diesel useAg Chems & non-N fert
N fertiliser - manufacture
Kindred et al. (2008) Aspects of Applied Biology 88

0
200
400
600
800
1000
1200
0 50 100 150 200 250 300 350 400
N fertliser applied (kg/ha)
GH
G e
mis
sion
s (k
g C
O2
e/t)
0
2
4
6
8
10
12
Yie
ld (t
/ha)
Soil N20 emissions
N fertiliser emissions
Agrochemicals
Operations
Grain yield
Optimising N to minimise GHGs
Optima to minimise GHGs?
Grain yield
Farm Diesel useAg Chems & non-N fert
N fertiliser - manufacture
Soil N2O emissions
Kindred et al. (2008) Aspects of Applied Biology 88

But … N fertiliser Reduces land requirement
Deforestation
yield, t/ha
land required, ha/tonne
N applied, kg/ha0

…Reduces pressure on Land Use Change
Loss of habitats & biodiversityCarbon lost from soils and canopy
• 5900 Mt CO2eq per year • cf aviation of <3000 Mt per year
Grassland to crop – 5t CO2/haForest to crop – 29t CO2/ha
cf crop inputs GHG costs ~3t CO2e/ha

0
200
400
600
800
1000
1200
0 50 100 150 200 250 300 350 400
N fertliser applied (kg/ha)
GH
G e
mis
sion
s (k
g C
O2
e/t)
0
2
4
6
8
10
12
Yie
ld (t
/ha)
Land use changeSoil N20 emissionsN fertiliser emissionsAgrochemicalsOperationsGrain yield
Reducing N rates below economic optima may not give GHG reductions globally
Large uncertainties in ILUC calculations, depending on assumptions
– optima can be >300kg/ha
Kindred et al. (2008) Aspects of Applied Biology 88
Grain yield
Farm Diesel useAg Chems & non-N fert
N fertiliser - manufacture
Soil N2O emissionsIndirect emissions via LUC

Need to achieve economically optimal N rates
Plan your N useAccount for N in soils and manure applicationsAvoid applying more than the optima
It isn’t economic!
Monitor success of N managementGrain N% is key measure www.planet4farmers.co.uk
www.nutrientmanagement.orgwww.hgca.com

Optimising economic N applications- Errors in N use are inevitable
Error in N Predictiondifference from optimum N, kg/ha
Data from HGCA Project 3084: modern varieties, 2005-7
Net loss from
optimum profit target
zone
little economic loss
Best predictions from The Fertiliser Manual
using SMN
Important to ensure
accuracy on average
and avoid big mistakes
-£125
-£100
-£75
-£50
-£25
£0-200 -100 0 100 200

Calculating Fertiliser N requirement
Crop N DemandCrop N DemandCrop N Demand
LeachingLeaching
MineralisationImmobilisation
Soil N SupplySoil N SupplySoil N Supply
Grain yieldGrain protein%
Crop N Crop N RequirementRequirement
Fertiliser & Manure N

Account for N in soil – Soil N SupplyVariable with previous cropping, soil, & rainfallSMN sampling worthwhile where SNS large or uncertain
Manure historyGrass historyHigh soil organic matter
Also barometer fields as a check?HGCA Project 3084 – SNS Best Practice
Autumn sampling 0-60cm OKExcept shallow soils
or Spring sampling 0-90Get samples to lab quickly

Account for N in manures
Use MANNER or look-up tablesGives readily available N to the crop
Also calculates emissions
www.adas.co.uk/MANNER
www.planet4farmers.co.uk

Monitor Success
GrainYield(t/ha)
0
2
4
6
8
10
12
-300 -200 -100 0 100 200 300
N supply (kg/ha)
7
8
9
10
11
12
13optimum N supply
(N:grain prices, 5:1)
0
2
4
6
8
10
12
-300 -200 -100 0 100 200 300
N supply (kg/ha)
7
8
9
10
11
12
13
Margin (t/ha equiv.)
0
2
4
6
8
10
12
-300 -200 -100 0 100 200 300
N supply (kg/ha)
7
8
9
10
11
12
13
GrainProtein
(%)
from soil

Monitor & Review … vital for good management
N errors are inevitableThey are usually unseenSmall errors seldom matterBeware of big errorsErrors can accumulate
if not correctedexcept light or shallow soils
Checklist providedKey check is grain protein
ActionDouble-check any odd fieldsAdjust strategy gradually.

Improving N management by precision farming
New ‘Auto-N’ project

Effects of improved N management on GHG emissions
Improve accuracy of N decisionsLess lost yield from sub-optimal applicationsLess wasted fertiliser from super-optimal applications
But, fertiliser adjustments may be upward as well as downwardNot necessarily big GHG cuts?
Many farmers already doing best practice?
Need to impact those who are not

0.0
0.5
1.0
1.5
2.0
Late autumn/winter (IPCC1996)
Late autumn/winter (IPCC2006)
Spring
Tota
l N a
pplie
d lo
st a
s N
2O (%
)
Indirect soil emission - ammoniaIndirect soil emission - nitrateDirect soil emission
Timing N applications to reduce N2O emissions?
2
1
0
N2O
em
issi
ons
%N
app
lied
Aut
umn
App
licat
ion
Spr
ing
App
licat
ion
Cattle slurry, mean of 5 experiments on
grasslandApply slurry & manures in spring if possible
Avoid N fertiliser applications to warm & wet soils?
Apply little & often, more closely match crop demand ???
More evidence needed before making changes to fertiliser N timing

Choose N products to reduce GHGs?
Manufacturing GHG emissions lower in urea than ammonium nitrate
~3 vs ~7kg CO2e /kg N (but uncertain??)Due to N2O from Nitric acid manufacture
Abatement technologies in many EU plantsGHG costs of AN may be close to urea
BUT, greater ammonia emissions from ureaGives indirect N2O emissionsHigher N rates required for urea?
Little evidence for difference in soil N2O emissions between urea & AN in England
Nitrification inhibitors may reduce N2O emissionsYet to be proven for UK conditions in practice
New Defra project starting ADAS/ North Wyke Research

Use varieties with reduced N requirements?
LINK Projects finding varieties in wheat & OSR which may need less N fertiliser
Low protein grainCheaper to growYields maintained
Reduced pollution & GHGsNeed N testing regimes in NL/RL to get such varieties to market
GREEN grain
HGCA Project 2979SA LINK LK0959
ElsomsSeeds
GREEN oil
SA LINK LK0979

Triticale – high yields, low N requirement?
Look-see experiment in 2009 showed remarkable potential of triticale
Markets for animal feed & bioethanol
HGCA project 3617 testing wheat/triticale in 2010
Could replace much of the 2nd wheat area?
0
2
4
6
8
10
12
0 50 100 150 200 250
N applied (kg N/ha)
grai
n yi
eld
(t/ha
)
TriticaleOatsBarleyWheat
2nd wheat site, clay loam, Suffolk 2009

Consider low-N systemsRotations
Use of legumesBut N2O emissions still occur
Fallows, leys?Reduced productivity & profitability?
spring cropping?Reduced N applications
But reduced yields?Cover crops?
Intercrop with pulses or clover?
STAR project
Low-N Bread?
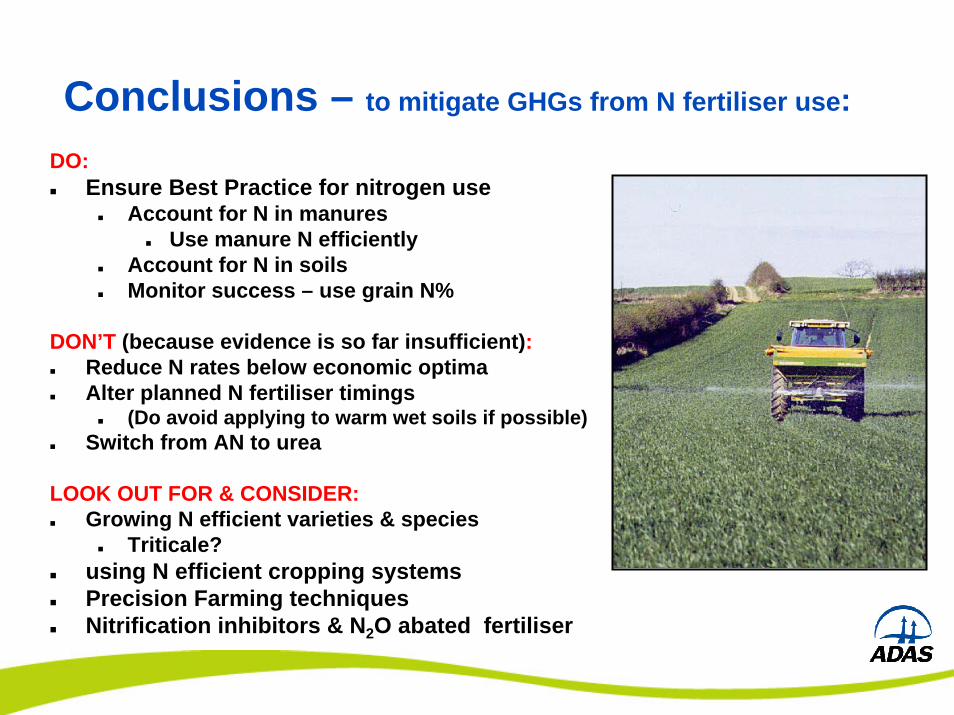
Conclusions – to mitigate GHGs from N fertiliser use:
DO:Ensure Best Practice for nitrogen use
Account for N in manuresUse manure N efficiently
Account for N in soilsMonitor success – use grain N%
DON’T (because evidence is so far insufficient):Reduce N rates below economic optimaAlter planned N fertiliser timings
(Do avoid applying to warm wet soils if possible)Switch from AN to urea
LOOK OUT FOR & CONSIDER:Growing N efficient varieties & species
Triticale?using N efficient cropping systemsPrecision Farming techniquesNitrification inhibitors & N2O abated fertiliser

Past Spatial Information(Soil AWC, OM, P & K, etc)
Past cropsYieldsGrain N%
Previous cropYield & N%N uptakeFert N applied
1.Judge N Demand
Expected yieldx 23 kg/t N
2.Judge N Supply
N balances fromprevious crop type &
sensing data
4. Schedule & Adjust
N applicationsManage canopy
5.Monitor Success
N use, Yield, Grain N%, Lodging.
3.Calculate Fert.N Requirement
(Demand – supply)Fertiliser recovery
Fertiliser recoveryFertiliser type
Field Information Soil type (texture & chalk)Weather
Previous cropVarietySowing date
Harvest mapping
Calculation & interpretation
Grain YieldGrain N%N offtakesN optima
N Management Cycle
Canopy SensingA. Over winter Monitor crop size &
thermal time N-unlimited growthTime of N limitationAdjust predicted SNS
B. 1st N ApplicationMonitor crop size,
tillering & thermal time
Use predicted SNS & benchmark GAI to set 1st N applicat’n
C. Main N Applicn.Monitor crop size &
greennessUse benchmark GAI
to set 2nd N applic’n
D. Final N Applicn.Monitor crop size &
greennessCalc N uptake &
remaining avail NRe-evaluate
realisable yield & N demand
Set 3rd N application.