Crop Situation Update
19
Crop Situation Update A joint assessment of 2012 winter crops with comprehensive data on 2011/12 crop production July 2012 FOOD AND AGRICULTURE ORGANIZATION (FAO) WORLD FOOD PROGRAMME (WFP) MINISTRY OF AGRICULTURE DEVELOPMENT (MoAD)
Transcript of Crop Situation Update

Crop Situation Update
A joint assessment of 2012 winter crops with comprehensive data on 2011/12 crop production
July 2012
FOOD AND AGRICULTURE ORGANIZATION (FAO)
WORLD FOOD PROGRAMME (WFP)
MINISTRY OF AGRICULTURE DEVELOPMENT (MoAD)
2
TABLE OF CONTENTS Background and Objectives .................................................................................................................................... 3
Methodology .......................................................................................................................................................... 3
Rainfall Situation ..................................................................................................................................................... 4
Global and Regional Overview of Crop Production ................................................................................................ 5
National Overview of Crop Production ................................................................................................................... 6
2012/13 Summer Crop Production Outlook ........................................................................................................... 7
Food Market Situation ............................................................................................................................................ 8
National Food Balance and Food Security Situation ............................................................................................... 8
Food Supply and Trade Situation .......................................................................................................................... 10
Conclusions ........................................................................................................................................................... 12
ANNEX 1: Crop situation in selected districts visited by the joint mission ........................................................... 13
ANNEX 2: TABLE 1 Cereal Crop Production Situation 2011/12 ............................................................................ 14
ANNEX 3: District-wise Cereal Crop Production and Edible Cereal Food Balance* in 2011/12 (in MT) ............... 15
ANNEX 4: Map 4-Edible Cereal Production and Food Balance Situation by Region/belt in 2011/12 ................... 17
ANNEX 5: Photographs ......................................................................................................................................... 18
Acknowledgement
The joint mission was undertaken jointly by the Ministry of Agriculture Development (MoAD), the World Food Programme (WFP) and the Food and Agriculture Organization (FAO). The mission team consisted of the following experts:
Mr. Vijoy Kumar Mallick, Mr. Hem Raj Regmi, Mr. Shiv Nandan Pd. Saha, Mr. Badri Khanal, Mr. Bishnu Prashad Ghimire, Mr. Kamal Acharya and Ms. Purna Laxmi Sulpya (from MoAD)
Ms. Mariko Kawabata, Dr. Sridhar Thapa, Mr. Pushpa Shrestha, Mr. Abesh KC, Ms. Sunita Raut, Mr. Man Kshetri, Mr. Chandan Deo, Mr. Binod Dev Bhatta, Mr. Laxmi Prashad Chaudhary, Mr. Dik Narayan Chaudhary, Mr. Ram Bahadur Lama, Mr. Kishor Bhandari, Mr. Ramesh Prasad Sah, Mr. Raju Chhetri, Mr. Parsu Ram Karki, Mr. Madan Karki, Mr. Birendra Kadayat, Mr. Ganesh Padhya, Ms. Gayatri Kumari Thapa, Mr. Narendra G C , Mr. Bharat Kumar Shrestha and Mr. Birendra Bahadur Shahi (from WFP).
Dr. Binod Saha, Mr. Shrawan Adhikary, Mr. Mandip Rai and Mr. Kamal Gautam (from FAO)
The field work was undertaken by the joint assessment team with staff from these three organizations as well as 30 WFP field monitors.

3
HIGHLIGHTS
Preliminary estimates of the 2011/12 winter crop production are at 1.85 million MT and 0.35 million
MT for wheat and barley respectively, representing an increase of 5.7 percent and 14.9 percent
compared to last year.
The overall 2011/12 cereal crop production shows an increase of 9.8 percent to 9.46 million MT as
compared to 8.62 million MT last year. As a result, the country has a total of 886.3 thousand MT (17.2
percent of the requirement) edible cereal crop production surplus while last year the surplus was
443.1 thousand MT (9.0 percent of the requirement). Despite the overall good harvest, most of the
Far and the Mid-Western Hill and Mountain districts are reportedly deficit due to their relatively low
productive land with marginal increase in crop production.
An increase in the 2011/12 crop production is mainly attributed to the timely and adequate
precipitation across the country at the plantation and growing period, relatively timely availability of
seeds and fertilizers compared to previous years and agricultural productivity enhancing programmes
supported by both government and non-government organizations.
Outlook for the 2012/13 summer crops is so far normal. However, insufficient pre-monsoon rainfall
and one week monsoon delay than its normal date will likely affect the normal growth of maize and
seasonal vegetables in the hill and mountain belts, including the growth of paddy seedlings.
BACKGROUND AND OBJECTIVES Crop situation update is prepared by a joint mission of the Ministry of Agriculture Development (MoAD), the
World Food Programme (WFP) and the Food and Agriculture Organization (FAO). The update is issued twice a
year (for summer as well as winter crops) on a regular basis covering the whole country.
This crop situation update covers the 2011/12 winter crop production and the outlook of 2012 summer crops.
It also provides a comprehensive data of the 2011/12 crop production and the country’s 2011/12 national food
balance. The fieldwork took place in April 2012. The specific objectives of the joint crop mission were:
to assess and verify the 2011/12 winter crop (especially wheat and barley) production situation
and early outlook for summer crops;
to assess the annual national crop production and the national food balance situation; and
to identify constraints and opportunities in the agricultural sector based on the information
collected from the community interaction and observation.
METHODOLOGY Crop situation update employs a wide range of information consisting of national, district and field level data
of the 2011/12 crop production released by the Ministry of Agriculture Development, information collected
from the community interaction in selected districts during the field visit, and information generated by the
NeKSAP District Food Security Networks (DFSNs). Data on rainfall was received from the Department of
Hydrology and Meteorology.
The joint mission visited a total of 20 districts across the five development regions for the field verification. The
districts were purposively selected based on the following criteria: (i) districts that were reported an
unanticipated winter crop loss mainly caused by excess rainfalls with hailstones and storms during the growing
and ripening periods, coupled with other causes such as pest infestations and droughts; (ii) districts which

4
were not selected in the past for the joint crop mission; and (iii) districts with a good performance in
agriculture production and can be considered as a model for other districts. These districts include: Khotang,
Okhaldhunga and Solukhumbu in the Eastern region; Bara, Sindhuli, Kavre, Chitwan and Siraha1 in the Central
region; Gulmi, Lamjung, Nawalparasi and Rupendehi in the Western region; Humla, Jajarkot, Banke and
Surkhet in the Mid-Western region and Kanchanpur, Doti, Achham and Bajura in the Far-Western region.
Five teams were formed to conduct the field visit in the five Development Regions. Major tasks for the field
visit teams were:
to hold consultation meetings with respective DADOs and other district authorities using the standard
district checklist;
to interact with different stakeholders including Chief District Officers, Local Development Officers
and district offices of the Chamber of Commerce and Industries to discuss issues related to crop
production, coping, livelihood opportunities as well as food security; and
to interact with community members to verify the official estimates of crop production and to
understand their food security issues.
RAINFALL SITUATION Monsoon, a typical South Asian meteorological phenomenon which originates from the Bay of Bengal of the
Indian Ocean, entered Nepal on 13 June 2011, 3 days later than its normal date (10 June). Monsoon was active
until mid-October 2011 which helped to keep soil moisture for a longer period. The rainfall was favourable for
winter crops such as wheat, barley, pulses and fruits. Despite a relatively low precipitation in December 2011
and January 2012, rainfall in November and prolonged monsoon until mid-October 2011 helped to grow well
winter crops. Rainfall across the country together with snowfall in the mountain in February 2012 also
supported to grow and thereby increased winter crops. Figure 1 (a & b) presents the average monthly rainfall
distribution, intensity and the number of rainfall days from October to December in the past four years
(Source: Department of Hydrology and Meteorology). The rainfall was slightly declining from October to
December. Compared to previous years, the average monthly rainfall was relatively low in 2011, but the
number of rainfall days was relatively high in November 2011.
Figure 1(a): Average rainfall distribution and intensity in the years 2008-2011
Figure 1(b): Number of rainfall days of more than 1mm in the years 2008-2011
Source: Department of Hydrology and Meteorology
1 Siraha district belongs to the Eastern Development Region, but the district is visited by the team from the Central Development
Region. Therefore, this district has included in the Central Development Region team for the purpose of analysis.
Avera
ge r
ain
fall
(%)
Num
ber
of
rain
fall
days

5
Map 1 illustrates the average rainfall across the country from October to November 2011 and January to
March 2012, as reported by the NeKSAP District Food Security Network. There was normal/sufficient rainfall in
most parts of the country during October to November, while an insufficient (late/early) rainfall was reported
in the eastern hill and mountain belt during January to March 2012.
Map 1: Rainfall situation during October-November 2011 and January-March 2012
Source: NeKSAP, District Food Security Networks (DFSNs)
GLOBAL AND REGIONAL OVERVIEW OF CROP PRODUCTION According to the latest forecast of FAO published in March 2012
2, world cereal production is estimated to
increase by 4.0 percent to 2,343.8 million tonnes compared to last year, in which the production is expected to
rise by 2.4 percent in Developing countries and by 6.3 percent in Developed countries. Outlook for global 2012
wheat production is favourable. However, the 2012 forecast stands at 690 million tonnes, representing a
reduction of 1.4 percent compared to 2011, but this figure is still well above the average of the past five years.
The reduction of 2012 global wheat production is mainly caused by the estimated reduction in major wheat
producing countries such as Australia, Ukraine, Kazakhstan, Turkey, and Russian Federation in the world.
Compared to a 4.0 percent increase in the world cereal production, the total cereal utilization is forecasted to
increase by 2.1 percent to 2,319 million tonnes, around 10 million tonnes more than the earlier forecast.
World cereal utilization is projected to increase more in developing countries (2.7 percent) compared to
developed countries (1.2 percent).
Outlook for the 2012 wheat crop is mostly favourable in the main wheat producing countries in Asia. The
forecast of wheat production in India and Pakistan is anticipated to set a record high production, owing to
adequate supplies of water and increase in the use of inputs to boost yields. In India, the preliminary estimates
of wheat production show a record high production of 90.2 million tonnes (Government of India). This record
high wheat production in India will contribute to improving the food security situation in South Asia, including
Nepal. This will also help to stabilize the wheat prices, contributing to secure the food access particularly
among the poor and lower income population in the region.
2 Crop Prospect and Food Situation, Vol.1 March 2012, FAO 2012

6
NATIONAL OVERVIEW OF CROP PRODUCTION The overall situation of winter crops such as wheat and barley shows generally good across the country. The
production of wheat, which is the major winter crop in terms of total quantity produced, has increased by 5.7
percent to 1.84 million MT, while the production of barley, the second most winter crop, has increased by 14.9
percent to 34.73 thousand MT this year compared to last year. Likewise, the production of buckwheat also
showed an increase of 13.4 percent to 10.02 thousand MT.
Wheat production was high in the Central region (601.9 thousand MT), followed by the Mid-Western (367.5
thousand MT) and the Western (358.5 thousand MT) regions, while the production of barley, another major
winter crop, is found to be high in the Mid-Western region (18.2 thousand MT), followed by the Far-Western
region (6.9 thousand MT). In addition, the Mid-Western region has seen the highest increase of wheat
cultivation area (8.4 percent) as well as production (23.4 percent), followed by the Central region (2.1 percent
and 7.1 percent respectively) compared to last year. It is also interesting to mention that the yield of winter
crops such as wheat and barley has increased almost all ecological belts and development regions with an
exception of barley in the Eastern region. The highest increase in wheat yield is found to be in the Mid-
Western region (13.1 percent), followed by the Eastern (7.8 percent) and the Central (4.9) regions. It is also
noteworthy that the mountain belt has the highest increase of wheat yield (7.4 percent), followed by hill belt
(6.4 percent) compared to last year. The increase in the winter crop yield could be an outcome of timely
rainfall as well as snow fall in the hill and mountain belts. See Annex-2, Table-1 for details.
The highest wheat producing districts are Rupendehi (106.75 thousand MT), Bara (92.80 thousand MT),
Dhanusha (90.36 thousand MT), Kapilbastu (89.81 thousand MT) and Parsa (82.60 thousand MT), while the
major barley producing districts are Jumla (7.58 thousand MT), Bajura (1.70 thousand MT), Mugu and Bajhang
(each 1.55 thousand MT), and Rukum (1.48 thousand MT). See Annex-3 for the 2011/12 cereal production by
district.
Map 2 presents the 2012 winter crop production situation of wheat and barley by VDC as reported by the
NeKSAP DFSNs. Wheat crop is cultivated across the country, while barley is mostly cultivated in the Far and
Mid-Western hill and mountain districts.
Map 2: 2012 winter crop productions by VDC
Source: NeKSAP District Food Security Networks (DFSNs)
The field report shows that the winter crop increase is mainly attributed to the timely rainfall from plantation
to germination period; prolonged monsoon until mid-October in 2011; relatively timely availability of fertilizers
and improved seeds; and the positive impact of various crop enhancing programmes such as Irrigation and
water resource management and community managed irrigated agriculture sector project.

7
It is noteworthy to mention that there was a bumper harvest of the 2011 summer crops, especially paddy
(refer to Crop Situation Update February 2012). The 2011/12 cereal crop production shows a total increase of
9.8 percent compared to last year. The increase in the total cereal crop production is not only attributed to the
area increase in cultivation (0.2 percent), but also to the increase of crop yield (9.6 percent) compared to last
year. In 2011/12, crop yield has increased by 17.3 percent, 13.0 percent and 11.1 percent for barley,
buckwheat and paddy respectively compared to last year.
Figure-2 presents the trend of cereal crop production since 1992/93. An upward trend is observed with a high
rate of increase for paddy since 2009/10. The fluctuation in paddy production could be attributed to the high
dependence on monsoon rains and the availability of improved seeds and fertilizers at the time of plantation
and germination period compared to other crops.
Figure 2: Production trend of crops in Nepal since 1992/93
Source: Agri-Business Promotion and Statistics Division (ABPSD), MoAD 2011/12
The overall production of meat, milk and cash crops is estimated to rise in 2011/12 compared to last year. This
is primarily attributed to a higher demand for these commodities due to a rising income of the population,
urbanization and changing preferences of the consumers. For example, the preliminary estimation of pulses,
fruits and vegetables production shows an increase of 2.8 percent, 6.5 percent and 6.2 percent respectively.
Likewise, the production of cash crops such as sugarcane, oilseed, potato etc. and spice crops such as
cardamom and ginger is estimated to increase by 6.1 percent and 7.6 percent compared to last year
respectively. Though ginger production has gone up, its price has drastically gone down, resulting in some
farmers leaving it in the field without harvesting.
2012/13 SUMMER CROP PRODUCTION OUTLOOK Outlook for the 2012 summer crops such as paddy, maize, millet, buckwheat and seasonal vegetables is so far
normal. However, the delay in the start of monsoon combined with insufficient pre-monsoon rainfall is
expected to affect adversely the growing maize and summer vegetables, particularly in the hill and mountain
belts where rain-fed agriculture is more common. The relatively weak monsoon combined with the shortage of
chemical fertilizers across the country will likely affect the plantation of major summer crops like paddy in
time, indicating a decline in the summer crop production compared to last year.

8
Some experts from the MoAD reported that the one week delay of monsoon has affected normal growth of
paddy seed plants, which may create the partial shortage of paddy seedlings, if it remains longer. However this
needs to be monitored timely.
FOOD MARKET SITUATION National average prices of major food commodities are presented in Figure 3, showing a normal range of
fluctuations over the past four years. Most prices have declined in May 2012 with few exceptions of red
potato and soyabean oil. For example, prices of coarse rice, wheat flour, black gram and broken lentil declined
by less than 5 percent as compared to the same period last year, while that of red potato and soybean oil
increased by more than 20 percent over the same period. The price reduction of these commodities is mainly
attributed to the good harvest of both summer and winter crops in 2011/12, combined with relatively
increased access of roads and trails in the hill and mountain markets, and better operation of transportation
services across the country.
Figure 3: Staple food prices December 2008/09/10/11
Source: ABPMDD, MoAD
Nepal Rastra Bank’s latest macroeconomic situation report also shows that the year-on-year inflation as
measured by consumer price index (CPI) remained relatively stable at 8.7 percent in May 2012 compared to
9.5 percent over the same period last year. The index of food and beverage increased by 7.1 percent
compared to an increase of 16.0 percent over the same period last year, whereas the price index of cereal
grains, as compared to 13.5 percent increase in the same period last year, declined by 1.9 percent in May
2012. The year-on-year wholesale price index increased by 8.0 percent compared to a rise of 10.7 percent over
the same period last year while the wholesale price index of agricultural commodities increased only by 5.5
percent compared to an increase of 11.8 percent over the same period last year.
NATIONAL FOOD BALANCE AND FOOD SECURITY SITUATION The increase of 9.8 percent in the 2011/12 cereal crop production has improved the country’s edible food
balance: the 2011/12 edible cereal production surplus is 17.2 percent of the requirement, with 886 thousand
MT, which is more than double compared to last year.

9
The trends of cereal crop production and food balance since 2003/04 are presented both in Table 2 and Figure
4, indicating a significant improvement in national food balance owing to an impressive increase of total cereal
crop production. As a result, the country has 17.2 percent edible food surplus more than the total requirement
for the FY 2011/12.
Table 2: The trends of national cereal crop production and food balance since 2003/04 (in ,000 MT)
Year 2003/04 2004/05 2005/06 2006/07 2007/08 2008/09 2009/10 2010/11 2011/12
Total production 7,360.4 7,747.1 7,767.5 7,656.5 7,329.0 8,069.1 8,114.1 8,615.4 9,457.6
Edible production 4,884.4 4,942.6 4,869.4 4,753.4 5,195.2 5,170.4 4,967.5 5,512.9 6,037.7
Requirement 4,671.3 4,779.7 4,891.0 4,941.1 5,172.8 5,303.3 5,297.43 5,069.8 5,151.4
Balance 213.1 162.9 -21.6 -187.7 22.4 -132.9 -329.9 443.1 886.3
Balance (in % of requirement)
4.6% 3.4% -0.4% -3.8% 0.4% -2.5% -6.2% 8.7% 17.2%
Source: Agri-Business Promotion and Statistics Division (ABPSD), MoAD
Figure 4: Trends of national edible cereal food production and balance since 2003/04
Despite the significant surplus at national level4, many districts (27 out of 75 districts) mainly in the hill and
mountain belts do not produce enough cereal crops for their domestic consumption, indicating the vulnerable
food security situation in these belts (see Map 3). The deficit districts are concentrated in the Far and the Mid
Western Hills and Mountains including: Bajhang, 17.67 thousand MT, 46.3 percent deficit against the
requirement; Bajura, 12.59 thousand MT, 47.5 percent deficit against the requirement; Kalikot, 10.99
thousand MT, 39.3 percent deficit against the requirement; and Humla, 7.75 thousand MT-77.5 percent of the
requirement (see Annex-4). At sub-regional level, Mid-Western Mountain has a total of 18.76 thousand MT
edible cereal production deficits (24.3 percent against the total requirement), while Far-Western hill and
mountain belts have a total deficit of 31.67 thousand MT (35.0 percent of the requirement) and 17.53
thousand MT (10.0 percent of the requirement) respectively. The central hill belt shows the highest deficit,
which is due to a large urban population including Kathmandu valley.
3 The requirements for the 2009/10 and 2010/11 are adjusted based on the 2011 population census. See “Amendment to the Crop
Situation Update June 2011”, MoAD/WFP/FAO, November 2011
4 Nepal has experienced cereal food production deficits in four of the past six years (since 2005/06) with the highest deficit of 330
thousand MT in 2009/10. Since then the balance has improved

10
Map 3: District-wise food self sufficiency situation in 2011/12
Food security situation across the country has improved overall as compared to last year5. The situation
deteriorated in April-May 2012, however, due to a series of bandhs (general strikes), particularly in the Far-
Western, Eastern and Terai regions, resulting in the price increase of most food commodities, partial shortage
of essential items such as medicines and temporary loss of jobs mainly among construction and transport
labourers. The situation has now become normal after lifting bandhs6.
FOOD SUPPLY AND TRADE SITUATION Food commodity trade has a potential to reduce price volatility and food insecurity by supplying food from
surplus to deficit areas. Data from the first eight months of the FY 2011/12 (see Table 3) indicates that the
total cereal import has increased by 25.5 percent compared to the same period last year. During this period,
Nepal has imported more than 100 thousand MT of rice with a total value of Rs. 217.8 million (an equivalent to
24.7 million US$) as opposed to the export of 345 MT during the same period. Likewise, the country has
imported about 4,623.6 MT of wheat (grain and flour, worth 46.2 million Nepalese Rupees) and 72,680.7 MT
5 “Food Security Bulletin” various issues, MoAD/WFP
6 Nepal Food Security Bulletin Issue 35,March 2012, MoAD/WFP and Market Watch-41

11
of maize (worth 726.8 million Nepalese Rupees). The total cereal import has reached to 190,049.2 MT against
the export of 2,140.1 MT7 during the first eight months of the FY 2011/12.
Table 3: Export and import major food items
Items
2009/10 2010/11 2011/12*
Value in NPRs. (,000)
Quantity (MT) Value in
NPRs. (,000) Quantity
(MT)
Value in NPRs. (,000)
Quantity (MT)
Rice export 12,132.0 363.8 6,515.6 305.2 41.0 345.0
Rice import 2,635,825.5 102,846.9 2,408,634.0 133,489.9 2,197,807.0 103,527.0
Wheat flour export 51,977.4 3,045.3 4,294.9 123.2 40,215.1 1,709.0
Wheat flour import 8,975.0 254.5 427,424.2 21,634.4 84,866.0 4,623.7
Maize (corn + flour) export 2,698.4 33.5 82.3 0.0 733.3 82.6
Maize (corn + flour) import 656,253.0 47,798.8 2,285,541.6 160,815.0 1,315,099.0 72,680.7
Millet export - - 125,913.2 0.0 104.6 3.5
Millet import - - 125,913.2 15,511.0 82,294.7 9,217.9
Lentils export 3,744,900.0 37,793.1 3,349,100.7 37,425.0 1,527,562.0 20,426.1
Lentils import 249,013.6 8,057.7 35,781.5 756.2 Note: Rice item includes husk, husk brown, semi-milled or wholly milled and broken rice.
*Provisional data of the first eight months of the FY 2011/12
Source: Trade & Export Promotion Centre, Nepal
The increasing trend of cereal imports from abroad during the surplus year would require a further
investigation. In general, the volume of food supply and trade is primarily determined by the domestic
production: a good harvest of cereal crops is likely to reduce a country’s food deficit as well as food imports
from abroad. Analyzing the Nepal foreign trade, however, is complex due to various reasons including: the
significance of informal trade with India; and the effects of Indian trade policy. Informal trade, particularly with
India due to the long porous border plays a significant role: the value of informal trade of agricultural
commodities with India is estimated to be at around 65 billion NPRs, which is 21 percent higher than the one
of formal trade8. The Indian trade policy often influences the Nepal’s volume of trade with other countries
especially the SAARC nations. Lentil export to Bangladesh from Nepal, for instance, has reportedly declined
this year compared to last year as the India’s export ban has been lifted partially, resulting in the reduction of
Nepal’s lentils export by 50.8 percent during the first eight months of the FY 2011/12 compared to the same
period last year.
Apart from the trade, Nepal has received a total of 23,410 MT food aid (rice) from donor countries in the FY
2011/129, out of which 19,000 MT from different donor countries including Japan is administered by the Nepal
Food Corporation (NFC), while the remaining 4,410 MT is provided by the WFP. The food aid is mostly targeted
to food insecure areas and population in the Far and Mid-Western hills and mountains either with subsidized
rates or through various programmes such as food for work.
7 The export and import figures include both edible and non-edible food. Caution is required to calculate the total food balance in Nepal. 8 Based on the preliminary results (published in national daily newspapers) of the recent study carried out by Nepal Council for Development Research (NCDR) on behalf of the MoAD- a study on informal trade of selected agro-products through five major customs points along Nepal-India border(Kakarbhitta, Biratnagar, Birjung, Bhairahawa and Nepalgunj). However, according to trade experts, quality is also major factor to decline lentil exports. 9 Source: Nepal Food Corporation and WFP.

12
CONCLUSIONS The 2011/12 crop production was very good with the total output of 9.46 million MT, 9.8 percent increase
compared to the one of last year, 8.62 million MT. Following the bumper summer harvest, the winter crop
production has increased by 5.9 percent compared to last year: the production of wheat and barley has
increased by 5.7 percent to 1.85 million MT and 14.9 percent to 0.35 million MT respectively. The overall
increase of the 2011/12 cereal crop production has yielded a surplus of 886.3 thousand MT edible cereal crop
production in the country.
The good harvest of both summer and winter crops is primarily attributed to a timely and adequate rainfall
across the country, government and non-government supported programmes and projects to enhance
agricultural productivity, relatively timely availability of seeds and fertilizers compared to previous years, and
less crop damage by floods especially in Terai belts. Major constraints cited by farmers are: shortage of timely
supply of good quality fertilizers and seeds, lack of irrigation facilities, inadequate agricultural extension
services, lack of market information, and shortage of labour in rural areas due to migration.
The 2012/13 summer crop outlook is so far normal across the country. However, the insufficient pre-monsoon
rainfall and the delay of monsoon by at least one week than its normal date will likely affect the normal growth
of maize and other seasonal vegetables in the hilly region, and the growth of paddy seedlings. Paddy
plantation is likely to be affected adversely due to the delay in monsoon.
Food security situation has improved across the country in 2011/12 compared to last year, owing to the good
crop production and a smooth operation of transportation services (except during the bandhs in May 2012).
The likely impact of the delay in monsoon together with an anticipated weak monsoon will be monitored
closely by the NeKSAP.

13
ANNEX 1: CROP SITUATION IN SELECTED DISTRICTS VISITED BY THE JOINT
MISSION Eastern Development Region: The team visited three districts viz. Khotang, Okhaldhunga and Solukhumbu in the Eastern Region
consisting of MoAD, WFP and FAO members from 19-27 April 2012. The winter crop production situation in the Eastern region is found
normal; the cereal crop production has increased by 14.3 percent, contributing by 21.4 percent increase of paddy and 10.3 percent
increase of maize production. However, the production of winter crops such wheat in the region has declined by 5.1 percent compared to
last year. The report from the field visit also shows that the production of winter crop has declined due to insufficient rainfall in some 40
VDCs (Chyasmitar, Badahare, Dikuwa,, Bahunidanda, Dhitung, Darchhim, Salle, Pauwasera, Lichkiramche, Faktang, Mauwabote, Wopung,
Suntale etc.) of Khotang district and due to infestation of rust and smut in 19 VDCs (Harkapur, Kuntadevi, Barjalu, Thakle, Manebhanjyang,
Ubu, Baksa, Moli etc) of Okhaldhunga district, which lead to decline winter crop production by 15-20 percent in these districts. Outlook of
the summer crop such as maize is so far good. It is estimated that more than 80 percent of maize plantation has been completed during
the period of field visit. It is reported that some farmers in Udayapur district have left out ginger in their field because of drastic fall in
prices from Rs 30 last year to Rs 12 this year on average, which is not enough to cover even the cost of production.
Central Development Region: The joint crop assessment team conducted field visit in Kavre, Chitwan, Bara, Siraha and Sindhuli districts
from 19-26 April 2012 consisting of MoAD, WFP and FAO members. The overall production in the Central region is found to be good,
increasing by 7.1 percent in wheat production and by 13.6 percent in total cereal crop production in 2011/12. It is reported from the field
visit and community interaction that the excess rainfall in some parts of Siraha district has damaged wheat. As a result, the production has
declined by 26.0 percent. Such an excess rainfall has also damaged vegetables like potato in almost all sample districts. According to
respective DADOs, potato production is estimated to decline by 20 percent in Chitwan, by 12 percent in Bara and by 19 percent in Siraha.
The major problems farmers used to face are insufficient and timely unavailability of fertilizers and improved seeds, low presence of
agriculture technicians, and labour shortage during peak season of plantation and harvesting.
Western Development Region: Districts include Nawalparasi, Rupendehi, Gulmi and Lamjung in the Western Development Region. The
field visit was conducted from 19-27 April 2012. The production situation of the region was normal, indicating no significant change in the
overall cereal production compared to last year. The production of winter crops compared to summer crops was relatively lower due to
some localized problems. For instance, hailstones have damaged both ripening winter crops combined with chaite maize, vegetables and
citrus in Lamjung district. According to the community people, such a devastating hailstone, roughly one and half feet depth, has occurred
after 75 years. Likewise, hailstones have also damaged crops, including vegetables and citrus in 7 VDCs of Gulmi district. Despite a loss of
winter crops in Lamjung and Gulmi distirct, there was a bumper harvest of wheat (17.3 percent) in Nawalparasi district. However, farmers
in Paranipur of Nawalparasi district often face the availability of inputs at the required time which limit farmers to shift from subsistence
to commercialized farming. The information from the community interaction in Tenuhawa VDC of Rupendehi district indicates that lack of
irrigation facilities, unavailability of fertilizers and improved seeds at an appropriate time are the major constrains hindering to enhance
productivity.
Mid-Western Development Region: The joint crop assessment team consisting of the MoAD and WFP visited Banke, Jajarkot, Surkhet and
Humla districts in the Mid-Western region. The region has an impressive increase of winter crop production, leading to 12.1 percent
overall increase in 2011/12. District like Mugu has become a food surplus since a long period because of good harvest. As a result of
relatively sufficient rainfall and timely availability of fertilizers, the overall crop production has increased by 12.3 percent in Banke and 11.3
percent in Surkhet, while the production has declined by 6.5 percent in Jajarkot distirct compared to last year. However, as in other
regions, the major constrains farmers often faced are lack of irrigation facilities, timely unavailability of improved seeds and fertilizers and
irregular visits of DADO technicians.
Far-Western Development Region: Four districts, namely Kanchanpur, Doti, Achham and Bajura are the sampled districts visited by the
team from 18-26 April 2012. The overall winter crop production is found to be normal, showing 4.3 percent increase in wheat production
and 0.8 percent decline in barley production in the Far-Western Development Region. As the Far-Western hill and mountain districts are
prone to drought and hailstorms, it is reported that hailstorms with hailstones have partially damaged ripening winter crops in the region,
especially in Bajura and Baitadi districts. As a result, wheat production in Baitadi has decreased by 6.9 percent, in Bajura district barley
production has declined by 3.9 percent compared to last year. The team also visited different farmers’ groups in different pocket areas
such as cereal and vegetable pocket areas. The major constrains in the cereal pocket area were timely unavailability of improved seeds
and fertilizers, coupled with shortage of labour and lack of irrigation facilities, while in the vegetable farming, cold store is the main
constrain for them. For example, DADO Doti has developed Gholtada village of Dipayal-Silgadi Municipality-6 as vegetable pocket area to
fulfil the likely demand of vegetables in the DIpayal-Silgadi municipality. Many farmer groups have cultivated seasonal vegetables such as
cauliflower, cabbage, tomatoes, potatoes and beans, but they have not yet obtained the reasonable price of their products. According to
them, market development by building cold store is essential to encourage farmers into cash and high value crops.
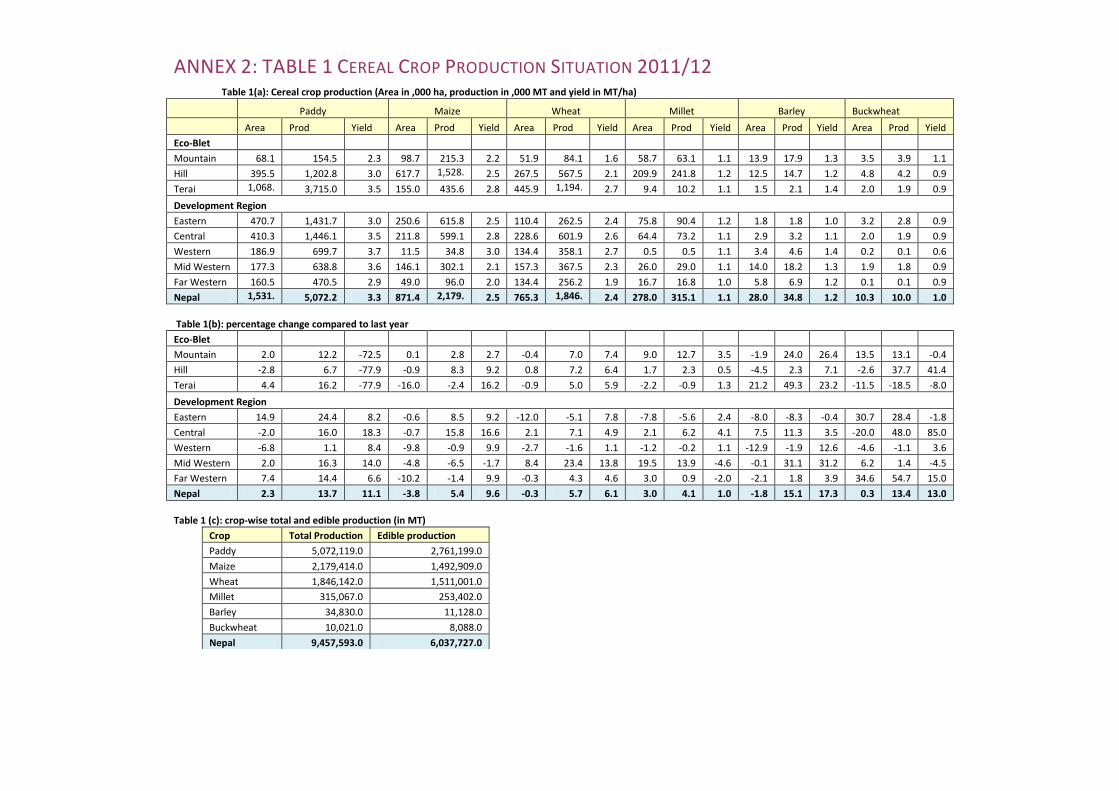
ANNEX 2: TABLE 1 CEREAL CROP PRODUCTION SITUATION 2011/12 Table 1(a): Cereal crop production (Area in ,000 ha, production in ,000 MT and yield in MT/ha)
Paddy Maize Wheat Millet Barley Buckwheat
Area Prod Yield Area Prod Yield Area Prod Yield Area Prod Yield Area Prod Yield Area Prod Yield
Eco-Blet
Mountain 68.1 154.5 2.3 98.7 215.3 2.2 51.9 84.1 1.6 58.7 63.1 1.1 13.9 17.9 1.3 3.5 3.9 1.1
Hill 395.5 1,202.8 3.0 617.7 1,528.5
2.5 267.5 567.5 2.1 209.9 241.8 1.2 12.5 14.7 1.2 4.8 4.2 0.9
Terai 1,068.0
3,715.0 3.5 155.0 435.6 2.8 445.9 1,194.5
2.7 9.4 10.2 1.1 1.5 2.1 1.4 2.0 1.9 0.9
Development Region
Eastern 470.7 1,431.7 3.0 250.6 615.8 2.5 110.4 262.5 2.4 75.8 90.4 1.2 1.8 1.8 1.0 3.2 2.8 0.9
Central 410.3 1,446.1 3.5 211.8 599.1 2.8 228.6 601.9 2.6 64.4 73.2 1.1 2.9 3.2 1.1 2.0 1.9 0.9
Western 186.9 699.7 3.7 11.5 34.8 3.0 134.4 358.1 2.7 0.5 0.5 1.1 3.4 4.6 1.4 0.2 0.1 0.6
Mid Western 177.3 638.8 3.6 146.1 302.1 2.1 157.3 367.5 2.3 26.0 29.0 1.1 14.0 18.2 1.3 1.9 1.8 0.9
Far Western 160.5 470.5 2.9 49.0 96.0 2.0 134.4 256.2 1.9 16.7 16.8 1.0 5.8 6.9 1.2 0.1 0.1 0.9
Nepal 1,531.5
5,072.2 3.3 871.4 2,179.4
2.5 765.3 1,846.1
2.4 278.0 315.1 1.1 28.0 34.8 1.2 10.3 10.0 1.0
Table 1(b): percentage change compared to last year
Eco-Blet
Mountain 2.0 12.2 -72.5 0.1 2.8 2.7 -0.4 7.0 7.4 9.0 12.7 3.5 -1.9 24.0 26.4 13.5 13.1 -0.4
Hill -2.8 6.7 -77.9 -0.9 8.3 9.2 0.8 7.2 6.4 1.7 2.3 0.5 -4.5 2.3 7.1 -2.6 37.7 41.4
Terai 4.4 16.2 -77.9 -16.0 -2.4 16.2 -0.9 5.0 5.9 -2.2 -0.9 1.3 21.2 49.3 23.2 -11.5 -18.5 -8.0
Development Region
Eastern 14.9 24.4 8.2 -0.6 8.5 9.2 -12.0 -5.1 7.8 -7.8 -5.6 2.4 -8.0 -8.3 -0.4 30.7 28.4 -1.8
Central -2.0 16.0 18.3 -0.7 15.8 16.6 2.1 7.1 4.9 2.1 6.2 4.1 7.5 11.3 3.5 -20.0 48.0 85.0
Western -6.8 1.1 8.4 -9.8 -0.9 9.9 -2.7 -1.6 1.1 -1.2 -0.2 1.1 -12.9 -1.9 12.6 -4.6 -1.1 3.6
Mid Western 2.0 16.3 14.0 -4.8 -6.5 -1.7 8.4 23.4 13.8 19.5 13.9 -4.6 -0.1 31.1 31.2 6.2 1.4 -4.5
Far Western 7.4 14.4 6.6 -10.2 -1.4 9.9 -0.3 4.3 4.6 3.0 0.9 -2.0 -2.1 1.8 3.9 34.6 54.7 15.0
Nepal 2.3 13.7 11.1 -3.8 5.4 9.6 -0.3 5.7 6.1 3.0 4.1 1.0 -1.8 15.1 17.3 0.3 13.4 13.0
Table 1 (c): crop-wise total and edible production (in MT)
Crop Total Production Edible production
Paddy 5,072,119.0 2,761,199.0
Maize 2,179,414.0 1,492,909.0
Wheat 1,846,142.0 1,511,001.0
Millet 315,067.0 253,402.0
Barley 34,830.0 11,128.0
Buckwheat 10,021.0 8,088.0
Nepal 9,457,593.0 6,037,727.0

ANNEX 3: DISTRICT-WISE CEREAL CROP PRODUCTION AND EDIBLE CEREAL FOOD BALANCE*
IN 2011/12 (IN MT)
District Paddy prod.
Maize Prod.
Millet Prod.
Wheat Prod.
Barley Prod.
Buck wheat Prod.
Total Cereal Prod.
Total Edible Prod.
Require-ment (MT)
Balance (+,-)
Taplejung 22,167.0 38,116.0 3,508.0 2,783.0 280.0 170.0 67,024.0 46,690.7 24,440.0 22,250.7
Sankhuwashava 36,600.0 22,193.5 9,975.0 2,850.0 26.0 11.0 71,655.5 44,166.7 30,501.0 13,665.7
Solukhumbu 3,564.0 32,388.0 2,940.0 7,308.0 200.0 224.0 46,624.0 35,533.3 20,376.0 15,157.3
E. Mountain 62,331.0 92,697.5 16,423.0 12,941.0 506.0 405.0 126,390.7 75,317.0 51,073.7
Panchthar 23,000.0 21,760.0 9,350.0 7,580.0 593.0 42.0 62,325.0 40,555.4 39,798.0 757.4
Illam 45,690.0 77,500.0 3,000.0 13,398.0 55.0 20.0 139,663.0 99,807.2 59,734.0 40,073.2
Terhathum 24,522.6 25,935.0 3,061.0 5,445.0 67.0 26.0 59,056.6 38,413.2 20,237.0 18,176.2
Dhankuta 19,600.0 42,450.0 7,810.0 2,975.0 10.0 0.0 72,845.0 52,393.6 32,944.0 19,449.6
Bhojpur 42,341.0 74,370.0 4,954.5 4,903.0 25.0 12.5 126,606.0 90,940.9 36,620.0 54,320.9
Khotang 31,924.2 63,908.0 23,940.0 9,575.0 435.0 432.0 130,214.2 94,544.1 41,631.0 52,913.1
Okhaldhunga 14,000.0 27,760.0 11,840.8 4,825.0 100.0 65.3 58,591.1 41,587.5 29,653.0 11,934.5
Udaypur 50,700.0 34,913.5 4,377.5 14,322.0 37.0 17.1 104,367.1 65,988.1 65,485.0 503.1
E. Hills 251,777.8 368,596.5 68,333.8 63,023.0 1,322.0 614.9 753,668.0 524,229.9 326,102.0 198,127.9
Jhapa 321,840.0 72,460.0 2,160.0 25,150.0 6.0 1,300.0 422,916.0 250,112.5 149,338.0 100,774.5
Morang 277,610.0 45,300.0 1,812.0 40,438.0 0.0 62.0 365,222.0 213,057.5 177,128.0 35,929.5
Sunsari 166,000.0 21,966.0 744.0 45,500.0 0.0 372.0 234,582.0 137,989.0 138,681.0 -692.0
Saptari 177,000.0 8,000.0 375.0 45,600.0 0.0 0.0 230,975.0 133,610.7 118,529.0 15,081.7
Siraha 175,150.0 6,820.0 600.0 29,877.0 0.0 0.0 212,447.0 117,794.8 117,846.0 -51.2
E.Terai 1,117,600.0 154,546.0 5,691.0 186,565.0 6.0 1,734.0 1,466,142.0 852,564.4 701,522.0 151,042.4
E.Region 1,431,708.8 615,840.0 90,447.8 262,529.0 1,834.0 2,753.9 2,405,113.5 1,503,185.0 1,102,941.0 400,244.0
Dolakha 9,248.3 21,135.0 4,630.6 4,837.0 230.0 400.5 40,481.4 26,170.2 35,661.0 -9,490.8
Sindhupalchok 28,290.0 57,078.3 21,263.0 7,010.0 210.0 11.3 113,862.5 81,737.0 54,990.0 26,747.0
Rasuwa 3,599.0 4,700.5 901.6 1,645.0 398.0 0.0 11,244.2 6,637.5 8,348.0 -1,710.5
C. Mountain 41,137.3 82,913.8 26,795.2 13,492.0 838.0 411.8 165,588.0 114,544.7 98,999.0 15,545.7
Ramechhap 30,199.7 50,102.5 6,068.4 8,292.0 110.0 19.0 94,791.6 66,350.4 41,130.0 25,220.4
Sindhuli 32,848.0 40,170.0 10,449.0 13,700.0 65.0 267.5 97,499.5 67,137.4 59,532.0 7,605.4
Kavre 31,512.0 62,937.0 3,850.0 21,478.0 825.0 915.0 121,517.0 80,478.6 78,469.0 2,009.6
Bhaktapur 25,241.6 7,978.5 140.0 11,060.0 55.0 0.0 44,475.1 25,432.9 63,004.0 -37,571.1
Lalitpur 26,676.0 34,579.2 690.0 14,690.0 70.0 30.0 76,735.2 49,823.1 97,407.0 -47,583.9
Kathmandu 46,080.0 28,496.0 852.0 15,903.0 7.0 0.0 91,338.0 55,281.9 371,258.0 -315,976.1
Nuwakot 56,453.0 56,811.0 10,681.2 15,102.0 200.0 60.0 139,307.2 92,366.2 55,842.0 36,524.2
Dhading 38,187.0 26,081.0 6,930.0 9,600.0 350.0 0.0 81,148.0 48,474.0 67,538.0 -19,064.0
Makwanpur 37,552.0 72,562.0 3,254.0 12,007.0 26.0 159.0 125,560.0 87,662.4 86,690.0 972.4
C. Hills 324,749.3 379,717.2 42,914.6 121,832.0 1,708.0 1,450.5 872,371.6 573,007.1 920,870.0 -347,862.9
Dhanusha 185,250.0 6,460.8 300.0 90,357.0 1.0 0.0 282,368.8 175,424.0 141,091.0 34,333.0
MahottariI 97,372.8 6,451.5 215.0 64,820.0 10.0 0.0 168,869.3 107,477.0 118,964.0 -11,487.0
Sarlahi 143,634.8 41,205.0 1,000.0 67,200.0 450.0 0.0 253,489.8 165,215.3 142,035.0 23,180.3
Rautahat 136,177.5 5,292.0 51.0 41,626.0 5.0 0.0 183,151.5 108,132.5 129,509.0 -21,376.5
Bara 221,340.0 30,750.0 98.6 92,800.0 64.0 0.0 345,052.6 218,853.7 130,108.0 88,745.7
Parsa 192,966.0 16,288.0 75.4 82,600.0 48.0 0.0 291,977.4 184,416.3 111,196.0 73,220.3
Chitwan 103,496.0 30,000.0 1,750.0 27,125.0 61.0 0.0 162,432.0 86,580.7 104,621.0 -18,040.3
C.Terai 1,080,237.1 136,447.3 3,490.0 466,528.0 639.0 0.0 1,687,341.4 1,046,099.6 877,524.0 168,575.6
C.Region 1,446,123.6 599,078.3 73,199.8 601,852.0 3,185.0 1,862.3 2,725,301.0 1,733,651.3 1,897,393.0 -163,741.7
Manang 0.0 425.0 0.0 645.0 200.0 437.0 1,707.0 1,164.9 1,207.0 -42.1
Mustang 0.0 810.0 0.0 1,080.0 500.0 955.0 3,345.0 2,245.8 2,615.0 -369.2
W. Mountain 0.0 1,235.0 0.0 1,725.0 700.0 1,392.0 5,052.0 3,410.7 3,822.0 -411.3
Gorkha 36,859.0 39,692.1 11,605.0 7,592.0 100.0 390.0 96,238.1 65,778.5 53,794.0 11,984.5
Lamjung 40,437.0 39,591.0 9,898.0 1,375.0 28.0 16.0 91,345.0 62,595.1 33,836.0 28,759.1
Tanahu 43,105.0 63,970.0 6,710.0 3,626.0 6.0 184.0 117,601.0 80,391.0 66,770.0 13,621.0
KaskiI 76,850.0 32,943.0 17,700.0 14,545.0 121.0 14.0 142,173.0 87,793.3 101,423.0 -13,629.7
Parbat 23,023.3 28,762.0 8,049.0 6,665.0 105.0 33.0 66,637.3 45,950.9 29,361.0 16,589.9
Syangja 58,130.0 92,750.0 19,325.0 12,150.0 8.0 130.0 182,493.0 129,856.0 57,362.0 72,494.0

16
District Paddy prod.
Maize Prod.
Millet Prod.
Wheat Prod.
Barley Prod.
Buck wheat Prod.
Total Cereal Prod.
Total Edible Prod.
Require-ment (MT)
Balance (+,-)
Palpa 29,280.0 43,070.0 2,590.0 13,422.0 39.0 422.0 88,823.0 60,597.0 54,160.0 6,437.0
Myagdi 11,486.0 34,151.0 3,386.0 5,757.0 359.0 50.0 55,189.0 40,234.6 22,846.0 17,388.6
Baglung 17,147.0 59,044.0 22,386.0 13,102.0 1,265.0 110.0 113,054.0 85,479.9 54,294.0 31,185.9
Gulmi 22,924.0 55,292.0 2,863.5 14,978.0 555.0 325.0 96,937.5 70,649.7 56,748.0 13,901.7
Argakhanchi 26,204.8 41,150.0 608.0 12,478.0 570.0 292.0 81,302.8 55,843.6 40,136.0 15,707.6
W. Hills 385,446.1 530,415.1 105,120.5 105,690.0 3,156.0 1,966.0 1,131,793.7 785,169.6 570,730.0 214,439.6
Nawalparasi 191,337.0 26,000.0 495.0 54,140.0 180.0 135.0 272,287.0 163,378.4 116,570.0 46,808.4
Rupendehi 301,000.0 6,900.0 0.0 106,750.0 210.0 0.0 414,860.0 252,602.7 164,533.0 88,069.7
Kapilbastu 207,350.0 1,920.0 0.0 89,815.0 380.0 0.0 299,465.0 182,760.5 105,077.0 77,683.5
W.Terai 699,687.0 34,820.0 495.0 250,705.0 770.0 135.0 986,612.0 598,741.6 386,180.0 212,561.6
W.Region 1,085,133.1 566,470.1 105,615.5 358,120.0 4,626.0 3,493.0 2,123,457.7 1,387,321.9 960,732.0 426,589.9
Dolpa 605.0 4,000.0 487.5 6,500.0 600.0 350.0 12,542.5 10,974.2 7,180.0 3,794.2
Mugu 2,556.0 959.0 4,500.0 7,785.0 1,550.0 495.0 17,845.0 11,681.8 10,838.0 843.8
Humla 875.0 171.3 1,216.0 1,175.0 825.0 603.0 4,865.3 2,244.4 9,992.0 -7,747.6
Jumla 3,600.0 6,750.0 3,700.0 5,300.0 7,575.0 65.0 26,990.0 16,551.2 21,217.0 -4,665.8
Kalikot 5,748.0 5,215.0 3,700.0 9,282.0 781.0 65.0 24,791.0 16,984.8 27,973.0 -10,988.2
MW. Mountain 13,384.0 17,095.3 13,603.5 30,042.0 11,331.0 1,578.0 87,033.8 58,436.4 77,200.0 -18,763.6
Rukum 9,617.4 30,213.0 912.0 26,190.0 1,480.0 0.0 68,412.4 51,010.0 42,891.0 8,119.0
Rolpa 12,997.0 25,302.0 1,059.0 16,834.0 920.0 65.0 57,177.0 40,638.1 46,013.0 -5,374.9
Pyuthan 18,270.0 20,390.0 2,000.0 19,206.0 785.0 10.5 60,661.5 41,019.4 47,773.0 -6,753.6
Salyan 22,275.2 27,803.0 2,320.0 28,755.0 1,410.0 80.0 82,643.2 56,895.5 49,648.0 7,247.5
Jajarkot 10,038.0 12,579.0 3,708.0 15,366.0 560.0 26.4 42,277.4 29,532.6 35,655.0 -6,122.4
Dailekh 28,073.0 37,076.0 2,518.0 29,870.0 285.0 20.0 97,842.0 69,381.4 53,941.0 15,440.4
Surkhet 54,298.0 45,692.0 2,800.0 49,500.0 1,360.0 153,650.0 107,381.1 74,177.0 33,204.1
MW. Hills 155,568.6 199,055.0 15,317.0 185,721.0 6,800.0 201.9 562,663.5 395,857.9 350,098.0 45,759.9
Dang 157,030.0 54,936.0 100.0 29,464.0 45.0 0.0 241,575.0 149,477.3 103,056.0 46,421.3
Banke 123,971.0 20,085.0 0.0 53,904.0 10.0 0.0 197,970.0 122,182.9 91,715.0 30,467.9
Bardiya 188,825.0 10,900.0 0.0 68,325.0 10.0 0.0 268,060.0 162,786.3 78,172.0 84,614.3
MW.Terai 469,826.0 85,921.0 100.0 151,693.0 65.0 0.0 707,605.0 434,446.4 272,943.0 161,503.4
MW.Region 638,778.6 302,071.3 29,020.5 367,456.0 18,196.0 1,779.9 1,357,302.3 888,740.7 700,241.0 188,499.7
Bajura 7,613.0 1,817.0 2,871.0 9,900.0 1,700.0 11.2 23,912.2 13,918.1 26,518.0 -12,599.9
Bajhang 18,285.0 3,980.0 2,057.0 9,500.0 1,550.0 3.6 35,375.6 20,474.2 38,145.0 -17,670.8
Darchula 11,708.9 15,552.4 1,310.0 6,500.0 1,250.0 85.0 36,406.3 24,331.8 25,731.0 -1,399.2
FW. Mountain 37,606.9 21,349.4 6,238.0 25,900.0 4,500.0 99.8 95,694.1 58,724.1 90,394.0 -31,669.9
Achham 30,660.5 10,479.0 3,310.0 25,500.0 660.0 0.0 70,609.5 45,459.6 52,462.0 -7,002.4
Doti 24,375.0 4,835.5 5,825.0 30,210.0 250.0 7.5 65,503.0 42,644.9 42,675.0 -30.1
Baitadi 15,000.0 29,000.0 700.0 23,000.0 600.0 0.0 68,300.0 48,115.6 51,058.0 -2,942.4
Dadeldhura 15,182.0 6,390.0 260.0 12,500.0 225.0 0.0 34,557.0 21,240.0 28,797.0 -7,557.0
FW.Hills 85,217.5 50,704.5 10,095.0 91,210.0 1,735.0 7.5 238,969.5 157,460.2 174,992.0 -17,531.8
Kailali 203,050.0 12,000.0 450.0 71,500.0 650.0 25.0 287,675.0 171,812.7 142,892.0 28,920.7
Kanchanpur 144,630.0 11,900.0 0.0 67,540.0 10.0 0.0 224,080.0 136,830.8 81,835.0 54,995.8
FW.Terai 347,680.0 23,900.0 450.0 139,040.0 660.0 25.0 511,755.0 308,643.6 224,727.0 83,916.6
FW.Region 470,504.4 95,953.9 16,783.0 256,150.0 6,895.0 132.3 846,418.6 524,827.8 490,113.0 34,714.8
Mountain 154,459.2 215,291.0 63,059.7 84,100.0 17,875.0 3,886.6 538,671.4 361,506.5 345,732.0 15,774.5
Hill 1,202,759.2 1,528,488.3 241,780.9 567,476.0 14,721.0 4,240.7 3,559,466.2 2,435,724.6 2,342,792.0 92,932.6
Terai 3,715,030.1 435,634.3 10,226.0 1,194,531.0 2,140.0 1,894.0 5,359,455.4 3,240,495.6 2,462,896.0 777,599.6
Nepal 5,072,248.5 2,179,413.6 315,066.6 1,846,142.3 34,829.8 10,021.3 9,457,592.9 6,037,726.7 5,151,420.0 886,306.7
* This food balance is calculated with the preliminary population census data of the year 2010/11.

17
ANNEX 4: MAP 4-EDIBLE CEREAL PRODUCTION AND FOOD BALANCE
SITUATION BY REGION/BELT IN 2011/12

18
ANNEX 5: PHOTOGRAPHS
Community interaction in Tenuhawa VDC, Rupendehi.
Farmer showing low growth wheat due to insufficient rainfall in Thulasen, Achham.

19
Vegetable production in Gholtada village of Dipayal-Silgadi Municality, Doti.
Wheat harvesting and potato cultivation in Kavrepalanchwok.