
Crop Situation Update - World Food Programme
22
Crop Situation Update A joint assessment of the 2013 winter crops including comprehensive data on the 2012/13 overall crop production Ministry of Agricultural Development Food and Agriculture Organization World Food Programme
Transcript of Crop Situation Update - World Food Programme

Crop Situation Update A joint assessment of the 2013 winter crops including comprehensive data on the 2012/13 overall crop production
Ministry of Agricultural Development
Food and Agriculture Organization
World Food Programme

1
Contents HIGHLIGHTS ............................................................................................................................................ 2
2012/13 WINTER CROP SITUATION .................................................................................................... 2
2012/13 NATIONAL PRODUCTION ...................................................................................................... 2
2013/14 SUMMER CROP OUTLOOK .................................................................................................... 2
Background and Objectives .................................................................................................................... 3
Methodology ........................................................................................................................................... 3
Rainfall .................................................................................................................................................... 4
National Winter Crop Production Overview ........................................................................................... 5
Wheat .................................................................................................................................................. 5
Barley .................................................................................................................................................. 7
2012/13 National Crop Output ............................................................................................................... 8
CEREALS .............................................................................................................................................. 8
OTHER CROPS...................................................................................................................................... 9
Input supplies ........................................................................................................................................ 10
Fertilizer ............................................................................................................................................ 10
Seed................................................................................................................................................... 10
Agricultural Mechanization ............................................................................................................... 11
Food Market Situation .......................................................................................................................... 12
Trade Overview ..................................................................................................................................... 13
Global and Regional Production Overview ........................................................................................... 14
National Food Balance .......................................................................................................................... 15
Conclusion ............................................................................................................................................. 18
2013/14 Summer crop outlook ............................................................................................................ 18

2
HIGHLIGHTS
2012/13 WINTER CROP SITUATION
The production of wheat and barley is estimated at 1.9 million mt, and 37 thousand mt
respectively. This is an increase in production of 2 percent and 6 percent respectively compared
to 2011/12 winter season.The Central Development Region is the largest wheat producing
region with an output of 631 thousand mt, up by 5 percent compared to 2011/12.
Increase in winter crop production is attributed to the timely and adequate precipitation
(rainfall/snowfall), and increased use of agricultural inputs.
2012/13 NATIONAL PRODUCTION
Despite a good winter crop harvest, the 2012/13 national cereal crop production decreased
substantially from 9.45 million mt of last year to 8.74 million mt this year—a drop of 7.6 percent.
Due to late and erratic rainfall during the monsoon, the production of paddy, maize, and millet
decreased to 4.5 million mt, 2.0 million mt, and 0.30 million mt, respectively. A decrease in
production by 11.3 percent, 8.3 percent, and 3 percent respectively compared to 2011/12.
Buckwheat marginally increased by 0.3 percent to 10,056 mt.
The overall national cereal balance remains positive with a surplus of 408.4 thousand mt (7.8
percent) of edible food as opposed to a surplus of 886.3 thousand mt (17.2 percent) last year.
Despite a surplus cereal food balance at national level, as many as 33 districts are food deficit;
many of them are in the Mid- and Far-Western Hill and Mountain districts.
During the period July 2012-March 2013, the share of cereal import was 3.25 percent (worth
NPR 14 billion) as compared to 2.27 percent for the same period last year.
Year-on-year Wholesale Price Index (WPI) marginally increased by 8.1 percent in May 2013
compared to 8.0 percent in the same period last year. However, the WPI of the cereal grains,
increased by 9.4 percent compared to a decline of 0.2 percent over the same period last year.
Global cereal production is estimated at 2,708 million mt, an increase of 6 percent compared to
last year. In India, total grain output is estimated at 255.36 million mt, which includes 104.22
million mt of rice, 93.62 million mt of wheat, and 21.82 million mt of maize.
2013/14 SUMMER CROP OUTLOOK
The overall outlook for the 2013/14 summer crops remains positive. Active pre-monsoon and
the timely arrival of the monsoon rains are expected to results in good summer crop yields for
maize, paddy, and millet.

3
Background and Objectives
The Crop Situation Update is issued by the Ministry of Agricultural Development (MoAD), World Food Programme (WFP), and Food and Agriculture Organization (FAO). It is published twice a year. While periodic updates on the crop performance and food security situation are provided through Food Security Bulletins (issued by MoAD and WFP on a quarterly basis), the crop situation update provides a comprehensive overview on the food supply situation.
This crop situation update covers the 2012/13 (Fiscal Year 2069/70) winter crop production and provides an overview of the National Food Balance for 2012/13 agricultural year.
Crop Situation Update is available in print as well as in electronic format at: https://sites.google.com/site/nefoodsec/home/crop-situation-update
Methodology
The crop situation update relies on primary as well as secondary information. The preliminary estimates of 2012/13 winter crop production prepared by the MoAD in May/June 2013 provide nationwide data on the production of winter crops. Information collected regularly through the NeKSAP District Food Security Networks (DFSNs) provides early indication on crop performances and the food security situation. The weather related information, especially on rainfall, is collected by the Department of Hydrology and Meteorology (DHM). For trade, data from the Trade and Export Promotion Centre (TEPC)1 of the Ministry of Commerce and Supplies of the Government of Nepal is used.
A joint mission comprising of representatives from the MoAD, WFP, and FAO undertook field verification and stakeholder consultations that helped substantiate the secondary information and capture key issues, constraints, and opportunities of winter crop production in 2012/13. The mission included the following:
Consultation with DADO and other authorities to get an overview of agricultural production (winter crops) and an understanding of the reasons behind deviations (if any) in the winter crop yields;
Discussion with district line agencies and stakeholders (including CDO, LDO, DCCI, AIC, NFC etc.)2 on issues related to crop production and associated impacts on food supply and food security.
Community interactions to verify information obtained through DADO and other stakeholders and to capture the community perceptions on the state of agricultural production.
Field verifications were undertaken in 15 districts (3 districts from each development regions) purposively selected so as to: (i) cover districts that were anticipated to observe production losses in winter crops; (ii) ensure coverage from each of the five development regions; and (iii) cover districts that were not visited in earlier missions. The field verification mission was undertaken during April/ May.
1http://www.tepc.gov.np/
2 CDO-Chief District Officer; LDO-Local Development Officer; DCCI-District Chamber of Commerce and Industries; AIC-Agriculture Input Corporation; NFC-Nepal Food Corporation;
Eastern Development Region: Morang, Ilam, and Jhapa Central Development Region: Sindhupalchowk, Ramechhap, and Bara Western Development Region: Rupandehi, Tanahun, and Manang Mid-Western Development Region: Bardiya, Dailekh, and Kalikot Far-Western Development Region: Kailali, Doti, and Achham
Districts visited by the Winter Crop Assessment Mission

4
Figure 1: Annual rainfall (in percentage) from Oct-March 2008/09 to 2012/13 (Source: DHM)
Rainfall
Almost 80 percent of the total rainfall in the country falls during the months June to September. This monsoon season is governed by the southeasterly moisture-laden air-mass moving from the Bay of Bengal. It usually reaches eastern Nepal around the 10thof June and advances westwards covering the whole country within a period of a week.
Winter rain and snow is due to Winter Disturbance- a term used to describe an extra tropical storm originating in the Mediterranean that brings sudden winter rain and snow to the northwestern parts of the Indian subcontinent. This is a non-monsoonal precipitation pattern driven by the Westerlies. The moisture in these storms usually originates over the Mediterranean Sea and the Atlantic Ocean. Western Disturbances are important to the development of the winter crops. As shown in Figure 1, rainfall during October-March 2012/13 was recorded 87 percent of the normal, more than double the amount of rainfall in 2008/09, when Nepal experienced one of the worst ever winter droughts.
Although rainfall was relatively low during October-January, the 2012 monsoon had made a late
start and rainfall was
relatively intense in
September providing
adequate soil moisture for
germination of the winter
crops (wheat, barley, lentils,
and legumes) and
compensating for the below
normal rainfall. However,
rainfall during latter half of
March (Figure 2) and early
April had adverse impact on
the winter crops, especially
wheat, in some districts.
Heavy rainfall and hailstorms
during this period caused significant wheat crop loss in Dailekh, Jajarkot, Rukum, Kalikot, Panchthar,
and Taplejung. In Rupandehi, western dry winds during the maturity stage caused shriveled wheat
grains and hence lower grain production than forecasted.
Figure 2: Average rainfall distribution (%) from 2008-2012 (Source: DHM)

5
Figure 4: Area and production of wheat 2007/08-2012/13 (Source: MoAD)
National Winter Crop Production Overview
Wheat and barley, which are the major winter cereals for Nepal, recorded a combined production of 1.9 million mt, which is 2.03 percent above the 2011/12 level and 16.90 percent above normal3 (Table 1). Winter cereal output has been increasing steadily since the drought in 2008/09 (Figure 3). Annual average increase was 10 percent (2009/10- 2011/12). However, in 2012/13, a marginal increment of two percent was recorded.
Wheat
Wheat is the third largest crop in terms of production but second largest in terms of value. Wheat
cultivation in Nepal was limited to the Mid and Far-Western Hills only and it was considered as a
minor cereal in the country. However, after introduction of semi-dwarf varieties from Mexico, the
area and production of wheat has increased dramatically and wheat is now grown across the
country in some 760 thousands hectares.
As revealed during the crop assessment mission, wheat varieties commonly grown in Nepal are: NL 297, Gautam, Bhrikuti, BL 3235, Bijaya, WK 1204/5, Achyut, Triveni, BL 1473, Annapurna, Pasang
3 Throughout this report, normal production is meant for the average production of last five years, i.e. 2007/08 to 2011/12.
Figure 3: Total winter cereal output 2007/08- 2012/13 (Source: MoAD)

6
Lhamu, and BL 1032. In addition, some local varities like Begali and Mudule (red and white) are planted in some districts.
The wheat area, which was limited to some 100 thousands ha in 1965/66 rose to 760 thousands ha in 2012/13 (Figure 4). The production increased from 112 thousands mt to 1.88 million mt during this period. Wheat's contribution to the national cereal production is 21.5 percent. In terms of acreage, the wheat occupies about 22.7 percent of utilized agricultural land.
Although area under wheat marginally dropped in 2012/13 (i.e. by 0.7%), production increased by 2 percent (Table 1). The increment in wheat production this year is attributed to favourable weather conditions, inputs availability, and improving cultivation as well as crop husbandry practices.
At sub-national level, the Central Development Region continues to hold the largest share in wheat acreage and production—30 and 34 percent respectively. Compared to 2011/12 this region observed some 5 percent increase in production. This region also has the highest wheat productivity in Nepal recorded at 2,753 kg/ha.
At the district level, Dhanusa records a production of 108 thousands mt. In 2011/12, Rupandehi was still the highest wheat producing district. Wheat production in Dhanusa increased by some 20 percent whereas in Rupandehi, it declined by 8 percent compared to last year.
Table 1: Area, production, and yield of wheat for ecological belts and regions (Source: MoAD)
7
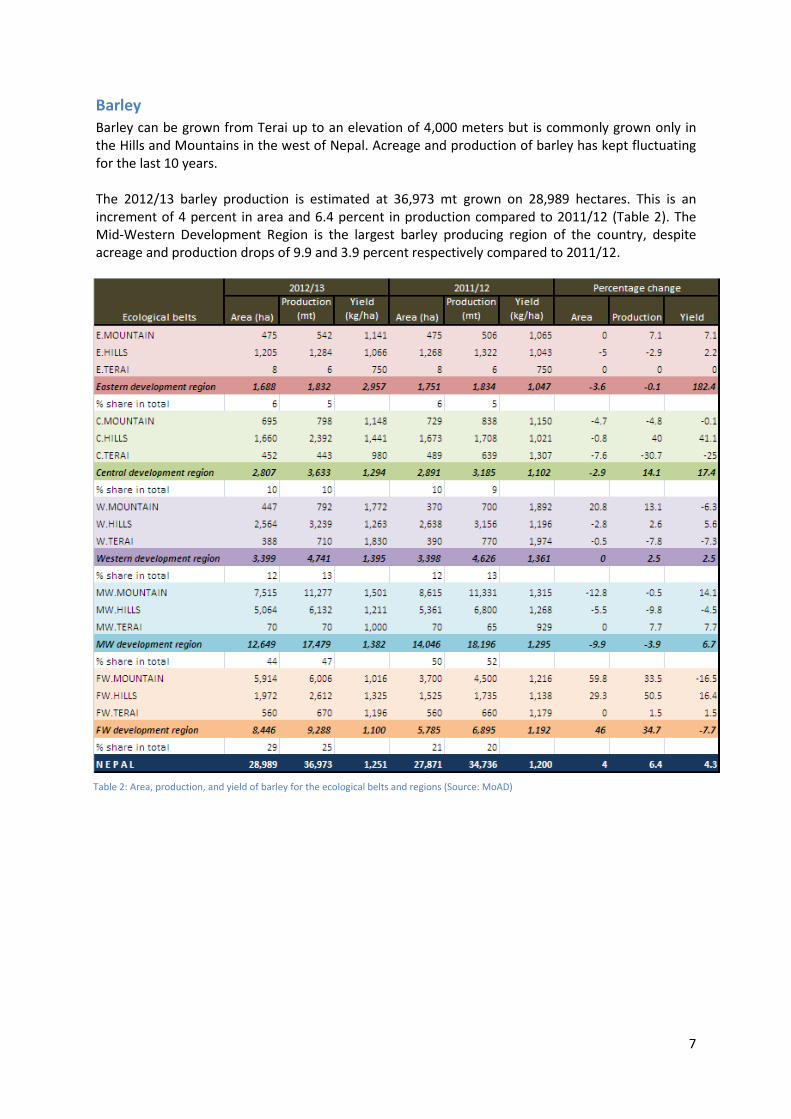
Barley Barley can be grown from Terai up to an elevation of 4,000 meters but is commonly grown only in the Hills and Mountains in the west of Nepal. Acreage and production of barley has kept fluctuating for the last 10 years. The 2012/13 barley production is estimated at 36,973 mt grown on 28,989 hectares. This is an increment of 4 percent in area and 6.4 percent in production compared to 2011/12 (Table 2). The Mid-Western Development Region is the largest barley producing region of the country, despite acreage and production drops of 9.9 and 3.9 percent respectively compared to 2011/12.
Table 2: Area, production, and yield of barley for the ecological belts and regions (Source: MoAD)

8
2012/13 National Crop Output
CEREALS
The total cereal output for FY 2012/13 is estimated at 8.74 million mt, some 8 percent lower than
2011/12. The cereal acreage has been estimated at 3.34 million hectares. Cereal yields have
decreased by 4
percent with an
average of 2,613
kilo/ha.
Paddy remains the largest crop in terms of acreage and production. It occupies 42.5 percent of the cereal area and contributes 51.5 percent to the total cereal output. Maize and wheat are the second and third largest crops, occupying 25.4 and 22.7 percent of cereal area and contributing 22.9 and 21.5 percent to the overall cereal production. Acreage and production of other cereals like millet, barley, and buckwheat are marginal (Figure 5). Edible cereal is projected at 5.6 million mt. The Central Terai, Western Hill, and Eastern Terai record
largest edible cereal production of 915, 827, and 708 thousands mt respectively (Map-1). The
Western mountain with a production of 3,000 thousands mt has the lowest edible cereal output in
2012/13.
Map-1: Edible cereal grain output 2012/13 (Source: MoAD)
Figure 5: Production and area of major cereals (2012/13) (Source: MoAD)

9
130
140
150
160
170
180
190
200
1.5
1.7
1.9
2.1
2.3
2.5
2.7
Are
a (T
ho
usa
nd
s h
a)
Pro
du
ctio
n (
mill
ion
s m
t)
Production Area
10
20
30
40
50
60
70
80
120
220
320
420
520
620
720
820
920
1020
Eastern Central Western Far WesternMid Western
Are
a ('
00
0 h
a)
Pro
du
ctio
n (
'00
0 m
t)
Production Area
OTHER CROPS
Potato
Potatoes are grown in Nepal (in all 75 districts), at below 100 m altitude in the south (Terai) to as
high as 4,000 m in the north (Mountains). The consumption, however, is larger in the Mountains
where potato is consumed as
a staple food in some areas.
In the lower lying areas,
potato makes an essential
ingredient of Nepalese
vegetable.
In Nepal, potato can be
grown in summer and
winter. In Terai belt potato is
grown only in winter,
whereas in the Hills and
Mountains it is grown both in
both seasons—summer and
winter. Winter potato is
grown from Oct/Nov to
Feb/March, and summer is
grown during Feb/March to
July/ August.
Acreage, production, and yield of potato have increased over the last 10 years, with significant
improvement after 2007/08
(Figure 6). Since then average
annual increment in acreage and
production is estimated 5 percent
per year. In 2012/13, potato has
been grown in some 191
thousands ha, and the production
is estimated at around 2.5 million
mt.
Eastern and central region
continue to record largest share in
the national potato production
(Figure 7).
Lentils
Lentils recorded positive growth in acreage, production, and productivity. With some marginal
increment in acreage, lentils recorded a production and productivity growth of 12 percent. With a
combined productivity of 1,070 kilo/ha, total production has been estimated at 356,743 mt
produced on 333,436 ha. Oil seeds recorded a marginal drop (1 percent) in acreage and production-
179,000 mt from 215,600 ha.
Figure 6: Area and production of potato 2002/03 to 2012/13 (Source: MoAD and NeKSAP)
Figure 7: Area and production of potato 2012/13 (Source: NeKSAP consultation)
10
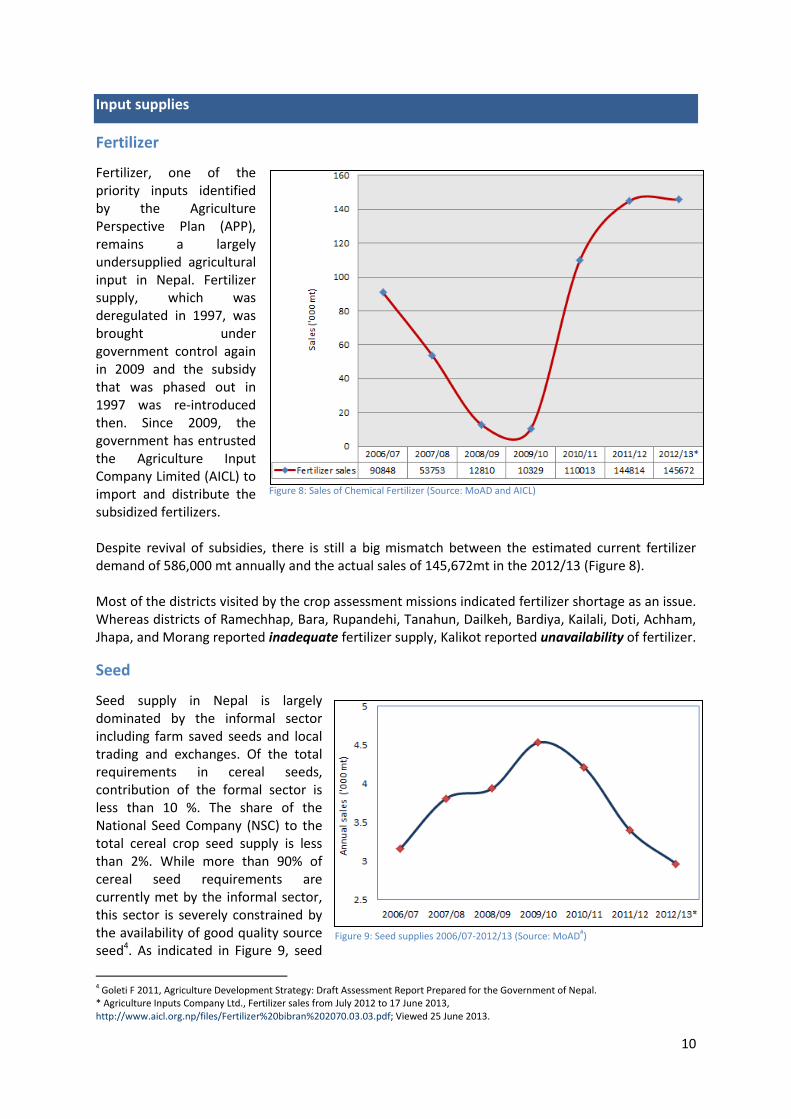
Figure 8: Sales of Chemical Fertilizer (Source: MoAD and AICL)
Figure 9: Seed supplies 2006/07-2012/13 (Source: MoAD#)
Input supplies
Fertilizer
Fertilizer, one of the priority inputs identified by the Agriculture Perspective Plan (APP), remains a largely undersupplied agricultural input in Nepal. Fertilizer supply, which was deregulated in 1997, was brought under government control again in 2009 and the subsidy that was phased out in 1997 was re-introduced then. Since 2009, the government has entrusted the Agriculture Input Company Limited (AICL) to import and distribute the subsidized fertilizers. Despite revival of subsidies, there is still a big mismatch between the estimated current fertilizer demand of 586,000 mt annually and the actual sales of 145,672mt in the 2012/13 (Figure 8). Most of the districts visited by the crop assessment missions indicated fertilizer shortage as an issue. Whereas districts of Ramechhap, Bara, Rupandehi, Tanahun, Dailkeh, Bardiya, Kailali, Doti, Achham, Jhapa, and Morang reported inadequate fertilizer supply, Kalikot reported unavailability of fertilizer.
Seed
Seed supply in Nepal is largely dominated by the informal sector including farm saved seeds and local trading and exchanges. Of the total requirements in cereal seeds, contribution of the formal sector is less than 10 %. The share of the National Seed Company (NSC) to the total cereal crop seed supply is less than 2%. While more than 90% of cereal seed requirements are currently met by the informal sector, this sector is severely constrained by the availability of good quality source seed4. As indicated in Figure 9, seed
4 Goleti F 2011, Agriculture Development Strategy: Draft Assessment Report Prepared for the Government of Nepal. * Agriculture Inputs Company Ltd., Fertilizer sales from July 2012 to 17 June 2013, http://www.aicl.org.np/files/Fertilizer%20bibran%202070.03.03.pdf; Viewed 25 June 2013.
11
supply by Nepal Seed Company Limited is at the lowest level for last five years, almost to the levels of 2006/07. Unavailability of quality seeds in time was also stated as a problem by stakeholders and communities during interaction by the joint crop assessment missions, especially in the district of Ramechhap, Manang, Sindhupalchowk, Kailali, Achham, Dailekh, Bardiya, and Kalikot.
Agricultural Mechanization
There has been considerable progress in agricultural mechanization in Nepal. Mostly, agricultural mechanization is taking place in the Terai and, to a lesser extent, in the Hills and Mountains. For instance, while the mission found that almost 70 percent of ploughing in Terai (Rupandehi, Bara, Morang, Jhapa, Morang, and Kailali) was done by tractors and power tillers, whereas only 5-10 percent area was under power tiller coverage in the Hills. The coverage of combine harvester, thresher, and corn Sheller is very low. In most of the cases, machines are owned by groups/cooperatives and private individuals renting out to farmers rather than individual farmer owning the machines. For instance, in Rupandehi some 30-40 combine harvesters are owned by private individuals, who rent it out to the farmers @ NPR 1,500/ hour. Similarly, the rental charge for tractor was reported NPR 800/hour. Agricultural mechanization is an evolution of agriculture over time and a response to labor shortages. During the crop assessment missions, stakeholders and communities indicated that mechanization has reduced production costs. For instance in Morang, it was reported that using tractor and power tiller for ploughing saves 30-40 percent of the cost.
# Figures for 2006/07 to 2011/12 are based on published data of the MoAD, Statistical Information on Nepalese Agriculture 2011/12; and for 2012/13 are based on the preliminary estimates 2012/13 of the MoAD.
12
Food Market Situation
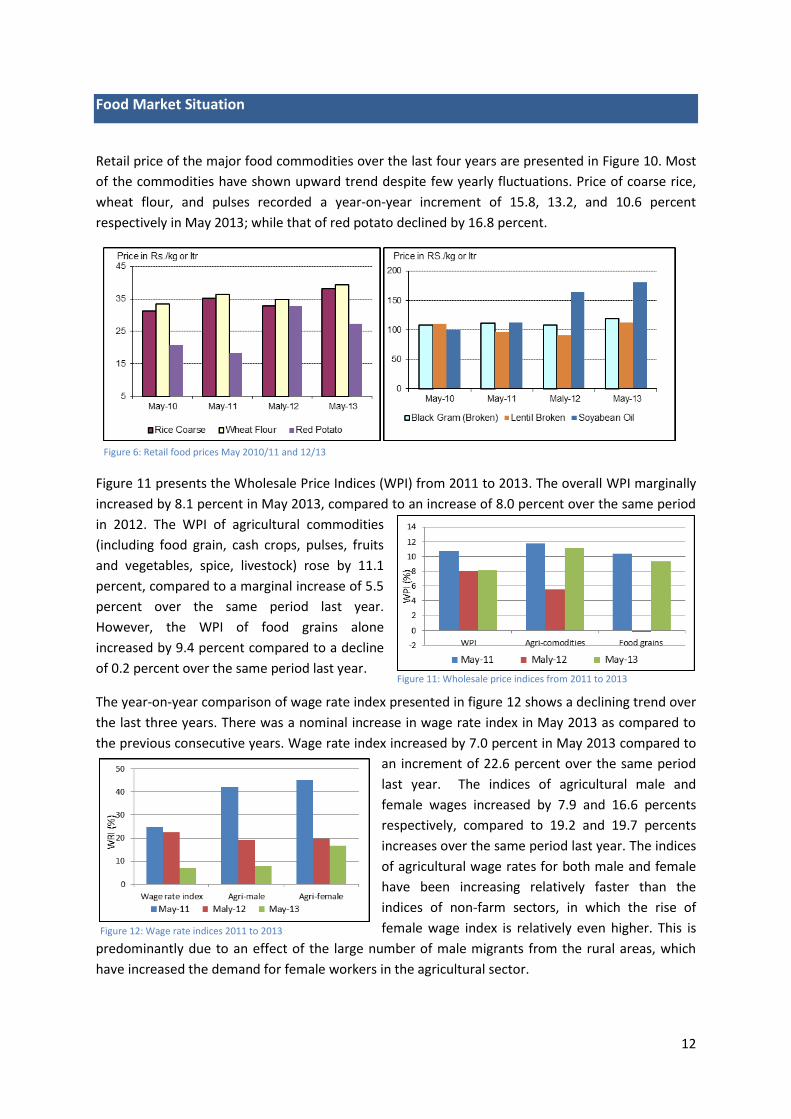
Retail price of the major food commodities over the last four years are presented in Figure 10. Most
of the commodities have shown upward trend despite few yearly fluctuations. Price of coarse rice,
wheat flour, and pulses recorded a year-on-year increment of 15.8, 13.2, and 10.6 percent
respectively in May 2013; while that of red potato declined by 16.8 percent.
Figure 11 presents the Wholesale Price Indices (WPI) from 2011 to 2013. The overall WPI marginally
increased by 8.1 percent in May 2013, compared to an increase of 8.0 percent over the same period
in 2012. The WPI of agricultural commodities
(including food grain, cash crops, pulses, fruits
and vegetables, spice, livestock) rose by 11.1
percent, compared to a marginal increase of 5.5
percent over the same period last year.
However, the WPI of food grains alone
increased by 9.4 percent compared to a decline
of 0.2 percent over the same period last year.
The year-on-year comparison of wage rate index presented in figure 12 shows a declining trend over
the last three years. There was a nominal increase in wage rate index in May 2013 as compared to
the previous consecutive years. Wage rate index increased by 7.0 percent in May 2013 compared to
an increment of 22.6 percent over the same period
last year. The indices of agricultural male and
female wages increased by 7.9 and 16.6 percents
respectively, compared to 19.2 and 19.7 percents
increases over the same period last year. The indices
of agricultural wage rates for both male and female
have been increasing relatively faster than the
indices of non-farm sectors, in which the rise of
female wage index is relatively even higher. This is
predominantly due to an effect of the large number of male migrants from the rural areas, which
have increased the demand for female workers in the agricultural sector.
Figure 11: Wholesale price indices from 2011 to 2013
Figure 6: Retail food prices May 2010/11 and 12/13
Figure 12: Wage rate indices 2011 to 2013

13
Trade Overview5
As reported by the Trade and Export Promotion Centre (TEPC), value of foreign trade during the first nine months of the Fiscal Year 2012/13 (July 2012 to March 2013) stood at NPR 498.35 billion; an increment of 19.10 percent compared to the same period last year. Share of export and import in trade stood at 11.3 (NPR 56.53 billion) and 88.7 (NPR 441.82 billion) percents respectively, showing a large trade deficit. Cereals recorded 3.25 percent share (worth NPR 14 billion) in total import during the period, which over the same period last year was measured at 2.27 percent (worth NPR 8.2 billion). Rice continues to record the largest share of cereal import 69.1 percent of import volume (393,370 mt) and 73.5 percent of the value (NPR 10.82 billion) followed by corn (maize) and wheat with their share in total import value recorded at 23.3 and 1.7 percents respectively (Figure 7 and Table 3).
5 Based on Government of Nepal, Ministry of Commerce and Supplies, Trade and Export Promotion Centre (TEPC), http://208.67.23.5/~itsoftc/projects/tepc/commoditywise.php?txtmode=search; viewed 27 June 2013 * Agriculture Inputs Company Ltd., Fertilizer sales from July 2012 to 17 June 2013, http://www.aicl.org.np/files/Fertilizer%20bibran%202070.03.03.pdf; Viewed 25 June 2013. ** Provisional data for first eight months of Nepali Fiscal Year 2069/70
Figure 7: Import of cereals (July 2012-March 2013), Source: TEPC
Table 3: Export and import of cereals 2009/10 to 2012/13**

14
On the export front lentil, cardamom, tea, and ginger are the key items of export with their export value recorded at 2.4, 2.6, 1.4, and 1.0 billion NPR. While the export value of cardamom dropped by some 1.6 percent compared to same period last year, other commodities recorded significant improvement in export, up to 242.8 percent increment for ginger.
Global and Regional Production Overview
World cereal production is forecasted to increase by about 6 percent in 2013 to about 2,708 million mt, recovering from the previous year’s reduced level to just above the trend of the past ten years. FAO’s latest forecast (as of May 2013) for the global wheat production stands at 695 million mt, some 5.4 percent above the last year's harvest and some 6 million mt below the record level production of 2011. Production estimates for 2013 are based on huge production in Europe (138 million mt), mainland China (121 million mt), and India (93 million mt).
In India, the third advance estimate of crop production released by the Ministry of Agriculture on the
3rd of May 2013 has estimated a total grain output of 255.36 million mt. Production of rice, wheat,
and maize is 104.22, 93.62, and 21.82 million mt respectively. Food grain production this year is the
second highest ever achieved despite low and erratic monsoon rains during the monsoon season. In
2011-12, India had produced 259.32 million mt food grains6.
6http://pib.nic.in/newsite/PrintRelease.aspx?relid=95562

15
Figure 14: Edible cereal production and requirement 2003/04- 2012/13 (Source: MoAD)
National Food Balance7
The total cereal requirement in the country is estimated at 5.2 million mt, which is some 1.7 percent
above the cereal requirement of 2011/12. Despite rising demand and decreased production, the
country still has 408.4 thousands mt of edible cereal food in balance, which is 53.9 percent lower
than the last year (Table 4).
Year 2007/08 2008/09 2009/10 2010/11 2011/12 2012/13 Average 2007/08 to 2011/12
% change to normal
% change to 2011/12
Total production ('000 mt)
7,329 8,069.1 8,114.1 8,615.4 9,457.6 8,738 8,317.04 5.1 -7.6
Edible production ('000 mt)
5,195.2 5,170.4 4,967.5 5,512.9 6,037.7 5,648.3 5,376.74 5.0 -6.5
Requirement ('000 mt)
5,172.8 5,303.3 5,297.4 5,069.8 5,151.4 5,239.8 5,198.94 0.8 1.7
Balance ( '000 mt)
22.4 -132.9 -329.9 443.1 886.3 408.4 177.8 129.7 -53.9
Balance (% of requirement)
0.4 -2.5 -6.2 8.7 17.2 7.8
For the last two years, the country has been able to maintain edible cereal food production above
the national requirement.
2011/12 recorded the
largest production of
edible cereals at 6.04
million mt. For last ten
years, 2006/07 and
2009/10 were the ones
with the lowest recorded
edible cereal production
years (Figure 14). Hence,
during those years the
national edible cereal
production was lower than
the requirement.
7 This section is based on the domestic production only and doesn't take into account the supplies maintained by imports.
Table 4: National cereal production, requirement, and balance 2007/08- 2012/13 (Source: MoAD)

16
Despite positive aggregate national balance, domestic production is not enough to meet the rice
demand, which is largely attributed to the preference attached to rice consumption in Nepal. Hence,
a supply gap of 904,696 mt is anticipated for rice (Table 5).
Food Items Population Actual Consumption (kg/person/year)
Requirement (mt)
Availability (mt)
+ Gap (mt)
Rice 27,539,608 122.00 3,359,832 2,455,136 -904,696
Maize 27,539,608 41.60 1,145,648 1,408,017 262,369
Wheat 27,539,608 17.00 468,173 1,518,631 1,050,458
Millet 27,539,608 9.00 247,856 248,168 312
Barley 27,539,608 0.37 10,052 10,174 122
Buckwheat 27,539,608 0.29 7,986 8,136 150
Total 27,539,608 190.26 5,239,548 5,648,262 408,714
Table 5: Food wise requirement and gap (Source: MoAD)
Positive aggregate national cereal balance, however, doesn't imply that food availability is not a
concern. In fact, despite the food balance being maintained at national level, sub-national disparities
do exist with regard to cereal production and requirement. The Terai is the only region to maintain a
balance of 429,238 mt while the Hills and Mountains have deficits of 5,029 and 15,767 mt,
respectively (Map-2, and Annex 1). With respective edible cereal balance of 254, 268; 201, 218; and
180, 692 mt, the Western Hills, Western Terai, and Eastern Hills observe the largest cereal balance in
2012/13. Other regions with net positive cereal balance include Far-Western Terai, Central Terai,
Mid-Western Hills, Eastern Mountains, and Central Mountains. The Far-Western Hills and
Mountains, Mid-Western Hills and Mountains, Western Mountains, Central Mountains, Central Hills,
and Eastern Terai are expected to observe deficits of varying degrees; altogether 33 districts are
deficits (Annex 1). Eleven districts, most of which are in the Mountains of the Mid-Western, Far-
Western, and Central Development Regions are expected to observe the largest food deficit, with
local demand exceeding the production by more than 30 percent; similarly, 14 districts are expected
to experience edible cereal deficits of 10-30% (Map-3). Rupandehi district has recorded the largest
surplus of 89,708 mt, which is about 53 percent above the requirement.

17
Map-2: Edible cereal food balance at sub-regional level (Source: MoAD)
Map-3: Food self sufficiency at district level (Source: MoAD)

18
Conclusion
The overall weather conditions in 2012/13 were not too favorable and as a consequence reduced the summer crop (paddy, maize, and millet) production by 10.01 percent. Winter crops (wheat and barley), however, recorded an increment of 2.03 percent. Total cereal output for FY 2012/13 is estimated at 8.74 million mt, 7.6 percent lower than 2011/12. At 8.74 million mt, net edible cereal output is estimated at 5.3 million mt against a cereal requirement of 5.2 million mt. The national food balance is positive at 408.4 thousands mt. The national food balance, however, excludes the food supplies maintained through imports. During the first nine months of the Nepali Fiscal Year 2069/70 (2012/13), some 0.57 million mt (worth NPR 14.72 billion) of cereal food was imported.
2013/14 Summer crop outlook
The joint crop assessment mission found normal growth of the spring season crops (especially
maize) and paddy. Due to the favorable weather conditions, spring season production is expected as
normal.
The South Asian Climate Outlook Forum (SASCOF-4) has suggested a normal monsoon over South
Asia with a slightly above the normal level in Nepal8.With timely and adequate level of monsoon,
paddy and other summer crops (maize and millet) production is expected to be normal.
Though production has declined compared to last year, the country still has net food balance.
Nevertheless, the country still faces rice deficit of 905 thousands mt, which has to be met by
imports. Hence, with current production and imports, food availability situation is not expected to
deteriorate exceptionally.
8http://hydrology.gov.np/new/bull3/index.php/hydrology/other/current_forecast; Viewed 28 June 2013.

19
Acknowledgments
This report is a joint product of the Ministry of Agricultural Development (MoAD), World Food Programme (WFP), and Food and Agriculture Organization (FAO). Thanks are due to staff members of the Agribusiness Promotion and Market Development Division (ABPMDD) of the MoAD, and the Department of Agriculture, as well as staff members of the World Food Programme (WFP), and Food and Agriculture Organization (FAO).
This product is funded by the European Union.
The views expressed in this publication do not necessarily
reflect the views of the European Union.

20
Annex 1: 2012/13 DISTRICT-WISE CROP PRODUCTION, CEREAL REQUIREMENT, AND BALANCE (mt)
DISTRICT PADDY MAIZE MILLET BUCKWHEAT WHEAT BARLEY TOTAL CEREAL
NET EDIBLE REQUIREMENT BALANCE*
TAPLEJUNG 10,913.00 27,450.00 3,507.00 165.00 3,600.00 312.00 45,947.00 32,175.85 24,329.00 7,846.85
SANKHUWASHAVA 23,701.00 22,226.00 10,180.00 10.00 3,000.00 30.00 59,147.00 37,427.65 30,510.00 6,917.65
SOLUKHUMBU 3,366.00 32,517.00 2,520.00 138.00 7,300.00 200.00 46,041.00 35,106.06 20,359.00 14,747.06
E.MOUNTAIN 37,980.00 82,193.00 16,207.00 313.00 13,900.00 542.00 151,135.00 104,709.56 75,198.00 29,511.56
PANCHTHAR 22,600.00 12,240.00 9,350.00 36.00 7,632.00 552.00 52,410.00 32,050.79 39,725.00 (7,674.21)
ILLAM 45,185.00 78,385.00 2,670.00 17.00 12,960.00 50.00 139,267.00 99,213.22 60,009.00 39,204.22
TERHATHUM 23,784.00 26,288.00 3,300.00 28.00 5,900.00 83.00 59,383.00 38,663.96 20,033.00 18,630.96
DHANKUTA 18,859.00 39,312.00 7,780.00 0.00 3,385.00 10.00 69,346.00 48,699.55 32,898.00 15,801.55
BHOJPUR 44,299.00 76,470.00 4,404.00 12.00 5,520.00 25.00 130,730.00 93,968.96 36,275.00 57,693.96
KHOTANG 30,248.00 69,232.00 24,512.00 405.00 12,535.00 430.00 137,362.00 101,204.46 41,230.00 59,974.46
OKHALDHUNGA 14,361.00 26,040.00 9,998.00 91.00 5,031.00 100.00 55,621.00 38,887.72 29,494.00 9,393.72
UDAYAPUR 43,594.00 23,275.00 5,031.00 19.00 16,286.00 34.00 88,239.00 53,932.73 66,265.00 (12,332.27)
E.HILLS 242,930.00 351,242.00 67,045.00 608.00 69,249.00 1,284.00 732,358.00 506,621.39 325,929.00 180,692.39
JHAPA 320,790.00 82,140.00 1,785.00 1,265.00 21,750.00 6.00 427,736.00 254,447.93 151,998.00 102,449.93
MORANG 259,289.00 5,379.00 1,812.00 65.00 36,438.00 - 302,983.00 204,631.94 179,681.00 24,950.94
SUNSARI 160,650.00 27,000.00 1,078.00 380.00 43,500.00 - 232,608.00 137,288.34 141,463.00 (4,174.66)
SAPTARI 60,388.00 750.00 215.00 0.00 40,000.00 - 101,353.00 64,737.28 120,108.00 (55,370.72)
SIRAHA 53,814.00 3,150.00 574.00 0.00 29,800.00 - 87,338.00 47,020.38 119,303.00 (72,282.62)
E.TERAI 854,931.00 118,419.00 5,464.00 1,710.00 171,488.00 6.00 1,152,018.00 708,125.87 712,553.00 (4,427.13)
E.REGION 1,135,841.00 551,854.00 88,716.00 2,631.00 254,637.00 1,832.00 2,035,511.00 1,319,456.81 1,113,680.00 205,776.81
DOLAKHA 5,625.00 10,485.00 4,200.00 401.00 6,278.00 210.00 27,199.00 15,937.41 35,381.00 (19,443.59)
SINDHUPALCHOK 26,486.00 50,833.00 21,252.00 0.00 9,336.00 205.00 108,112.00 77,457.59 54,695.00 22,762.59
RASUWA 2,982.00 3,549.00 791.00 0.00 1,720.00 383.00 9,425.00 5,382.84 8,330.00 (2,947.16)
C.MOUNTAIN 35,093.00 64,867.00 26,243.00 401.00 17,334.00 798.00 144,736.00 98,777.83 98,406.00 371.83
RAMECHAP 26,530.00 51,355.00 4,425.00 20.00 8,180.00 142.00 90,652.00 63,880.54 40,993.00 22,887.54
SINDHULI 34,910.00 44,410.00 9,196.00 269.00 14,230.00 78.00 103,093.00 70,325.39 59,847.00 10,478.39
KAVRE 36,350.00 48,334.00 3,506.00 600.00 20,905.00 1,425.00 111,120.00 69,184.78 78,556.00 (9,371.22)
BHAKTAPUR 25,653.00 7,876.00 150.00 11,559.00 55.00 45,293.00 26,155.37 65,171.00 (39,015.63)
LALITPUR 25,272.00 24,049.00 690.00 54.00 12,340.00 70.00 62,475.00 37,605.06 101,127.00 (63,521.94)
KATHMANDU 48,500.00 27,203.00 850.00 5.00 16,138.00 8.00 92,704.00 55,790.25 393,879.00 (338,088.75)
NUWAKOT 57,500.00 41,434.00 9,153.00 65.00 15,062.00 228.00 123,442.00 78,184.01 55,654.00 22,530.01
DHADING 33,349.00 24,383.00 6,445.00 12,101.00 360.00 76,638.00 46,126.64 67,490.00 (21,363.36)
MAKWANPUR 36,663.00 63,114.00 3,257.00 159.00 12,150.00 26.00 115,369.00 79,031.89 87,461.00 (8,429.11)
C.HILLS 324,727.00 332,158.00 37,672.00 1,172.00 122,665.00 2,392.00 820,786.00 526,283.94 950,178.00 (423,894.06)
DHANUSHA 125,054.00 6,662.00 300.00 0.00 108,000.00 1.00 240,017.00 157,045.22 143,130.00 13,915.22
MAHOTTARI 83,584.00 1,500.00 0.00 0.00 63,312.00 10.00 148,406.00 94,207.83 120,961.00 (26,753.17)
SARLAHI 92,905.00 19,677.00 950.00 0.00 65,750.00 275.00 179,557.00 116,781.30 145,005.00 (28,223.70)
RAUTAHAT 67,575.00 5,544.00 51.00 0.00 48,050.00 5.00 121,225.00 76,216.47 133,099.00 (56,882.53)
BARA 231,880.00 21,120.00 91.00 0.00 94,600.00 63.00 347,754.00 217,919.05 133,410.00 84,509.05
PARSA 164,360.00 14,263.00 77.00 0.00 81,600.00 39.00 260,339.00 165,867.37 113,532.00 52,335.37
CHITWAN 94,800.00 10,500.00 1,650.00 0.00 30,125.00 50.00 137,125.00 87,147.90 106,718.00 (19,570.10)
C.TERAI 860,158.00 79,266.00 3,119.00 491,437.00 443.00 1,434,423.00 915,185.14 895,855.00 19,330.14
C.REGION 1,219,978.00 476,291.00 67,034.00 1,573.00 631,436.00 3,633.00 2,399,945.00 1,540,246.90 1,944,439.00 (404,192.10)
MANANG 0.00 485.00 0.00 447.00 568.00 292.00 1,792.00 1,179.98 1,168.00 11.98
MUSTANG 0.00 770.00 0.00 955.00 1,080.00 500.00 3,305.00 2,203.69 2,594.00 (390.31)
W.MOUNTAIN 0.00 1,255.00 0.00 1,402.00 1,648.00 792.00 5,097.00 3,383.67 3,762.00 (378.33)
GORKHA 37,555.00 45,471.00 13,926.00 395.00 7,234.00 118.00 104,699.00 72,844.03 53,444.00 19,400.03
LAMJUNG 42,115.00 35,654.00 9,936.00 17.00 1,275.00 25.00 89,022.00 60,063.07 33,682.00 26,381.07
TANAHU 48,168.00 71,630.00 6,710.00 184.00 3,662.00 6.00 130,360.00 89,790.25 67,096.00 22,694.25
KASKI 78,256.00 42,549.00 17,094.00 16.00 16,100.00 113.00 154,128.00 97,733.38 104,352.00 (6,618.62)
PARBAT 26,281.00 30,023.00 7,630.00 37.00 6,522.00 105.00 70,598.00 48,446.11 29,161.00 19,285.11
SYANGJA 60,829.00 92,675.00 19,326.00 140.00 11,150.00 9.00 184,129.00 130,539.51 56,832.00 73,707.51

21
DISTRICT PADDY MAIZE MILLET BUCKWHEAT WHEAT BARLEY TOTAL CEREAL
NET EDIBLE REQUIREMENT BALANCE*
PALPA 32,292.00 40,368.00 2,588.00 419.00 13,737.00 37.00 89,441.00 60,216.79 54,176.00 6,040.79
MYAGDI 12,060.00 39,665.00 3,390.00 50.00 6,096.00 406.00 61,667.00 45,743.82 22,831.00 22,912.82
BAGLUNG 18,316.00 56,682.00 21,989.00 119.00 13,298.00 1,223.00 111,627.00 83,917.73 54,315.00 29,602.73
GULMI 22,312.00 58,542.00 2,589.00 205.00 16,048.00 627.00 100,323.00 73,723.88 56,497.00 17,226.88
ARGHAKHANCHI 25,437.00 49,441.00 606.00 245.00 13,698.00 570.00 89,997.00 63,618.07 39,983.00 23,635.07
W.HILLS 403,621.00 562,700.00 105,784.00 1,827.00 108,820.00 3,239.00 1,185,991.00 826,636.65 572,369.00 254,267.65
NAWALPARASI 179,110.00 35,025.00 495.00 115.00 50,269.00 100.00 265,114.00 160,753.00 118,081.00 42,672.00
RUPANDEHI 319,695.00 10,530.00 0.00 0.00 97,840.00 210.00 428,275.00 258,382.79 168,675.00 89,707.79
KAPILBASTU 205,118.00 3,350.00 0.00 0.00 81,248.00 400.00 290,116.00 175,742.99 106,904.00 68,838.99
W.TERAI 703,923.00 48,905.00 495.00 115.00 229,357.00 710.00 983,505.00 594,878.78 393,660.00 201,218.78
W.REGION 1,107,544.00 612,860.00 106,279.00 3,344.00 339,825.00 4,741.00 2,174,593.00 1,424,899.10 969,791.00 455,108.10
DOLPA 570.00 224.00 273.00 632.00 6,300.00 500.00 8,499.00 5,703.02 7,354.00 (1,650.98)
MUGU 2,700.00 1,170.00 4,500.00 500.00 7,917.00 1,860.00 18,647.00 12,395.47 11,119.00 1,276.47
HUMLA 915.00 171.00 1,280.00 603.00 1,173.00 847.00 4,989.00 2,559.08 10,249.00 (7,689.92)
JUMLA 6,490.00 5,400.00 4,560.00 290.00 5,390.00 7,320.00 29,450.00 16,880.05 21,675.00 (4,794.95)
KALIKOT 6,240.00 5,215.00 1,291.00 148.00 9,545.00 750.00 23,189.00 15,727.36 28,928.00 (13,200.64)
MW.MOUNTAIN 16,915.00 12,180.00 11,904.00 2,173.00 30,325.00 11,277.00 84,774.00 53,264.98 79,325.00 (26,060.02)
RUKUM 10,330.00 16,013.00 922.00 0.00 26,550.00 1,156.00 54,971.00 39,673.19 43,402.00 (3,729.00)
ROLPA 11,787.00 16,304.00 1,059.00 65.00 15,979.00 710.00 45,904.00 31,491.60 46,387.00 (14,895.00)
PYUTHAN 18,950.00 18,351.00 2,005.00 11.00 19,465.00 790.00 59,572.00 40,278.53 48,282.00 (8,003.00)
SALYAN 23,294.00 22,242.00 2,204.00 80.00 29,226.00 1,485.00 78,531.00 53,120.04 50,348.00 2,772.00
JAJARKOT 10,403.00 11,930.00 3,859.00 31.00 14,886.00 360.00 41,469.00 28,828.77 36,652.00 (7,823.00)
DAILEKH 25,953.00 36,975.00 2,643.00 20.00 27,219.00 261.00 93,071.00 65,820.84 54,866.00 10,955.00
SURKHET 48,869.00 43,407.00 2,750.00 0.00 46,015.00 1,370.00 142,411.00 99,040.53 76,017.00 23,024.00
MW.HILLS 149,586.00 165,222.00 15,442.00 207.00 179,340.00 6,132.00 515,929.00 358,253.49 355,954.00 2,301.00
DANG 157,384.00 46,891.00 20.00 0.00 29,995.00 50.00 234,340.00 142,910.49 105,184.00 37,726.00
BANKE 109,226.00 29,760.00 0.00 0.00 55,900.00 10.00 194,896.00 123,156.26 94,263.00 28,893.00
BARDIYA 159,575.00 20,000.00 0.00 0.00 74,400.00 10.00 253,985.00 159,598.49 79,077.00 80,521.00
MW.TERAI 426,185.00 96,651.00 20.00 0.00 160,295.00 70.00 683,221.00 425,665.25 278,524.00 147,140.00
MW.REGION 592,686.00 274,053.00 27,366.00 2,380.00 369,960.00 17,479.00 1,283,924.00 837,183.72 713,803.00 123,380.98
BAJURA 7,613.00 1,817.00 2,610.00 11.00 8,831.00 1,500.00 22,382.00 12,762.27 27,169.00 (14,407.00)
BAJHANG 20,528.00 6,573.00 2,057.00 4.00 21,964.00 2,836.00 53,962.00 34,290.59 38,813.00 (4,522.00)
DARCHULA 11,027.00 11,261.00 786.00 80.00 13,312.00 1,670.00 38,136.00 25,690.50 25,973.00 (283.00)
FW.MOUNTAIN 39,168.00 19,651.00 5,453.00 95.00 44,107.00 6,006.00 114,480.00 72,743.35 91,955.00 (19,212.00)
ACHHAM 31,138.00 9,525.00 3,310.00 0.00 24,145.00 563.00 68,681.00 43,858.14 53,068.00 (9,210.00)
DOTI 22,844.00 5,240.00 5,810.00 8.00 33,915.00 240.00 68,057.00 45,232.00 42,773.00 2,459.00
BAITADI 14,280.00 18,850.00 910.00 0.00 24,000.00 1,600.00 59,640.00 40,146.20 51,443.00 (11,297.00)
DADELDHURA 16,414.00 8,236.00 260.00 0.00 18,985.00 209.00 44,104.00 28,799.57 29,148.00 (348.00)
FW.HILLS 84,676.00 41,851.00 10,290.00 8.00 101,045.00 2,612.00 240,482.00 158,035.91 176,432.00 (18,396.00)
KAILALI 185,980.00 12,000.00 450.00 25.00 69,000.00 660.00 268,115.00 159,703.31 146,450.00 13,253.00
KANCHANPUR 138,630.00 10,450.00 0.00 0.00 72,210.00 10.00 221,300.00 135,995.76 83,273.00 52,723.00
FW.TERAI 324,610.00 22,450.00 450.00 25.00 141,210.00 670.00 489,415.00 295,699.07 229,723.00 65,976.00
FW.REGION 448,454.00 83,952.00 16,193.00 128.00 286,362.00 9,288.00 844,377.00 526,478.34 498,110.00 28,368.00
N E P A L 4,504,503.00 1,999,010.00 305,588.00 10,056.00 1,882,220.00 36,973.00 8,738,350.00 5,648,264.87 5,239,823.00 408,441.79
Note*: Figures in parentheses indicate deficit (Source: MoAD)


