Mobilizing greater crop and land potentials: replacing the faltering engine
Upload
essp2Category
view
95download
2
Growth trends and potential for crop and livestock productivity
Fantu Bachewe; Guush Berhane; and Bart MintenIFPRI
The Future of Ethiopia’s Agriculture: Towards a Resilient System to End
Hunger and Undernutrition
Addis Ababa HiltonDecember 15, 2017Addis Ababa
1
Presentation plan
Overview: role of agriculture in the overall economy
Livestock production and productivity in the last decade
(Fantu)
Crop production, productivity and drivers (Guush)
Looking into the future: Ethiopia’s agriculture in the context
of selected countries
CSA data is used unless otherwise mentioned
ETHIOPIAN DEVELOPMENT RESEARCH INSTITUTE
Crop productivity in Ethiopia: Growth trends, drivers, and potentials
Presenter: Guush Berhane
3
4
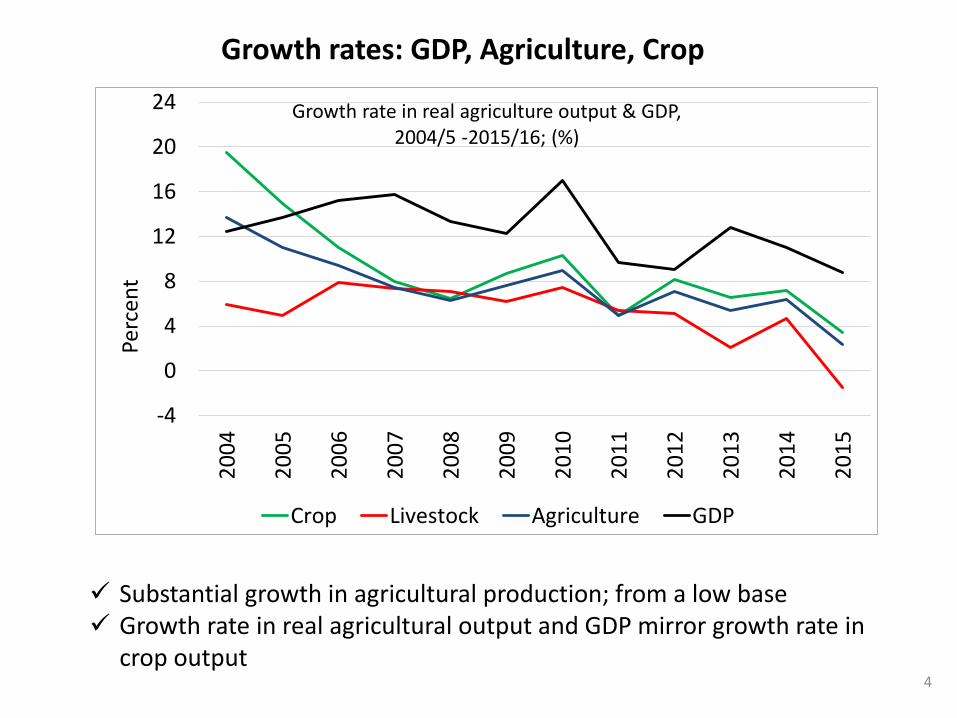
Growth rates: GDP, Agriculture, Crop
-4
0
4
8
12
16
20
24
20
04
20
05
20
06
20
07
20
08
20
09
20
10
20
11
20
12
20
13
20
14
20
15
Perc
ent
Growth rate in real agriculture output & GDP, 2004/5 -2015/16; (%)
Crop Livestock Agriculture GDP
Substantial growth in agricultural production; from a low base Growth rate in real agricultural output and GDP mirror growth rate in
crop output
5
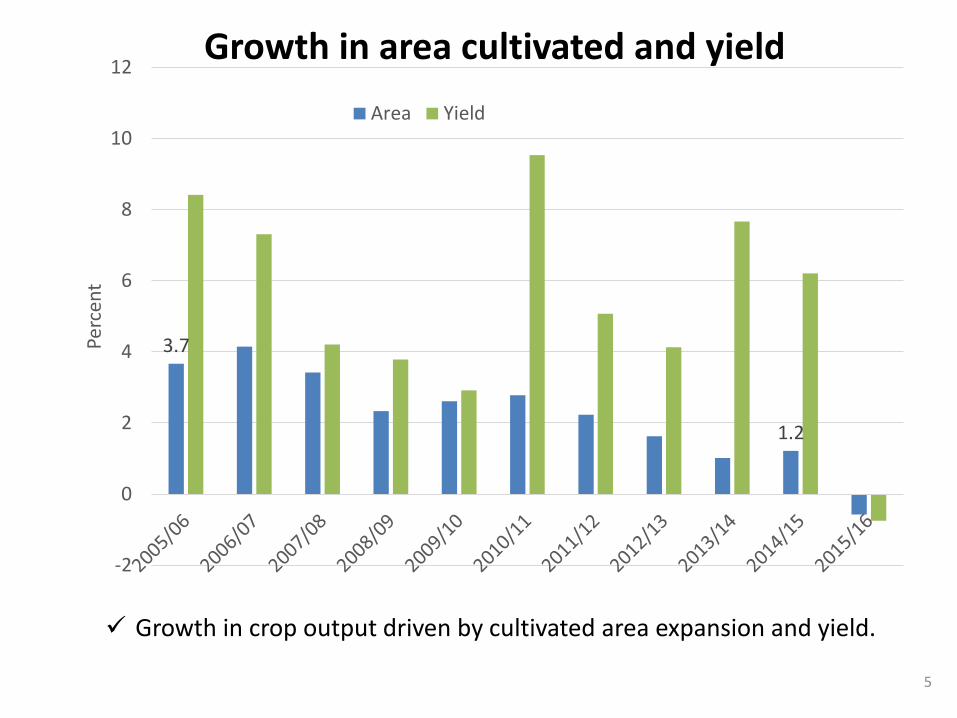
Growth in area cultivated and yield
3.7
1.2
-2
0
2
4
6
8
10
12
Perc
ent
Area Yield
Growth in crop output driven by cultivated area expansion and yield.
6
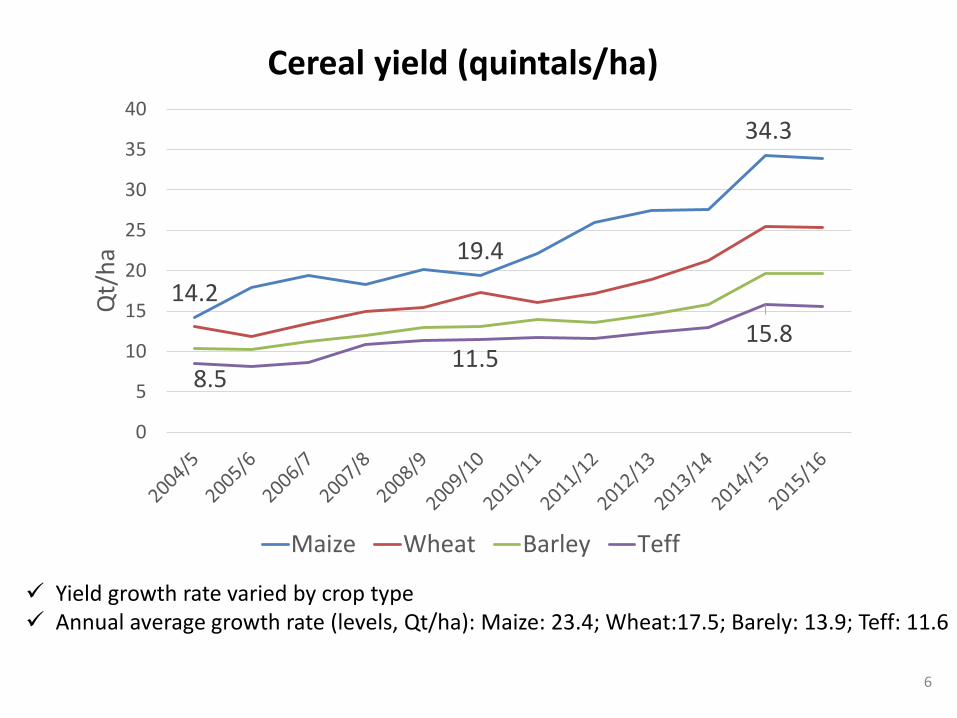
Cereal yield (quintals/ha)
14.2
19.4
34.3
8.511.5
15.8
0
5
10
15
20
25
30
35
40Q
t/h
a
Maize Wheat Barley Teff
Yield growth rate varied by crop type Annual average growth rate (levels, Qt/ha): Maize: 23.4; Wheat:17.5; Barely: 13.9; Teff: 11.6
7
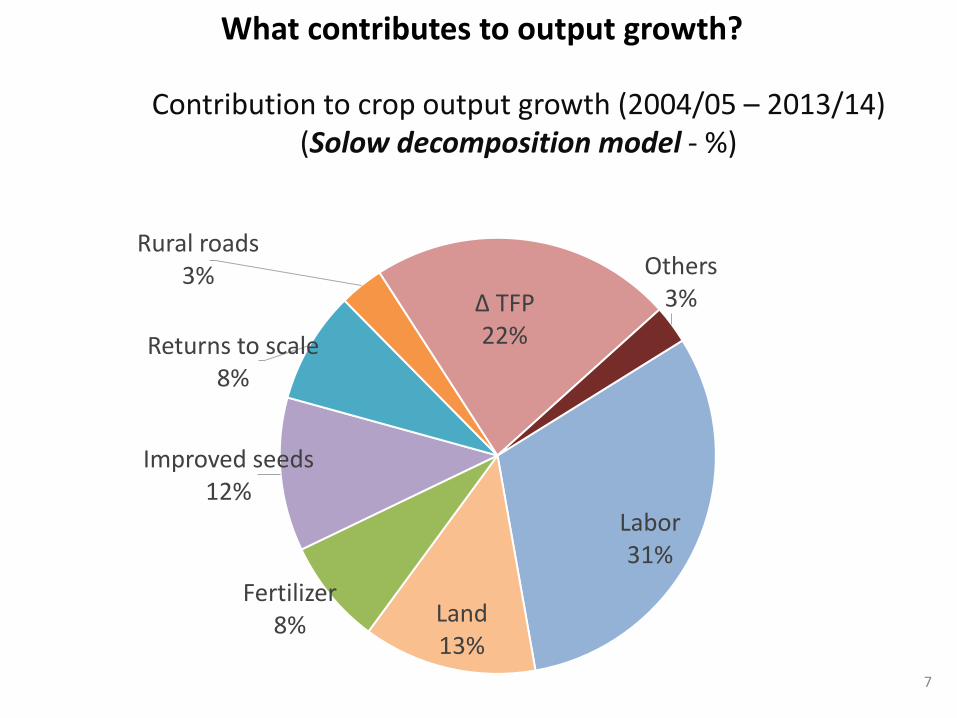
What contributes to output growth?
Contribution to crop output growth (2004/05 – 2013/14) (Solow decomposition model - %)
Labor31%
Land13%
Fertilizer 8%
Improved seeds12%
Returns to scale8%
Rural roads3%
∆ TFP22%
Others3%
8
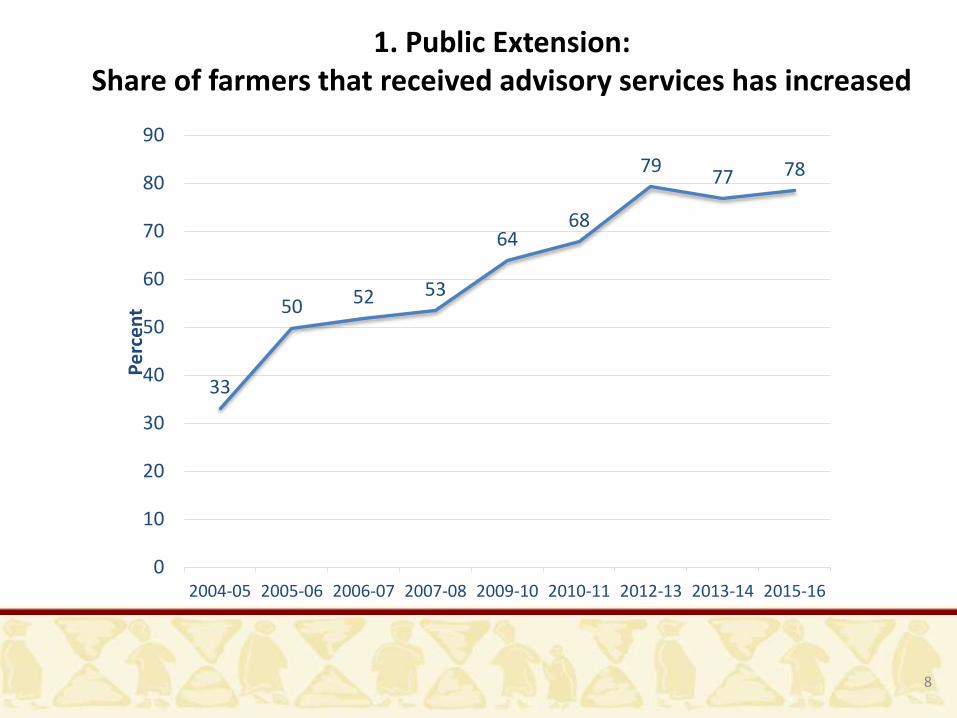
1. Public Extension: Share of farmers that received advisory services has increased
33
50 52 53
6468
7977 78
0
10
20
30
40
50
60
70
80
90
2004-05 2005-06 2006-07 2007-08 2009-10 2010-11 2012-13 2013-14 2015-16
Pe
rce
nt
9
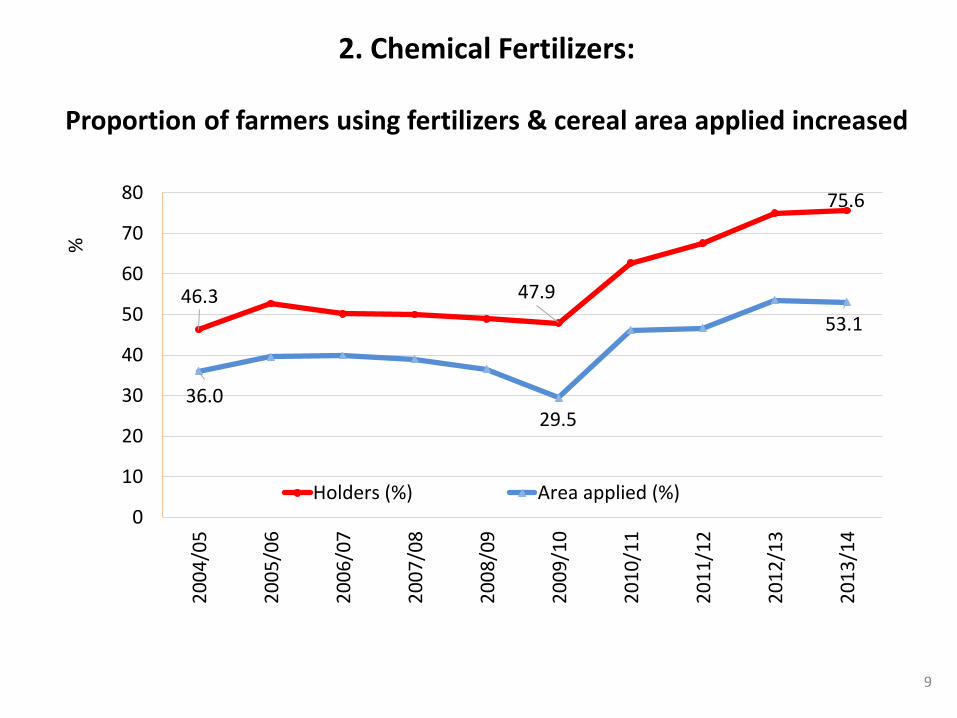
2. Chemical Fertilizers:
Proportion of farmers using fertilizers & cereal area applied increased
46.3 47.9
75.6
36.029.5
53.1
0
10
20
30
40
50
60
70
802
00
4/0
5
20
05
/06
20
06
/07
20
07
/08
20
08
/09
20
09
/10
20
10
/11
20
11
/12
20
12
/13
20
13
/14
%
Holders (%) Area applied (%)
10
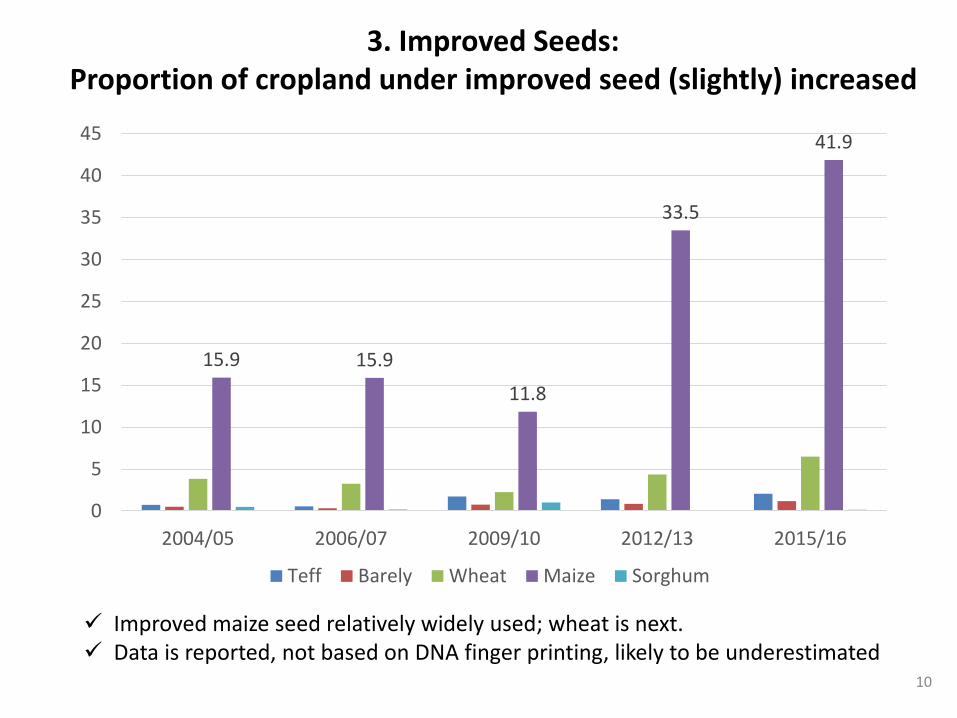
3. Improved Seeds: Proportion of cropland under improved seed (slightly) increased
15.9 15.9
11.8
33.5
41.9
0
5
10
15
20
25
30
35
40
45
2004/05 2006/07 2009/10 2012/13 2015/16
Teff Barely Wheat Maize Sorghum
Improved maize seed relatively widely used; wheat is next. Data is reported, not based on DNA finger printing, likely to be underestimated
-
0.10
0.20
0.30
0.40
0.50
0.60
0.70
0.80
20
03
20
04
20
05
20
06
20
07
20
08
20
09
20
10
20
11
20
12
Teff Wheat
Barley Sorghum
Maize
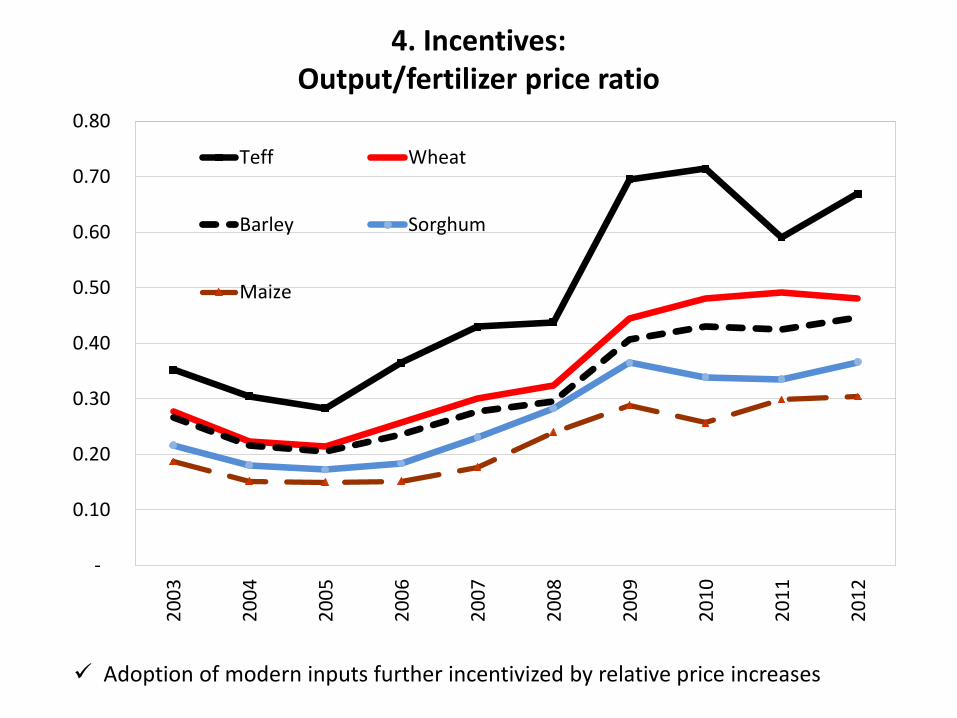
4. Incentives:Output/fertilizer price ratio
Adoption of modern inputs further incentivized by relative price increases
0.0
0.5
1.0
1.5
2.0
2.5
3.0
3.5
4.0
20
03
/04
20
04
/05
20
05
/06
20
06
/07
20
07
/08
20
08
/09
20
09
/10
20
10
/11
20
11
/12
20
12
/13
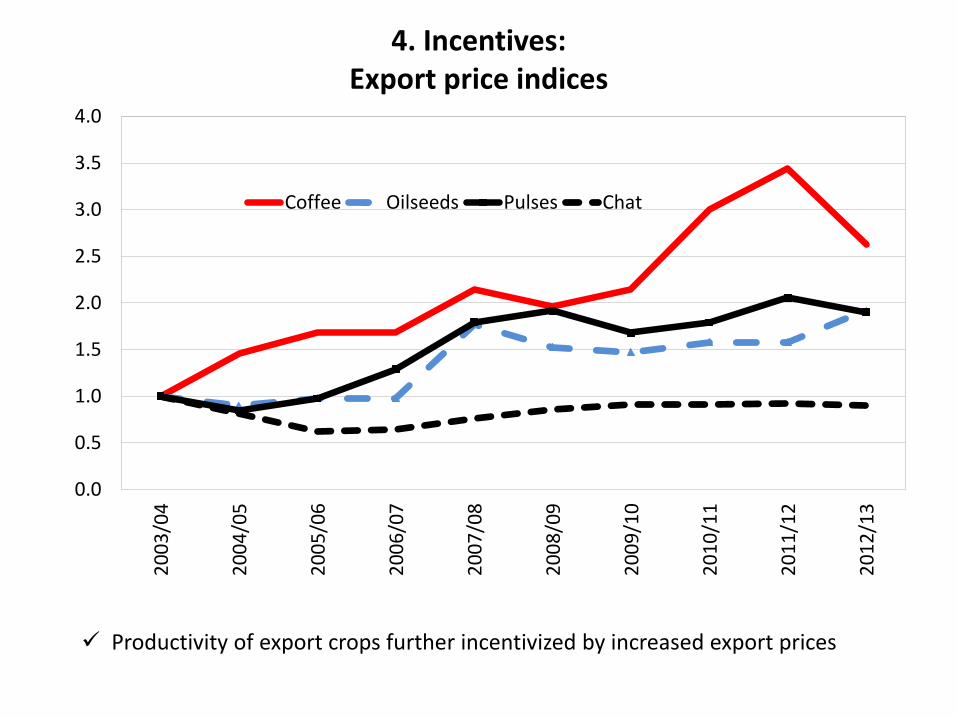
Coffee Oilseeds Pulses Chat
4. Incentives: Export price indices
Productivity of export crops further incentivized by increased export prices
Ethiopia’s crop production in context – the potential
15
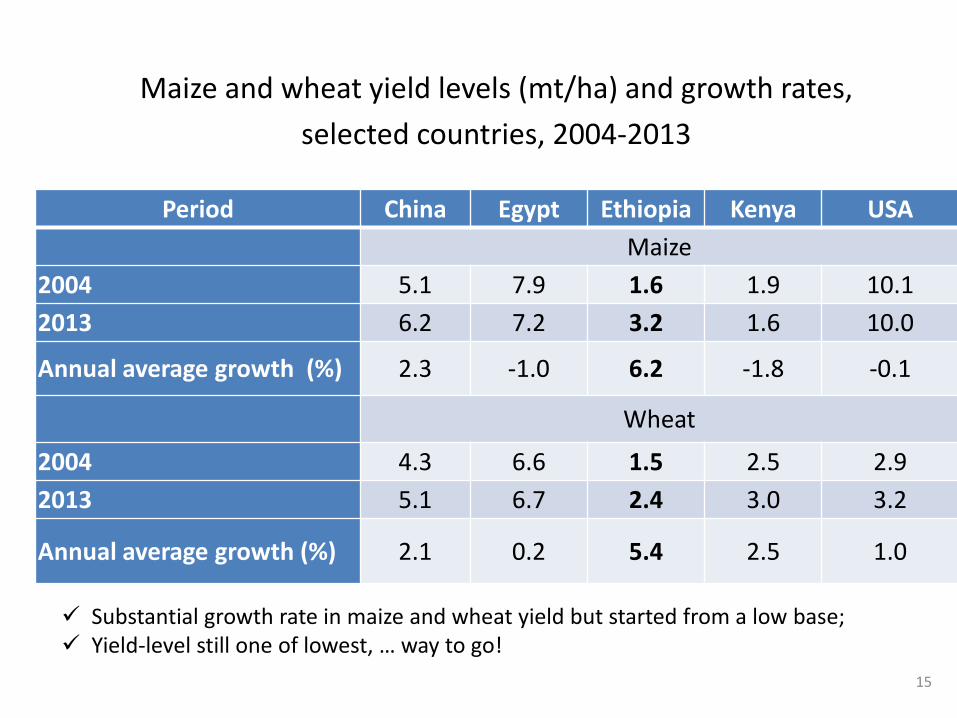
Maize and wheat yield levels (mt/ha) and growth rates,
selected countries, 2004-2013
Period China Egypt Ethiopia Kenya USA
Maize
2004 5.1 7.9 1.6 1.9 10.1
2013 6.2 7.2 3.2 1.6 10.0
Annual average growth (%) 2.3 -1.0 6.2 -1.8 -0.1
Wheat
2004 4.3 6.6 1.5 2.5 2.9
2013 5.1 6.7 2.4 3.0 3.2
Annual average growth (%) 2.1 0.2 5.4 2.5 1.0
Substantial growth rate in maize and wheat yield but started from a low base; Yield-level still one of lowest, … way to go!
16
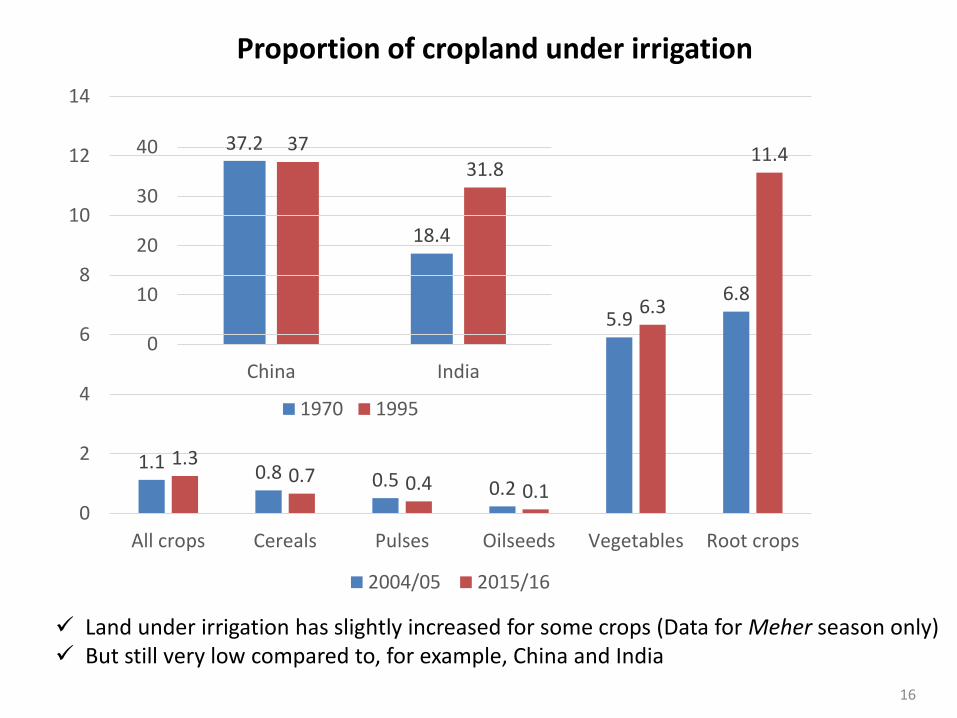
Proportion of cropland under irrigation
37.2
18.4
3731.8
0
10
20
30
40
China India
1970 1995
1.1 0.8 0.5 0.2
5.96.8
1.30.7 0.4 0.1
6.3
11.4
0
2
4
6
8
10
12
14
All crops Cereals Pulses Oilseeds Vegetables Root crops
2004/05 2015/16
Land under irrigation has slightly increased for some crops (Data for Meher season only) But still very low compared to, for example, China and India

17
18
29
2
9
26
37
118
16
0
5
10
15
20
25
30
35
40
Ethiopia Malawi Nigeria Tanzania SSA
2009 2014
Fertilizer intensification (kg/ha)
Comparable growth in land intensification (fertilizer, Kg/ha), comparable to some SSA countries; but way to go compared to Asian countries in 2014
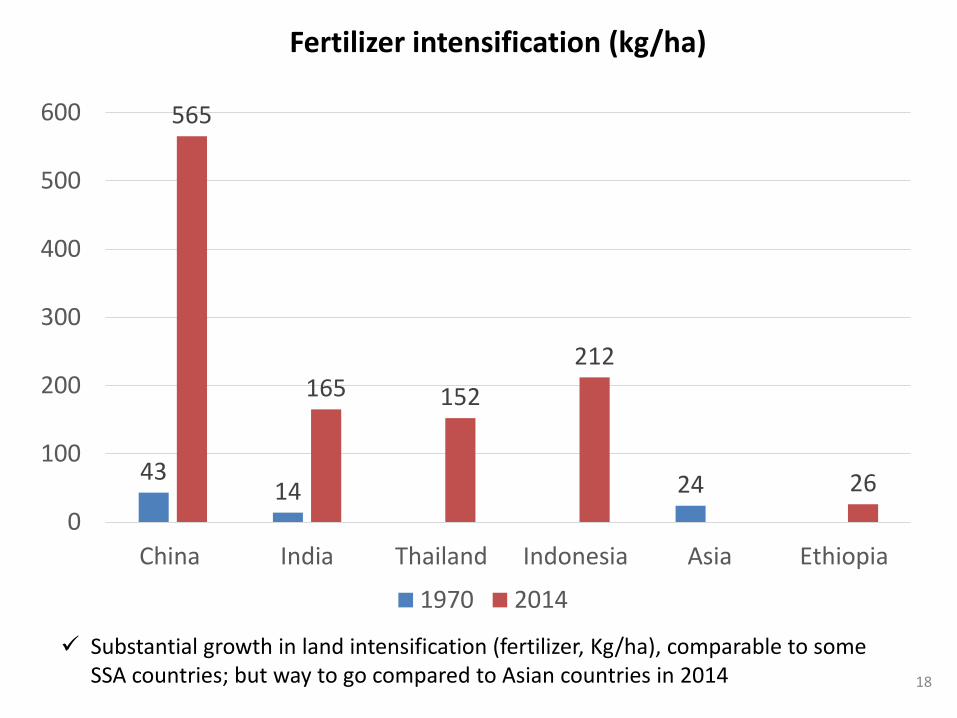
18
4314 24
565
165 152
212
26
0
100
200
300
400
500
600
China India Thailand Indonesia Asia Ethiopia
1970 2014
Fertilizer intensification (kg/ha)
Substantial growth in land intensification (fertilizer, Kg/ha), comparable to some SSA countries; but way to go compared to Asian countries in 2014
19
Summary & way forward
Ethiopia has seen substantial growth in crop production, mostly driven by area expansion, yield, and TFP;
Yield growth further driven by several factors, including more and better use of modern inputs – fertilizer, improved seeds, extension, improved infrastructure, price incentives, and so on;
But growth has been from a low base and, as the evidence from other countries suggest, there is a lot of potential for improvement.
Some of the growth drivers so far (like area expansion) seem to be quickly dwindling, and others (like international price incentives) are not always reliable.
As growth opportunities from a low base get fully exploited, further growth (from a higher base) becomes challenging and requires more than business as usual.
The evidence seems to suggest more and more needs to be done to sustain growth, …, investing towards a more knowledge-based production system and unlocking other constraints of land intensification.