Crop Insurance and Corn: Helpful Hints to Make More Money and GRP in Juneau, Adams, and Marquette...
38
Crop Insurance and Corn: Crop Insurance and Corn: Helpful Hints to Make Helpful Hints to Make More Money More Money and and GRP in Juneau, Adams, and GRP in Juneau, Adams, and Marquette Counties Marquette Counties Paul D. Mitchell Paul D. Mitchell Agricultural and Applied Economics Agricultural and Applied Economics Office: (608) 265-6514 Office: (608) 265-6514 Email: Email: [email protected] [email protected] Extension Web: Extension Web: www.aae.wisc.edu/mitchell/extension.htm www.aae.wisc.edu/mitchell/extension.htm UWEX Corn Field Day: August 2006, Juneau UWEX Corn Field Day: August 2006, Juneau County County
-
Upload
owen-cheak -
Category
Documents
-
view
219 -
download
0
Transcript of Crop Insurance and Corn: Helpful Hints to Make More Money and GRP in Juneau, Adams, and Marquette...

Crop Insurance and Corn:Crop Insurance and Corn:Helpful Hints to Make More Helpful Hints to Make More
MoneyMoneyandand
GRP in Juneau, Adams, and GRP in Juneau, Adams, and Marquette CountiesMarquette Counties
Paul D. MitchellPaul D. Mitchell
Agricultural and Applied EconomicsAgricultural and Applied Economics
Office: (608) 265-6514Office: (608) 265-6514
Email: Email: [email protected]@wisc.edu
Extension Web: Extension Web: www.aae.wisc.edu/mitchell/extension.htmwww.aae.wisc.edu/mitchell/extension.htm
UWEX Corn Field Day: August 2006, Juneau CountyUWEX Corn Field Day: August 2006, Juneau County

Goal TodayGoal Today BriefBrief overview of APH and GRP crop overview of APH and GRP crop
insurance policies and how they workinsurance policies and how they work General and specific hints on how to General and specific hints on how to
use them to make more moneyuse them to make more money Focus on corn (not soybeans) and Focus on corn (not soybeans) and
yield risk (not price/marketing)yield risk (not price/marketing) BriefBrief description (no analysis) of AGR- description (no analysis) of AGR-
Lite for organic grain producersLite for organic grain producers

Actual Production History Actual Production History (APH)(APH)
If harvested yield is less than yield If harvested yield is less than yield guarantee, farmer receives an guarantee, farmer receives an indemnityindemnity
Yield guarantee based on actual yield Yield guarantee based on actual yield history (APH)history (APH)
Other namesOther names Multiple Peril Crop Insurance (MPCI)Multiple Peril Crop Insurance (MPCI) Catastrophic Coverage (CAT) is the Catastrophic Coverage (CAT) is the
minimum APH coverage availableminimum APH coverage available

How APH WorksHow APH Works
Unit Structure (Basic, Optional, Unit Structure (Basic, Optional, Enterprise)Enterprise)
Coverage Level (50% to 85%)Coverage Level (50% to 85%) Price Election (55% to 100%)Price Election (55% to 100%) PremiumsPremiums

Insurance UnitInsurance Unit
Yield from a “unit” is what is insured Yield from a “unit” is what is insured If yield for the whole unit is less than the If yield for the whole unit is less than the
unit’s yield guarantee, triggers indemnityunit’s yield guarantee, triggers indemnity A 300 acre unit with a 100 bu/ac A 300 acre unit with a 100 bu/ac
guarantee would have to yield less than guarantee would have to yield less than 100 x 300 = 30,000 bu to trigger an 100 x 300 = 30,000 bu to trigger an indemnityindemnity
Each unit is possibly/likely several fieldsEach unit is possibly/likely several fields Farm must choose one of three unit types Farm must choose one of three unit types
Basic Unit, Optional Unit, Enterprise UnitBasic Unit, Optional Unit, Enterprise Unit
Basic UnitBasic Unit
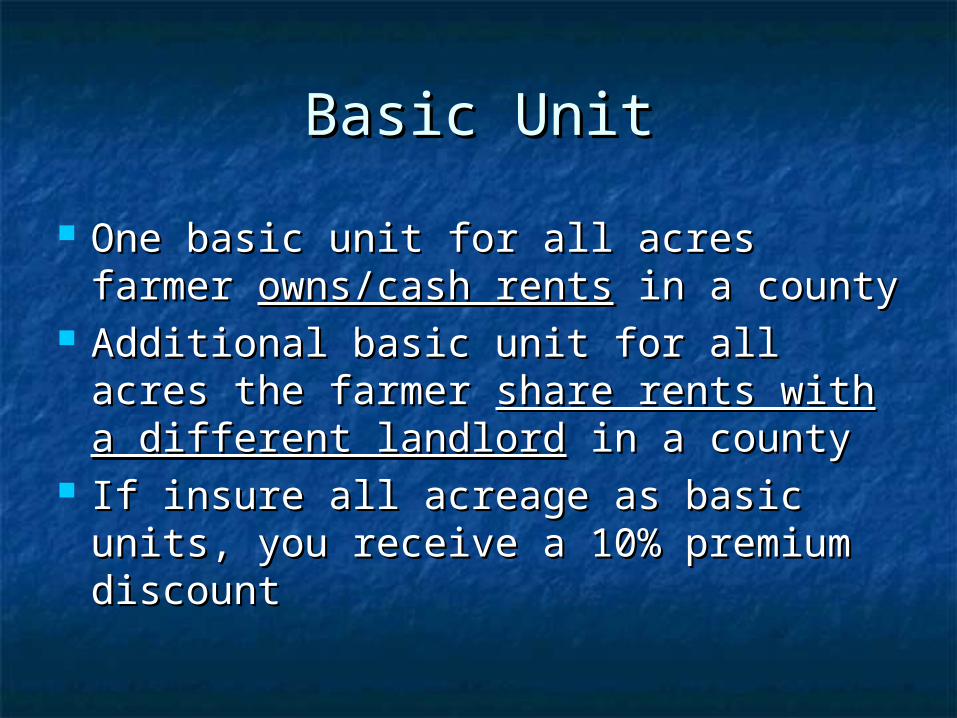
One basic unit for all acres farmer One basic unit for all acres farmer owns/cash rentsowns/cash rents in a county in a county
Additional basic unit for all acres the Additional basic unit for all acres the farmer farmer share rents with a different share rents with a different landlordlandlord in a county in a county
If insure all acreage as basic units, If insure all acreage as basic units, you receive a 10% premium discountyou receive a 10% premium discount

Optional UnitOptional Unit One optional unit for all acres One optional unit for all acres in in
different township sectionsdifferent township sections that a that a farmer owns or cash rentsfarmer owns or cash rents
Can separate optional units Can separate optional units if if different practices or crop typesdifferent practices or crop types Dryland and Irrigated CornDryland and Irrigated Corn Corn for Grain and Corn for SilageCorn for Grain and Corn for Silage

Enterprise UnitEnterprise Unit
Combine all acreage for a crop in a Combine all acreage for a crop in a county into a single unitcounty into a single unit
Farmer using an enterprise unit pays Farmer using an enterprise unit pays lower premiums lower premiums

Farm B 50-50 crop share lease from Smith
Farm D cash rent
lease from Jones
Farm A Owned
Township Section 1
Farm C cash rent
lease from Smith
Farm E 50-50 crop share lease from Smith
Township Section 2
Farm F Owned
Farm G 60-40 crop share lease from Black
Township Section 12
Township Section 11
Farms A-G: Same operator planting the same crop in the same county Basic Units
1) A+C+D+F
2) B + E
3) G
Optional Units
1) A + C
2) B
3) D
4) E
5) F
6) G
Enterprise Unit
1) All units A to G
Adapted from W. Edwards, “Insurance Units for Crop Insurance.” Iowa State University Extension A1-56, February 2003.
www.extension.iastate.edu/agdm/crops/pdf/a1-56.pdf

Best Unit StructureBest Unit Structure
300 acre unit with 100 bu/ac guarantee 300 acre unit with 100 bu/ac guarantee must yield less than 100 x 300 = 30,000 must yield less than 100 x 300 = 30,000 bu to trigger an indemnitybu to trigger an indemnity
Suppose three 100 ac fields: one with 0 Suppose three 100 ac fields: one with 0 bu/ac & two with 150 bu/ac = 30,000 bu, bu/ac & two with 150 bu/ac = 30,000 bu, so triggers no indemnityso triggers no indemnity
Farmers make more money with Farmers make more money with Optional UnitsOptional Units than with Basic Units than with Basic Units and Enterprise Units, even though and Enterprise Units, even though pay higher premiumspay higher premiums

Coverage LevelCoverage Level
Pick percent of APH yield to guarantee: Pick percent of APH yield to guarantee: 50% 55% 60% 65% 70% 75% 80% 85%50% 55% 60% 65% 70% 75% 80% 85%
Unit yield below this yield guarantee Unit yield below this yield guarantee triggers an indemnitytriggers an indemnity
100% – Coverage Level ~= Deductible100% – Coverage Level ~= Deductible Higher coverage level has higher Higher coverage level has higher
premiumpremium 65%-75% generally are best deal65%-75% generally are best deal 50% (CAT) is essentially free50% (CAT) is essentially free

Price ElectionPrice Election Crop price used to pay indemnitiesCrop price used to pay indemnities RMA announces price elections at RMA announces price elections at
sign-up, based on CBOT futures pricessign-up, based on CBOT futures prices Available options: 55% to 100% by 1% Available options: 55% to 100% by 1%
increments of announced price increments of announced price electionelection
Best to take max price election Best to take max price election and adjust coverage leveland adjust coverage level
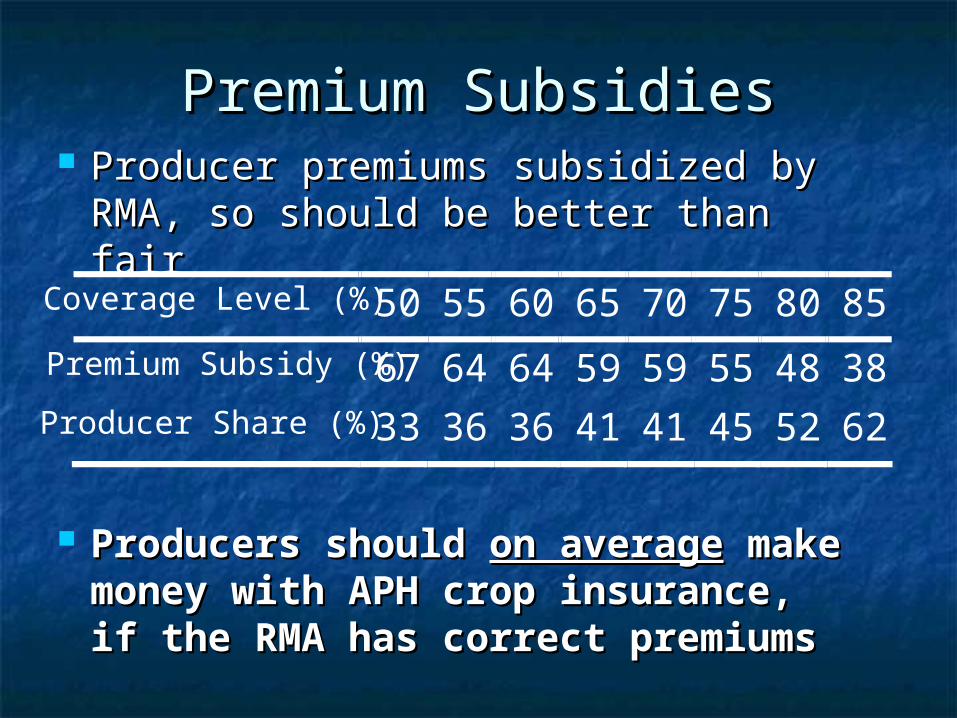
Premium SubsidiesPremium Subsidies Producer premiums subsidized by Producer premiums subsidized by
RMA, so should be better than fairRMA, so should be better than fair
Producers should Producers should on averageon average make money with APH crop make money with APH crop insurance, if the RMA has insurance, if the RMA has correct premiumscorrect premiums
Coverage Level (%) 50 55 60 65 70 75 80 85
Premium Subsidy (%) 67 64 64 59 59 55 48 38 Producer Share (%) 33 36 36 41 41 45 52 62

150 APH Dryland 200 APH IrrigatedAdam
s JuneauMarquett
eAdam
s JuneauMarquett
e
55% APH 5.18 4.76 3.74 5.35 5.99 3.6265% APH 7.70 7.12 5.77 8.09 8.95 6.10
75% APH
12.86
11.20 9.61
13.23
14.08 10.80
APH Premiums ($/ac)APH Premiums ($/ac)100% Price Election, Optional 100% Price Election, Optional
UnitsUnits

APH Hints to Make More APH Hints to Make More MoneyMoney
If APH valuable (which is not certain)If APH valuable (which is not certain)• Use as many Use as many Optional UnitsOptional Units as possible as possible• Take the maximum 100% price electionTake the maximum 100% price election• 65%-75% coverage levels generally best 65%-75% coverage levels generally best
deal (Avoid 80% and 85% coverage: too deal (Avoid 80% and 85% coverage: too expensive)expensive)
• Premium subsidies imply that Premium subsidies imply that on averageon average should make money with APH crop should make money with APH crop insurance, insurance, if RMA has correct premiumsif RMA has correct premiums
• Coverage available even if no yield historyCoverage available even if no yield history• Consider at least CAT, since essentially freeConsider at least CAT, since essentially free

Is APH worth it in JAM?Is APH worth it in JAM? Monte Carlo simulations to estimate Monte Carlo simulations to estimate
net indemnity (average return – net indemnity (average return – premium)premium)
Corn price: $2.00/buCorn price: $2.00/bu Assume good producerAssume good producer
150 bu/ac for dryland corn150 bu/ac for dryland corn 200 bu/ac for irrigated corn200 bu/ac for irrigated corn
Yield Coefficient of Variation (CV)Yield Coefficient of Variation (CV) 35% for dryland, 30% for irrigated35% for dryland, 30% for irrigated
0
20
40
60
80
100
120
140
160
1994 1996 1998 2000 2002
unit 1
unit 2
0
20
40
60
80
100
120
140
160
1994 1996 1998 2000 2002
unit 3
unit 4
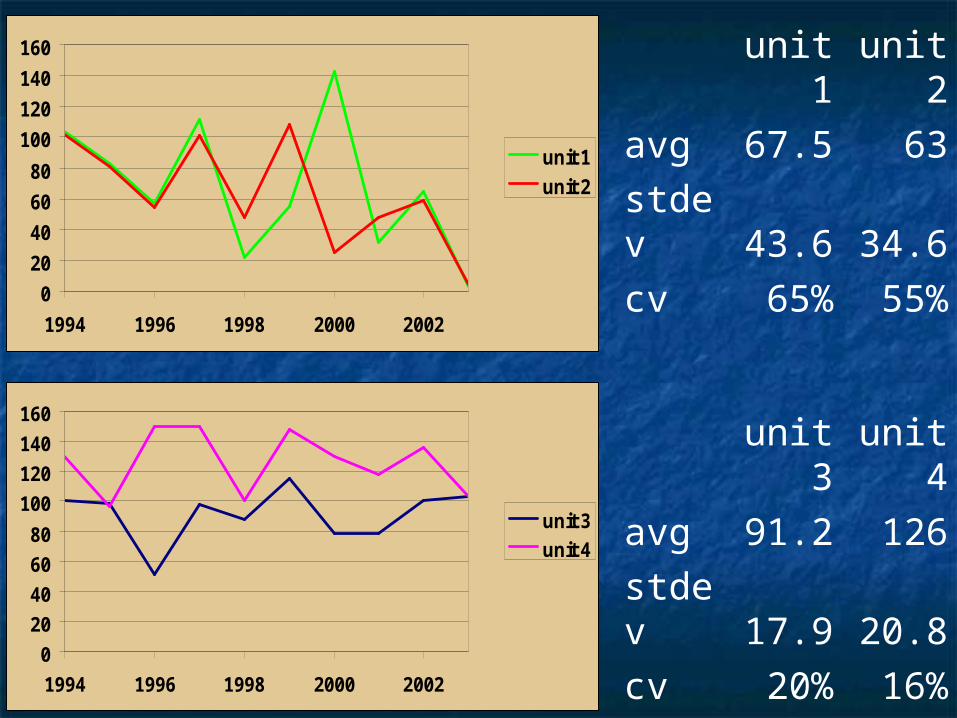
unit 1
unit 2
avg 67.5 63
stdev 43.6 34.6
cv 65% 55%
unit 3
unit 4
avg 91.2 126
stdev 17.9 20.8
cv 20% 16%

AdamsAdams JuneauJuneau MarquetteMarquettedrylandrylan
ddirigateirigate
dddrylandrylan
ddirigateirigate
dddrylandrylan
ddirigateirigate
dd
0.320.32 -0.99-0.99 0.740.74 -1.63-1.63 1.761.76 0.740.74
2.272.27 0.630.63 2.852.85 -0.23-0.23 4.204.20 2.622.62
3.653.65 2.622.62 5.315.31 1.771.77 6.906.90 5.055.05
2006 Net Indemnity ($/ac) for corn 2006 Net Indemnity ($/ac) for corn APHAPH
Dryland: APH yield 150 bu/ac, 35% CVDryland: APH yield 150 bu/ac, 35% CVIrrigated: APH yield 200 bu/ac, 30% CVIrrigated: APH yield 200 bu/ac, 30% CV

2006 Net Indemnity ($/ac) for Corn 2006 Net Indemnity ($/ac) for Corn APHAPH
Sensitivity Analysis Dryland CornSensitivity Analysis Dryland Corn
Decrease APH to County TDecrease APH to County TIncrease CV from 35% to Increase CV from 35% to
45%45%
---------- CV = 35% ------------------- CV = 35% --------- ---------- CV = 45% ------------------- CV = 45% ---------
APH APH 108108
APH APH 126126 APH 105APH 105 ------ APH Yield = 150 ------------ APH Yield = 150 ------
AdamsAdams JuneauJuneauMarquettMarquett
ee AdamsAdams JuneauJuneauMarquettMarquett
ee
-0.62-0.62 -0.31-0.31 0.350.35 6.336.33 6.756.75 7.777.77
0.310.31 1.011.01 2.922.92 10.4710.47 11.0511.05 12.4012.40
0.520.52 2.282.28 2.552.55 13.8213.82 15.4815.48 17.0717.07

APH Hints to Make More APH Hints to Make More MoneyMoney
APH can be valuable for JAM corn farmersAPH can be valuable for JAM corn farmers Need high yield variability (CV ≥ 35%)Need high yield variability (CV ≥ 35%)
Most irrigated farmers will not find APH Most irrigated farmers will not find APH valuablevaluable
Some dryland farmers will find APH valuable Some dryland farmers will find APH valuable Calculate CV for your yield historyCalculate CV for your yield history
Use 65%-75% coverage levelUse 65%-75% coverage level Use 100% price electionUse 100% price election
Can GRP work as an alternative to APH for Can GRP work as an alternative to APH for low risk JAM farmers???low risk JAM farmers???

Group Risk Protection (GRP)Group Risk Protection (GRP) If USDA-NASS county average yield is less If USDA-NASS county average yield is less
than county yield guarantee, farmer than county yield guarantee, farmer receives indemnity based on acres plantedreceives indemnity based on acres planted
Like APH, but for county yieldLike APH, but for county yield Coverage Level: 65% 70% 75% 80% 85% Coverage Level: 65% 70% 75% 80% 85%
90% of county average yield for yield 90% of county average yield for yield triggertrigger
Price Election: choose 100% to 60% in 1% Price Election: choose 100% to 60% in 1% increments, or 45% as CATincrements, or 45% as CAT
Choose to insure county average yield per Choose to insure county average yield per harvested acre or per planted acreharvested acre or per planted acre

Group Risk Protection (GRP)Group Risk Protection (GRP)
Basically you bet vs the RMA on level of Basically you bet vs the RMA on level of county yield, but government subsidizes county yield, but government subsidizes the premium, so you should make the premium, so you should make moneymoney
Works better than APH if Works better than APH if your yields closely follow county yield your yields closely follow county yield oror you have low risk yieldsyou have low risk yields use hail/fire policy for localized lossesuse hail/fire policy for localized losses
Analyzed APH and GRP in JAM to see Analyzed APH and GRP in JAM to see how they comparehow they compare

GRP Hints to Make More GRP Hints to Make More MoneyMoney
If RMA has GRP premiums right and GRP is If RMA has GRP premiums right and GRP is valuable (which is not certain)valuable (which is not certain)
GRP better than APH if have low risk yields GRP better than APH if have low risk yields and your yields closely follow county yield and your yields closely follow county yield (( > 0.6) > 0.6)
Combine GRP with Hail/Fire policy for Combine GRP with Hail/Fire policy for coverage vs localized individual lossescoverage vs localized individual losses
Best GRP dealBest GRP deal Maximum coverage level (90%)Maximum coverage level (90%) Maximum price election (100%)Maximum price election (100%) Yield per Harvested acreYield per Harvested acre

Analysis of GRP in J-A-MAnalysis of GRP in J-A-M
Goal: To see if GRP valuable in J-A-MGoal: To see if GRP valuable in J-A-M Graphical analysisGraphical analysis Numerical analysisNumerical analysis
Use observed yield dataUse observed yield data Use simulated yieldsUse simulated yields

Graphical Analysis of GRPGraphical Analysis of GRP
Plot USDA-NASS county yield data Plot USDA-NASS county yield data and GRP yield guarantees and GRP yield guarantees
See how likely to trigger GRP See how likely to trigger GRP indemnityindemnity
USDA-NASS data (USDA-NASS data (www.nass.usda.govwww.nass.usda.gov))
Years 1973-2005 (33 years)Years 1973-2005 (33 years)

0
20
40
60
80
100
120
140
1970 1980 1990 2000 2010
Year
Cou
nty
Yie
ld
Adams
70% Coverage
90% Coverage

0
20
40
60
80
100
120
140
160
180
1970 1980 1990 2000 2010
Year
Cou
nty
Yie
ld
Juneau
70% Coverage
90% Coverage

0
20
40
60
80
100
120
140
1970 1980 1990 2000 2010
Year
Cou
nty
Yie
ld
Marquette
70% Coverage
90% Coverage

Premium 70%Premium 70% HarvestedHarvested PlantedPlanted
AdamsAdams 0.790.79 1.441.44
JuneauJuneau 0.960.96 1.431.43
MarquetteMarquette 0.800.80 1.111.11
Premium 90%Premium 90% HarvestedHarvested PlantedPlanted
AdamsAdams 4.344.34 6.016.01
JuneauJuneau 5.015.01 6.566.56
MarquetteMarquette 4.184.18 5.365.36
2006 GRP premiums ($/ac) for yield per 2006 GRP premiums ($/ac) for yield per harvested acre and per planted acreharvested acre and per planted acre

70% Coverage70% Coverage HarvestedHarvested PlantedPlanted
AdamsAdams -0.79-0.79 -1.44-1.44
JuneauJuneau -0.96-0.96 -1.43-1.43
MarquetteMarquette -0.80-0.80 -1.11-1.11
90% Coverage90% Coverage HarvestedHarvested PlantedPlanted
AdamsAdams 5.265.26 -2.23-2.23
JuneauJuneau 26.8626.86 2.642.64
MarquetteMarquette 4.224.22 0.680.68
Average net indemnity ($/ac) for 2006 Average net indemnity ($/ac) for 2006 GRP using last 10 years of county yieldsGRP using last 10 years of county yields

Simulation AnalysisSimulation Analysis Estimate county mean yield and standard Estimate county mean yield and standard
deviation assuming linear trenddeviation assuming linear trend Use Monte Carlo simulation to draw 10,000 Use Monte Carlo simulation to draw 10,000
yields and calculate expected GRP net yields and calculate expected GRP net indemnity (average return – premium)indemnity (average return – premium)
Smoothes empirical analysis and do not Smoothes empirical analysis and do not assume next year will be average of the assume next year will be average of the last 10 yearslast 10 years
Does RMA have 2006 expected yield right?Does RMA have 2006 expected yield right?

Yld/hrvstd Yld/hrvstd acreacre RMARMA RegressionRegression
AdamsAdams 107.6107.6 119.2119.2
JuneauJuneau 125.8125.8 133.8133.8
MarquetteMarquette 104.7104.7 114.3114.3
Yld/plntd acreYld/plntd acre RMARMA RegressionRegression
AdamsAdams 95.195.1 105.6105.6
JuneauJuneau 106.1106.1 115.9115.9
MarquetteMarquette 85.785.7 93.893.8
RMA and Regression estimates of RMA and Regression estimates of GRP expected county yield for 2006GRP expected county yield for 2006

0
20
40
60
80
100
120
140
1970 1980 1990 2000 2010
Adams
GRP
Regression
0
20
40
60
80
100
120
140
1990 1995 2000 2005
Adams
GRP
Regression

0
20
40
60
80
100
120
140
160
180
1970 1980 1990 2000 2010
Juneau
GRP
Regression
0
20
40
60
80
100
120
140
160
180
1990 1995 2000 2005
Juneau
GRP
Regression
0
20
40
60
80
100
120
140
1970 1980 1990 2000 2010
Marquette
GRP
Regression
0
20
40
60
80
100
120
140
1990 1995 2000 2005
Marquette
GRP
Regression

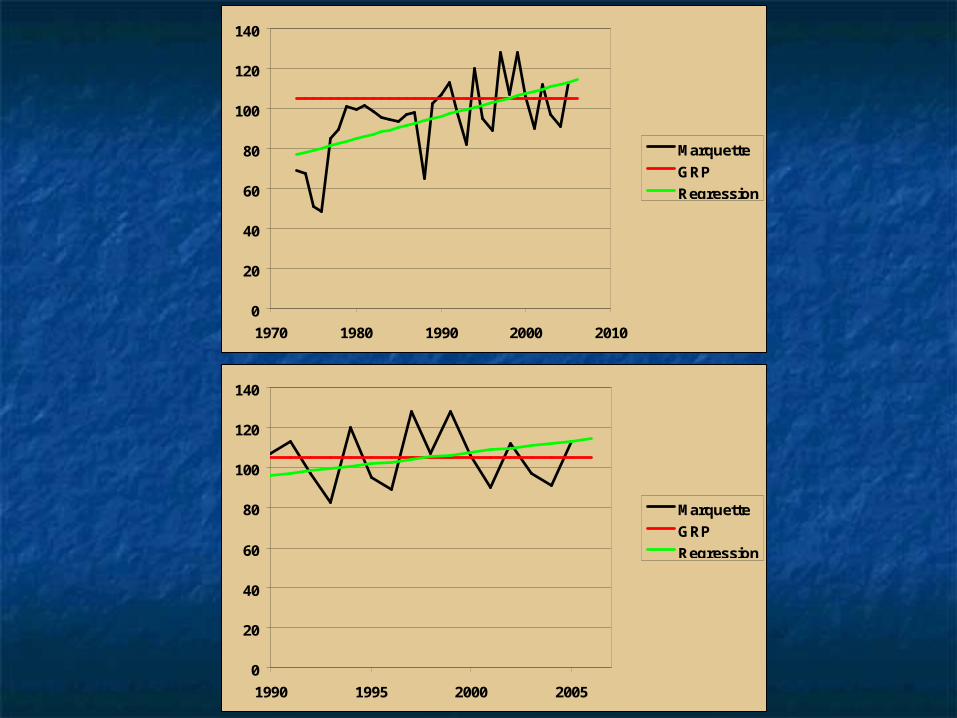
What’s the expected county What’s the expected county yield for 2006?yield for 2006?
If the RMA is right, then corn yields in If the RMA is right, then corn yields in JAM have leveled off (stopped JAM have leveled off (stopped growing at trend). If so, why?growing at trend). If so, why?
If the regression is right, yields in JAM If the regression is right, yields in JAM have been off trend for awhile and have been off trend for awhile and county yields should increasecounty yields should increase
The estimated net indemnity for GRP The estimated net indemnity for GRP depends crucially on which is rightdepends crucially on which is right
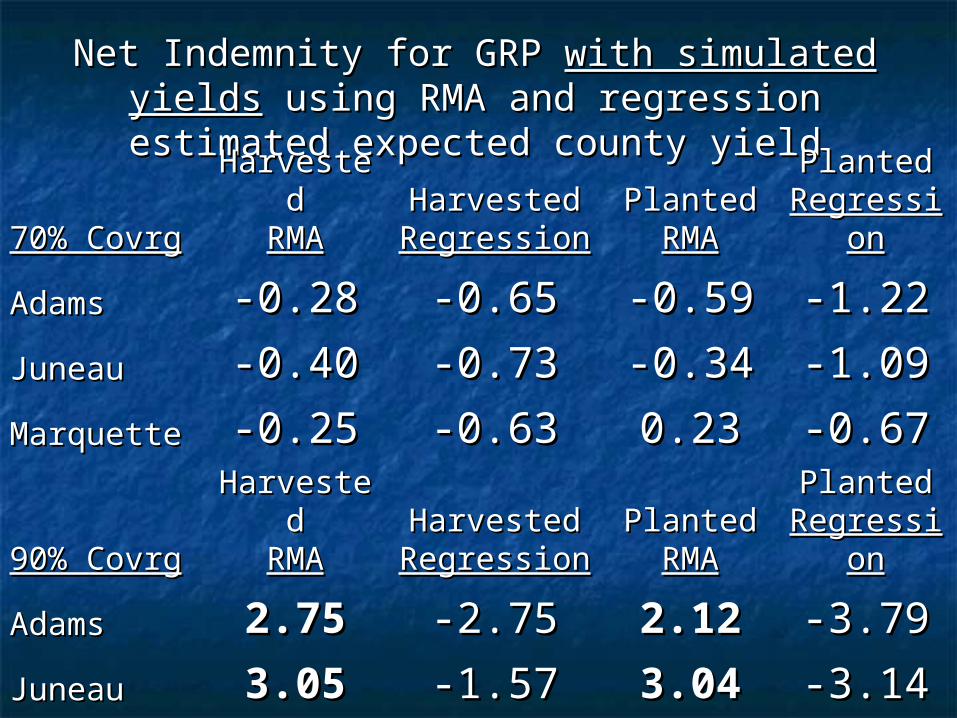
Net Indemnity for GRP Net Indemnity for GRP with simulated yieldswith simulated yields using RMA and regression estimated expected using RMA and regression estimated expected
county yieldcounty yield
70% Covrg70% Covrg
HarvesteHarvestedd
RMARMAHarvested Harvested RegressionRegression
PlantedPlantedRMARMA
PlantedPlantedRegressioRegressio
nn
AdamsAdams -0.28-0.28 -0.65-0.65 -0.59-0.59 -1.22-1.22
JuneauJuneau -0.40-0.40 -0.73-0.73 -0.34-0.34 -1.09-1.09
MarquetteMarquette -0.25-0.25 -0.63-0.63 0.230.23 -0.67-0.67
90% Covrg90% Covrg
HarvesteHarvestedd
RMARMAHarvested Harvested RegressionRegression
PlantedPlantedRMARMA
PlantedPlantedRegressioRegressio
nn
AdamsAdams 2.752.75 -2.75-2.75 2.122.12 -3.79-3.79
JuneauJuneau 3.053.05 -1.57-1.57 3.043.04 -3.14-3.14
MarquetteMarquette 3.063.06 -2.01-2.01 3.813.81 -1.77-1.77

GRP Hints to Make More GRP Hints to Make More MoneyMoney
GRP has value in JAM GRP has value in JAM ifif RMA has expected RMA has expected yields right yields right About $3/ac over cost of premium ($4-$5/ac)About $3/ac over cost of premium ($4-$5/ac)
Use 90% coverage level 100% and price Use 90% coverage level 100% and price election and yield per election and yield per Harvested AcreHarvested Acre
If long term yield trend is right, then GRP If long term yield trend is right, then GRP does not have value in JAMdoes not have value in JAM
Basically, you are betting on county yieldBasically, you are betting on county yield