CREEP OF CRACKED POLYMER FIBER REINFORCED … · CREEP OF CRACKED POLYMER FIBER REINFORCED CONCRETE...
9
9th International Conference on Fracture Mechanics of Concrete and Concrete Structures FraMCoS-9 V. Saouma, J. Bolander, and E. Landis (Eds) CREEP OF CRACKED POLYMER FIBER REINFORCED CONCRETE UNDER SUSTAINED TENSILE LOADING RUTGER VRIJDAGHS * , MARCO DI PRISCO † AND LUCIE VANDEWALLE ‡ * Katholieke Universiteit Leuven (KU Leuven) Heverlee, Belgium e-mail: [email protected] † Politecnico di Milano Milan, Italy e-mail: [email protected] ‡ Katholieke Universiteit Leuven (KU Leuven) Heverlee, Belgium e-mail: [email protected] Key words: Creep, Fiber Reinforced Concrete, Tensile Creep, Crack Growth, Polymeric Fibers Abstract. In fiber reinforced concrete (FRC), fibers are added to the fresh concrete mix in order to improve the residual tensile strength, the toughness and/or durability of a concrete element. Cur- rently, structural applications remain relatively scarce as the time-dependent behavior of FRC is still poorly understood. This paper reports the first results of an experimental campaign regarding the creep of cracked polymer FRC. In the test setup, cylindrical, notched FRC specimens are considered. The concrete is reinforced with structural polymeric fibers for use in load-bearing applications. In a first step, the material is characterized according to the European Standard EN14651. Secondly, the samples are precracked to localize the creep deformations and to monitor the crack growth in time. The samples are subjected to a sustained tensile load, whereby different load levels with respect to the individual residual strength are considered. The results of the first months of creep loading will be detailed and discussed in the paper. 1 INTRODUCTION Fiber reinforced concrete (FRC) is a com- posite material in which fibers are added to the fresh concrete mix [1, 2]. These fibers are used to improve the properties of the concrete in the fresh or hardened state. In structural applica- tions, fibers can partially or totally replace the traditional reinforcement. For these purposes, the fibers provide an enhanced post-cracking tensile strength in the hardened state by bridg- ing crack faces [3]. Commercially available fibers can be made from a number of differ- ent materials: steel, glass, synthetic and natural fibers being the most common types [4]. Un- til recently, the research effort has been focus- ing on the properties of FRC in the fresh and hardened state [5, 6]. It has been found that the inclusion of fibers decreases plastic shrink- age cracking [7] and flowability [8] in the fresh state. In the hardened state, fibers provide a post-cracking strength as is shown in references [9–11]. However, investigations on the long- term structural properties of FRC only recently became a research focal point. The recently published Model Code 2010 [12] acknowledges that time-dependent effects may significantly 1 DOI 10.21012/FC9.059
Transcript of CREEP OF CRACKED POLYMER FIBER REINFORCED … · CREEP OF CRACKED POLYMER FIBER REINFORCED CONCRETE...
9th International Conference on Fracture Mechanics of Concrete and Concrete StructuresFraMCoS-9
V. Saouma, J. Bolander, and E. Landis (Eds)
CREEP OF CRACKED POLYMER FIBER REINFORCED CONCRETEUNDER SUSTAINED TENSILE LOADING
RUTGER VRIJDAGHS∗, MARCO DI PRISCO† AND LUCIE VANDEWALLE‡
∗Katholieke Universiteit Leuven (KU Leuven)Heverlee, Belgium
e-mail: [email protected]
†Politecnico di MilanoMilan, Italy
e-mail: [email protected]
‡Katholieke Universiteit Leuven (KU Leuven)Heverlee, Belgium
e-mail: [email protected]
Key words: Creep, Fiber Reinforced Concrete, Tensile Creep, Crack Growth, Polymeric Fibers
Abstract. In fiber reinforced concrete (FRC), fibers are added to the fresh concrete mix in orderto improve the residual tensile strength, the toughness and/or durability of a concrete element. Cur-rently, structural applications remain relatively scarce as the time-dependent behavior of FRC is stillpoorly understood. This paper reports the first results of an experimental campaign regarding thecreep of cracked polymer FRC. In the test setup, cylindrical, notched FRC specimens are considered.The concrete is reinforced with structural polymeric fibers for use in load-bearing applications. In afirst step, the material is characterized according to the European Standard EN14651. Secondly, thesamples are precracked to localize the creep deformations and to monitor the crack growth in time.The samples are subjected to a sustained tensile load, whereby different load levels with respect tothe individual residual strength are considered. The results of the first months of creep loading willbe detailed and discussed in the paper.
1 INTRODUCTION
Fiber reinforced concrete (FRC) is a com-posite material in which fibers are added to thefresh concrete mix [1, 2]. These fibers are usedto improve the properties of the concrete in thefresh or hardened state. In structural applica-tions, fibers can partially or totally replace thetraditional reinforcement. For these purposes,the fibers provide an enhanced post-crackingtensile strength in the hardened state by bridg-ing crack faces [3]. Commercially availablefibers can be made from a number of differ-ent materials: steel, glass, synthetic and natural
fibers being the most common types [4]. Un-til recently, the research effort has been focus-ing on the properties of FRC in the fresh andhardened state [5, 6]. It has been found thatthe inclusion of fibers decreases plastic shrink-age cracking [7] and flowability [8] in the freshstate. In the hardened state, fibers provide apost-cracking strength as is shown in references[9–11]. However, investigations on the long-term structural properties of FRC only recentlybecame a research focal point. The recentlypublished Model Code 2010 [12] acknowledgesthat time-dependent effects may significantly
1
DOI 10.21012/FC9.059
Rutger Vrijdaghs, Marco di Prisco, Lucie Vandewalle
alter the behavior of structural elements, bothin the serviceability limit state and in the ulti-mate limit state. In the former, creep may causeunwanted and unacceptable deflections of FRCbeams [13, 14], whilst in the latter, the residualload-bearing capacity of elements may be sig-nificantly lower than the design value based onshort-term strength assessment. However, theModel Code does not provide design rules totake long-term behavior of FRC into account.It is clear that further research on the long-termstructural properties of FRC is required. Oneof these time-dependent phenomena is creep.In this paper, an experimental setup for a uni-axial tensile creep test on polymeric FRC ispresented. Furthermore, the results of the firstmonth of creep are shown and discussed as well.
2 EXPERIMENTAL SETUP
2.1 Overview
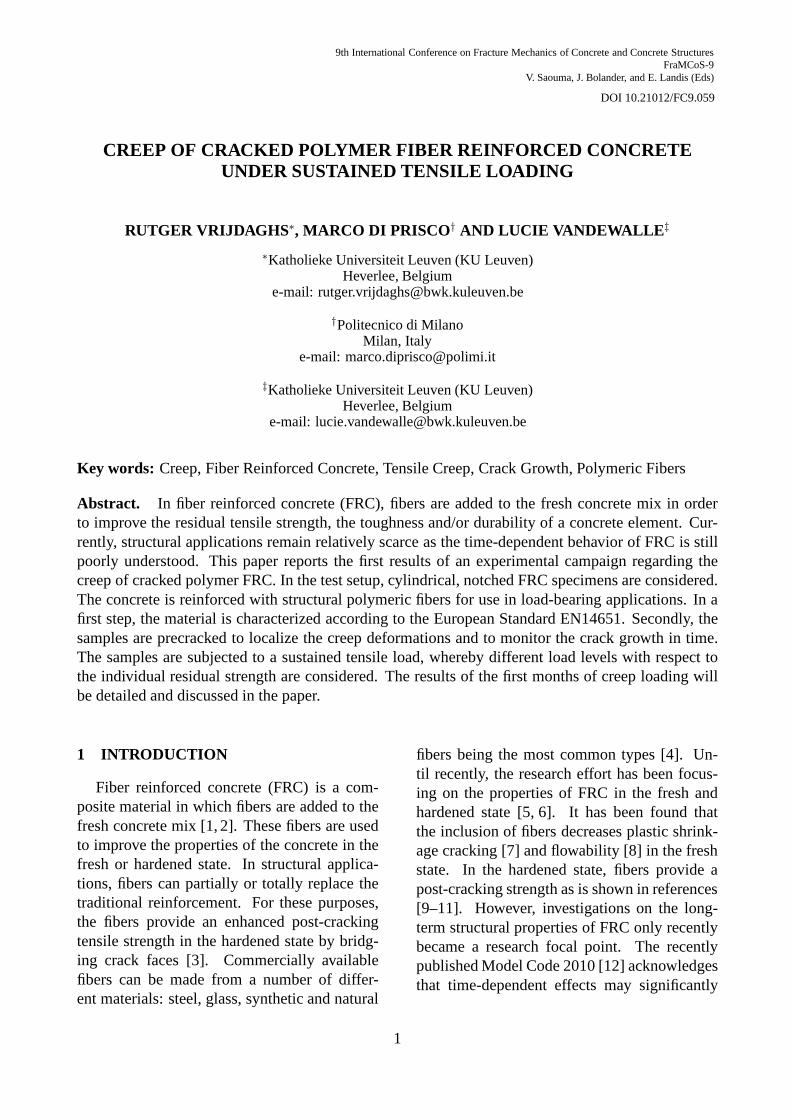
The creep behavior of polymeric FRC isstudied by applying a sustained tensile load toprecracked, notched cylinders. The specimensare cored from a FRC beam, with a length of650 mm, and a square cross-section of 1502
mm2. These beams are tested in a three-pointbending test according to the European Stan-dard EN 14651 [16]. In total, 5 beams werecast. From each beam, two cores are taken,which are then rectified. The cylinders have adepth and diameter of 300 mm and 100 mm, re-spectively. At the cylinder’s mid-height, a notchis introduced with a depth and width of 10 mm.From the 10 cored specimens, 2 cores are usedto measure shrinkage and 8 specimens are pre-cracked to an initial crack widthwinit = 0.2mm. The precracked, notched cores are thenplaced in a creep frame. An overview of the ex-perimental phase is given in Fig. 1.
150
650
100
80300
CORE N.1 CORE N.2
Figure 1: overview of coresN.1 and N.2 taken frombeamN. All dimensions in mm
2.2 Material propertiesThe concrete composition is taken from pre-
vious research on steel FRC [15] and is shownin Table 1.
CEM I 42.5R HES 350 kg/m3
sand (0/4) 835 kg/m3
gravel (4/14) 1099 kg/m3
water 175 kg/m3
superplastizer 1 kg/m3
fibers 9 kg/m3
Table 1: concrete composition
In the composition above, the fiber volumefraction is equal to 1 Vol.%. The properties ofthe fibers are shown in Table 2.
material polypropylenelength 45 mmstrengthf †
t 404.7 MPa (1.8 %)Young’s modulus† 4500 MPa (1.5 %)
Table 2: properties of the fiber†calculated according tothe revision proposal of EN 14889-2 (shown in parenthe-ses is the coefficient of variation)
2.3 Three point bending setupIn order to characterize the FRC, a three-
point bending test on 5 notched beams is per-formed according to the European Standard EN14651 [16]. The beams are tested after 28 days.
2
Rutger Vrijdaghs, Marco di Prisco, Lucie Vandewalle
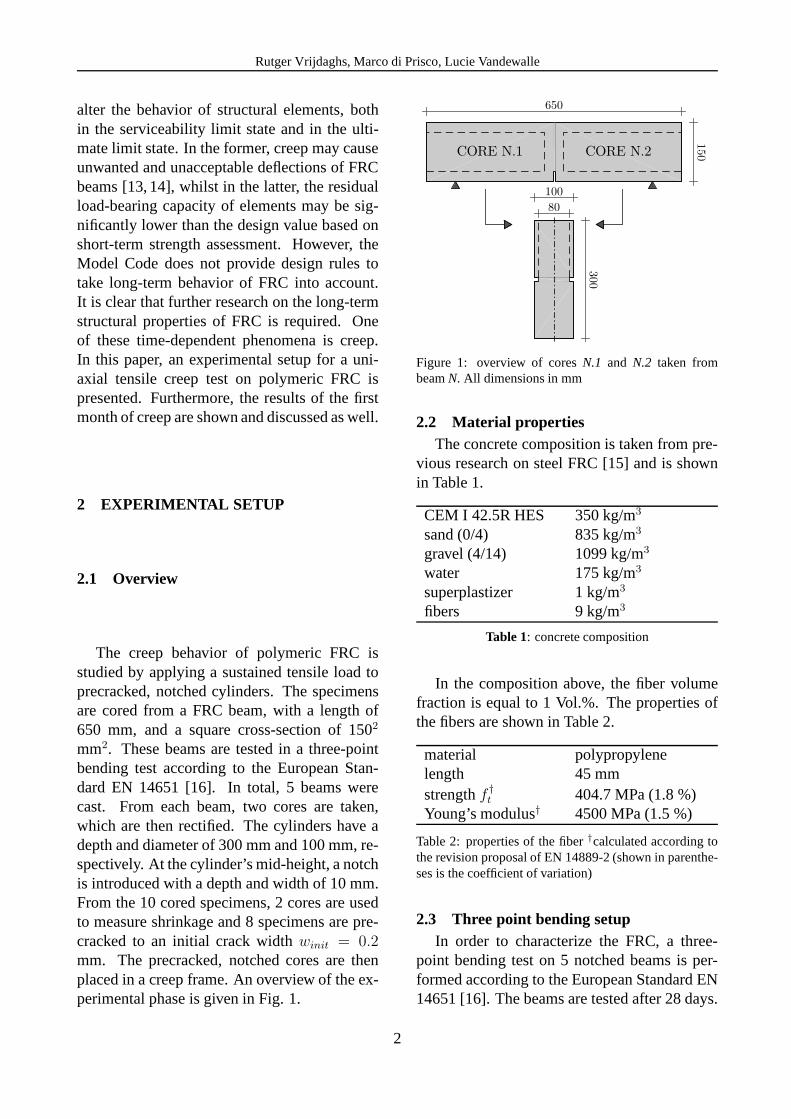
In this test, a notched square FRC beam witha span of 500 mm is tested in a displacement-controlled regime. During the test, the force andcrack mouth opening displacement (CMOD)are continuously measured at a rate of 5 Hz.The setup is shown in Fig. 2.
Figure 2: three point bending setup (taken from EN14651)
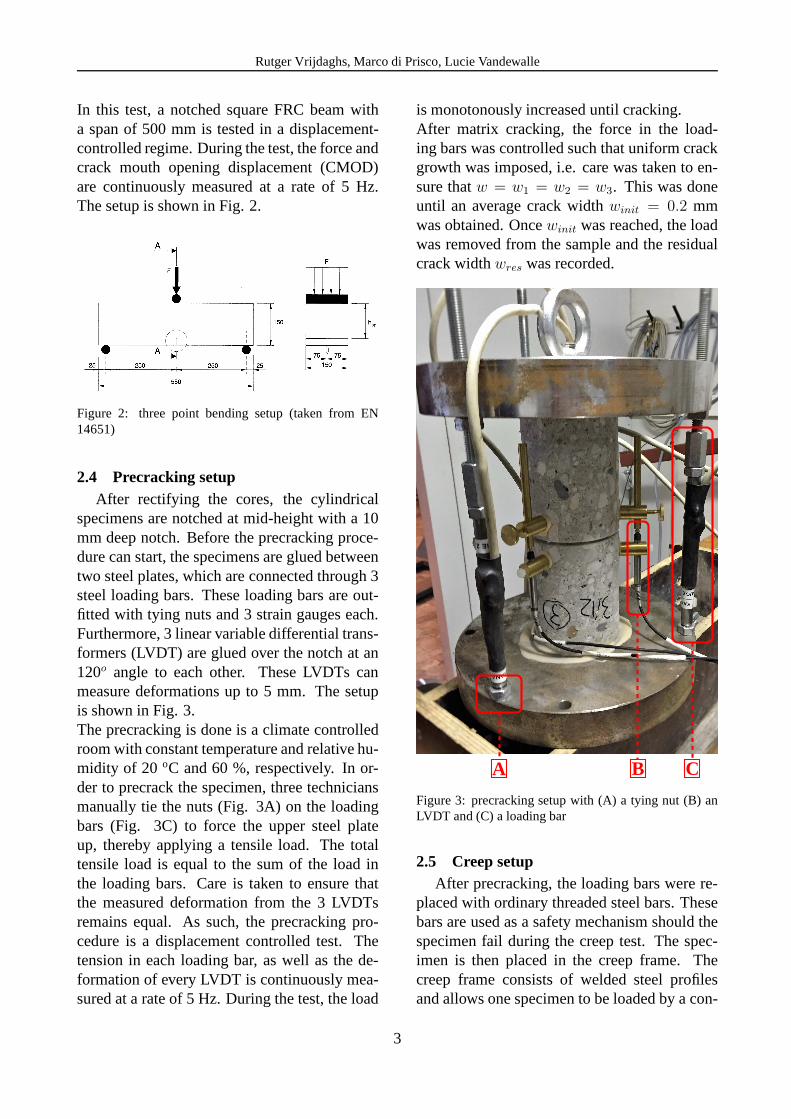
2.4 Precracking setupAfter rectifying the cores, the cylindrical
specimens are notched at mid-height with a 10mm deep notch. Before the precracking proce-dure can start, the specimens are glued betweentwo steel plates, which are connected through 3steel loading bars. These loading bars are out-fitted with tying nuts and 3 strain gauges each.Furthermore, 3 linear variable differential trans-formers (LVDT) are glued over the notch at an120o angle to each other. These LVDTs canmeasure deformations up to 5 mm. The setupis shown in Fig. 3.The precracking is done is a climate controlledroom with constant temperature and relative hu-midity of 20 oC and 60 %, respectively. In or-der to precrack the specimen, three techniciansmanually tie the nuts (Fig. 3A) on the loadingbars (Fig. 3C) to force the upper steel plateup, thereby applying a tensile load. The totaltensile load is equal to the sum of the load inthe loading bars. Care is taken to ensure thatthe measured deformation from the 3 LVDTsremains equal. As such, the precracking pro-cedure is a displacement controlled test. Thetension in each loading bar, as well as the de-formation of every LVDT is continuously mea-sured at a rate of 5 Hz. During the test, the load
is monotonously increased until cracking.After matrix cracking, the force in the load-ing bars was controlled such that uniform crackgrowth was imposed, i.e. care was taken to en-sure thatw = w1 = w2 = w3. This was doneuntil an average crack widthwinit = 0.2 mmwas obtained. Oncewinit was reached, the loadwas removed from the sample and the residualcrack widthwres was recorded.
A B C
Figure 3: precracking setup with (A) a tying nut (B) anLVDT and (C) a loading bar
2.5 Creep setupAfter precracking, the loading bars were re-
placed with ordinary threaded steel bars. Thesebars are used as a safety mechanism should thespecimen fail during the creep test. The spec-imen is then placed in the creep frame. Thecreep frame consists of welded steel profilesand allows one specimen to be loaded by a con-
3
Rutger Vrijdaghs, Marco di Prisco, Lucie Vandewalle
stant load. The load is applied through a 6:1cantilever system. Steel rings are used to min-imize bending moment transfers to the speci-men. The load is expressed as a percentageof fr,winit
, the residual strength atw = winit.In this paper, results are reported for specimensloaded at 30 % and 45 % offr,winit
. The creepframe and a photo during the creep test is shownin Fig. 4 and Fig. 5, respectively.
Figure 4: creep frame
Figure 5: creep frames with specimens during creep test
During the test, the deformation from eachLVDT is measured at a rate of 1 Hz duringthe first 24 hours of creep loading, and subse-quently lowered to 0.1 Hz. The cylinders aretested after 62 days in the same environmentalconditions as during precracking.
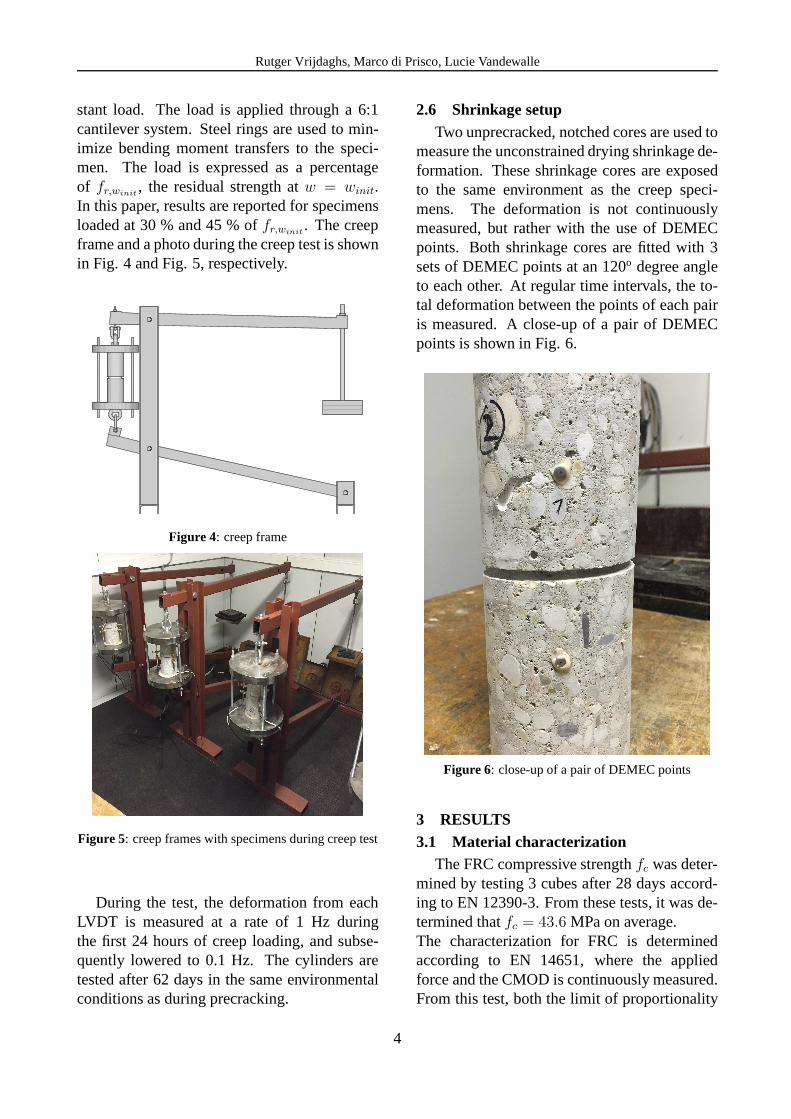
2.6 Shrinkage setupTwo unprecracked, notched cores are used to
measure the unconstrained drying shrinkage de-formation. These shrinkage cores are exposedto the same environment as the creep speci-mens. The deformation is not continuouslymeasured, but rather with the use of DEMECpoints. Both shrinkage cores are fitted with 3sets of DEMEC points at an 120o degree angleto each other. At regular time intervals, the to-tal deformation between the points of each pairis measured. A close-up of a pair of DEMECpoints is shown in Fig. 6.
Figure 6: close-up of a pair of DEMEC points
3 RESULTS3.1 Material characterization
The FRC compressive strengthfc was deter-mined by testing 3 cubes after 28 days accord-ing to EN 12390-3. From these tests, it was de-termined thatfc = 43.6 MPa on average.The characterization for FRC is determinedaccording to EN 14651, where the appliedforce and the CMOD is continuously measured.From this test, both the limit of proportionality
4
Rutger Vrijdaghs, Marco di Prisco, Lucie Vandewalle
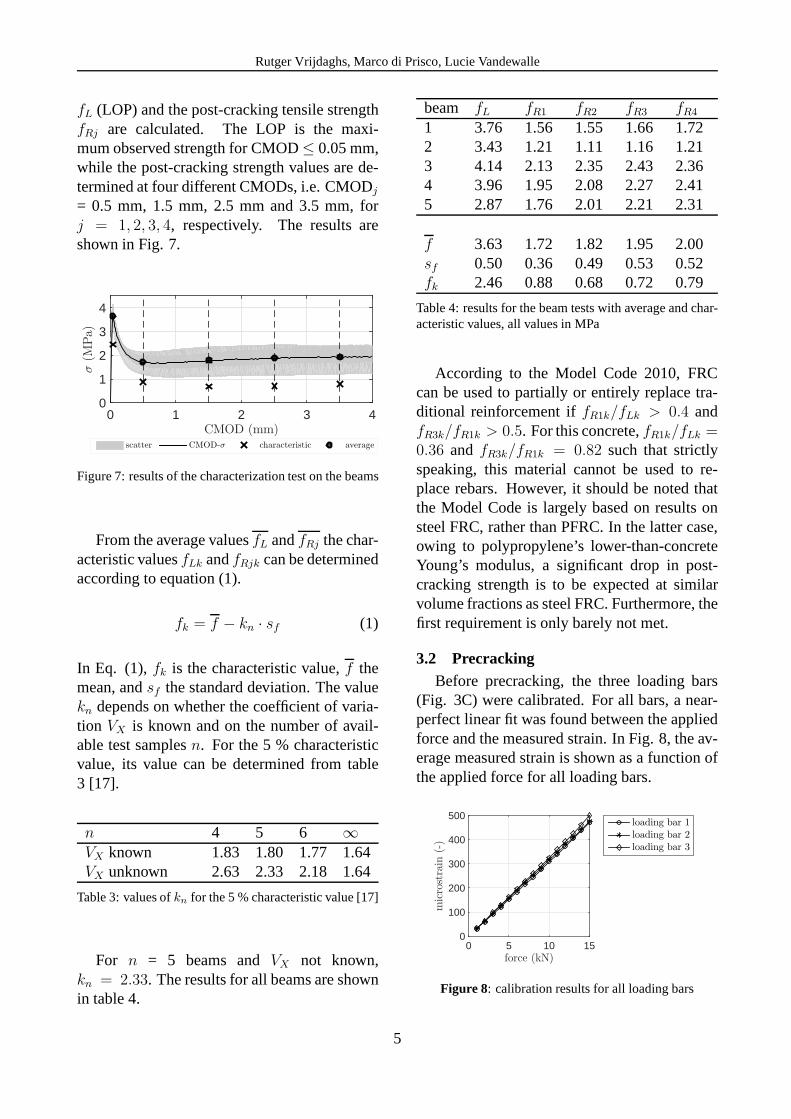
fL (LOP) and the post-cracking tensile strengthfRj are calculated. The LOP is the maxi-mum observed strength for CMOD≤ 0.05 mm,while the post-cracking strength values are de-termined at four different CMODs, i.e. CMODj= 0.5 mm, 1.5 mm, 2.5 mm and 3.5 mm, forj = 1, 2, 3, 4, respectively. The results areshown in Fig. 7.
CMOD (mm)0 1 2 3 4
σ(M
Pa)
0
1
2
3
4
scatter CMOD-σ characteristic average
Figure 7: results of the characterization test on the beams
From the average valuesfL andfRj the char-acteristic valuesfLk andfRjk can be determinedaccording to equation (1).
fk = f − kn · sf (1)
In Eq. (1),fk is the characteristic value,f themean, andsf the standard deviation. The valuekn depends on whether the coefficient of varia-tion VX is known and on the number of avail-able test samplesn. For the 5 % characteristicvalue, its value can be determined from table3 [17].
n 4 5 6 ∞
VX known 1.83 1.80 1.77 1.64VX unknown 2.63 2.33 2.18 1.64
Table 3: values ofkn for the 5 % characteristic value [17]
For n = 5 beams andVX not known,kn = 2.33. The results for all beams are shownin table 4.
beam fL fR1 fR2 fR3 fR4
1 3.76 1.56 1.55 1.66 1.722 3.43 1.21 1.11 1.16 1.213 4.14 2.13 2.35 2.43 2.364 3.96 1.95 2.08 2.27 2.415 2.87 1.76 2.01 2.21 2.31
f 3.63 1.72 1.82 1.95 2.00sf 0.50 0.36 0.49 0.53 0.52fk 2.46 0.88 0.68 0.72 0.79
Table 4: results for the beam tests with average and char-acteristic values, all values in MPa
According to the Model Code 2010, FRCcan be used to partially or entirely replace tra-ditional reinforcement iffR1k/fLk > 0.4 andfR3k/fR1k > 0.5. For this concrete,fR1k/fLk =0.36 and fR3k/fR1k = 0.82 such that strictlyspeaking, this material cannot be used to re-place rebars. However, it should be noted thatthe Model Code is largely based on results onsteel FRC, rather than PFRC. In the latter case,owing to polypropylene’s lower-than-concreteYoung’s modulus, a significant drop in post-cracking strength is to be expected at similarvolume fractions as steel FRC. Furthermore, thefirst requirement is only barely not met.
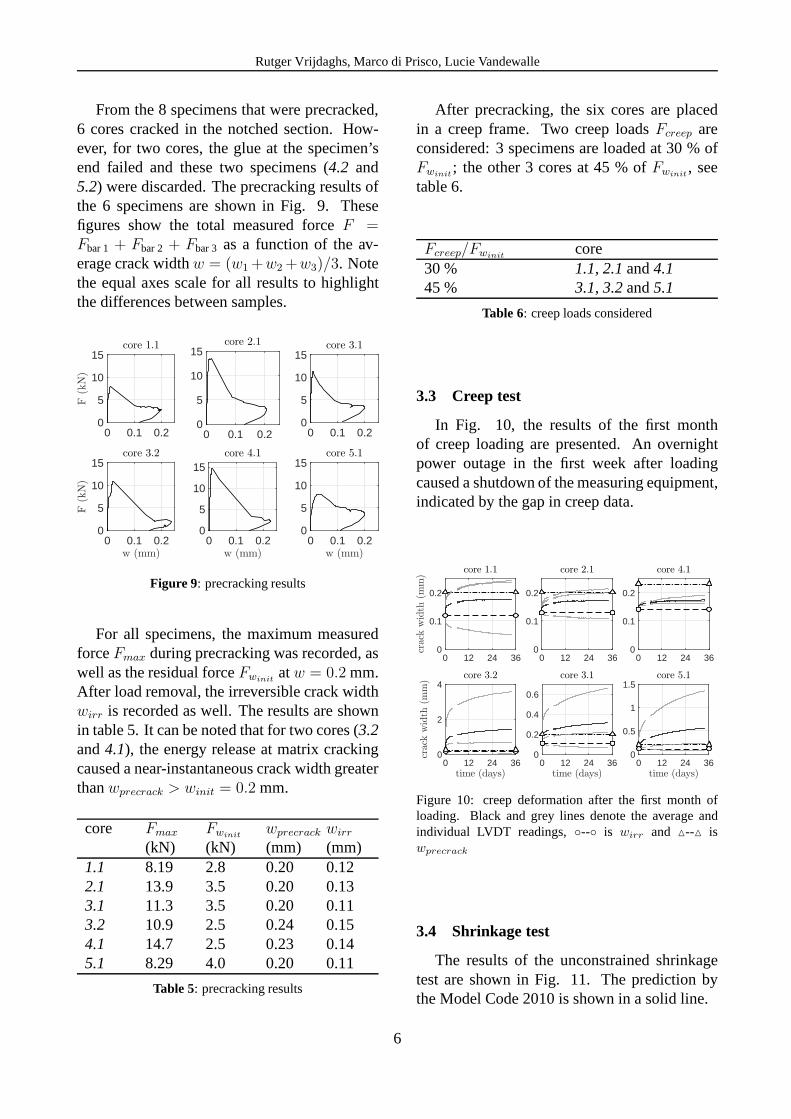
3.2 PrecrackingBefore precracking, the three loading bars
(Fig. 3C) were calibrated. For all bars, a near-perfect linear fit was found between the appliedforce and the measured strain. In Fig. 8, the av-erage measured strain is shown as a function ofthe applied force for all loading bars.
force (kN)0 5 10 15
microstrain
(-)
0
100
200
300
400
500loading bar 1loading bar 2loading bar 3
Figure 8: calibration results for all loading bars
5
Rutger Vrijdaghs, Marco di Prisco, Lucie Vandewalle
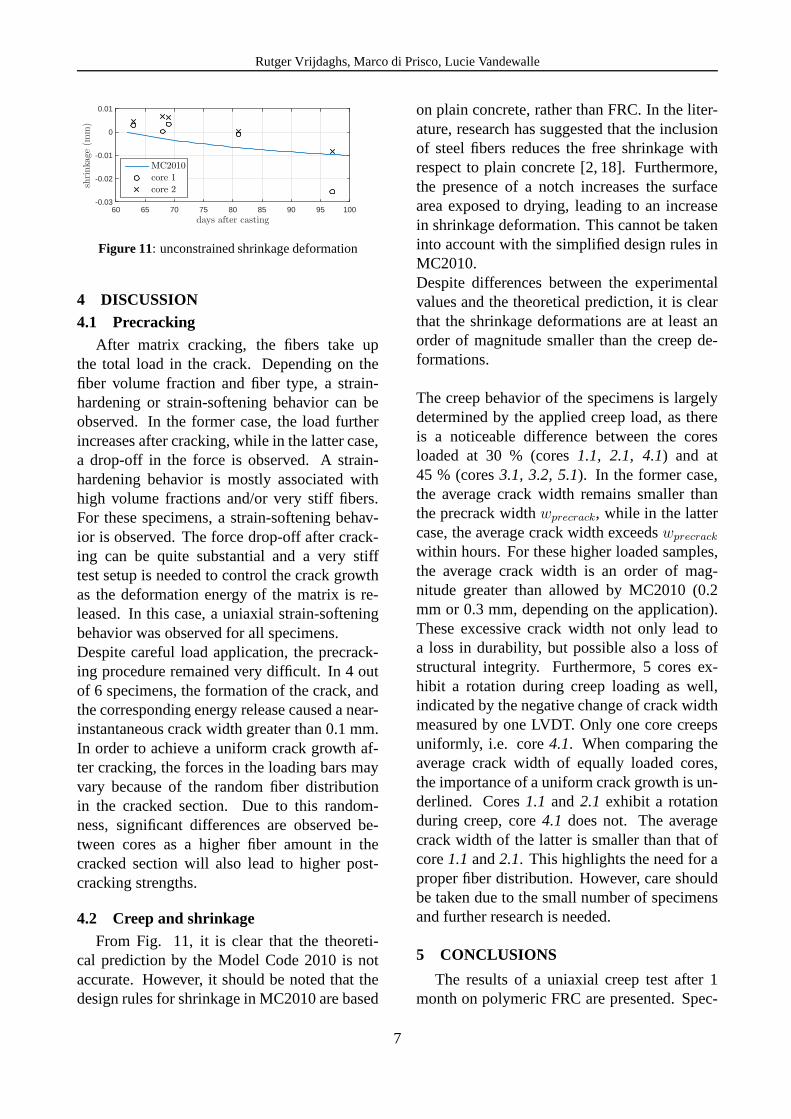
From the 8 specimens that were precracked,6 cores cracked in the notched section. How-ever, for two cores, the glue at the specimen’send failed and these two specimens (4.2 and5.2) were discarded. The precracking results ofthe 6 specimens are shown in Fig. 9. Thesefigures show the total measured forceF =Fbar 1 + Fbar 2 + Fbar 3 as a function of the av-erage crack widthw = (w1+w2+w3)/3. Notethe equal axes scale for all results to highlightthe differences between samples.
0 0.1 0.2
F(kN)
0
5
10
15core 1.1
0 0.1 0.20
5
10
15core 3.1
w (mm)0 0.1 0.2
F(kN)
0
5
10
15core 3.2
w (mm)0 0.1 0.2
0
5
10
15core 4.1
w (mm)0 0.1 0.2
0
5
10
15core 5.1
0 0.1 0.20
5
10
15core 2.1
Figure 9: precracking results
For all specimens, the maximum measuredforceFmax during precracking was recorded, aswell as the residual forceFwinit
atw = 0.2 mm.After load removal, the irreversible crack widthwirr is recorded as well. The results are shownin table 5. It can be noted that for two cores (3.2and4.1), the energy release at matrix crackingcaused a near-instantaneous crack width greaterthanwprecrack > winit = 0.2 mm.
core Fmax
(kN)Fwinit
(kN)wprecrack
(mm)wirr
(mm)1.1 8.19 2.8 0.20 0.122.1 13.9 3.5 0.20 0.133.1 11.3 3.5 0.20 0.113.2 10.9 2.5 0.24 0.154.1 14.7 2.5 0.23 0.145.1 8.29 4.0 0.20 0.11
Table 5: precracking results
After precracking, the six cores are placedin a creep frame. Two creep loadsFcreep areconsidered: 3 specimens are loaded at 30 % ofFwinit
; the other 3 cores at 45 % ofFwinit, see
table 6.
Fcreep/Fwinitcore
30 % 1.1, 2.1 and4.145 % 3.1, 3.2 and5.1
Table 6: creep loads considered
3.3 Creep test
In Fig. 10, the results of the first monthof creep loading are presented. An overnightpower outage in the first week after loadingcaused a shutdown of the measuring equipment,indicated by the gap in creep data.
0 12 24 36
crackwidth
(mm)
0
0.1
0.2
core 1.1
0 12 24 360
0.1
0.2
core 2.1
0 12 24 360
0.1
0.2
core 4.1
time (days)0 12 24 36
0
0.2
0.4
0.6
core 3.1
time (days)0 12 24 36
crackwidth
(mm)
0
2
4core 3.2
time (days)0 12 24 36
0
0.5
1
1.5core 5.1
Figure 10: creep deformation after the first month ofloading. Black and grey lines denote the average andindividual LVDT readings,◦--◦ is wirr and △--△ iswprecrack
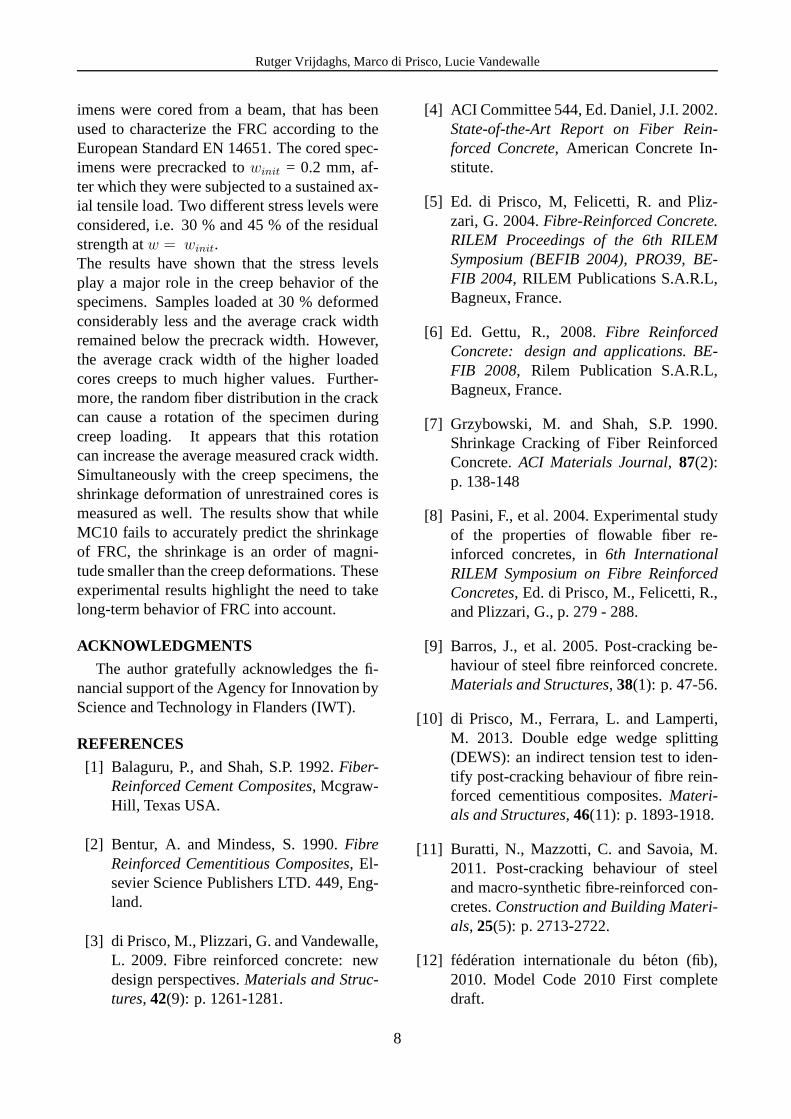
3.4 Shrinkage test
The results of the unconstrained shrinkagetest are shown in Fig. 11. The prediction bythe Model Code 2010 is shown in a solid line.
6
Rutger Vrijdaghs, Marco di Prisco, Lucie Vandewalle
days after casting60 65 70 75 80 85 90 95 100
shrinkage(m
m)
-0.03
-0.02
-0.01
0
0.01
MC2010
core 1
core 2
Figure 11: unconstrained shrinkage deformation
4 DISCUSSION4.1 Precracking
After matrix cracking, the fibers take upthe total load in the crack. Depending on thefiber volume fraction and fiber type, a strain-hardening or strain-softening behavior can beobserved. In the former case, the load furtherincreases after cracking, while in the latter case,a drop-off in the force is observed. A strain-hardening behavior is mostly associated withhigh volume fractions and/or very stiff fibers.For these specimens, a strain-softening behav-ior is observed. The force drop-off after crack-ing can be quite substantial and a very stifftest setup is needed to control the crack growthas the deformation energy of the matrix is re-leased. In this case, a uniaxial strain-softeningbehavior was observed for all specimens.Despite careful load application, the precrack-ing procedure remained very difficult. In 4 outof 6 specimens, the formation of the crack, andthe corresponding energy release caused a near-instantaneous crack width greater than 0.1 mm.In order to achieve a uniform crack growth af-ter cracking, the forces in the loading bars mayvary because of the random fiber distributionin the cracked section. Due to this random-ness, significant differences are observed be-tween cores as a higher fiber amount in thecracked section will also lead to higher post-cracking strengths.
4.2 Creep and shrinkageFrom Fig. 11, it is clear that the theoreti-
cal prediction by the Model Code 2010 is notaccurate. However, it should be noted that thedesign rules for shrinkage in MC2010 are based
on plain concrete, rather than FRC. In the liter-ature, research has suggested that the inclusionof steel fibers reduces the free shrinkage withrespect to plain concrete [2, 18]. Furthermore,the presence of a notch increases the surfacearea exposed to drying, leading to an increasein shrinkage deformation. This cannot be takeninto account with the simplified design rules inMC2010.Despite differences between the experimentalvalues and the theoretical prediction, it is clearthat the shrinkage deformations are at least anorder of magnitude smaller than the creep de-formations.
The creep behavior of the specimens is largelydetermined by the applied creep load, as thereis a noticeable difference between the coresloaded at 30 % (cores1.1, 2.1, 4.1) and at45 % (cores3.1, 3.2, 5.1). In the former case,the average crack width remains smaller thanthe precrack widthwprecrack, while in the lattercase, the average crack width exceedswprecrack
within hours. For these higher loaded samples,the average crack width is an order of mag-nitude greater than allowed by MC2010 (0.2mm or 0.3 mm, depending on the application).These excessive crack width not only lead toa loss in durability, but possible also a loss ofstructural integrity. Furthermore, 5 cores ex-hibit a rotation during creep loading as well,indicated by the negative change of crack widthmeasured by one LVDT. Only one core creepsuniformly, i.e. core4.1. When comparing theaverage crack width of equally loaded cores,the importance of a uniform crack growth is un-derlined. Cores1.1 and 2.1 exhibit a rotationduring creep, core4.1 does not. The averagecrack width of the latter is smaller than that ofcore1.1 and2.1. This highlights the need for aproper fiber distribution. However, care shouldbe taken due to the small number of specimensand further research is needed.
5 CONCLUSIONS
The results of a uniaxial creep test after 1month on polymeric FRC are presented. Spec-
7
Rutger Vrijdaghs, Marco di Prisco, Lucie Vandewalle
imens were cored from a beam, that has beenused to characterize the FRC according to theEuropean Standard EN 14651. The cored spec-imens were precracked towinit = 0.2 mm, af-ter which they were subjected to a sustained ax-ial tensile load. Two different stress levels wereconsidered, i.e. 30 % and 45 % of the residualstrength atw = winit.The results have shown that the stress levelsplay a major role in the creep behavior of thespecimens. Samples loaded at 30 % deformedconsiderably less and the average crack widthremained below the precrack width. However,the average crack width of the higher loadedcores creeps to much higher values. Further-more, the random fiber distribution in the crackcan cause a rotation of the specimen duringcreep loading. It appears that this rotationcan increase the average measured crack width.Simultaneously with the creep specimens, theshrinkage deformation of unrestrained cores ismeasured as well. The results show that whileMC10 fails to accurately predict the shrinkageof FRC, the shrinkage is an order of magni-tude smaller than the creep deformations. Theseexperimental results highlight the need to takelong-term behavior of FRC into account.
ACKNOWLEDGMENTS
The author gratefully acknowledges the fi-nancial support of the Agency for Innovation byScience and Technology in Flanders (IWT).
REFERENCES
[1] Balaguru, P., and Shah, S.P. 1992.Fiber-Reinforced Cement Composites, Mcgraw-Hill, Texas USA.
[2] Bentur, A. and Mindess, S. 1990.FibreReinforced Cementitious Composites, El-sevier Science Publishers LTD. 449, Eng-land.
[3] di Prisco, M., Plizzari, G. and Vandewalle,L. 2009. Fibre reinforced concrete: newdesign perspectives.Materials and Struc-tures, 42(9): p. 1261-1281.
[4] ACI Committee 544, Ed. Daniel, J.I. 2002.State-of-the-Art Report on Fiber Rein-forced Concrete, American Concrete In-stitute.
[5] Ed. di Prisco, M, Felicetti, R. and Pliz-zari, G. 2004.Fibre-Reinforced Concrete.RILEM Proceedings of the 6th RILEMSymposium (BEFIB 2004), PRO39, BE-FIB 2004, RILEM Publications S.A.R.L,Bagneux, France.
[6] Ed. Gettu, R., 2008.Fibre ReinforcedConcrete: design and applications. BE-FIB 2008, Rilem Publication S.A.R.L,Bagneux, France.
[7] Grzybowski, M. and Shah, S.P. 1990.Shrinkage Cracking of Fiber ReinforcedConcrete.ACI Materials Journal, 87(2):p. 138-148
[8] Pasini, F., et al. 2004. Experimental studyof the properties of flowable fiber re-inforced concretes, in6th InternationalRILEM Symposium on Fibre ReinforcedConcretes, Ed. di Prisco, M., Felicetti, R.,and Plizzari, G., p. 279 - 288.
[9] Barros, J., et al. 2005. Post-cracking be-haviour of steel fibre reinforced concrete.Materials and Structures, 38(1): p. 47-56.
[10] di Prisco, M., Ferrara, L. and Lamperti,M. 2013. Double edge wedge splitting(DEWS): an indirect tension test to iden-tify post-cracking behaviour of fibre rein-forced cementitious composites.Materi-als and Structures, 46(11): p. 1893-1918.
[11] Buratti, N., Mazzotti, C. and Savoia, M.2011. Post-cracking behaviour of steeland macro-synthetic fibre-reinforced con-cretes.Construction and Building Materi-als, 25(5): p. 2713-2722.
[12] federation internationale du beton (fib),2010. Model Code 2010 First completedraft.
8
Rutger Vrijdaghs, Marco di Prisco, Lucie Vandewalle
[13] Kurtz, S. and Balaguru, P. 2000. Postcrackcreep of polymeric fiber-reinforced con-crete in flexure.Cement and Concrete Re-search, 30(2): p. 183-190.
[14] MacKay, J. and Trottier, J. 2004. Post-crack creep behavior of steel and syntheticFRC under flexural loading.Shotcrete:More Engineering Developments, Taylor& Francis. p. 183-192.
[15] Zhao, G., di Prisco M., Vandewalle L.2014. Experimental investigation on uni-axial tensile creep behavior of crackedsteel fiber reinforced concrete.Materialsand Structures, 48(10): p. 3173-3185.
[16] European Committee for Standardization,2005. EN 14651 Test method for metal-lic fibered concrete - Measuring the flexu-ral tensile strength (limit of proportional-ity (LOP), residual).
[17] European Committee for Standardization,2002. EN1990: Basis of structural design.
[18] Malmberg, B. and Skarendahl, A. 1978.Method of stuyding the cracking of fi-bre concrete under restrained shrinkage.Testing and test methods of Fibre CementComposites. UK: The Construction Press.
9