CREEP BEHAVIOR OF ROCK - CORE
35
CREEP BEHAVIOR OF ROCK a thesis submitted in partial fulfillment of the requirements for the degree of Bachelor of Technology In Mining Engineering By MANAS RANJAN BHOI 108MN028 Department of Mining Engineering National Institute of Technology Rourkela-769008 2012 brought to you by CORE View metadata, citation and similar papers at core.ac.uk provided by ethesis@nitr
Transcript of CREEP BEHAVIOR OF ROCK - CORE

CREEP BEHAVIOR OF ROCK a thesis submitted in partial fulfillment of the requirements for the degree of
Bachelor of Technology
In
Mining Engineering
By
MANAS RANJAN BHOI
108MN028
Department of Mining Engineering
National Institute of Technology Rourkela-769008
2012
brought to you by COREView metadata, citation and similar papers at core.ac.uk
provided by ethesis@nitr

CREEP BEHAVIOR OF ROCK
A THESIS SUBMITTED IN PARTIAL FULFILLMENT OF THE
REQUIREMENTS FOR THE DEGREE OF
Bachelor of Technology
In
Mining Engineering
By
MANAS RANJAN BHOI
Under the Guidance of
Dr. MANOJ KUMAR MISHRA
Department of Mining Engineering
National Institute of Technology Rourkela-769008
2012

National Institute of Technology Rourkela
CERTIFICATE
This is to certify that the thesis entitled “CREEP BEHAVIOR OF ROCK” submitted by Sri
Manas Ranjan Bhoi, Roll no. 108MN028 in partial fulfillment of the requirements for the award
of Bachelor of Technology degree in Mining Engineering at the National Institute of
Technology, Rourkela (Deemed University) is an authentic work carried out by him under my
supervision and guidance.
To the best of my knowledge, the matter embodied in the thesis has not been submitted to any
other University/Institute for the award of any Degree or Diploma.
Date: (Dr. MANOJ KUMAR MISHRA)

ACKNOWLEDGEMENT
My heart pulsates with the thrill for tendering gratitude to those persons who helped me in the
completion of the project. The most pleasant point of presenting a thesis is the opportunity to thank
those who have contributed to it. Unfortunately, the list of expressions of thank no matter how
extensive is always incomplete and inadequate. Indeed this page of acknowledgment shall never be
able to touch the horizon of generosity of those who tendered their help to me. First and foremost, I
would like to express my gratitude and indebtedness to Dr. Manoj Kumar Mishra,for his kindness in
allowing me for introducing the present topic and for his inspiring guidance, constructive criticism and
valuable suggestion throughout this project work. I am sincerely thankful to him for his able guidance
and pain taking effort in improving my understanding of this project. I am also grateful to Mr. B.N.
Mallick in Department of Mining Engineering for his assistance and help in carrying out different
experiments in the laboratories. An assemblage of this nature could never have been attempted without
reference to and inspiration from the works of others whose details are mentioned in reference section.
I acknowledge my indebtedness to all of them. Last but not least, my sincere thanks to all my friends
who have patiently extended all sorts of help for accomplishing this undertaking.
MANAS RANJAN BHOI
Dept. of Mining engineering
National Institute of Technology Rourkela – 769008

CONTENTS
Contents Page no.
Certificate
Acknowledgement
Abstract
1. Introduction 1
1.1. Introduction 1
1.2. Aim of the study 2
1.3. Objective of the study 2
1.4. Methodology 2
2. Literature review 4
2.1. Rock 4
2.2. Mining 4
2.3. Creep 5
2.4. Properties of rock 10
2.4.1. Physical properties 10
2.4.1.1. Hardness 10
2.4.1.2. Abrasivity 10
2.4.1.3. Permeability 10
2.4.1.4. Wave velocity 10
2.4.2. Mechanical properties 11
2.4.2.1. Compressive strength 11
2.4.2.2. Young’s modulus and poisson ratio 11
2.4.2.3. Stress- strain and after peak 12
2.4.2.4. Tensile strength 12
2.4.2.5. Shear strength 13
3. Experimentation 14
3.1. Creep test 14
3.1.1. Method for determining creep 14
3.1.2. Principle 14
3.1.3. Apparatus 15
3.1.3.1. Loading device 15
3.1.3.1.1. Fixed column 15
3.1.3.1.2. Moving column 15
3.1.3.1.3. Two discs 16
3.1.3.1.4. Furnace 17
3.1.3.1.5. Measuring device 17
3.1.4. Procedure 17
4. Results and discussion 18
4.1. Observation 18
4.1.1. UCS observation 18
4.1.2. Creep test of chromite ore 19
4.2. Results 27
4.3. Conclusion 27
5. Reference 28

ABSTRACT
Mining activities of minerals play a very important role on the health and wealth of any nation.
Though technology has reduced the adverse effects to a great extent, it is still experiencing
unpredictable behavior of rocks. The physical and mechanical properties of rocks are important
design parameters of any excavation process. The consideration of time dependence is essential
for the study of deformation and fracturing processes of rock material, especially for those
subjected to strong compressive and tensile stresses. In this study creep test is conducted in
chromite ore under uniaxial compressive stresses. The behavior of rock is investigated as well as
strength of rock. Creep behavior of rocks has been evaluated at varying stress and temperature
rate. The relationship between compressive stress and time under uniaxial compression has also
been developed. Finally nonlinear creep model is used to describe the creep behaviors of rocks
under uniaxial compressive strength

1
CHAPTER 01
1.INTRODUCTION
1.1 Introduction:-
In the recent years civilization has increased and so the modern amenities in the form of minerals
and power. To fulfill this requirement by the people mining has also increased. Mining produces
both power and minerals to the society. Mainly two types of rock are being excavated namely
coal and non-coal (mineral). Which can be categorize as soft rock and hard rock. Coal is soft
rock where as minerals are hard rock. Due to mining changes in dynamic force ad temperature
takes place underneath the earth crust.
To characterize rock behavior for engineering purposes, elasto-plastic models are usually
considered thus neglecting the time influence on the deformation mechanisms and rock strength
level. Even if viscous effects are not significant when compared to elasto plastic effects in usual
laboratory testing, disregarding these effects could lead to large discrepancies between pre-
directed data and real field measurements. For instance when considering deep excavations in
rocks, such as large section tunnels or drilling bore holes, neglecting time effects may lead to
incorrect evaluation of deformations at the walls and thus impact on the criteria for selection of
the proper design.
An even more interesting case is related to the compaction of hydrocarbon reservoirs and the
induced land subsidence, where surface deformations are either underestimated. In the case of
the Ekofisk oil field, where subsidence has reached 6m, several modifications were needed to
estimate correctly the subsidence amount. On the other hand there are compacting fields in
normally consolidated basins whose overlying strata behave in a more rigid way with respect to
the model prediction.

2
In these cases, if time effects have been considered, generally they are linked to the consolidation
effects due to the increase of effective stresses. But creep effects that are due to the presence of
stationary load are not accounted for, even if they may contribute to modify the rock behavior by
reducing the yield stress and strength level.
The macroscopic stress strain time behavior resulting from these tests can be described using
rheological models, which consist of a combination of elements such as springs, plastic sliders
and dashpots that emulate the basics features of the material behavior .placing elements in series
and / or parallel and by varying their characteristics, the rheological models help to give a better
understanding of the visco-elastics and elsto – viscoplastics behavior. However, these models
have deficiency, because they do not account for shear and normal stress, temperature and
intrinsic structure. Phenomenological laws, based on physical processes can be developed to
characterize rock behavior under more general stress, strain and time conditions.
In the last decades, many experimental and theoretical studies have been devoted to describe the
viscous behavior of low porosity rocks and rock salt.
1.2 Aim and objectives of the Study;
The goal of the investigation is to evaluate the mechanical properties of rock under
various conditions. The specific objectives adopted to achieve the goal are following:
To critically review the literature to understand different aspects of rock and its behavior
To determine the mechanical properties of rocks at various temperature and pressure
1.4 Methodology:-
The objectives mentioned above could only be accomplished if worked in a plan approach. The
first step towards an ambition always starts with exploring everything about it. Hence I began
with the literature review. In this regard the books, journals, papers proved to be a rich source of
knowledge and were thoroughly studied and learned.
This was followed by collection of sample from the local mine. Samples from many sample
points were collected and carefully packed hermetically in a vibration proof box and sent to the
laboratory for the analysis. After the sample collection the samples were prepared for laboratory

3
testing. Results were found out from the experiment an then creep behavior is analyzed.
Conclusions were drawn from the results and analysis. The following flow chart describe details
about the methodology
Literature review
Development base knowledge
Location of sample source and sample collection
Determination of properties
Determination of creep behavior in temperature and pressure
Conclusion

4
Chapter 02
LITERATURE REVIEW
2.1 ROCK
Rock is a naturally occurring solid aggregate of minerals . The Earth's outer solid layer, the
lithosphere, is made of rock. In general, rocks are of three types, namely igneous, sedimentary,
and metamorphic. The scientific study of rocks is called petrology, and petrology is an essential
component of geology.
2.2 MINING
Mining is the extraction of valuable minerals or other geological materials from the earth, from
an ore body, vein or (coal) seam. This term also includes the removal of soil. Materials recovered
by mining include base metals, precious metals, iron, uranium, coal, diamonds, limestone, oil
shale, rock salt and potash. Mining is required to obtain any material that cannot be grown
through agricultural processes, or created artificially in a laboratory or factory. Mining in a wider
sense comprises extraction of any non-renewable resource (e.g., petroleum, natural gas, or even
water).
Figure1. mining operation

5
Mining of stone and metal has been done since pre-historic times. Modern mining processes
involve prospecting for ore bodies, analysis of the profit potential of a proposed mine, extraction
of the desired materials and finally reclamation of the land to prepare it for other uses once the
mine is closed.
The nature of mining processes creates a potential negative impact on the environment both
during the mining operations and for years after the mine is closed. This impact has led to most
of the world's nations adopting regulations to moderate the negative effects of mining operations.
Safety has long been a concern as well, though modern practices have improved safety in mines
significantly.
2.3 CREEP
Creep refers to the time-dependent deformation of soil or rock resulting from internal
rearrangement of particles in response to the application of a sustained stress difference = (σ1-
σ3)generally smaller than the stress difference of the soil at failure =(σ1-σ3)f where σ1, σ3 are the
major and minor compressive principal stresses, respectively. Deformation during undrained
creep results from shape distortion as the soil mobilizes a constant shearing resistance in
response to the shear stresses applied upon loading or unloading. Creep models have been
applied toward the solution of a variety of engineering problems, such as the closure of and loads
on tunnels, chambers, and pillars in creep-sensitive materials, such as salt, shale, and fault zones.
Highly stressed and creep sensitive ground encountered in underground excavations is described
in tunnel man’s terminology as squeezing ground, inasmuch as it leads to a gradual closing of the
opening under practically undrained conditions.
Undrained creep behavior is closely related to the drained creep phenomenon associated with
secondary consolidation and swelling inasmuch as the mechanisms that cause volume change.
Several workers have studied creep (time-dependent
Several workers have studied creep of pillars in underground mines, particularly salt and potash
mines. Those studies indicated that deformation of pillars did not occur instantaneously but

6
increase with time. Pillars, which appear stable after mining may deteriorate with time and
subsequently fail due to the development of limiting vertical deformation. Pillar failure takes
place at a range of vertical stresses; failure at high stresses taking place earlier than at low
stresses.
Figure2 standard creep behavior
The knowledge of deformational characteristics of the supporting pillars is essential
for designing the mine workings, and also helps in determining the life of the pillars
underground. The time taken by a pillar to reach an unstable condition can be calculated from an
experimental value of the maximum possible vertical deformation and the rate of convergence
measured in situ. The value of deformation at which the deformation at which the deformation
rate starts to accelerate is chosen as the boundary between stability and instability.
Pomeroy carried out creep experiments on a number of coal specimens and found that
anthracite did not creep and always failed explosively. He related this to the frequent occurrence
of out bursts in anthracite mines. If coal creeps the stresses are easily accommodated as workings
advance and the strength of coal is not exceeded; but if coal does not creep as is the case with
anthracite, its strength is exceeded and this results in violent outbursts.
The results of creep studies are useful for predicting slope failure as well. Saito has
described a method of predicting the time of slope failure by means of steady state creep rate. In
a later paper he has also described another method of predicting time of a land slide by the
tertiary creep method. It is quite likely that sometimes only tertiary stage creep is observed
because of the late installation of devices at the site.

7
Maranini and Brignoli (1999) experimented uniaxial, triaxial, and hydrostatic tests (both
standard tests and creep tests) to know the behavior of PietraLeccese. This rock is massive
unfractured limestone. The predominant deformation mechanisms were crack propagation (at
low confining pressures) and pore collapse (at higher stresses). During creep tests, the squeezing
of pores lead to lowering of the yield stress, in triaxial and hydrostatic configurations.
Price (1964) carried out bending and compressive creep tests on different sandstones, a
siltstone, and muddy limestone. He showed that a Bingham-Voigt model, mostly described
results of the bending tests. Using the results of Price’s bending tests on Pennant Sandstone,
Boukharov et al.(1995) used time effect models for each stage of creep and applied the models to
explain deflection of beam over time.
Price’s (1964) tests included the most of the work done yet on coal-measure rock.
Wawersik (1985) experimented intact and jointed rock specimens namely Westerly Granite and
Navaho Sandstone in uniaxial and tri-axial compression. Creep of the rock was observed, mostly
when water was present. And in clean, interlocked joint very little creep was seen. Based on this,
Wawersik concluded that the creep behavior of jointed rock has the same character as that of the
intact material, but with a larger amount of strain.
Considering Wawersik’s observation and the large strains needed to account for the
amount of roof sagseenin some coal mines, it is likely that creep in brittle coalmine occurs
because of (1) micro-cracking along weak bedding planes and (2) weakening of asperities of
joints. Because of the much friable character of the mudstone analyzed in this study along
bedding, it can be seen reasonable to conceptualize the shear plane in the mudstone as a cohesive
quasi-joint. For a joint, it is important to actuate frictional properties in addition to creep
characteristics.
Amadei (1979) and Amadei and Curran (1980) experimented direct-shear and tri-axial tests on
unfilled clean joints sawn in specimens of sandstone, limestone, marble, and granite.Theysaid
that shear displacement was of the form
where A, B, and C are constants which depend on the ratio of applied shear stress to peak shear
strength, properties of the intact rock, and joint surface conditions, respectively.
Solberg et al.(1978) conducted tri-axial tests on Westerly Granite with saw-cut joints
filled with crushed Westerly Granite. A confining pressure of 400 MPa (58,000 psi) was applied.

8
They found a correlation between differential stress and creep rate. Above a differential stress of
1,083 MPa (157,100 psi), primary and secondary and lastly tertiary creep were followed and
violent fractured.
Höwing and Kutter (1985) conducted a study of the effects of joint filler on creep
behavior. During the primary phase creep velocity follows a power law. Creep progressed from
the primary to the tertiary phase.
Bowden and Tabor (1964) defined the coefficient of friction as the ratio between shear
stress, σs , and normal stress, σn ,
In agree with Amonton’s definition. The Coulomb law in which C0is inherent joint
cohesion and µ is coefficient of friction is backed by Jaeger(1959) and by tests of Byerlee(1978).
Other well-known definitions of frictional strength were provided in Barton (1974) and Ladanyi
and Archambault. friction laws can be placed in one of three classes: displacement weakening,
velocity-dependent (velocity weakening), or normal-stress-dependent (normal stress weakening).
The class displacement weakening appends laws such as Patton’s (1966) bilinear model,
Jaeger’s (1959) variation of that model that appends a smooth transition between linear
segments, and Cundall and Hart’s (1984) continuously yielding joint model that was
explainedlater by Cundall and Lemos (1990). In the latter paper, bounding shear strength was
used. This bounding shear strength was incrementally lowered as shear displacement continued.
Many researchers have conjectured or used plasticity models with a non-associated flow rule to
make joint friction and implement a softening law (e.g., Michalowski and Mróz, 1978; Plesha
1987; Fakhimi, 1992; Lofti and Shing, 1994; Mróz and Jarz_bowski, 1994; Jarz_bowski and
Mróz, 1994; Mróz and Giambanco, 1996). Softening is usually dependent on the amount of
frictional work done.
Lippmann (1990) canvassed the act of friction between a coal seam and overlying and
underlying rock layers in the occurrence of translational coal bumps. Detonations, earthquakes,
or other seismic events may accomplish waves along interfaces and thus may transform static
friction to sliding friction.
Most of the researches in velocity-dependent friction laws are concerned with the study
of friction along faults. Dieterich’s direct-shear experiments on granodiorite (1979) demonstrated
that competing time, displacement, and velocity effects handle overall friction of a specimen, and
9
so he proposed a simple law. Others (Dieterich; Ruina; Rice; Rice and Ruin) have postulated
various state-variable friction laws. Generally, these laws describe a velocity-dependent friction
with transitions over time between friction levels.
Only limited studies and discussions about the effects of normal stress changes on
friction have been published. Results of some experiments do not show any effects of normal
stress history (Olsson, 1987; Lockner and Byerlee, 1986), while others do (Hobbs and Brady,
1985; Olsson, 1985, 1987, 1987, 1988; Linker and Dieterich, 1986).
Given the nature of mining problems, velocity and normal stress dependence are likely to
be second-order effects. Displacement dependence will likely be more significant. Many
research results demonstrated that salt rock exhibits pronounced time-dependent deformation or
creep under relatively low stress level and has very low permeability and porosity. Salt rock can
creep to a very large strain without fracturing and tends to be self-healing. In recent years salt
rock is considered as in ideal material for the storage of natural gas, petroleum and wastes,
especially nuclear wastes, e.g. Waste Isolation Pilot Plant of USA. It is very important to
investigate the time-dependent properties of salt rock in many engineering applications. For this
reason, many authors have investigated the time-dependent behavior using uniaxial and tri-axial
tests and Pacheco conducted detailed tri-axial creep tests using hollow cylindrical specimens.
Carter investigated the influence of temperature effects on creep behavior and found that the
time-dependent properties of salt are very strongly dependent on the temperature. Various so-
called `deformation mechanism maps' have been proposed in order to locate the domain in the
stress–temperature–strain rate space, where each of the different processes controls the inelastic
flow under steady-state conditions. A large number of uniaxial and tri-axial test results and
analyzed the confining pressure effects on the creep strain. This longstanding interest in salt rock
behavior has resulted in numerous studies, e.g. studies on relaxation and creep behavior under
cycle loading.
Lomenick and Bradshaw (1969) reported on an extensive testing program that included
the effects of load, temperature, temperature elevation after initial loading, shale partings, pillar
shapes, salt samples from different localities reproducibility of results,ultimatestrength ,
mechanisms of deformation, and long-term creep. That study resulted in the well known power-
law pillar creep formula:

10
where E is the pillar shortening of a model pillar initially 25 mm (1 in .) high, T is absolute
temperature ( K ) , σ is the initial average pillar stress ( psi ) (1 MPa = 145 psi ) , and t is time in
hours. Equation holds for cylindrical model pillars with a width-to-height ratio of 4 fabricated
from salt core from Lyons, Kansas Three types of tests are common in experimental studies of
the rheological behavior of rocks;
1. Creep tests, with a constant homogenous stress state
2. Constant strain rate tests which examine brittle rock behavior and long term strength
level
3. Relaxation tests or constant strain state tests, which are used to define the lower stress
limit that can produce creep deformation.
2.4 Properties of rock: Rock properties play major role in the behavior of the rocks as well as
excavation stability. Hence evaluations of those properties are important. Those are typically
physical and mechanical.
2.4.1 Physical properties:-
2.4.1.1. Hardness:-
Hardness is the characteristic of a solid material expressing its resistance to permanent
deformation. Hardness of a rock material depends on several factors, including mineral
composition and density. A typical measure is the Schmidt rebound hardness number.
2.4.1.2. Abrasivity:-
Abrasivity measures the abrasiveness of a rock materials against other materials, e.g., steel. It is
an important measure for estimate wear of rock drilling and boring equipment.

11
Abrasivity is highly influenced by the amount of quartz mineral in the rock material. The higher
quartz content gives higher abrasivity.
2.4.1.3. Permeability:-
Permeability is a measure of the ability of a material to transmit fluids. Most rocks, including
igneous, metamorphic and chemical sedimentary rocks, generally have very low permeability.
As discussed earlier, permeability of rock material is governed by porosity. Porous rocks such as
sandstones usually have high permeability while granites have low permeability. Permeability of
rock materials, except for those porous one, has limited interests as in the rock mass, flow is
concentrated in fractures in the rock mass.
2.4.1.4. Wave velocity:-
Measurements of wave are often done by using P wave and sometimes, S waves. P wave velocity
measures the travel speed of longitudinal (primary) wave in the material, while S-wave velocity
measures the travel speed of shear (secondary) wave in the material. The velocity measurements
provide correlation to physical properties in terms of compaction degree of the material. A well
compacted rock has generally high velocity as the grains are all in good contact and wave are
travelling through the solid. For a poorly compact rock material, the grains are not in good
contact, so the wave will partially travel through void (air or water) and the velocity will be
reduced (P-wave velocities in air and in water are 340 and 1500 m/s respectively and are much
lower than that in solid).
2.4.2. Mechanical properties of rock strength:-
2.4.2.1. Compressive strength:-
Compressive strength is the capacity of a material to withstand axially directed compressive
forces. The most common measure of compressive strength is the uniaxial compressive strength
or unconfined compressive strength. Usually compressive strength of rock is defined by the
ultimate stress. It is one of the most important mechanical properties of rock material, used in
design, analysis and modeling.

12
2.4.2.2. Young's Modulus and Poisson’s Ratio:-
Young's Modulus is modulus of elasticity measuring of the stiffness of a rock material. Itis
defined as the ratio, for small strains, of the rate of change of stress with strain. Thiscan be
experimentally determined from the slope of a stress-strain curve obtained during compressional
or tensile tests conducted on a rock sample.
Similar to strength, Young’s Modulus of rock materials varies widely with rock type. For
extremely hard and strong rocks, Young’s Modulus can be as high as 100 GPa. There is some
correlation between compressive strength and Young’s Modulus.
Poisson’s ratio measures the ratio of lateral strain to axial strain, at linearly-elastic region. For
most rocks, the Poisson’s ratio is between 0.15 and 0.4. As seen from early section, at later stage
of loading beyond linearly elastic region, lateral strain increase fast than the axial strain and
hence lead to a higher ratio.
2.4.2.3. Stress-Strain at and after Peak:-
Strain at failure is the strain measured at ultimate stress. Rocks generally fail at a small strain,
typically around 0.2 to 0.4% under uniaxial compression. Brittle rocks, typically crystalline
rocks, have low strain at failure, while soft rock, such as shale and mudstone, could have
relatively high strain at failure. Strain at failure sometimes is used as a measure of brittleness of
the rock. Strain at failure increases with increasing confining pressure under tri-axial
compression conditions.
Rocks can have brittle or ductile behavior after peak. Most rocks, including all crystalline
igneous, metamorphic and sedimentary rocks, behave brittle under uniaxial compression. A few
soft rocks, mainly of sedimentary origin, behave ductile.

13
2.4.2.4.Tensile Strength:-
Tensile strength of rock material is normally defined by the ultimate strength in tension, i.e.,
maximum tensile stress the rock material can withstand. Rock material generally has a low
tensile strength. The low tensile strength is due to the existence of micro-cracks in the rock. The
existence of micro-cracks may also be the cause of rock failing suddenly in tension with a small
strain.
Tensile strength of rock materials can be obtained from several types of tensile tests: direct
tensile test, Brazilian test and flexure test. Direct test is not commonly performed due to the
difficulty in sample preparation. The most common tensile strength determination is by the
Brazilian tests.
2.4.2.5.Shear Strength:-
Shear strength is used to describe the strength of rock materials, to resist deformation due to
shear stress. Rock resists shear stress by two internal mechanisms, cohesion and internal friction.
Cohesion is a measure of internal bonding of the rock material. Internal friction is caused by
contact between particles, and is defined by the internal friction angle,φ. Different rocks have
different cohesions and different friction angles.
Shear strength of rock material can be determined by direct shear test and by tri-axial
compression tests. In practice, the later methods is widely used and accepted.

14
CHAPTER 03
Experimentation
The goal of the investigation is to evaluate the creep behavior of the rock. A number of
experiments were carried out to achieve it as mentioned below.
3.1 Creep Test
3.1.1. Method for determining creep or stress relaxation behavior:-
To determine creep properties, material is subjected to prolonged constant tension or
compression loading at constant temperature. Deformation is recorded at specified time intervals
and a creep vs. time diagram is plotted. Slope of curve at any point is creep rate. If failure occurs,
it terminates test and time for rupture is recorded. If specimen does not fracture within test
period, creep recovery may be measured. To determine stress relaxation of material, specimen is
deformed a given amount and decrease in stress over prolonged period of exposure at constant
temperature is recorded. Standard creep testing procedures are detailed in ASTM E-139, ASTM
D-2990 and D-2991 (plastics) and ASTM D-2294 (adhesives).
3.1.2. Principle:-
A test piece of given dimension is heated under specified conditions to a given temperature and
at one of two specified stages in the test a constant compressive load is applied to it. The
deformation of the test piece at constant temperature is recorded and the percentage change is
evaluated as a function of time.

15
There are two forms of test one where the load is applied at room temperature and the other
where it is applied at the test temperature.
3.1.3. Apparatus:-
3.1.3.1. Loading device:-
The loading device is capable of applying a load centered on the common axis of the loading
columns, the test piece and the supporting column and directed vertically along this axis at all the
stages of the test. The loading device consists (Figure )of
Fixed column
Moving discs
Arrangement of two discs, two columns, two discs,
Furnace
Fig.3 The Load frame used to determine the creep behavior
3.1.3.1.1. Fixed column:-
The fixed column has a 45 mm in overall diameter with an axial bore.
3.1.3.1.2. Moving column:-
The moving column has diameter of 45 mm too that moves vertically.

16
3.1.3.1.3. Two discs:-
The loading discs are of 5mm to 10mmthick and 50mm in diameter of material compatible with
the material under test which are placed between the test piece and the fixed column and have a
central bore. The ends of the fixed and moving columns are plane and perpendicular to their
axes, the faces of each disc are plane and parallel.
The columns and disc is capable of withstanding the applied load up to the final test temperature
without significant deformation. There is no reaction between the discs and the loading system.
The figure no 2 Shows the loading device used.
Fig.4 loading apparatus of test
3.1.3.1.4. Furnace:-
The heating plates are capable of raising the temperature of the test piece to the final test
temperature at specified rate in an atmosphere of air. The temperature controller is attached to
the sides of the loading frame and has a relay controller (Figure 3).

17
Fig.3 furnace of the test
3.1.3.1.5. Measuring device:-
The distance between the loading platens is measuring by a vernier caliper with least count 0.01
mm.
3.1.4. Procedure:- The procedure of tests are described below.
1. The height of the test piece was measured and the diameter as well.
2. A constant compressive load was applied.
3. Desired temperature was applied on the specimen.
4. The changes in strain of the specimen was measured at regular interval.
5. Strain was noted.
6. Temperature and stress was raised until the fracture of the specimen.

18
CHAPTER 04
Results and discussion
The investigation aimed at evaluating the creep behavior of the rocks at varying temperature and
pressure. The tests carried out to do those are reported below. About 3 to 4 samples were tested
for each parameter and their average are reported here.
4.1.Observation:
4.1.1. UCS observation;
L/D=4.752/4.752=1
Load in KN Axial deformation
In mm
Lateral deformation in mm
10 0.00 0.01
20 0.01 0.34
30 0.10 0.35
40 0.21 0.35
50 0.55 0.35
55 1.02 0.81
Table 1
19
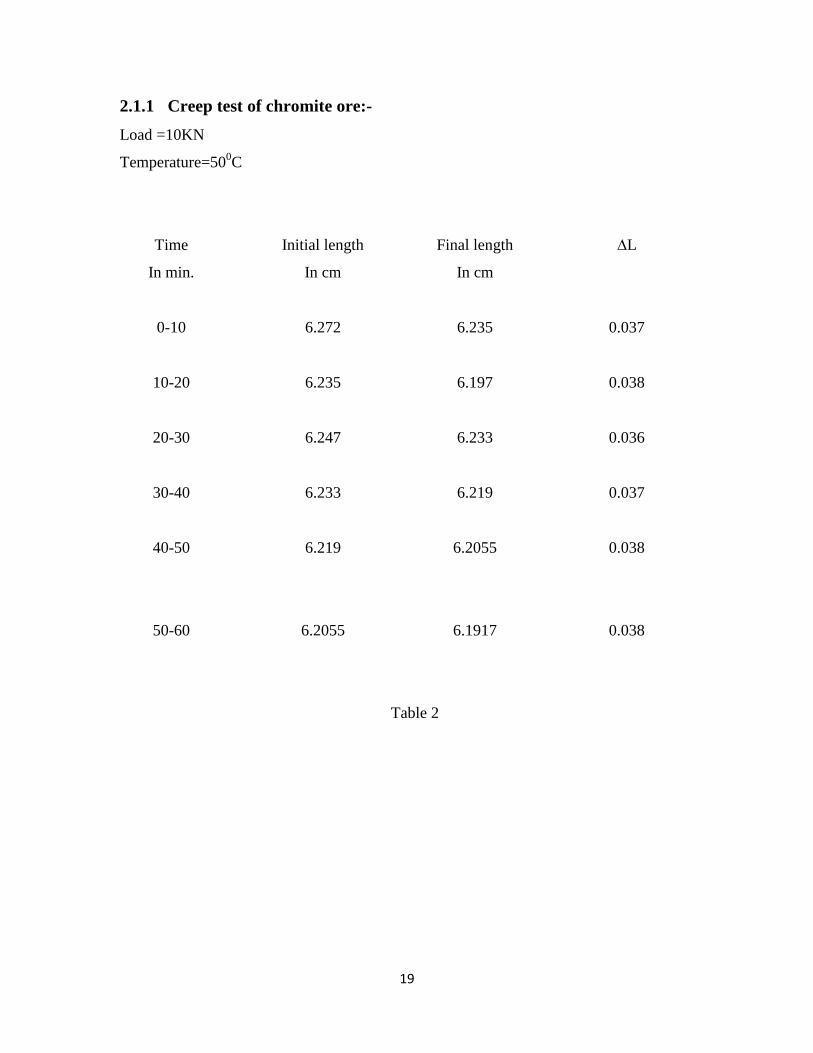
2.1.1 Creep test of chromite ore:-
Load =10KN
Temperature=500C
Time
In min.
Initial length
In cm
Final length
In cm
∆L
0-10
6.272
6.235
0.037
10-20
6.235
6.197
0.038
20-30
6.247
6.233
0.036
30-40
6.233
6.219
0.037
40-50
6.219
6.2055
0.038
50-60
6.2055
6.1917
0.038
Table 2

20
Load= 20KN
Temperature=600C
Time in min. Initial length in
cm
Final length in
cm
∆L in cm
0-10 6.258 6.255 0.003
10-20 6.255 6.249 0.006
20-30 6.249 6.2425 0.0065
30-40 6.2425 6.2345 0.008
40-50 6.2345 6.227 0.0075
50-60 6.227 6.2188 0.0082
Load= 20KN
Temperature=700C
Time in min. Initial length in
cm
Final length in
cm
∆L in cm
0-10
6.272
6.260
0.012
10-20 6.260 6.247 0.013
20-30 6.247 6.233 0.014
30-40 6.233 6.219 0.014
40-50 6.219 6.2055 0.0135
50-60 6.2055 6.1917 0.0138
Table 4

21
Load=30KN
Temperature=800C
Time in min. Initial length in
cm
Final length in
cm
∆L in cm
0-10 6.200 6.191 0.009
10-20 6.191 6.179 0.012
20-30 6.179 6.1664 0.0126
30-40 6.1664 6.1534 0.013
40-50 6.1534 6.1406 0.0128
50-60 6.1406 6.1274 0.0132
Table 5
Load=40KN
Temperature=900C
Time in min. Initial length in
cm
Final length in
cm
∆L in cm
0-10 6.126 6.121 0.005
10-20 6.121 6.114 0.007
20-30 6.114 6.1065 0.0075
30-40 6.1065 6.0989 0.0076
40-50 6.0989 6.0913 0.0076
50-60 6.0913 6.0833 0.008
Table 6

22
Load=50KN
Temperature=1000C
Time in min. Initial length in
cm
Final length in
cm
∆L in cm
0-10 5.994 5.992 0.002
10-20 5.992 5.990 0.002
20-30 5.990 5.989 0.0018
30-40 5.989 5.987 0.002
40-50 5.987 fractured
Table 7
Fig. 6 A typical photo of a fractured sample

23
Comparison of strain at 60⁰C and at 70⁰C at same load (20 KN)
Time Strain at 60⁰C Strain at 70⁰C %diff.
at
60⁰C
%diff. at 70⁰C
0-10 6.258 6.255 6.272 6.260 0.048 0.191
10-20 6.258 6.248 6.272 6.254 0.159 0.286
20-30 6.258 6.248 6.272 6.240 0.159 0.510
30-40 6.258 6.240 6.272 6.226 0.287 0.733
40-50 6.258 6.237 6.272 6.220 0.335 0.829
50-60 6.258 6.232 6.272 6.212 0.415 0.956

24
Graphs of creep test of chromite ore: The results of the creep testing were
plotted for analysis. Grpahs were drawn in Microsoft Excel (2007) program.
Graph 1
Rock sample were tested for compressive loading. Axial strain were measured up to failure. It is
observed that at 10KN load and 500C, the rate of deformation is very sharp during first 10min of
testing. Then the rate gain in strain is more or less stable. The strain could not be recovered
beyond 60 minutes or sample crushed under loading.
Graph 2
Rock sample were tested for compressive strength. It is observed that at load 20KN and
temperature 600C the strain rises in a straight line upto 20mins then it decreases slightly and
0
0.01
0.02
0.03
0.04
0.05
0 10 20 30 40 50 60 70
stra
in
time in mins
time vs strain at constant load and temperature
Load=10KN temperature=500C
0
0.005
0.01
0 10 20 30 40 50 60 70
stra
in
time in mins
time vs strain at constant load and temperature
Load=20KN

25
increases slightly and this phase is known as secondary creep stage and this phase is followed
by tertiary creep phase.
Graph 3
After testing the sample at Load 20KN and temperature 700C it was observed that the graph is
linear upto 10mins and then remains constant indicating the primary and secondary creep phases.
Graph 4
0
0.002
0.004
0.006
0.008
0.01
0.012
0.014
0.016
0 10 20 30 40 50 60 70
stra
in
time in mins
time vs strain at constant load and temperature
Load=20KN temperature=700C
0
0.002
0.004
0.006
0.008
0.01
0.012
0.014
0 10 20 30 40 50 60 70
stra
in
time in mins
time vs strain at constant load and temperature
Load=30KN temperature= 800C

26
After testing at load=30KN and temperature 800C, it was observed that the curve is just like the
logarithmic curve where the curve is linear upto 10mins and the it follows a curve path followed
by constant path. Here also primary and secondary phase is seen.
Graph 5
Load at 40KN and temperature at 900C is similar to the previous one where the curve is
linear to first 10 mins and then follows a curve path. Here also primary and secondary creep
is observed with a slight tertiary creep phase.
Graph 6
0
0.001
0.002
0.003
0.004
0.005
0.006
0.007
0.008
0.009
0 10 20 30 40 50 60 70
stra
in
time in mins
time vs strain at constant load and temperature
Load=40KN temperature=900C
0
0.0005
0.001
0.0015
0.002
0.0025
0 5 10 15 20 25 30 35 40 45
stra
in
time in mins
time vs strain at constant load and temperature
Load=50KN Temperature=1000C

27
When the test specimen was applied a load 50KN and temperature 1000C the primary creep
is seen up to 10mins where the curve is linear and then it decreases to 30 mins followed by a
increase up to 40 mins showing secondary and tertiary creep phase respectively.
5. Results:-
The failure load of the sample is decreased as temperature increased. The failure load at room
temperature found to be 55KN but when the temperature increased to 100⁰C the failure load
is decreased and found to be 50 KN.
6. Conclusion:-
1. All the three stages of an idealized creep curve were observed in the Sicilian marble
specimens. The steady state creep rate was found to increase with the increased stress.
2. The mode of fracture of specimen in the creep rig was similar to the mode observed
during the uniaxial compression tests.
3. Strain rate is steep for initial 20mins then the rate of strain becomes very moderate
4. Strain between 20-40mins is more or less constant confirming to secondary creep
behavior at 30KN and 800C
5. Maximum strain is found at 10 KN and 500C in the time 40-60 mins. The maximum
strain is found to be 0.038.
Recommendation:-
This investigation was undertaken as a part of final year project with a fixed time limit. Hence
many aspects of creep behavior could not be investigated. In future research may be carried out
by considering more rock samples from different site for better understanding of the subject in
detail.

28
Reference
1. http://en.wikipedia.org/wiki/Rock_%28geology%29
2. http://en.wikipedia.org/wiki/Mining
3. www.cdc.gov/niosh/mining/pubs/pdfs/utplt.pdf
4. http://www.instron.us/wa/glossary/Creep-Test.aspx?ref=http://www.google.co.in/url
5. Hofer, K.H., The principle of creep in rock salts and their general significance to
mining engineering, 2dn Int. conf. strata control, Leipzig
6. Reynolds, T.D. and Gloyna E.F., Creep measurements in salt mines. Proc. 4th
symp,
rock mechanics, H.L. Hartman Ed., pp.-11-17
7. Barron K. and Toews N.A.< Deformation around a mine shaft in salt, proc. Rock
mechsymp., wueen’s university, Kingston,pp-115-136 dept. mines tech. surveys,
ottwa (1963)
8. Bradshaw R.L., Boegly W.J. and Empson F.M. correlation of convergence
measurements in salt mines with laboratory creep test data, proc. 6th
symp. Rock
mech. ,pp.- 501-514
9. Pomeroy C.D., creep in coal at room temperature nature land, pp-178, 279-280
10. Cristescu N.D., Hunshe U., time effect in rock mechanics, John wiley and sons
publication, pp-1-76.

29
11. Zhao B, Liu D, Dong Q, journal of rock mechanics and geotechnical engineering.