Crediting Low-Traffic Developments, Nelson/Nygaard Consulting Assoc., August 2005
19
Credit ing Low - Traf fic Developm ents Adjust ing Sit e- Level V ehic le Trip Gener at ion Using URBE MIS Nelson\Nygaard Consulting Associates 785 Market Street, Suite 1300 San Francisco, CA 94103 August 200 5
-
Upload
terrymaynard -
Category
Documents
-
view
220 -
download
0
Transcript of Crediting Low-Traffic Developments, Nelson/Nygaard Consulting Assoc., August 2005

8/4/2019 Crediting Low-Traffic Developments, Nelson/Nygaard Consulting Assoc., August 2005
http://slidepdf.com/reader/full/crediting-low-traffic-developments-nelsonnygaard-consulting-assoc-august 1/19
Credit ing Low-Traffic Developments
Adjust ing Site-Level Vehicle Trip
Generation Using URBEMIS
Nelson\Nygaard Consulting Associates785 Market Street, Suite 1300
San Francisco, CA 94103
August 2005

8/4/2019 Crediting Low-Traffic Developments, Nelson/Nygaard Consulting Assoc., August 2005
http://slidepdf.com/reader/full/crediting-low-traffic-developments-nelsonnygaard-consulting-assoc-august 2/19
A d j u s t i n g S i t e - L e v e l V e h i c l e T r i p G e n e r a t i o n U s i n g U R B E M I S
I n t r o d u c t i o n
Traffic studies are at the heart of many fundamental decisions on land use, streetdesign and urban form. By analyzing the number of trips expected from a newdevelopment, and the consequent impact on traffic congestion at neighboring
intersections, the traffic study is a driving force behind roadway widths, street andintersection design, and the level of fees that a developer must pay to upgrade thetransportation infrastructure. In many cases, the traffic study determines the intensityof development and the type of uses that are possible on a given site, throughestablishing the constraints of the roadway network to move more vehicles.
The Institute for Traffic Engineers’ (ITE’s) Trip Generation report and the companionTrip Generation Handbook are the most definitive available sources for estimatingthe automobile traffic that different land uses will generate. Now in its seventhedition, Trip Generation provides a wealth of data on the average number of vehicle trips generated at different times of day by hundreds of land uses, from
office buildings to funeral parlors.
Trip Generation is an invaluable reference for traffic studies and environmentalassessments, as it is by far the most comprehensive source of empirical data on thetraffic impacts of different land uses. However, the information is most useful forauto-oriented, stand-alone suburban sites, from where the vast majority of data werecollected. For downtowns or areas with good public transportation, ITE advises thattraffic engineers should collect local data, or adjust the ITE average trip generationrate to account for reduced auto use.
All too often, however, ITE’s warnings are ignored and standard trip generation
rates are applied in inappropriate locations – with serious impacts on the characterand financial feasibility of urban development. Part of the reason is that, until now,there has been no standardized tool to allow these adjustments to trip generationrates to be made. In order to address this problem, the air quality managementdistricts of California, along with the California State Department of Transportation,worked together in 2004 to examine all of the key variables that influenceautomobile trip generation. They were able to quantify the trip generation impactof key locational and programmatic factors, and inserted these formulas intoURBEMIS, a national model for calculating air quality impacts of projects.
The URBEMIS mitigation component is a simple yet powerful tool; it employs
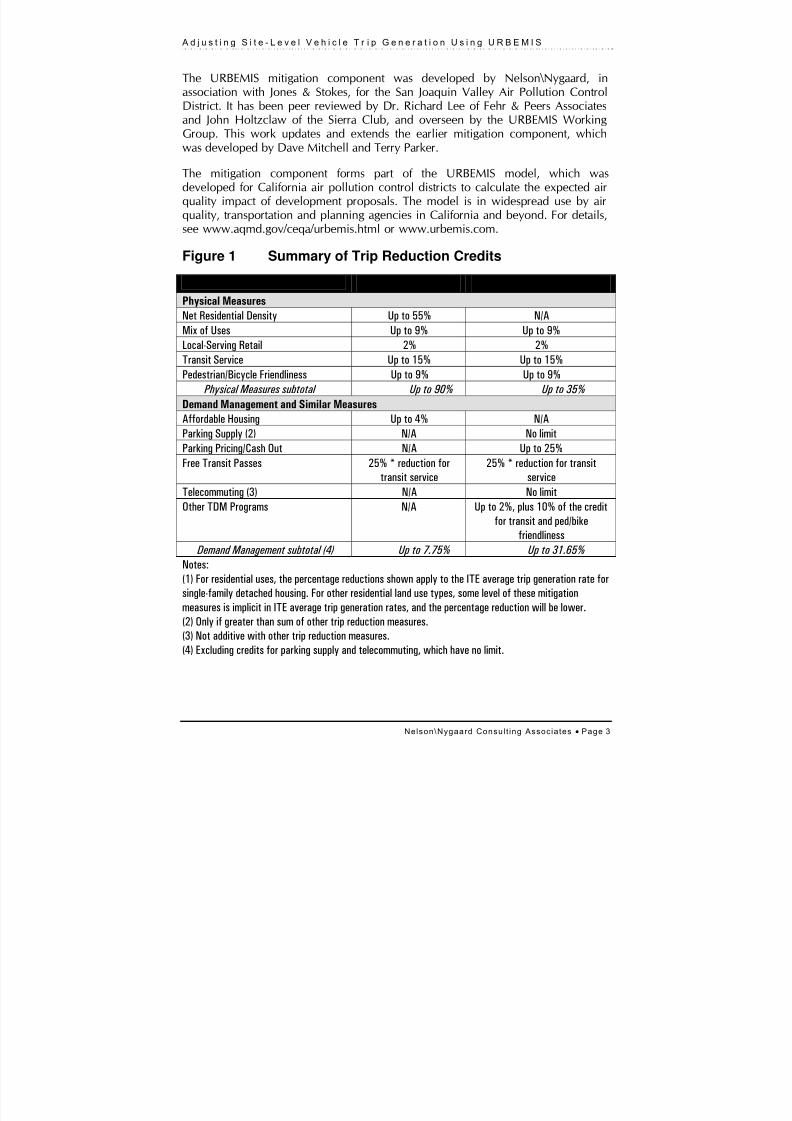
standard traffic engineering methodologies, but provides the opportunity to adjustITE average rates to quantify the impact of a development’s location, physicalcharacteristics and any demand management programs. In this way, it provides anopportunity to fairly evaluate developments that minimize their transportationimpact, for example, through locating close to transit or providing high densitiesand a mix of uses. Figure 1 provides a summary of the specific trip reductioncredits that are granted by URBEMIS.
Nelson\Nygaard Consult ing Associates • Page 2
8/4/2019 Crediting Low-Traffic Developments, Nelson/Nygaard Consulting Assoc., August 2005
http://slidepdf.com/reader/full/crediting-low-traffic-developments-nelsonnygaard-consulting-assoc-august 3/19
A d j u s t i n g S i t e - L e v e l V e h i c l e T r i p G e n e r a t i o n U s i n g U R B E M I S
The URBEMIS mitigation component was developed by Nelson\Nygaard, inassociation with Jones & Stokes, for the San Joaquin Valley Air Pollution ControlDistrict. It has been peer reviewed by Dr. Richard Lee of Fehr & Peers Associatesand John Holtzclaw of the Sierra Club, and overseen by the URBEMIS WorkingGroup. This work updates and extends the earlier mitigation component, which
was developed by Dave Mitchell and Terry Parker.
The mitigation component forms part of the URBEMIS model, which wasdeveloped for California air pollution control districts to calculate the expected airquality impact of development proposals. The model is in widespread use by airquality, transportation and planning agencies in California and beyond. For details,see www.aqmd.gov/ceqa/urbemis.html or www.urbemis.com.
Figure 1 Summary of Trip Reduction Credits
Residential (1) Non-Residential
Physical Measures Net Residential Density Up to 55% N/A
Mix of Uses Up to 9% Up to 9%
Local-Serving Retail 2% 2%
Transit Service Up to 15% Up to 15%
Pedestrian/Bicycle Friendliness Up to 9% Up to 9%
Physical Measures subtotal Up to 90% Up to 35%
Demand Management and Similar Measures
Affordable Housing Up to 4% N/A
Parking Supply (2) N/A No limit
Parking Pricing/Cash Out N/A Up to 25%
Free Transit Passes 25% * reduction for
transit service
25% * reduction for transit
service
Telecommuting (3) N/A No limit
Other TDM Programs N/A Up to 2%, plus 10% of the credit
for transit and ped/bike
friendliness
Demand Management subtotal (4) Up to 7.75% Up to 31.65%
Notes:
(1) For residential uses, the percentage reductions shown apply to the ITE average trip generation rate for
single-family detached housing. For other residential land use types, some level of these mitigation
measures is implicit in ITE average trip generation rates, and the percentage reduction will be lower.(2) Only if greater than sum of other trip reduction measures.
(3) Not additive with other trip reduction measures.
(4) Excluding credits for parking supply and telecommuting, which have no limit.
Nelson\Nygaard Consult ing Associates • Page 3
8/4/2019 Crediting Low-Traffic Developments, Nelson/Nygaard Consulting Assoc., August 2005
http://slidepdf.com/reader/full/crediting-low-traffic-developments-nelsonnygaard-consulting-assoc-august 4/19
A d j u s t i n g S i t e - L e v e l V e h i c l e T r i p G e n e r a t i o n U s i n g U R B E M I S
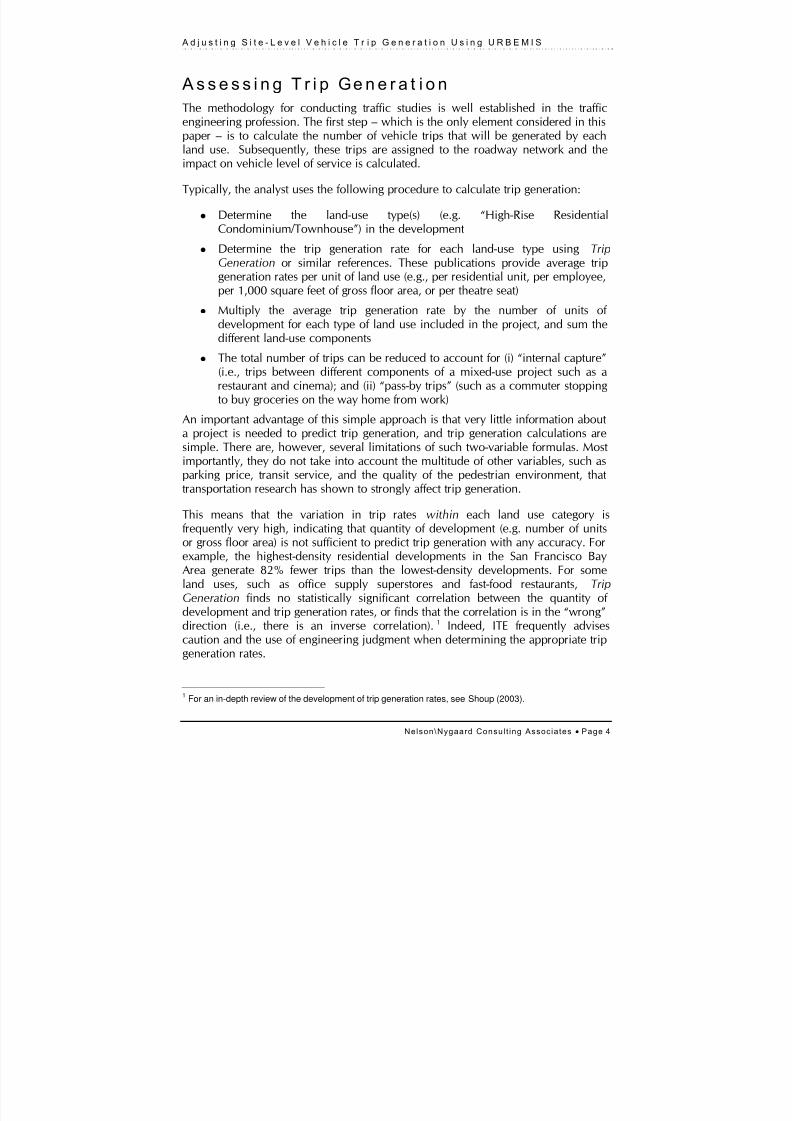
A s s e s s i n g T r i p Ge n e r a t i o n The methodology for conducting traffic studies is well established in the trafficengineering profession. The first step – which is the only element considered in thispaper – is to calculate the number of vehicle trips that will be generated by each
land use. Subsequently, these trips are assigned to the roadway network and theimpact on vehicle level of service is calculated.
Typically, the analyst uses the following procedure to calculate trip generation:
Determine the land-use type(s) (e.g. “High-Rise ResidentialCondominium/Townhouse”) in the development
Determine the trip generation rate for each land-use type using TripGeneration or similar references. These publications provide average tripgeneration rates per unit of land use (e.g., per residential unit, per employee,per 1,000 square feet of gross floor area, or per theatre seat)
Multiply the average trip generation rate by the number of units of development for each type of land use included in the project, and sum thedifferent land-use components
The total number of trips can be reduced to account for (i) “internal capture”(i.e., trips between different components of a mixed-use project such as arestaurant and cinema); and (ii) “pass-by trips” (such as a commuter stoppingto buy groceries on the way home from work)
An important advantage of this simple approach is that very little information abouta project is needed to predict trip generation, and trip generation calculations aresimple. There are, however, several limitations of such two-variable formulas. Mostimportantly, they do not take into account the multitude of other variables, such asparking price, transit service, and the quality of the pedestrian environment, thattransportation research has shown to strongly affect trip generation.
This means that the variation in trip rates within each land use category isfrequently very high, indicating that quantity of development (e.g. number of unitsor gross floor area) is not sufficient to predict trip generation with any accuracy. Forexample, the highest-density residential developments in the San Francisco BayArea generate 82% fewer trips than the lowest-density developments. For someland uses, such as office supply superstores and fast-food restaurants, TripGeneration finds no statistically significant correlation between the quantity of development and trip generation rates, or finds that the correlation is in the “wrong”direction (i.e., there is an inverse correlation).1 Indeed, ITE frequently advisescaution and the use of engineering judgment when determining the appropriate tripgeneration rates.
1For an in-depth review of the development of trip generation rates, see Shoup (2003).
Nelson\Nygaard Consult ing Associates • Page 4

8/4/2019 Crediting Low-Traffic Developments, Nelson/Nygaard Consulting Assoc., August 2005
http://slidepdf.com/reader/full/crediting-low-traffic-developments-nelsonnygaard-consulting-assoc-august 5/19
A d j u s t i n g S i t e - L e v e l V e h i c l e T r i p G e n e r a t i o n U s i n g U R B E M I S
Even where there is a strong correlation between the amount of development andtrip generation rates, there is still considerable variation in the rates observed indifferent surveys. For the land use type “Single Family Detached Housing”, forexample, ITE reported rates ranged from a low of 4.31 daily trips per dwelling unit,to a high of 21.85 daily trips. The Trip Generation manual reports that, “This land
use included data from a wide variety of units with different sizes, price ranges,locations and ages. Consequently, there was a wide variation in trips generatedwithin this category.”
Recognizing these points, the Trip Generation Handbook includes a detailedappendix on the effects of TDM and transit. Trip Generation advises the reader:
The average trip generation rates in this report represent weighted averages fromstudies conducted throughout the United States and Canada since the 1960s. Datawere primarily collected at suburban locations having little or no transit service,nearby pedestrian amenities, or travel demand management (TDM) programs. Atspecific sites, the user may wish to modify trip generation rates presented in this
document to reflect the presence of public transportation service, ridesharing orother TDM measures, enhanced pedestrian and bicycle trip-making opportunities,or other special characteristics of the site or surrounding area.
Modifying the trip generation rates in this way is essential for transit-oriented,mixed-use and other projects that can expect lower rates of auto use. Otherwise,they will be disadvantaged by the traffic study, which in effect assumes a “worstcase scenario” in terms of car use. The development may be asked to pay higherfees or fund infrastructure widenings that may not be necessary – measures whichoften damage the quality of the pedestrian environment, not to mention affectingdevelopment feasibility.
These limitations have been well documented by ITE and other analysts. What hasbeen missing until now, however, is an alternative, established tool to modify theaverage trip generation rates. This is the purpose of the URBEMIS mitigationcomponent described in this paper. At its heart, therefore, the URBEMISmitigation component is a tool for adjusting the average trip generation ratesreported in the Institute for Transportation Engineers’ Trip Generation manual tomore fairly reflect the particular characteristics of a proposed development. It canbe seen as a “plug in” to the standard traffic study methodology.
It should be noted that many agencies do provide credits for individual
developments that implement trip reduction measures, for example when assessingimpact fees or conducting traffic studies. Some California examples include C/CAGin San Mateo County and VTA in Santa Clara County. In general, however, thesecredit programs are only loosely based on the latest travel research, and it could beargued that they function more at a policy level, in providing incentives fordevelopers to locate on transit corridors and implement demand managementprograms.
Nelson\Nygaard Consult ing Associates • Page 5

8/4/2019 Crediting Low-Traffic Developments, Nelson/Nygaard Consulting Assoc., August 2005
http://slidepdf.com/reader/full/crediting-low-traffic-developments-nelsonnygaard-consulting-assoc-august 6/19
A d j u s t i n g S i t e - L e v e l V e h i c l e T r i p G e n e r a t i o n U s i n g U R B E M I S
T h e U R B EM I S A p p r o a c h
The URBEMIS mitigation component (referred to simply as “URBEMIS” in theremainder of this paper) provides a simple method of estimating the percentagereduction in vehicle trips generated by a proposed development, compared to the
baseline that would be obtained through the use of ITE average trip generationrates. It quantifies the trip reduction “credits” that can be gained throughimplementation of a range of mitigation measures.
In some cases, credits are obtained through simply locating a development in theright place – for example, close to transit, or in a place where it will optimize the
jobs-housing balance. In some cases, the credits are assessed based on the physicalcharacteristics of the development, such as density and provision of sidewalks.Other credits are granted based on commitments from the developer to implementdemand management programs such as parking pricing, or provide deed-restrictedaffordable housing. Figure 1 summarizes the specific credits that are granted by
URBEMIS. The sections below discuss each credit in turn and the rationale for thelevel of trip reduction.
It must be stressed that the trip reductions recommended here are subject toconsiderable uncertainty. They should be interpreted as the mid-point of a range,rather than as a single, precise value. Travel behavior is complex and difficult topredict, and the approach described here will need to be refined in future years, asmore data become available.
However, although the methodological dangers are obvious, there is generally noquestion about the direction of the relationship between trip generation and a given
mitigation measure, only the size of the relationship and the appropriate variable touse as a model input. Some adjustment is better than none at all – which is whatmost conventional trip generation methodologies provide (Ewing & Cervero, 2001).In addition, existing project-level trip generation methodologies, even though well-accepted within the transportation planning and engineering profession, arethemselves subject to considerable uncertainty, and results are reported withunwarranted precision (Shoup, 2003).
Data Requirements
Figure 2 shows the inputs that are required to complete the URBEMIS mitigationcomponent in full, along with suggested data sources. Note, however, that the
mitigation component can still be run, even if some of these inputs are missing.While no reduction would be granted for the particular mitigation measure forwhich the input was required, credits are still granted for other trip reductionmeasures.
The number of trips generated by a development depends not only on thecharacteristics of the project itself, but also on the surrounding area. High-density
Nelson\Nygaard Consult ing Associates • Page 6
8/4/2019 Crediting Low-Traffic Developments, Nelson/Nygaard Consulting Assoc., August 2005
http://slidepdf.com/reader/full/crediting-low-traffic-developments-nelsonnygaard-consulting-assoc-august 7/19
A d j u s t i n g S i t e - L e v e l V e h i c l e T r i p G e n e r a t i o n U s i n g U R B E M I S
housing in an urban area, for example, will generate fewer trips than the samehousing located close to a freeway interchange and surrounded by low-densitysubdivisions. For this reason, URBEMIS requires data for the area withinapproximately a half-mile radius from the center of the project, or for the entireproject area, whichever is larger. In effect, the smaller the development, the more
important the development’s context.
Even though URBEMIS is designed to use inputs that are readily available, smallprojects may still face a disproportionate burden in gathering the data to documenttheir likely trip reduction. For this reason, URBEMIS allows small developments(generating 50 or fewer daily vehicle trips before mitigations) in an establishedurban area to adjust their trip generation rates based on the average mode share inthat census tract. The analyst needs to certify that the project is similar in characterto the existing development in the neighborhood.
Nelson\Nygaard Consult ing Associates • Page 7

8/4/2019 Crediting Low-Traffic Developments, Nelson/Nygaard Consulting Assoc., August 2005
http://slidepdf.com/reader/full/crediting-low-traffic-developments-nelsonnygaard-consulting-assoc-august 8/19
A d j u s t i n g S i t e - L e v e l V e h i c l e T r i p G e n e r a t i o n U s i n g U R B E M I S
Figure 2 Data Requirements and Suggested Sources
Suggested Source
Required Input Project Surrounding Development
Net residential density (1) Project plans Block-level census data
Number of housing units Project plans Block-level census dataNumber of jobs Project plans (2) Census Transportation Planning
Package. Local jurisdiction may
provide more current or fine-grained
data
Local serving retail Project plans Site observations
Below-market-rate units Project plans N/A
Parking supply Project plans N/A
Transit service Transit agency maps/schedules
Intersection density (3) Project plans Street plans
Sidewalk completeness (3) Project plans Site observationsBike lane completeness (3) Project plans Site observations
Parking pricing Development agreement or
similar
Site observations (if applicable)
Free transit pass provision Development agreement or
similar
N/A
Telecommuting/flexible work
schedules
Development agreement or
similar
N/A
Other TDM programs Development agreement or
similar
N/A
Notes:
(1) Net residential data excludes land not devoted to residential uses, prorating mixed-use sites by the
percentage square footage of each use.
(2) US Department of Energy figures can be used to calculate the number of employees when only
development square footage is known. See, for example,
http://www.eia.doe.gov/emeu/consumptionbriefs/cbecs/pbawebsite/summarytable.htm.
(3) These inputs can be calculated manually, or automatically if the plans and data are available in a GIS
system
Nelson\Nygaard Consult ing Associates • Page 8

8/4/2019 Crediting Low-Traffic Developments, Nelson/Nygaard Consulting Assoc., August 2005
http://slidepdf.com/reader/full/crediting-low-traffic-developments-nelsonnygaard-consulting-assoc-august 9/19
A d j u s t i n g S i t e - L e v e l V e h i c l e T r i p G e n e r a t i o n U s i n g U R B E M I S
Relationship to ITE Residential Trip Generation Rates
It should be noted that, to some extent, ITE average trip generation rates forresidential uses implicitly account for the level of transit service, density and otherfactors that influence trip generation. This is because ITE publishes average trip
generation rates for several types of residential development, which varyconsiderably. A single-family detached house generates more than twice as manytrips as a high-rise apartment unit, according to Trip Generation. Rather than beinga function of the inherent characteristics of the different types of housing, this islargely due to the different types of environments in which the housing types arefound; high-rise apartments, for example, are often located in dense neighborhoodswith good transit.2
In order to avoid double counting, URBEMIS therefore assumes various defaultvalues for mitigation measures such as residential density, mix of uses and transitservice. These defaults are set so that results from URBEMIS are consistent with ITE
average trip generation rates.3
In other words, the same trip generation result will begenerated by URBEMIS regardless of the type of residential use selected (such aslow- or high-rise apartment buildings), assuming that the mitigation measures arethe same. The type of residential use does affect the default values for mitigationmeasures such as transit service, but these can be modified by the user.
For single-family detached housing, for example, the default values include aresidential density of three units per residential acre, a transit service index score of 0 (representing no transit service within one-quarter mile of the site), and anintersection density of 250 intersections per square mile (typical of post-war cul-de-sac residential subdivisions). Figure 3 shows the default values for each land use
type. Full details of each mitigation measure are provided in the following sections.
2ITE’s Trip Generation manual states that data are collected primarily from suburban locations having little
or no transit service, nearby pedestrian amenities, or travel demand management (TDM) programs. Whilelittle information is available about the precise characteristics of individual study sites, it appears from thesources referenced that this is not the case for some land uses, particularly higher density residential landuses. For the “High-Rise Residential Condominium/Townhouse”, for example, the manual’s text shows thatsites were surveyed in such cities as Vancouver, Canada: a city where it is difficult to find high-density
condominiums that lack sidewalks, transit service, and a mix of uses nearby.
3These default values were estimated using two methods. First, Nelson\Nygaard reviewed the literature and
held discussions with professionals in the fields of architecture and town planning, to ascertain typicalranges for density and other characteristics of each land use type (for useful summaries, see Calthorpe,1993, and Local Government Commission, 2002). Second, these ranges of values were plugged into theformulas for the mitigation measures, and adjusted until the baseline values for each characteristic equaledthe average ITE trip generation rates for each land use.
Nelson\Nygaard Consult ing Associates • Page 9

8/4/2019 Crediting Low-Traffic Developments, Nelson/Nygaard Consulting Assoc., August 2005
http://slidepdf.com/reader/full/crediting-low-traffic-developments-nelsonnygaard-consulting-assoc-august 10/19
A d j u s t i n g S i t e -L e v e l V e h i c l e T r i p G e n e r a t i o n U s i n g U R B EM I S
Figure 3 Default Mitigation Values for Residential Uses
Default Mitigation Value (1)
Land
Use
Code Land Use Type R e s i d e n t i a l
D e n s i t y
H o u s i n g U n i t s
E m p l o y e e s
R e t a i l ?
T r a n s i t
S e r v i c e
I n t e r s e c t i o n
D e n s i t y
S i d e w a l k s
B i k e L a n e s
210 Single-Family Detached Housing 3 100 17 no 0.00 250 0 0
221 Low-Rise Apartment 16 100 26 no 0.06 250 0.5 0
230 Residential Condominium/Townhouse 16 100 60 yes 0.10 400 1 0
223 Mid-Rise Apartment (2) 38 100 60 yes 0.14 400 1 0
222 High-Rise Apartment 62 100 60 yes 0.14 400 1 0
232 High-Rise Residential Condo./Townhouse 64 100 60 yes 0.14 400 1 0
Notes:
(1) See text for description of units for each mitigation value.
(2) Since the Trip Generation manual provides no daily trip generation rate for the “Mid-Rise Apartment” land use, we estim
the daily trip rate for the “High-Rise Apartment” land use type. The PM peak hour trip rate of 0.39 trips per unit for mid-rise
the PM peak hour rate for high-rise apartments (0.35 trips/unit). Therefore, the daily trip rate for the “Mid-Rise Apartment” trips per unit, or 11.4% higher than the daily trip for high-rise apartments (4.2 trips/unit).
Nelson\Nygaard
8/4/2019 Crediting Low-Traffic Developments, Nelson/Nygaard Consulting Assoc., August 2005
http://slidepdf.com/reader/full/crediting-low-traffic-developments-nelsonnygaard-consulting-assoc-august 11/19
A d j u s t i n g S i t e - L e v e l V e h i c l e T r i p G e n e r a t i o n U s i n g U R B E M I S
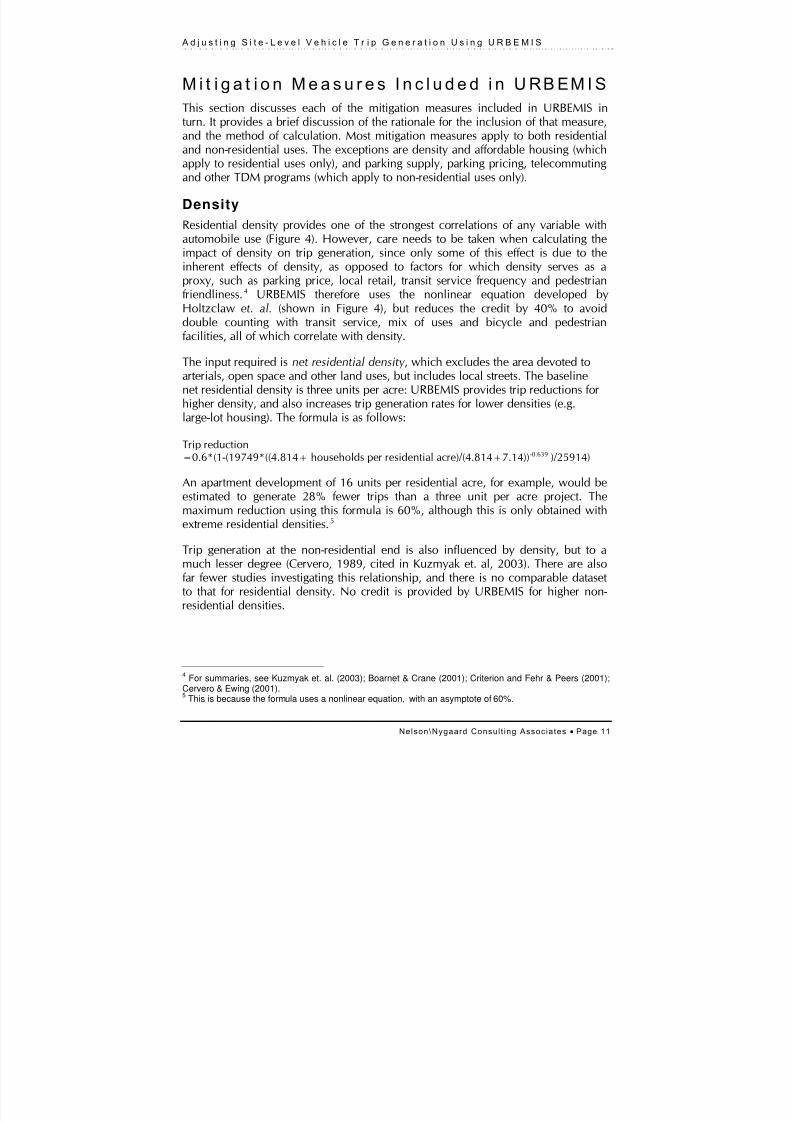
M i t i g a t i o n M e a s u r e s I n c l u d e d i n U RB EM I S
This section discusses each of the mitigation measures included in URBEMIS inturn. It provides a brief discussion of the rationale for the inclusion of that measure,and the method of calculation. Most mitigation measures apply to both residential
and non-residential uses. The exceptions are density and affordable housing (whichapply to residential uses only), and parking supply, parking pricing, telecommutingand other TDM programs (which apply to non-residential uses only).
Density
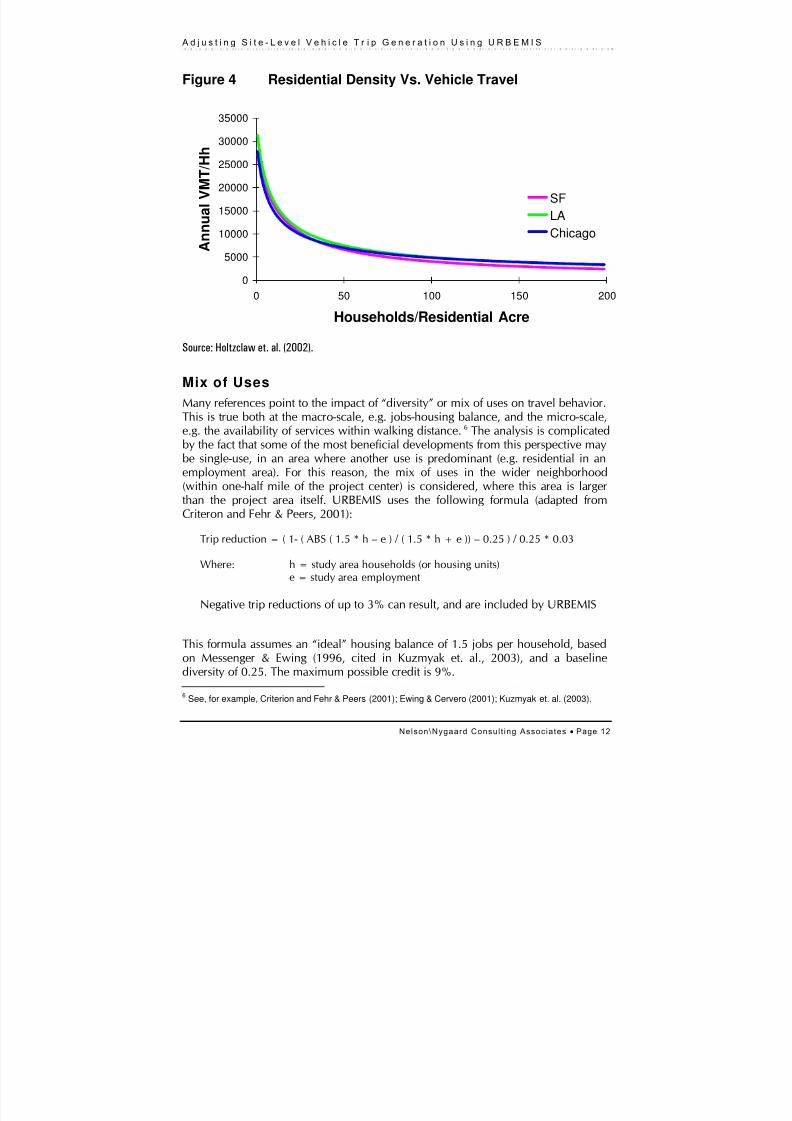
Residential density provides one of the strongest correlations of any variable withautomobile use (Figure 4). However, care needs to be taken when calculating theimpact of density on trip generation, since only some of this effect is due to theinherent effects of density, as opposed to factors for which density serves as aproxy, such as parking price, local retail, transit service frequency and pedestrianfriendliness.4 URBEMIS therefore uses the nonlinear equation developed byHoltzclaw et. al. (shown in Figure 4), but reduces the credit by 40% to avoiddouble counting with transit service, mix of uses and bicycle and pedestrianfacilities, all of which correlate with density.
The input required is net residential density , which excludes the area devoted toarterials, open space and other land uses, but includes local streets. The baselinenet residential density is three units per acre: URBEMIS provides trip reductions forhigher density, and also increases trip generation rates for lower densities (e.g.large-lot housing). The formula is as follows:
Trip reduction
=0.6*(1-(19749*((4.814+ households per residential acre)/(4.814+7.14))-0.639 )/25914)
An apartment development of 16 units per residential acre, for example, would beestimated to generate 28% fewer trips than a three unit per acre project. Themaximum reduction using this formula is 60%, although this is only obtained withextreme residential densities.5
Trip generation at the non-residential end is also influenced by density, but to amuch lesser degree (Cervero, 1989, cited in Kuzmyak et. al, 2003). There are alsofar fewer studies investigating this relationship, and there is no comparable datasetto that for residential density. No credit is provided by URBEMIS for higher non-
residential densities.
4For summaries, see Kuzmyak et. al. (2003); Boarnet & Crane (2001); Criterion and Fehr & Peers (2001);
Cervero & Ewing (2001).5
This is because the formula uses a nonlinear equation, with an asymptote of 60%.
Nelson\Nygaard Consult ing Associates • Page 11
8/4/2019 Crediting Low-Traffic Developments, Nelson/Nygaard Consulting Assoc., August 2005
http://slidepdf.com/reader/full/crediting-low-traffic-developments-nelsonnygaard-consulting-assoc-august 12/19
A d j u s t i n g S i t e - L e v e l V e h i c l e T r i p G e n e r a t i o n U s i n g U R B E M I S
Figure 4 Residential Density Vs. Vehicle Travel
0
5000
10000
15000
20000
25000
30000
35000
0 50 100 150 200
Households/Residential Acre
A n n u a l V M T / H h
SF
LA
Chicago
Source: Holtzclaw et. al. (2002).
Mix of Uses
Many references point to the impact of “diversity” or mix of uses on travel behavior.This is true both at the macro-scale, e.g. jobs-housing balance, and the micro-scale,e.g. the availability of services within walking distance.6 The analysis is complicatedby the fact that some of the most beneficial developments from this perspective may
be single-use, in an area where another use is predominant (e.g. residential in anemployment area). For this reason, the mix of uses in the wider neighborhood(within one-half mile of the project center) is considered, where this area is largerthan the project area itself. URBEMIS uses the following formula (adapted fromCriteron and Fehr & Peers, 2001):
Trip reduction = ( 1- ( ABS ( 1.5 * h – e ) / ( 1.5 * h + e )) – 0.25 ) / 0.25 * 0.03
Where: h = study area households (or housing units)e = study area employment
Negative trip reductions of up to 3% can result, and are included by URBEMIS
This formula assumes an “ideal” housing balance of 1.5 jobs per household, basedon Messenger & Ewing (1996, cited in Kuzmyak et. al., 2003), and a baselinediversity of 0.25. The maximum possible credit is 9%.
6See, for example, Criterion and Fehr & Peers (2001); Ewing & Cervero (2001); Kuzmyak et. al. (2003).
Nelson\Nygaard Consult ing Associates • Page 12

8/4/2019 Crediting Low-Traffic Developments, Nelson/Nygaard Consulting Assoc., August 2005
http://slidepdf.com/reader/full/crediting-low-traffic-developments-nelsonnygaard-consulting-assoc-august 13/19
A d j u s t i n g S i t e - L e v e l V e h i c l e T r i p G e n e r a t i o n U s i n g U R B E M I S
This reduction takes into account overall jobs-population balance. The presence of local serving retail can be expected to bring further trip reduction benefits, andURBEMIS provides an additional credit of 2%. This is towards the lower end of therange given in published research,7 in order to avoid double counting with the jobs-housing balance mitigation measure.
Transit
Any index of transit service needs to consider two fundamental issues: the amountof service (i.e., frequency and service span), and quality (particularly speed), whichhave a strong relationship with ridership.8 The index used by URBEMIS thereforeplaces the emphasis on frequency, but gives greater weight to rail service (in viewof greater speed and comfort) and dedicated shuttles (which will be targeted to theneeds of the specific development). It considers the quantity of bus service withinone-quarter mile, and rail service within one-half mile.9 The index is determined asfollows:
Number of average daily weekday buses stopping within 1/4 mile of the site;plus
Twice the number of daily rail or bus rapid transit trips stopping within 1/2mile of the site
Twice the number of dedicated daily shuttle trips
Divided by 900, the point at which the maximum benefits are assumed.(This equates to a BART station on a single line, plus four bus lines at 15-minute headways.)
Developments that are larger than 0.5 miles across in any direction must be
broken into smaller units for purposes of determining the transit serviceindex. The average of all units is then used.
In order to account for non-motorized access to transit, half the reduction isdependent on the pedestrian/bicycle friendliness credit (described in the followingsection). As well as existing service, planned and funded transit service should beincluded in the calculation. Purely demand responsive service may not be included.URBEMIS provides a maximum credit of 15%,10 calculated as follows:
Trip reduction = t * 0.075+ t * ped/bike score * 0.075
Where t = transit service index
7E.g. Parsons Brinkerhoff (1996); and NTI (2000), both cited in Kuzmyak et. al. (2003).
8See, for example Kittselson & Associates et. al, (2003); Holtzclaw et. al. (2002) Pratt et. al. (2003);
Nelson\Nygaard (2002).9
See Lund et. al. (2004) for a discussion of walking distances to transit.10
This ceiling is based on the previous version of URBEMIS, which is turn was based on the 1994 railstudies by Robert Cervero.
Nelson\Nygaard Consult ing Associates • Page 13
8/4/2019 Crediting Low-Traffic Developments, Nelson/Nygaard Consulting Assoc., August 2005
http://slidepdf.com/reader/full/crediting-low-traffic-developments-nelsonnygaard-consulting-assoc-august 14/19
A d j u s t i n g S i t e - L e v e l V e h i c l e T r i p G e n e r a t i o n U s i n g U R B E M I S
Bicycle and Pedestrian
Research for the Florida Department of Transportation, FHWA and otherorganizations has shown that there are numerous statistically significant factors thatcan assess the quality of the bicycle and pedestrian environment. These includemotor vehicle volumes and speeds, truck volumes, roadway widths, urban design,and lateral separation between pedestrians and motor vehicles.11 However, many of the data inputs required for these indices are highly complex to gather, particularlyprior to occupancy. For this reason, URBEMIS uses three of the most importantvariables that are identified in the literature12 to calculate the quality of the bicycleand pedestrian environment, as follows:
Intersection density, which measures street connectivity. A well-connectedgrid (high intersection density) provides better opportunities for pedestriantravel than cul-de-sacs and “loops and lollipops” (low intersection density)
Sidewalk completeness
Bike network completeness
Since both bicycle and pedestrian use depend on similar neighborhoodcharacteristics, such as a fine-grained street grid, a single factor is used to accountfor both modes.
URBEMIS assumes an “ideal” intersection density of 1,300 legs per square mile.This roughly equates to a dense grid with four-way intersections every 300 feet, perthe recommendation of Ewing (1999). URBEMIS grants a maximum trip reductionof 9%, using the following formula:
Trip reduction =
9% * (intersection density + sidewalk completeness + bike lane completeness ) / 3
Where:Intersection density = intersection legs per square mile13 / 1300 (or 1.0, whichever is less)
Sidewalk completeness =% streets with sidewalks on both sides + 0.5 * % streets with sidewalk on one side
Bike lane completeness =% arterials and collectors with bicycle lanes, or where suitable, direct parallel routes exist
11
For example, FHWA (1998); Landis et. al. (2001).12See, for example, Dill (2003); Parsons Brinkerhoff (1993); Kuzmyak et. al, (2003); Ewing & Cervero
(2001); and Ewing (1999). Note that network density is inversely related to block size, which is sometimesconsidered in the research.13
Intersections with dedicated routes for pedestrians and/or bicyclists should be included in this calculation.In most GIS applications, intersections are counted based on the number of line segment terminations, oreach “valence.” Intersections have a valence of 3 or higher – a valence of 3 is a “T” intersection, 4 is a four-way intersection, and so on. (Georgia Institute of Technology, 2002). Therefore, if intersections are countedmanually on a map or project plan, care needs to be taken to distinguish between 3-, 4- and 5-wayintersections, and factor them up accordingly.
Nelson\Nygaard Consult ing Associates • Page 14
8/4/2019 Crediting Low-Traffic Developments, Nelson/Nygaard Consulting Assoc., August 2005
http://slidepdf.com/reader/full/crediting-low-traffic-developments-nelsonnygaard-consulting-assoc-august 15/19
A d j u s t i n g S i t e - L e v e l V e h i c l e T r i p G e n e r a t i o n U s i n g U R B E M I S
No reduction is allowed if the entire area within a half-mile walk of the projectcenter consists of a single use. However, the pedestrian/bicycle factor can still beused to calculate pedestrian access to transit, as part of the transit mitigationmeasure.
Affordable and Senior Housing
A significant amount of evidence points to the fact that lower-income householdsand senior citizens own fewer vehicles and drive less.14 Obviously, it is difficult if not impossible to account for the exact incomes of residents in URBEMIS, becausethe occupants are not known at the pre-development stage. However, thepercentage of deed-restricted below-market-rate (BMR) housing does offer a way toincorporate this effect.
URBEMIS provides a 4% reduction in vehicle trips for each deed-restricted BMRunit.15 Thus, the total reduction is as follows:
Trip reduction = % units that are BMR * 0.04
A development with 20% BMR units would thus gain a 0.8% reduction. Adevelopment with 100% BMR units would gain a 4% reduction.
Parking Supply
There is a significant correlation between the quantity of parking provided andemployee mode split.16 In addition, incorporating data on parking supply cancapture the effects of a range of mitigation measures that are not included inURBEMIS.
Theoretically, it is possible to reduce parking provision to below the level of actualdemand, should drivers park in neighboring lots or on-street in surrounding areas.However, the development approval process and market realities will generallyprevent this from occurring, A credit is only granted if measures to control overspillare in place, such as Residential Permit Parking programs, time limits or meters.
URBEMIS uses the Institute of Transportation Engineers’ Parking Generation handbook as the baseline figure for parking supply. This is assumed to equate tounconstrained demand. The Parking Generation handbook covers most commonland uses. For some land uses, however, no parking generation rates are available:
in these cases, this particular mitigation measure may not be used. For land uses
14See, for example, Russo (2001); Holtzclaw et. al., 2002.
15Calculated from Holtzclaw et. al. (2002), assuming 12,000 average annual VMT per vehicle, median per
capita income of $33,000 (2002 figures per California State Department of Finance), and an average incomein BMR units 25% below median. Holtzclaw calculate the coefficient of -0.0565. Therefore, expected VMTreduction can be calculated as 0.0565 * 33,000 * 0.25 / 12,000 = 4%16
See, for example, Morrall & Bolger, 1996, cited in Kuzmyak et. al., 2003b; Lund et. al., (2004).
Nelson\Nygaard Consult ing Associates • Page 15
8/4/2019 Crediting Low-Traffic Developments, Nelson/Nygaard Consulting Assoc., August 2005
http://slidepdf.com/reader/full/crediting-low-traffic-developments-nelsonnygaard-consulting-assoc-august 16/19
A d j u s t i n g S i t e - L e v e l V e h i c l e T r i p G e n e r a t i o n U s i n g U R B E M I S
with rates for both weekday and weekend, URBEMIS will use whichever rate ishigher.
If the percentage reduction from all other non-residential trip reduction measures isequal to or greater than the parking supply reduction, no additional credit is granted
(in order to avoid double counting). In other cases, URBEMIS grants an additionalcredit of 50% of the difference between actual parking supply and values reportedin Parking Generation.
The trip reduction is calculated as follows:
Trip reduction = Actual parking provision / ITE Parking Generation rate * 0.5
For example, if parking supply is reduced 25% from ITE levels, and transit, mixeduse and pedestrian/bicycle credits amount to 15%, the total reduction would be:
15 + 0.5 * (25-15) = 20%.
Transportation Demand Management
Transportation Demand Management (TDM) programs have been shown to reduceemployee vehicle trips by up to 38%, with the largest reductions achieved throughparking pricing.17 URBEMIS provides credits for a range of TDM program elements,provided that they form part of a legally enforceable agreement (for example, adevelopment agreement with a city) that guarantees that the mitigation measureswill be implemented. URBEMIS provides the most credit for the three TDMelements that have the greatest impact on travel behavior:
Parking pricing – up to 25% trip reduction, which is attained with a $6 daily
charge.18 Parking cash-out programs are granted 50% of the reduction fordirect parking charges, in recognition of the fact that their impacts tend to besignificantly lower (Pratt, 2000).
Free transit passes – up to 25% of the trip reduction granted for transitservice availability.19 Thus, the credit is more valuable in places that havegood transit service.
Telecommuting and compressed work schedules – employee vehicle tripsare reduced by the percentage of employees that telecommute, or have a‘free’ day gained through a compressed schedule, on an average day.
Other TDM program elements, that do not include financial incentives, tend tohave a smaller impact on travel behavior. Reductions are based on the number of the following elements incorporated into the program, per Figure 5:
17Shoup & Willson (1980); Comsis (1993); Valk & Wasch (1998); Pratt (2000).
18The 25% reduction is based on the approximate midpoint of observed reductions, which range from 15%
to 38% (Shoup & Willson, 1990; Comsis, 1993; Pratt, 2000).19
Free transit pass programs have been shown to increase transit ridership by 50-79% (City of Boulder,undated; Caltrans, 2002), and reduce vehicle trips by 19% (Shoup, 1999).
Nelson\Nygaard Consult ing Associates • Page 16

8/4/2019 Crediting Low-Traffic Developments, Nelson/Nygaard Consulting Assoc., August 2005
http://slidepdf.com/reader/full/crediting-low-traffic-developments-nelsonnygaard-consulting-assoc-august 17/19
A d j u s t i n g S i t e - L e v e l V e h i c l e T r i p G e n e r a t i o n U s i n g U R B E M I S
Secure bicycle parking (at least one space per 20 vehicle parking spaces)
Showers/changing facilities
Guaranteed Ride Home
Car-sharing services
Information on transportation alternatives, such as bus schedules and bikemaps
Dedicated employee transportation coordinator
Carpool matching programs
Preferential carpool/vanpool parking
The impact of a TDM program will also depend on the travel alternatives available.A program will have more impact if the site is served by frequent transit, forexample (although note that a TDM program can do much to promote carpoolingeven in other locations). For this reason, URBEMIS uses part of the TDM credit to
adjust the credits granted for transit service and pedestrian/bicycle friendliness (seeFigure 5).
Credits for all TDM program elements are applied only to the types of trips that theTDM program seeks to influence. For example, if only employees, and not visitors,are subject to parking charges, the credit is applied only to employee vehicle trips.
Figure 5 TDM Program Reductions
Level Number of
Elements
Recommended Reduction
Major At least 5 elements 2%, plus 10% of the credit for transit and pedestrian/bikefriendliness
Minor At least 3 elements 1%, plus 5% of the credit of transit and pedestrian/bike
friendliness
No program None None
Nelson\Nygaard Consult ing Associates • Page 17
8/4/2019 Crediting Low-Traffic Developments, Nelson/Nygaard Consulting Assoc., August 2005
http://slidepdf.com/reader/full/crediting-low-traffic-developments-nelsonnygaard-consulting-assoc-august 18/19
A d j u s t i n g S i t e - L e v e l V e h i c l e T r i p G e n e r a t i o n U s i n g U R B E M I S
R e f e r e n c e s
Boarnet, Marlon and Crane, Randall (2001), Travel by Design. The Influence of Urban Design Form on Travel. New York: Oxford University Press.
Calthorpe, Peter (1993), The Next American Metropolis: Ecology, Community and the American Dream. New York: Princeton Architectural Press.
Caltrans (2002), Special Report: Parking and TOD: Challenges and Opportunities.
Comsis (1993). Guidance Manual: Implementing Effective Employer-Based TravelDemand Management Programs.
Criteron Planner/Engineers and Fehr & Peers Associates (2001). Index 4D Method. A Quick-Response Method of Estimating Travel Impacts from Land-Use Changes.Technical Memorandum prepared for US EPA, October 2001.
Dill, Jennifer (2003), Measuring Network Connectivity for Bicycling and Walking.
Unpublished paper presented at Joint Congress of ACSP-AESOP, Leuven, Belgium, Jul 9 2003.
Ewing, Reid (1999), Pedestrian- and Transit-Friendly Design: A Primer for SmartGrowth. Washington, DC: Smart Growth Network.
Ewing, Reid & Cervero, Robert (2001), “Travel and the Built Environment: ASynthesis,” Transportation Research Record 1780, Washington, DC: TransportationResearch Board, pp 87-114.
Federal Highway Administration (1998), The Bicycle Compatibility Index: A Levelof Service Concept. Implementation Manual. Available atwww.hsrc.unc.edu/research/pedbike/98095/
Georgia Institute of Technology (2002), SMARTRAQ – Strategies for Metropolitan Atlanta’s Regional Transportation and Air Quality City and Regional Planning Program. Regional Land Use Database: Land Use Measures. Report available at:www.smartraq.net/pdfs/GDOT_Deliverable_10.pdf
Holtzclaw, John; Clear, Robert; Dittmar, Hank; Goldstein, David; and Haas, Peter(2002), “Location Efficiency: Neighborhood and Socio-Economic CharacteristicsDetermine Auto Ownership and Use – Studies in Chicago, Los Angeles and SanFrancisco”, Transportation Planning and Technology , 25 (1): 1-27.
Institute of Transportation Engineers (2001), Trip Generation Handbook. An ITERecommended Practice. Washington, DC: Institute of Transportation Engineers.
Institute of Transportation Engineers (2003), Trip Generation. 7 th edition.Washington, DC: Institute of Transportation Engineers.
Kittelsen & Associates et. al. (2003). Transit Capacity and Quality of ServiceManual. 2nd Edition. TCRP Report 100. Washington, DC: Transportation ResearchBoard.
Nelson\Nygaard Consult ing Associates • Page 18

8/4/2019 Crediting Low-Traffic Developments, Nelson/Nygaard Consulting Assoc., August 2005
http://slidepdf.com/reader/full/crediting-low-traffic-developments-nelsonnygaard-consulting-assoc-august 19/19
A d j u s t i n g S i t e - L e v e l V e h i c l e T r i p G e n e r a t i o n U s i n g U R B E M I S
Kuzmyak, J Richard; Pratt, Richard H and Douglas, G Bruce (2003). Traveler Response to Transportation System Changes. Chapter 15 – Land Use and SiteDesign. Transportation Research Board, TCRP Report 95. [Note that this report hasbeen published on an interim basis in the form of individual chapters.]
Landis, Bruce; Vattikuti, Venkat; Ottenberg, Russell; McLeod, Douglas; and
Guttenplan, Martin (2001), “Modeling the Roadside Walking Environment:Pedestrian Level of Service,” Transportation Research Record 1773, pp 82-88.
Local Government Commission (2002), Compact Development Compact Disc: AToolkit to Build Support for Higher Density Housing. Sacramento, CA: LocalGovernment Commission.
Lund, Hollie; Cervero, Robert; and Willson, Richard (2004), Travel Characteristicsof Transit-Oriented Development in California. Final Report. January 2004.
Nelson\Nygaard (2002), Transit Impact Review Program. Final Report. Report forSouthern California Association of Governments and Los Angeles Department of
Transportation.Parsons Brinckerhoff Quade and Douglas, Inc., with Cambridge Systematics, Inc.and Calthorpe Associates (1993), Making the Land Use Transportation Air Quality Connection.The Pedestrian Environment. Report prepared for 1000 Friends of Oregon. Available at: ntl.bts.gov/DOCS/tped.html
Pratt, Richard H (2000), Traveler Response to Transportation System Changes.Chapter 13 – Parking Pricing and Fees. Transportation Research Board, TCRPReport 95.
Russo, Ryan (2001), Planning for Residential Parking: A Guide For Housing Developers and Planners. Non-Profit Housing Association of Northern California.
Available at: www.nonprofithousing.org/actioncenter/toolbox/parking/ Shoup, Donald (1999). “The Trouble with Minimum Parking Requirements,”Transportation Research Part A, 33: 549-574.
Shoup, Donald (2003), “Truth in Transportation Planning,” Journal of Transportation and Statistics, 6(1): 1-16.
Shoup, Donald C. & Willson, Richard W. (1990). Federal Tax Policy and Employer- paid Parking: The Influence of Parking Prices on Travel Demand . Prepared for:Commuter Parking Symposium Association for Commuter Transportation Seattle,Washington December 6-7, 1990.
Valk, Peter & Wasch, Mikal (1998). Messing with Success: The Boeing Company’sTrip Reduction Program. Presentation at 1998 ACT Annual Conference
Nelson\Nygaard Consult ing Associates • Page 19