Credit, Technology Adoption and Collective Action in...
35
Credit, Technology Adoption and Collective Action in Tanzania’s Smallholder Dairy Sector Edgar E. Twine, Elizaphan J.O. Rao, Isabelle Baltenweck and Amos O. Omore International Livestock Research Institute [email protected] Selected Paper prepared for presentation at the 2015 Agricultural & Applied Economics Association and Western Agricultural Economics Association Annual Meeting, San Francisco, CA, July 26-28 Copyright 2015 by Edgar E. Twine, Elizaphan J.O. Rao, Isabelle Baltenweck and Amos O. Omore. All rights reserved. Readers may make verbatim copies of this document for non- commercial purposes by any means, provided that this copyright notice appears on all such copies.
Transcript of Credit, Technology Adoption and Collective Action in...
Credit, Technology Adoption and Collective Action in Tanzania’s Smallholder Dairy Sector
Edgar E. Twine, Elizaphan J.O. Rao, Isabelle Baltenweck and Amos O. Omore International Livestock Research Institute
Selected Paper prepared for presentation at the 2015 Agricultural & Applied Economics Association and Western Agricultural Economics Association Annual Meeting, San Francisco,
CA, July 26-28
Copyright 2015 by Edgar E. Twine, Elizaphan J.O. Rao, Isabelle Baltenweck and Amos O. Omore. All rights reserved. Readers may make verbatim copies of this document for non-
commercial purposes by any means, provided that this copyright notice appears on all such copies.

ABSTRACT
The study investigates the role of technology adoption and collective action in the demand for credit among dairy farmers in rural Tanzania. Using survey data from four districts in Tanga and Morogoro regions, the incidence of credit is found to be seven percent. Logit and tobit models based on a conceptual framework that assumes endogenously determined interest rates and nonseparability of production and consumption credit, are applied to the data. Interest rates are found to be exogenous and statistically insignificant in the demand for credit. The logit model shows collective action to positively influence the decision to borrow, but technology adoption is insignificant. From the tobit model, both collective action and technology adoption positively influence the amount of funds borrowed. We use these results to examine the observed failure of rural savings and credit cooperative societies to lend to smallholder dairy farmers and livestock keepers in general in Tanzania. Keywords: Credit, technology adoption, collective action, smallholder dairy farmers, Tanzania JEL codes: Q13, Q14, Q16 Funding for this study was provided by Irish Aid through the More Milk in Tanzania (MoreMilkiT) project. The views expressed in this article are the authors’ own and do not necessarily reflect the views of Irish Aid.

1
Credit, Technology Adoption and Collective Action in Tanzania’s Smallholder Dairy Sector
1. Introduction
The importance of credit in agricultural and rural transformation in developing countries
is widely acknowledged. Credit played a significant role in the adoption of improved agricultural
technologies during the Green Revolution (Jabbar, Ehui and Von Kaufmann 2002). In Tanzania,
access to credit has positively influenced adoption of crossbred-cow technology (Abdulai and
Huffman 2005) and in Kenya and Ethiopia, credit has been observed to increase milk production
when used to finance investment in cross-bred dairy cows (Freeman, Ehui and Jabbar 1998).
Recently, Swaminathan, Du Bois and Findeis (2010) find that the likelihood of participation in
off-farm work in Malawi increases with access to credit, while Jia, Xiang and Huang (2013)
have found that access to microfinance significantly increases time allocated to off-farm self-
employment in rural China. Participation in collective action and formation of social capital have
also been found to benefit from access to credit (Fischer and Qaim 2012; Shoji et al 2012).
Credit enables consumption smoothing, investment in off-farm income generating activities, and
it can be used to cope with income shocks. Numerous studies such as those highlighted above
have investigated the impact of credit on important drivers of rural transformation in developing
countries, but the possibility of the reverse effect has received far less attention in the literature.
This paper attempts to fill this gap.
Credit rationing, which can occur even in equilibrium (Stiglitz and Weiss 1981) and
missing markets for credit remain significant challenges to agricultural and rural transformation.
Ali and Deininger (2012) cite literature that has pointed to lack of access to credit by farmers as a
key impediment to achieving higher levels of productivity in developing country agriculture. For
smallholder farmers, lack of access to credit can be attributed to asymmetric information, which

2
is further compounded by inadequate or risky collateral, uncertainties associated with subsistence
agricultural production, and high transaction costs. These factors have contributed to the low
demand for and supply of both formal and informal credit in rural Tanzania (Mohamed 2003;
Salami, Kamara and Brixiova 2010), especially after the collapse of most cooperative unions
following the liberalization of the country’s financial sector in the 1990s (Rweyemamu, Kimaro
and Urassa 2003). For instance, in spite of more than a decade of government support, through
the Cooperative Development Policy of 2002, for rural savings and credit cooperative societies
(SACCOS), only 6% of livestock keeping households have been found to have had membership
in these cooperatives and unsurprisingly, only the same proportion has held credit (Covarrubias,
Nsiima and Zezza 2012). Moreover, participation in informal savings and credit schemes such as
the rotating savings and credit associations (ROSCAs) was found to be as low as 4.3% in the
Kilimanjaro region (Kimuyu 1999). The government of Tanzania recognizes that lack of
adequate credit for agricultural production and marketing is an obstacle to increasing the
competitiveness of the agricultural sector and therefore supports the development of sustainable
rural financial services as part of it rural development strategy (United Republic of Tanzania
2001).
Although the incidence of credit among rural households in Tanzania is currently low, the
government’s efforts towards rural transformation are likely to gradually increase demand for
credit. Indeed, technological and institutional strategies such as technology adoption and
collective action that have become characteristic of rural transformation in low-income countries
have been observed to impact the demand for credit. Iqbal (1983) has found technology adoption
to unambiguously increase the demand for credit in rural India, while Okten and Osili (2004)
find that participation in community networks enhances individuals’ access to credit in

3
Indonesia. Both technology adoption and farmer collective action are currently being supported
by the Tanzanian government and its development partners and therefore it is imperative to
understand the responsiveness of demand for credit to the two development strategies so as to
allocate sufficient resources to potential rural credit schemes.
This paper undertakes an empirical analysis of the demand for credit by dairy farmers in
rural Tanzania. It estimates the incidence and level of demand for credit in intensive and
extensive cattle feeding systems, and determines the effect of technology adoption, specifically
the use of artificial insemination, and collective action on the decision to obtain credit and on the
amount of credit obtained. The paper is organized as follows: section two provides an overview
of rural financial service delivery, dairy cattle technologies and collective action in Tanzania.
Section three summarizes related literature and section four presents the data and descriptive
statistics. Section five describes the conceptual framework and empirical models, section six
discusses the regression results and section seven concludes the paper with remarks on SACCOS
and implications for rural microfinance initiatives.
2. Rural credit, dairy cattle technologies and collective action in Tanzania
Delivery of financial services in rural Tanzania
Provision of financial services to households and enterprises in rural Tanzania has
remained underwhelming in spite of the decentralization reform implemented more than four
decades ago, the existence of demand for the services among rural households as revealed by
Amani et al (1987), and the financial sector reform initiated in 1988, which included
recapitalization of the Cooperative and Rural Development Bank (CRDB). When the
government began implementing decentralization reform in 1972, it was evident that banks and
other financial institutions would not easily decentralize their operations, hence the formation of
4
the Regional Development Fund (RDF) that offered loans to small-scale enterprises (Maro
1990). But formal and informal financial markets for rural households remained undeveloped
relative to other African countries; between 1985 and 1989, 90% of all private loans to rural
areas went to government parastatals and cooperatives, and the lending that went to farmers was
mostly in-kind (Dercon 1998). For instance, cooperative unions such as those organized around
coffee processing and marketing often provided credit in-kind in form of production inputs such
as pesticides. Credit dues were then checked-off the unions’ payment to indebted farmers.
Interlinking credit with farmers’ output ensured that credit was solely applied to production
decisions (Kimuyu 1999). Cash loans taken by farmers were mostly informal loans obtained
from relatives and friends (Amani et al 1987).
Wangwe and Lwakatare (2004) provide a detailed description of the financial sector
reform in Tanzania. Before the reform, CRDB and the National Bank of Commerce (NBC)
provided most of the formal rural financial services. Loans were allocated administratively and
mostly to cooperatives. But challenges in managing the banks and their clients – cooperatives
and parastatals – coupled with high default rates caused the banks to have large non-performing
loan portfolios. By 1988, the two banks had become unprofitable. The financial sector was
effectively reformed in 1991 by liberalizing interest rates, restructuring banks and privatizing
some of them. In the same year, cooperatives were restructured through the Cooperatives Act of
1991, which also allowed for the establishment of SACCOS. Also, non-government micro-credit
institutions came into existence. The National Micro-Finance Policy of 2000 governs the
provision of rural financial services and the Cooperative Development Policy of 2002 supports
the implementation of the National Micro-Finance Policy insofar as cooperatives, including

5
SACCOS, are expected to be an important channel through which financial services are to be
provided to rural households.
At present, provision of rural financial services is undertaken by five types of institutions,
namely, commercial banks (e.g., CRDB), cooperatives, non-government organizations (e.g.,
PRIDE, FINCA), government organizations (e.g., SIDO), and private agro-processing companies
(e.g., Tanzania Breweries Ltd.) that are vertically linked to smallholder farmers through contract
farming. Although these institutions have somewhat succeeded in deepening financial services in
rural areas (Wangwe and Lwakatare 2004), impediments to increased demand for credit such as
high interest rates, lack of adequate collateral, and poor infrastructure have persisted. This study
considers these and other factors in estimating demand for credit.
Dairy cattle technologies
For over a century, the Tanzania Livestock Research Institute (TALIRI), under different
names, has steered research and dissemination efforts on various dairy cattle technologies that
are relevant to three critical issues: animal health, feeding, and breeds and breeding. In the
1920s, emphasis was on the production of vaccines for the treatment of rinderpest and
trypanosomiasis, and in the 1930s, research on animal feeding began. This was followed by
animal breeding activities in the 1940s after the Institute had introduced exotic dairy cattle
breeds in the previous two decades. Some of the results of the Institute’s endeavors have
included development and distribution of improved pastures such as Ex-Mpwapwa Rhodes grass
and the dual purpose Mpwapwa cattle breed, as well as increasing the milk production potential
of the indigenous Tanzania short-horn zebu (TSZ) cattle through cross-breeding with Mpwapwa,
Sahiwal, Red sindhi, Ayshire, and Boran breeds (Ministry of Livestock and Fisheries
Development 2011). Through the livestock sector development programme (LSDP), the
6
government is working towards increasing a) pasture seed production at its eight pasture seed
farms from the current 45 tons per year to the estimated annual demand of 300 tons; b)
production of compounded feedstuffs; c) availability of dairy cattle breeds through artificial
insemination; and d) options for preventing and controlling the spread of cattle diseases and
parasites.
A few studies have analyzed adoption of dairy cattle technologies in Tanzania. Rushalaza
and Kasonta (1992) report on the Improvement of Livestock Production Systems in Semi-arid
Central Tanzania – an IDRC-funded research project implemented from 1983 to 1986 in
Mpwapwa district, Dodoma region. The purpose of the project had been to evaluate the adoption
and on-farm performance of several technologies including the Mpwapwa cattle breed, improved
pasture species, dual-purpose legumes, intensive feed gardens, cereal stovers and other crop
residues, and water (fodder) melon (Citrullus vulgaris). It was found that all technologies had
been adopted by farmers, albeit to varying degrees. Kaliba, Featherstone and Norman (1997)
investigate factors influencing the adoption of stall feeding for improved dairy cattle and
associated technologies (bitter water melon for cattle feeding and intensive feed gardens). They
find that households that are likely to adopt stall feeding and associated technologies are those
that are resource-constrained. Abdulai and Huffman (2005) find that besides access to credit,
adoption of cross-bred cattle is positively influenced by proximity of a farmer to a farm with
crossbreed cattle, level of formal education and use of extension services. From data collected in
late 2012 and early 2013, Njehu and Omore (2014) find that less than 20% of households in
Tanga and Morogoro regions reported the availability of artificial insemination services and even
a much smaller proportion reported having used the services in the previous year. An earlier
report pointed to the inability of the industry to support private artificial insemination services
7
(Zylstra, Lyimo and Rutamu 1995). Our study is undertaken in the same regions to enable us
control for the influence of the different cattle feeding systems.
Collective action
Collective action in Tanzania dates back to the formation of the Kilimanjaro Native
Planters Association in 1925 and the enactment of the first cooperative legislation, the
Cooperatives Ordinance of 1932 (United Republic of Tanzania 2005). However, after the
country’s independence in 1961, cooperatives became instruments of the government’s social
and economic policies and therefore deviated from their cardinal objective of maximizing
members’ welfare. Inevitably, most cooperatives collapsed and the cooperative movement was
abolished in 1975, only to be reinstated in 1984. Several initiatives including the 2002
Cooperative Development Policy and its legal framework, the 2003 Cooperative Societies Act,
as well as the Cooperative Reform and Modernization Program implemented from 2005 to 2015
have been undertaken to revive cooperatives. Alongside this revival has been the emergence of
community-based farmer (producer) groups/organizations that are registered with their
respective local government’s department of community development.
Cooperatives and farmer groups have been active in the Tanzanian dairy industry (De
Wolf 1995; Zylstra, Lyimo and Rutamu 1995; Kurwijila 1995; Land O’Lakes, Inc. 2007),
especially in collective bulking and selling of milk. The largest dairy processor in the country –
Tanga Fresh Ltd – is partly owned by Tanga Dairies Cooperative Union (TDCU), which is
comprised of more than ten primary cooperative societies, whereas the second largest processor
– ASAS Dairies Ltd – procures milk from dairy farmer groups and not from individual dairy
farmers. At the industry level, individual milk producers and about fifty one dairy farmer groups

8
constitute the Tanzania Milk Producers Association (TAMPRODA), which works to protect and
advocate for members’ interests.
The ability of farmer groups in Tanzania to improve their marketing performance has
been investigated by Barham and Chitemi (2009). From an analysis of a sample of 34 farmer
groups in the North-Eastern highland area that participated in the Agricultural Marketing
Systems Development Programme (AMSDP), the authors conclude that strengthening the
internal structures of groups, the groups’ market (entrepreneurship) skills and linkages with other
value chain actors would improve marketing performance, especially for groups endowed with
basic natural assets such as reliable water sources. Also noted is that improving marketing
performance is a function of time and may require accumulation of financial capital through, for
instance, rotating credit schemes. We draw upon this observation in developing our conceptual
framework.
3. Related literature
There are two common strands of literature on demand for credit; one strand has dealt
with household access to credit, defined as a household’s ability to participate in the credit
market, while the other has dealt with the outcome of that participation in the form of loan
amounts borrowed by households. If a household needs credit, its ability to access it will be
manifested in its decision to borrow. This can be analyzed with probability models of the binary
response type (see, for instance, Guirkinger 2008; Fatima 2009; Giné and Yang 2009; Pal and
Laha 2015; Yuan and Xu 2015). Some studies have analyzed the two aspects of demand for
credit; Swain (2007) applies type 3 tobit and double hurdle models to Indian data, Mpuga (2008)
applies probit and tobit models to Ugandan households, and Khoi et al (2013) applies the

9
conditional recursive mixed process – a combination of tobit, probit and Heckman two-step
models – to households in the Mekong River Delta in Vietnam.
A survey of some of the earlier theoretical and empirical literature on demand for credit is
provided by David and Meyer (1979). They observed that single-equation loan demand models
applied to cross-sectional data had typically been used to estimate loan demand relationships in
low-income countries. This appears to have remained the case in more recent literature (e.g.
Atieno 1997; Swain 2007; Rahji and Ajani 2007; Briones 2009), and the theoretical model
formulated by David and Meyer (1979) has generally informed the choice of explanatory
variables in most empirical studies in both strands of literature. These variables have included
interest rate, farm production characteristics, investment opportunities such as factor
endowments, technological change and higher farm prices, institutional arrangements such as
collective action, and household demographic and socio-economic factors.
What is rather surprising, however, is the dearth of studies that have explicitly
incorporated technology adoption and collective action in the analysis of credit demand. For
instance, Iqbal (1983) alludes to irrigated land or land under improved seed varieties as potential
proxies for a household’s investment opportunities in the credit demand function, yet the
proportion of irrigated land is used as a proxy for soil quality in his empirical model for rural
India. One attempt to include both variables is by Clar de Jesus and Cuevas (1988). They find the
proportion of irrigated land to increase the demand for credit in the Philippines, but surprisingly,
the effect of membership of a household in a farmer organization is negative, contrary to a priori
expectation. Membership in a farmer organization has been observed to be strongly correlated
with greater access to credit and a lower likelihood of default in Zimbabwe (Bratton 1986).
10
A study that is somewhat similar in spirit to our study is by Jabbar, Ehui and Von
Kaufmann (2002). The study analyzes demand for credit among smallholder dairy producers in
Ethiopia, Uganda and Kenya, but unlike our study, it also assesses the supply of credit to
smallholder livestock producers in Ethiopia, Uganda and Nigeria. All farmers surveyed in
Ethiopia, Uganda and Kenya were found to use one or more improved dairy cattle technologies
including crossbred or purebred exotic animals, artificial insemination, veterinary drugs and
services, improved fodder and concentrate feeds, and improved husbandry practices such as barn
construction. The incidence of borrowing was found to be 49% in Ethiopia, 79% in Uganda and
40% in Kenya. The effect of adoption of one technology – improved dairy breeds (captured as
number of crossbred cow equivalents) – on the decision to borrow was estimated using a logistic
regression model and mixed results were obtained; the effect was negative in Ethiopia and
Kenya, but positive in Uganda.
Given the paucity of studies analyzing the effect of technology adoption and collective
action on credit demand and the lack of consensus among the few that have attempted to do so,
we draw upon existing conceptual notions to pursue the subject further for the case of Tanzania.
Our empirical methods are straightforward; consistent with previous studies, we use the logit
model to estimate the determinants of the decision to borrow. But because of the particularly low
incidence of borrowing among cattle keepers in Tanzania, we also apply the rare events logit
model proposed by King and Zeng (2001a; 2001b). We use the tobit model, which takes into
consideration the censored nature of our sample, to estimate the determinants of credit demand.
4. Data and descriptive statistics
The study is based on a stratified sample of 461 cattle keepers in Lushoto and Handeni
districts in Tanga region, and Kilosa and Mvomero districts in Morogoro region. The survey was

11
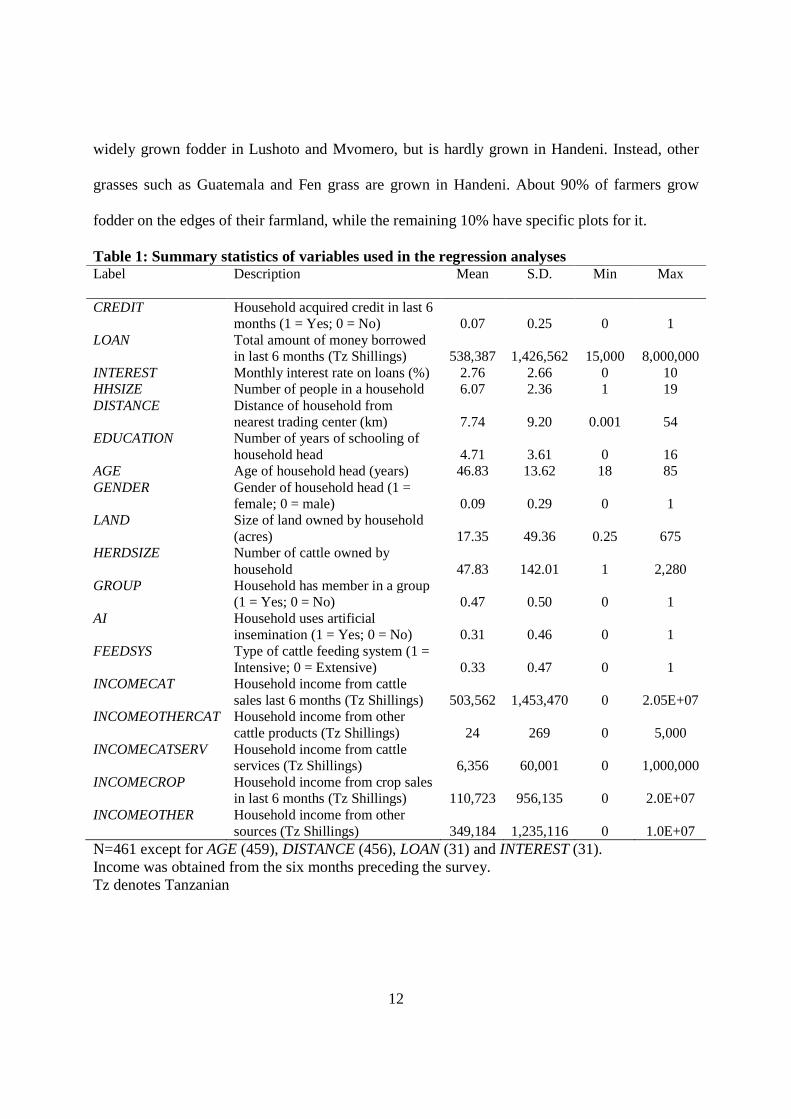
undertaken from July to September 2014. Data was collected on several variables and summary
statistics of those used in the regression analysis are presented in table 1. From the data, districts
are categorized by the predominant feeding system; Lushoto district is dominated by the
intensive feeding system, while Handeni, Kilosa and Mvomero districts are dominated by the
extensive feeding system. We now examine in detail and by district the three variables of interest
to this study: credit demand, dairy farming technologies and practices, and collective action.
Demand for credit
Overall, 33% (152) of the households had wanted credit in the six months prior to the
survey, and of these, only 20% had been able to acquire it. Considering the entire sample, the
incidence of borrowing among cattle keepers is about 7%, which is as low as the 6% obtained for
livestock keepers nationally from the National Panel Survey data of 2008/2009. These figures are
much lower than the figures obtained by Jabbar, Ehui and Von Kaufmann (2002) for Ethiopia,
Uganda and Kenya. The need for credit was highest in Mvomero district (46%) followed by
Lushoto (35%) as shown in table 2. Local microfinance institutions including savings groups
provided the bulk of the loans, with land and livestock being the most common forms of
collateral.
Use of dairy farming technologies
Use of dairy cattle technologies was investigated by eliciting responses to questions on
fodder production and use, and use of animal health and breeding services. Fodder production
and use is strongly correlated with feeding systems. Overall, only 33% of the households
surveyed grow fodder. Data shows that 94% of the households in Lushoto grow fodder compared
to 7%, 1%, and almost none in Mvomero, Handeni and Kilosa, respectively. The proportions of
households growing the different types of fodder are shown in table 3. Napier grass is the most
12
widely grown fodder in Lushoto and Mvomero, but is hardly grown in Handeni. Instead, other
grasses such as Guatemala and Fen grass are grown in Handeni. About 90% of farmers grow
fodder on the edges of their farmland, while the remaining 10% have specific plots for it.
Table 1: Summary statistics of variables used in the regression analyses Label Description Mean S.D. Min Max
CREDIT Household acquired credit in last 6
months (1 = Yes; 0 = No)
0.07
0.25 0
1
LOAN Total amount of money borrowed in last 6 months (Tz Shillings)
538,387
1,426,562
15,000
8,000,000
INTEREST Monthly interest rate on loans (%) 2.76 2.66 0 10 HHSIZE Number of people in a household 6.07 2.36 1 19 DISTANCE Distance of household from
nearest trading center (km)
7.74
9.20
0.001
54 EDUCATION Number of years of schooling of
household head
4.71
3.61 0
16
AGE Age of household head (years) 46.83 13.62 18 85 GENDER Gender of household head (1 =
female; 0 = male)
0.09
0.29 0
1
LAND Size of land owned by household (acres)
17.35
49.36
0.25
675
HERDSIZE Number of cattle owned by household
47.83
142.01
1
2,280
GROUP Household has member in a group (1 = Yes; 0 = No)
0.47
0.50
0
1
AI Household uses artificial insemination (1 = Yes; 0 = No)
0.31
0.46
0
1
FEEDSYS Type of cattle feeding system (1 = Intensive; 0 = Extensive)
0.33
0.47
0
1
INCOMECAT Household income from cattle sales last 6 months (Tz Shillings)
503,562
1,453,470
0
2.05E+07
INCOMEOTHERCAT Household income from other cattle products (Tz Shillings)
24
269
0
5,000
INCOMECATSERV Household income from cattle services (Tz Shillings)
6,356
60,001
0
1,000,000
INCOMECROP Household income from crop sales in last 6 months (Tz Shillings)
110,723
956,135
0
2.0E+07
INCOMEOTHER Household income from other sources (Tz Shillings)
349,184
1,235,116
0
1.0E+07
N=461 except for AGE (459), DISTANCE (456), LOAN (31) and INTEREST (31). Income was obtained from the six months preceding the survey. Tz denotes Tanzanian

13
Table 2: Households that needed and obtained credit
District N
Number of households that needed credit
Number of households that obtained credit
Households that needed credit
(%)
Households that obtained credit as a percentage of
those that needed it (%)
Lushoto 154 54 14 35 26 Mvomero 98 45 12 46 27 Handeni 105 29 3 28 10 Kilosa 104 24 2 23 8 Table 3: Households growing fodder
District N
Number growing fodder
Napier grass (%)
Planted grasses (e.g., Rhodes
grass) (%)
Fodder shrubs (e.g., Sesbania)
(%) Other (%) Lushoto 154 145 70.3 26.2 0.7 2.8 Mvomero 98 7 71.4 14.3 14.3 0.0 Handeni 105 1 0 100 0 0 Kilosa 104 0 0 0 0 0
Reasons for not growing fodder were examined. Majority of the farmers in Mvomero
(76%), Handeni (62%) and Kilosa (81%) pointed to lack of knowledge on fodder production.
The few in Lushoto that did not grow fodder claimed to be short of both knowledge and land.
Roughly 35% in Mvomero, 19% in Handeni and 27% in Kilosa also cited lack of land. Limited
labour seemed to be a constraint for about 20% of farmers in Mvomero and 22% in Kilosa. In
sum, limited knowledge, land and labour appear to be the most important constraints to fodder
production. Moreover, buying fodder does not appear to be an option for most farmers. For
instance, most of the farmers that purchased fodder live in Lushoto and are less than 20% of the
total number of farmers interviewed from the district. Considering the total sample size, only 7%
buy fodder.
The survey sought to determine the extent of use of other types of fodder, namely, crop
residues and concentrates. Overall, crop residues are used by about 30% of farmers and are
usually obtained from the farmers’ own fields. Only 18% of farmers buy crop residues. Crop
residues are commonly used in Lushoto, but to a lesser extent elsewhere. Sixty six percent of
14
farmers in Lushoto use crop residues, especially maize stover (used by 94% of farmers) left in
the fields after harvest, compared to 14% in Mvomero, 15% in Handeni and a mere 3% in
Kilosa. What is clear from the above results is that planting fodder and use of crop residues is
more prevalent among cattle keepers that also grow crops. Cattle keepers that do not grow crops
are unlikely to plant fodder because they may not have sufficient knowledge of the agronomy of
extant fodder species. Indeed it is not surprising that lack of knowledge was reported to be a
critical constraint to fodder production.
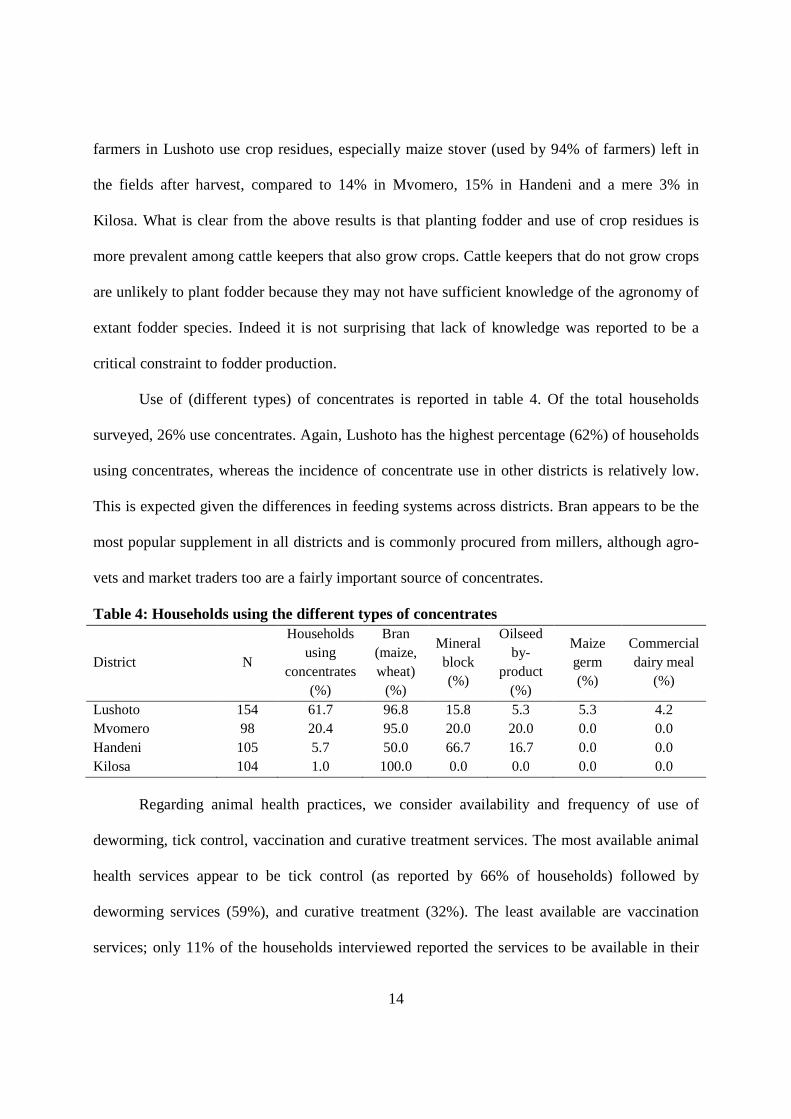
Use of (different types) of concentrates is reported in table 4. Of the total households
surveyed, 26% use concentrates. Again, Lushoto has the highest percentage (62%) of households
using concentrates, whereas the incidence of concentrate use in other districts is relatively low.
This is expected given the differences in feeding systems across districts. Bran appears to be the
most popular supplement in all districts and is commonly procured from millers, although agro-
vets and market traders too are a fairly important source of concentrates.
Table 4: Households using the different types of concentrates
District N
Households using
concentrates (%)
Bran (maize, wheat)
(%)
Mineral block (%)
Oilseed by-
product (%)
Maize germ (%)
Commercial dairy meal
(%)
Lushoto 154 61.7 96.8 15.8 5.3 5.3 4.2 Mvomero 98 20.4 95.0 20.0 20.0 0.0 0.0 Handeni 105 5.7 50.0 66.7 16.7 0.0 0.0 Kilosa 104 1.0 100.0 0.0 0.0 0.0 0.0
Regarding animal health practices, we consider availability and frequency of use of
deworming, tick control, vaccination and curative treatment services. The most available animal
health services appear to be tick control (as reported by 66% of households) followed by
deworming services (59%), and curative treatment (32%). The least available are vaccination
services; only 11% of the households interviewed reported the services to be available in their
15
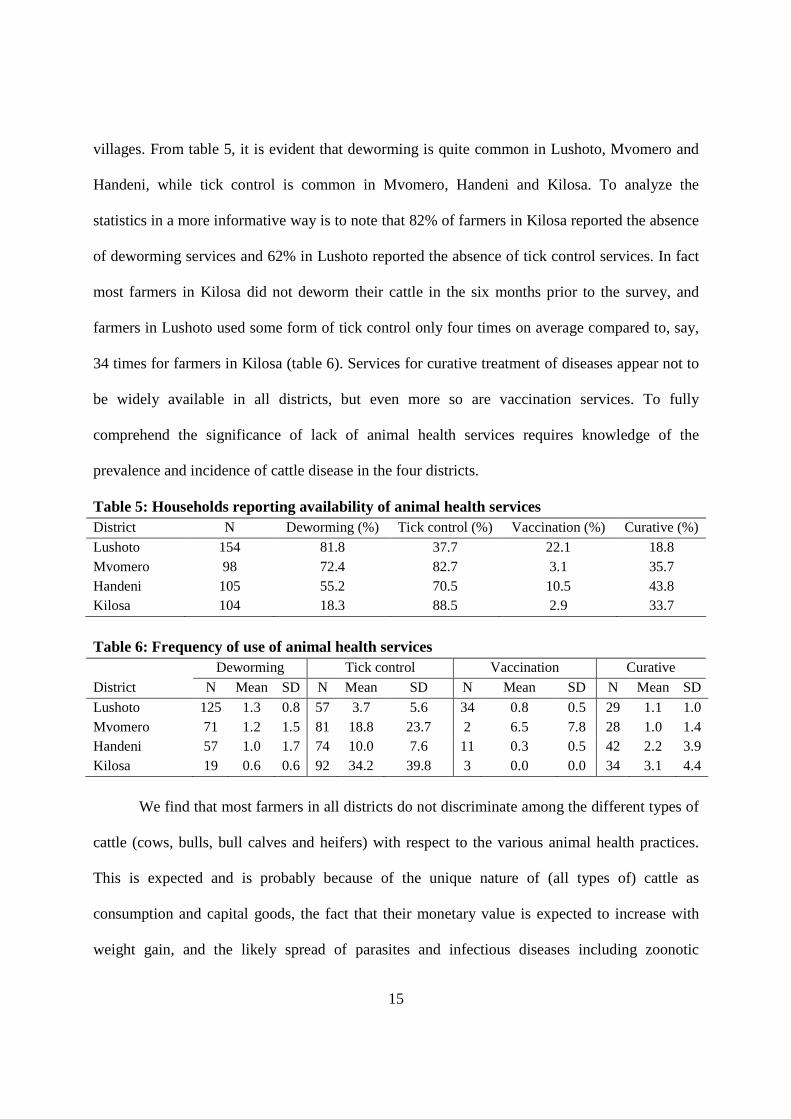
villages. From table 5, it is evident that deworming is quite common in Lushoto, Mvomero and
Handeni, while tick control is common in Mvomero, Handeni and Kilosa. To analyze the
statistics in a more informative way is to note that 82% of farmers in Kilosa reported the absence
of deworming services and 62% in Lushoto reported the absence of tick control services. In fact
most farmers in Kilosa did not deworm their cattle in the six months prior to the survey, and
farmers in Lushoto used some form of tick control only four times on average compared to, say,
34 times for farmers in Kilosa (table 6). Services for curative treatment of diseases appear not to
be widely available in all districts, but even more so are vaccination services. To fully
comprehend the significance of lack of animal health services requires knowledge of the
prevalence and incidence of cattle disease in the four districts.
Table 5: Households reporting availability of animal health services District N Deworming (%) Tick control (%) Vaccination (%) Curative (%)
Lushoto 154 81.8 37.7 22.1 18.8 Mvomero 98 72.4 82.7 3.1 35.7 Handeni 105 55.2 70.5 10.5 43.8 Kilosa 104 18.3 88.5 2.9 33.7
Table 6: Frequency of use of animal health services
District
Deworming Tick control Vaccination Curative
N Mean SD N Mean SD N Mean SD N Mean SD
Lushoto 125 1.3 0.8 57 3.7 5.6 34 0.8 0.5 29 1.1 1.0 Mvomero 71 1.2 1.5 81 18.8 23.7 2 6.5 7.8 28 1.0 1.4 Handeni 57 1.0 1.7 74 10.0 7.6 11 0.3 0.5 42 2.2 3.9 Kilosa 19 0.6 0.6 92 34.2 39.8 3 0.0 0.0 34 3.1 4.4
We find that most farmers in all districts do not discriminate among the different types of
cattle (cows, bulls, bull calves and heifers) with respect to the various animal health practices.
This is expected and is probably because of the unique nature of (all types of) cattle as
consumption and capital goods, the fact that their monetary value is expected to increase with
weight gain, and the likely spread of parasites and infectious diseases including zoonotic

16
diseases. These three factors imply that discrimination in the prevention and treatment of
diseases among cattle types would reduce the profitability of cattle keeping in general. On the
one hand, cattle are consumption goods insofar as they can be consumed without further
transformation. This means that if a farmer is to get the best price from the sale of any of their
animals for immediate slaughter at any given age, the animal ought to be in the best possible
state of health. On the other hand, cattle are capital goods in the sense that they can be used in
the production of other goods (including more cattle) and services. Therefore besides the
farmer’s investment decisions, the health of the entire herd in the current period will determine
the health of the herd in the subsequent period(s). Also, irrespective of the type of cattle, the
animal’s weight is usually positively correlated with its sale price. It is reasonable to expect
cattle keepers to be aware that parasites and diseases increase the cost of gain (i.e., the cost of
raising the weight of an animal by one unit) thereby undercutting the profitability of their
enterprises. The loss of profitability would be exacerbated by the non-discriminatory nature of
some parasites and diseases. Therefore it would be in the farmer’s best interest to control
parasites and diseases in the entire herd rather than among specific categories of cattle.
An analysis of the sources of animal health services and the availability of expertise for
delivery of the services shows that over 50% of farmers in each district deworm their animals
themselves with the help of some advice from people knowledgeable about the practice.
Likewise, majority of farmers in each district administer tick control measures themselves.
Therefore it appears that farmers in all districts are generally confident in their ability to deal
with external and internal parasites. But there are variations in sources of vaccination and
curative treatment services: in Lushoto, most farmers obtain vaccination and treatment services
from government veterinarians, whereas majority from Mvomero vaccinate and treat the animals
17
themselves. In Handeni, vaccination is either administered by farmers with or without external
help or by government veterinarians, while most farmers in Kilosa treat their animals
themselves, although a significant proportion uses agro-vet shop owners.
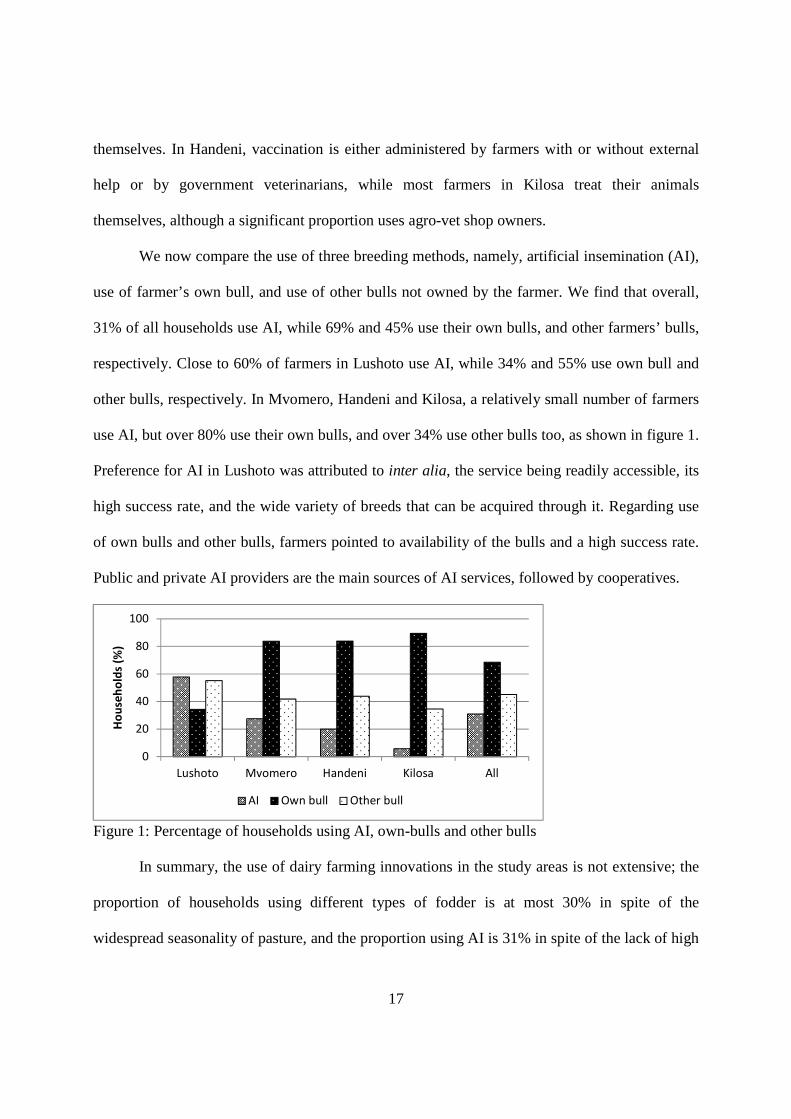
We now compare the use of three breeding methods, namely, artificial insemination (AI),
use of farmer’s own bull, and use of other bulls not owned by the farmer. We find that overall,
31% of all households use AI, while 69% and 45% use their own bulls, and other farmers’ bulls,
respectively. Close to 60% of farmers in Lushoto use AI, while 34% and 55% use own bull and
other bulls, respectively. In Mvomero, Handeni and Kilosa, a relatively small number of farmers
use AI, but over 80% use their own bulls, and over 34% use other bulls too, as shown in figure 1.
Preference for AI in Lushoto was attributed to inter alia, the service being readily accessible, its
high success rate, and the wide variety of breeds that can be acquired through it. Regarding use
of own bulls and other bulls, farmers pointed to availability of the bulls and a high success rate.
Public and private AI providers are the main sources of AI services, followed by cooperatives.
Figure 1: Percentage of households using AI, own-bulls and other bulls
In summary, the use of dairy farming innovations in the study areas is not extensive; the
proportion of households using different types of fodder is at most 30% in spite of the
widespread seasonality of pasture, and the proportion using AI is 31% in spite of the lack of high
0
20
40
60
80
100
Lushoto Mvomero Handeni Kilosa All
Ho
use
ho
lds
(%)
AI Own bull Other bull
18
milk-yielding cattle. Regarding the extent of use or adoption of animal health practices, however,
meaningful inferences can only be made by taking into consideration information on the
incidence and importance of cattle diseases in the study areas. Currently, this information is, at
best, anecdotal.
Membership in farmer groups
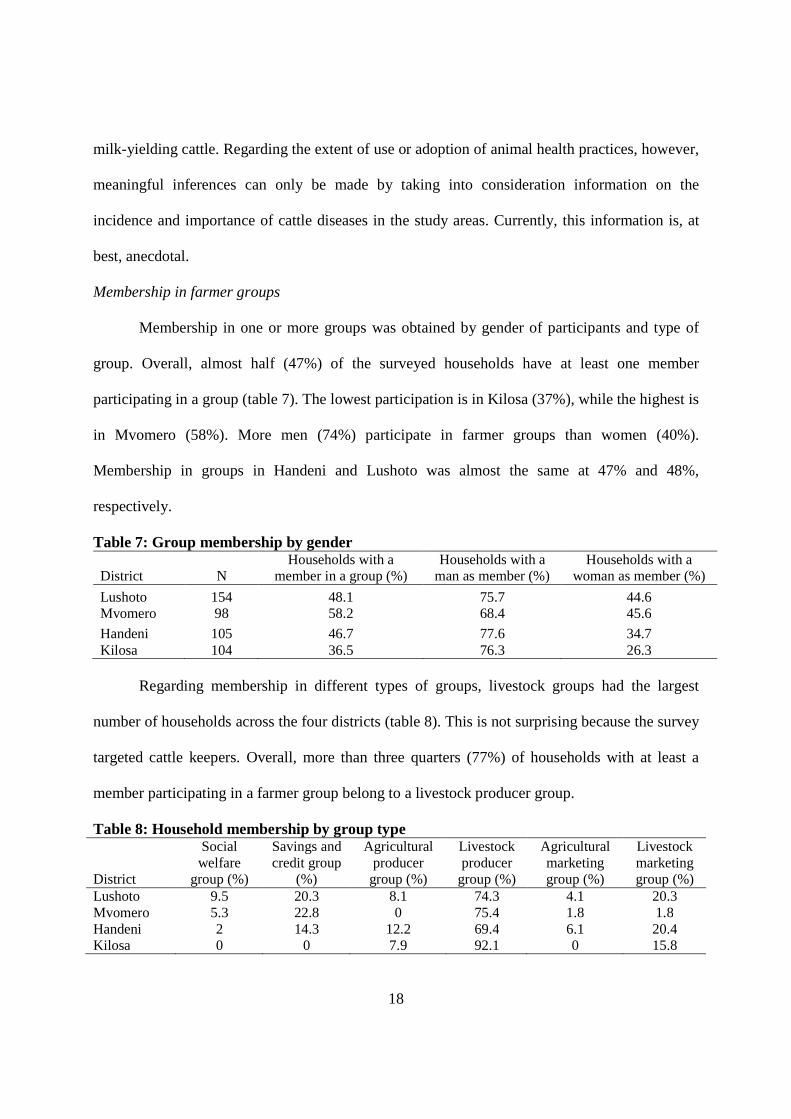
Membership in one or more groups was obtained by gender of participants and type of
group. Overall, almost half (47%) of the surveyed households have at least one member
participating in a group (table 7). The lowest participation is in Kilosa (37%), while the highest is
in Mvomero (58%). More men (74%) participate in farmer groups than women (40%).
Membership in groups in Handeni and Lushoto was almost the same at 47% and 48%,
respectively.
Table 7: Group membership by gender
District N Households with a
member in a group (%) Households with a
man as member (%) Households with a
woman as member (%)
Lushoto 154 48.1 75.7 44.6 Mvomero 98 58.2 68.4 45.6
Handeni 105 46.7 77.6 34.7 Kilosa 104 36.5 76.3 26.3
Regarding membership in different types of groups, livestock groups had the largest
number of households across the four districts (table 8). This is not surprising because the survey
targeted cattle keepers. Overall, more than three quarters (77%) of households with at least a
member participating in a farmer group belong to a livestock producer group.
Table 8: Household membership by group type
District
Social welfare
group (%)
Savings and credit group
(%)
Agricultural producer group (%)
Livestock producer group (%)
Agricultural marketing group (%)
Livestock marketing group (%)
Lushoto 9.5 20.3 8.1 74.3 4.1 20.3 Mvomero 5.3 22.8 0 75.4 1.8 1.8 Handeni 2 14.3 12.2 69.4 6.1 20.4 Kilosa 0 0 7.9 92.1 0 15.8

19
Kilosa has the highest participation at 92%. Participation in savings and credit groups
(e.g., SACCOS) and in livestock marketing groups is estimated to be 16% and 15%,
respectively. The relatively low participation in non-livestock groups may be an indicator of the
relative importance of livestock and livestock-related activities as livelihood sources in the study
areas.
5. Conceptual framework and empirical models
To conceptualize the factors that affect demand for credit, we assume that a household
facing two time periods maximizes utility subject to budget and time constraints. The household
borrows in the current time period, for both production and consumption, and repays the loan in
the second time period. According to David and Meyer (1979), under certain conditions such as
perfect financial markets and fixed savings rate, production and consumption decisions are
separable. Because interest rates are exogenous, the household’s optimal production will occur
where the marginal rate of return on investment is equal to the interest rate, while optimal
consumption will occur where the market opportunity line1 is tangent to the highest utility curve.
The demand for credit will then be a function of interest rate, the household’s investment
opportunities, and its time-preference between current and future consumption, which depends
on, among other things, the household’s characteristics. However, in low-income countries such
as Tanzania, financial markets are likely to be imperfect. Moreover, the subsistence nature of
production means that production and consumption decisions are necessarily intertwined,
implying that disregarding the fungible nature of credit, a ‘production’ loan may well be
considered a ‘consumption’ loan and vice-versa. Given imperfect financial markets, optimal
1 This is an iso-wealth line (on a graph of future consumption against current consumption) representing constant present value of wealth for the household (Trigeorgis 1996).
20
levels of production, consumption and borrowing will be determined simultaneously, hence a
concave market opportunity line. As such, it is difficult to formulate separate demand functions
for production and consumption credit.
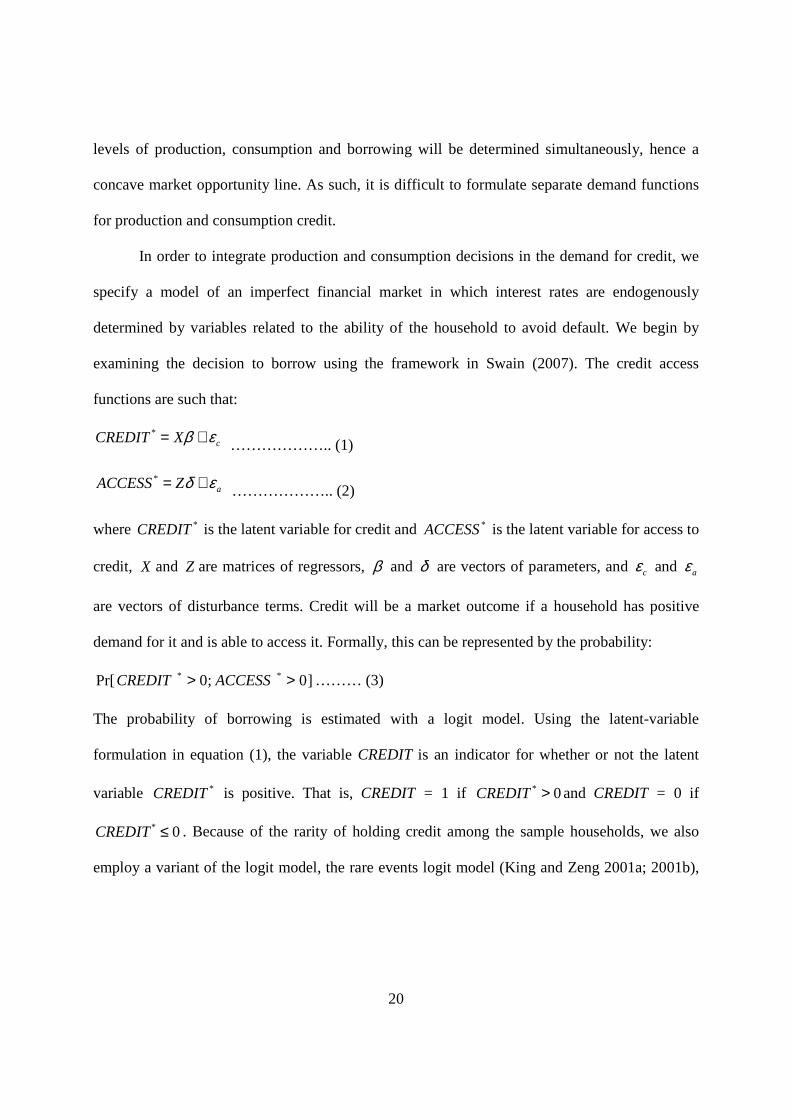
In order to integrate production and consumption decisions in the demand for credit, we
specify a model of an imperfect financial market in which interest rates are endogenously
determined by variables related to the ability of the household to avoid default. We begin by
examining the decision to borrow using the framework in Swain (2007). The credit access
functions are such that:
cXCREDIT εβ +=*
……………….. (1)
aZACCESS εδ +=*
……………….. (2)
where *CREDIT is the latent variable for credit and *ACCESS is the latent variable for access to
credit, X and Z are matrices of regressors, β and δ are vectors of parameters, and cε and aε
are vectors of disturbance terms. Credit will be a market outcome if a household has positive
demand for it and is able to access it. Formally, this can be represented by the probability:
]0;0Pr[ ** >> ACCESSCREDIT ……… (3)
The probability of borrowing is estimated with a logit model. Using the latent-variable
formulation in equation (1), the variable CREDIT is an indicator for whether or not the latent
variable *CREDIT is positive. That is, CREDIT = 1 if 0* >CREDIT and CREDIT = 0 if
0* ≤CREDIT . Because of the rarity of holding credit among the sample households, we also
employ a variant of the logit model, the rare events logit model (King and Zeng 2001a; 2001b),

21
which is intended to overcome the finite-sample bias in logit estimates that is amplified by the
rare nature of the event2 (i.e., borrowing). Results of the two models are compared.
Estimating the determinants of the amount of credit obtained generally follows the
approach in Iqbal (1983), Clar de Jesus and Cuevas (1988) and Swain (2007). The censored
nature of our sample warrants the use of the tobit model. Formally, demand for credit, LOAN*, is
a latent variable:
vWXINTEREST
uINTERESTXLOAN
++=++=
21
*
γγϕφ
…………….. (4)
where φ and ϕ are vectors of structural parameters, W is a vector of additional instruments and
therefore the interest rate equation is written in reduced form, 1γ and 2γ are matrices of reduced-
form parameters and u and v are vectors of disturbance terms. The observable loan amount
borrowed, *LOANLOAN = if 0* >LOAN and zero otherwise. We estimate equation (4) using
Newey’s (1987) efficient two-step minimum chi-squared estimator. Controlling for cattle feeding
system and other variables, we expect the effect of interest rate to be negative.
The use of AI and membership of a household in a farmer group or any other self-help
group are expected to increase both the probability of borrowing as well as the amount of funds
borrowed. From the survey data, the average cost of a single AI service in all districts was found
to be 14,615 Tanzanian Shillings3, and majority of farmers in the extensive feeding system found
it to be expensive relative to other breeding methods. Another possible reason for the positive
effect is that the use of AI may in turn lead to the demand for different and more expensive types
of inputs – hence increased demand for funds – as the proportion of crossbred cattle in the
2 A rare event dummy dependent variable is such that ones are dozens to thousands of times fewer than zeros. Maximum Likelihood estimates of the logit model suffer from finite-sample bias whose degree dependents on the number of cases of the less-frequent outcome. 3 At an exchange rate of 1 USD = 1,800 Tz Shillings, this is equivalent to $8.12.
22
farmer’s herd increases. Membership in a group implies greater social capital, which may
improve the farmer’s credit worthiness and access to informal loans from fellow group members.
It also implies greater access to information about the available sources of loans and their terms
and conditions, and greater access to formal loans from credit schemes that require group
membership. In addition, as observed by Barham and Chitemi (2009), improving a group’s
market performance may require substantial capital and this may in turn compel group members
to borrow to meet their financial obligations towards the group, including membership,
subscription and other dues.
Household size and total land owned by a household may be considered as measures of
the household’s initial resource endowment, while education of the household head is an
indicator of the borrower’s managerial capacity. We expect the coefficients on each of these
variables to be positive. Herd size is an indicator of the household’s ability to pledge collateral,
whereas distance from the household to the nearest trading center captures accessibility to
information, business services (including financial services) and infrastructure. Coefficients on
the two variables are expected to be positive. Permanent income is a function of current and past
income (Iqbal 1983). Thus current income is used as a proxy for permanent income, which
indicates the loan repayment capacity of a household, notwithstanding collateral pledged. We
expect an increase in income to increase borrowing, but we are also interested in determining the
specific source(s) of income that would increase borrowing. Age and sex of household head are
believed to influence households’ time preference for consumption but their effects have been
ambiguous in previous studies.

23
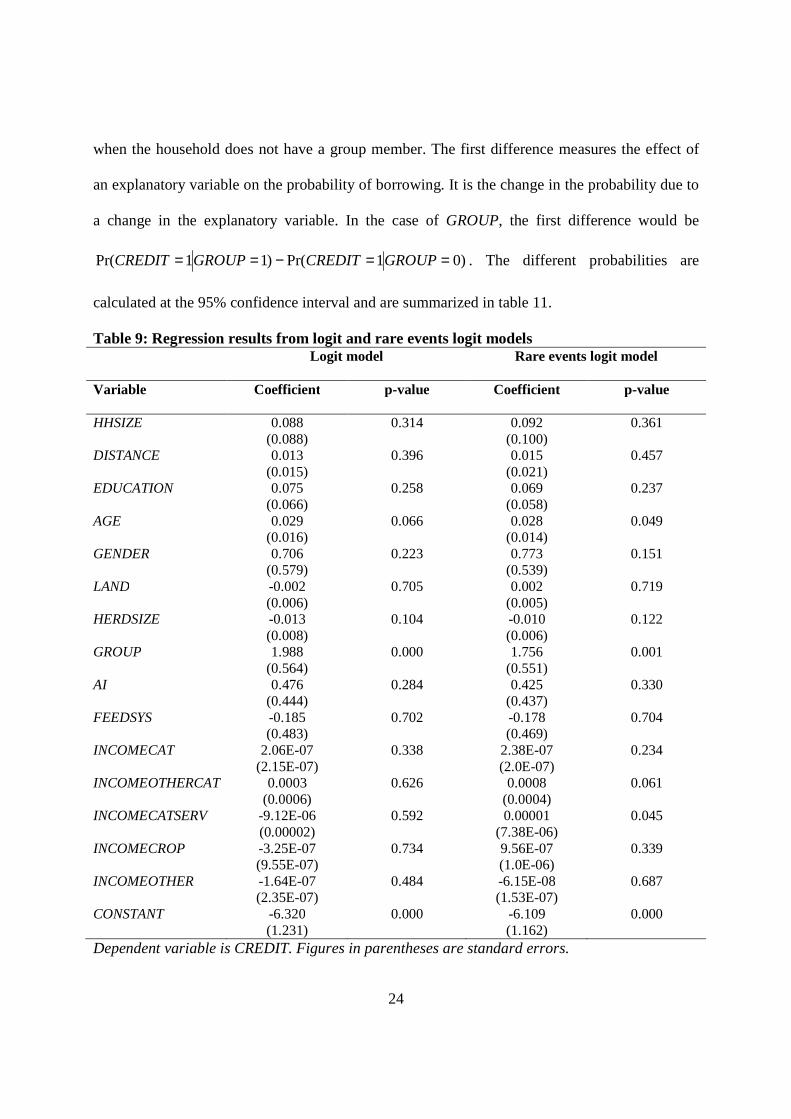
6. Regression results
Results from the usual logit model and the rare events logit model are presented in table
9, and the level of significance considered in this study is 10%. Both models are statistically
significant. It can be seen that in the usual logit model, only two variables are significant; age of
the household head and membership in a group significantly increase the probability of
borrowing. The rare events logit model gives us bias-corrected coefficients with reduced
variance and as such, four coefficients are statistically significant. Similar to the logit model
results, age of the household head and membership in a group are significant. In addition, income
from the sale of other cattle products and income from cattle services also seem to increase the
probability of borrowing. Contrary to our expectation, the use of artificial insemination does not
affect the probability of borrowing. A slightly meaningful interpretation of the effect of the
significant variables is the odds interpretation obtained by calculating βe for the rare events
model as shown in table 10. The odds in favor of borrowing increase by 1.03 (or 3%) for a one-
year increase in the age of the household head, and by 5.79 when a household member joins a
group. A one-shilling increase in either type of income increases the odds by one.
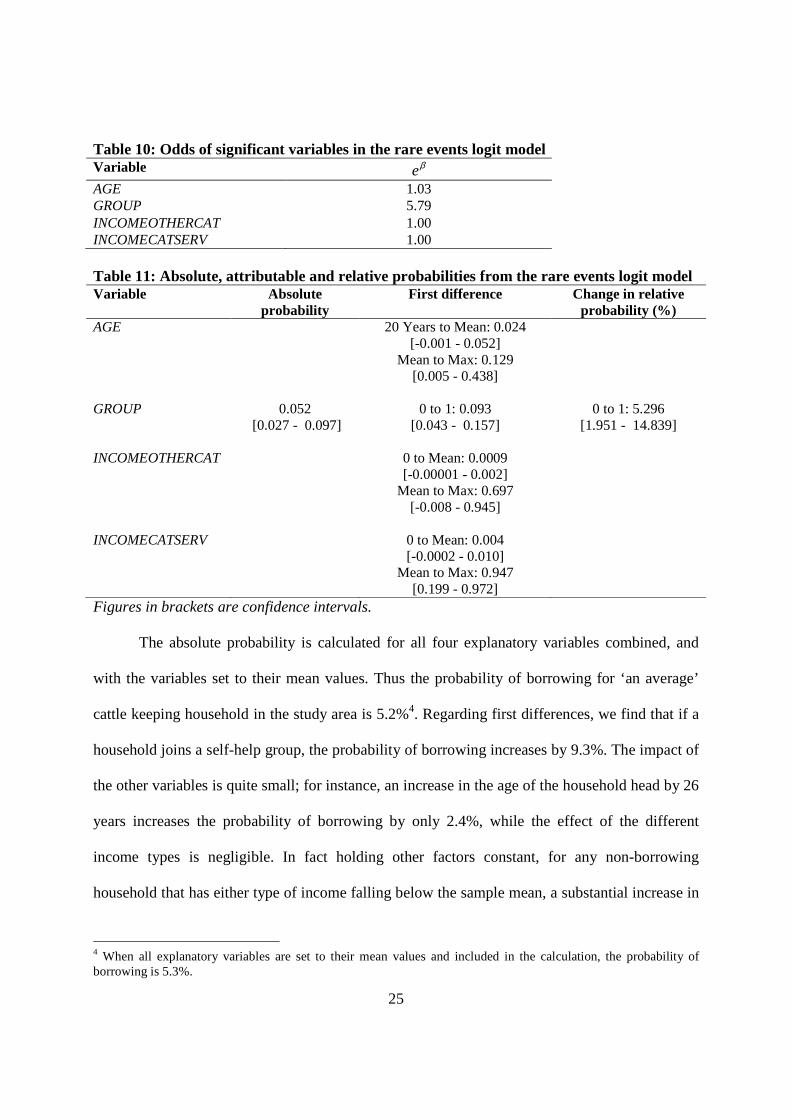
But even more informative are the absolute probabilities, relative probabilities, and
attributable probabilities (first differences) that can be calculated from the rare events logit
model. Absolute probability is the probability of borrowing given the level(s) or value(s) of the
explanatory variable(s), i.e., )1Pr( xXCREDIT == , whereas relative probability is the
probability of borrowing for given values of X relative to the probability of borrowing for some
baseline values of X. For instance, in the case of a binary explanatory variable GROUP, the
relative probability )01Pr()11Pr( ==== GROUPCREDITGROUPCREDIT is the probability
of borrowing when a household has a group member, relative to the probability of borrowing
24
when the household does not have a group member. The first difference measures the effect of
an explanatory variable on the probability of borrowing. It is the change in the probability due to
a change in the explanatory variable. In the case of GROUP, the first difference would be
)01Pr()11Pr( ==−== GROUPCREDITGROUPCREDIT . The different probabilities are
calculated at the 95% confidence interval and are summarized in table 11.
Table 9: Regression results from logit and rare events logit models Logit model
Rare events logit model
Variable Coefficient p-value Coefficient p-value
HHSIZE 0.088
(0.088) 0.314 0.092
(0.100) 0.361
DISTANCE 0.013 (0.015)
0.396 0.015 (0.021)
0.457
EDUCATION 0.075 (0.066)
0.258 0.069 (0.058)
0.237
AGE 0.029 (0.016)
0.066 0.028 (0.014)
0.049
GENDER 0.706 (0.579)
0.223 0.773 (0.539)
0.151
LAND -0.002 (0.006)
0.705 0.002 (0.005)
0.719
HERDSIZE -0.013 (0.008)
0.104 -0.010 (0.006)
0.122
GROUP 1.988 (0.564)
0.000 1.756 (0.551)
0.001
AI 0.476 (0.444)
0.284 0.425 (0.437)
0.330
FEEDSYS -0.185 (0.483)
0.702 -0.178 (0.469)
0.704
INCOMECAT 2.06E-07 (2.15E-07)
0.338 2.38E-07 (2.0E-07)
0.234
INCOMEOTHERCAT 0.0003 (0.0006)
0.626 0.0008 (0.0004)
0.061
INCOMECATSERV -9.12E-06 (0.00002)
0.592 0.00001 (7.38E-06)
0.045
INCOMECROP -3.25E-07 (9.55E-07)
0.734 9.56E-07 (1.0E-06)
0.339
INCOMEOTHER -1.64E-07 (2.35E-07)
0.484 -6.15E-08 (1.53E-07)
0.687
CONSTANT -6.320 (1.231)
0.000 -6.109 (1.162)
0.000
Dependent variable is CREDIT. Figures in parentheses are standard errors.
25
Table 10: Odds of significant variables in the rare events logit model Variable βe AGE 1.03 GROUP 5.79 INCOMEOTHERCAT 1.00 INCOMECATSERV 1.00 Table 11: Absolute, attributable and relative probabilities from the rare events logit model Variable Absolute
probability First difference Change in relative
probability (%) AGE
20 Years to Mean: 0.024 [-0.001 - 0.052]
Mean to Max: 0.129 [0.005 - 0.438]
GROUP 0.052 [0.027 - 0.097]
0 to 1: 0.093 [0.043 - 0.157]
0 to 1: 5.296 [1.951 - 14.839]
INCOMEOTHERCAT 0 to Mean: 0.0009 [-0.00001 - 0.002]
Mean to Max: 0.697 [-0.008 - 0.945]
INCOMECATSERV 0 to Mean: 0.004 [-0.0002 - 0.010]
Mean to Max: 0.947 [0.199 - 0.972]
Figures in brackets are confidence intervals.
The absolute probability is calculated for all four explanatory variables combined, and
with the variables set to their mean values. Thus the probability of borrowing for ‘an average’
cattle keeping household in the study area is 5.2%4. Regarding first differences, we find that if a
household joins a self-help group, the probability of borrowing increases by 9.3%. The impact of
the other variables is quite small; for instance, an increase in the age of the household head by 26
years increases the probability of borrowing by only 2.4%, while the effect of the different
income types is negligible. In fact holding other factors constant, for any non-borrowing
household that has either type of income falling below the sample mean, a substantial increase in
4 When all explanatory variables are set to their mean values and included in the calculation, the probability of borrowing is 5.3%.

26
its probability to borrow can only occur if that income increases to levels beyond the sample
mean. The importance of membership in a group is further indicated by the percentage change in
the relative probability of borrowing; the probability of borrowing increases by 5.3% for a
household joining a group relative to the probability of borrowing by a household that is not a
member of a group.
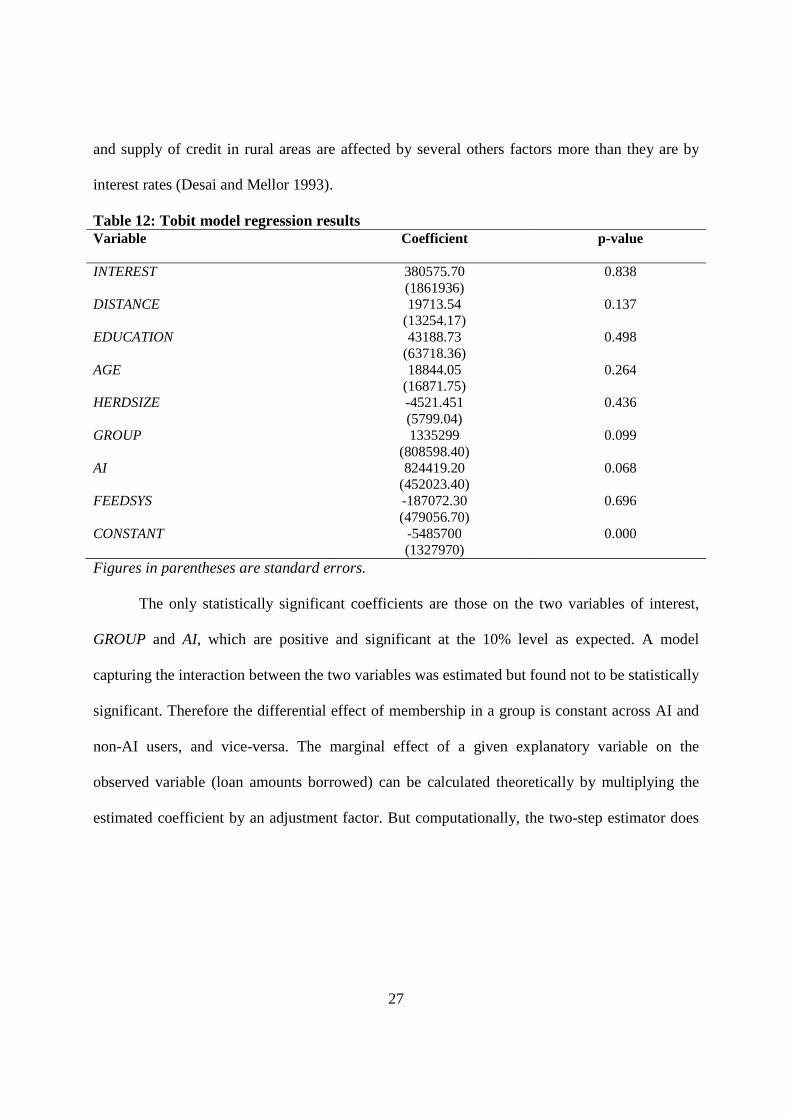
The tobit model regression results of the loan demand equation are shown in table 12. All
slope coefficients are jointly significant and they represent the marginal effects of the regressors
on the latent variable rather than on the loan amounts borrowed. Several variables were used in
both the reduced-form and structural equations, and those presented in table 12 produced the best
fit for the structural equation. From the Wald test of the exogeneity of interest rates, we cannot
reject the null hypothesis of no endogeneity. That interest rates are exogenous is plausible.
Interest rates were liberalized in the early 1990s, and nearly 60% of the indebted households in
the sample had acquired their loans from formal sources including private microfinance
institutions, whose rates are likely to be similar for all borrowers, unlike those of informal
lenders. Although interest rates are found to be exogenous, nonseparability of production and
consumption loans would still hold because of the subsistence nature of production, the
fungibility of credit, and the likelihood that savings rates among these households vary with
income and other factors. In addition, the effect of interest rate on demand for credit is
statistically insignificant. A similar result has been found by Atieno (1997) for Kenya and
Diagne (1999) for Malawi. If interest rates do not matter in the demand for loans, then, ideally,
the supply of credit should not be constrained since lenders would be able to set interest rates
high enough to generate profits. But it has been argued that in low-income countries, demand for
27
and supply of credit in rural areas are affected by several others factors more than they are by
interest rates (Desai and Mellor 1993).
Table 12: Tobit model regression results Variable Coefficient p-value
INTEREST 380575.70
(1861936) 0.838
DISTANCE 19713.54 (13254.17)
0.137
EDUCATION 43188.73 (63718.36)
0.498
AGE 18844.05 (16871.75)
0.264
HERDSIZE -4521.451 (5799.04)
0.436
GROUP 1335299 (808598.40)
0.099
AI 824419.20 (452023.40)
0.068
FEEDSYS -187072.30 (479056.70)
0.696
CONSTANT -5485700 (1327970)
0.000
Figures in parentheses are standard errors.
The only statistically significant coefficients are those on the two variables of interest,
GROUP and AI, which are positive and significant at the 10% level as expected. A model
capturing the interaction between the two variables was estimated but found not to be statistically
significant. Therefore the differential effect of membership in a group is constant across AI and
non-AI users, and vice-versa. The marginal effect of a given explanatory variable on the
observed variable (loan amounts borrowed) can be calculated theoretically by multiplying the
estimated coefficient by an adjustment factor. But computationally, the two-step estimator does
28
not specify the adjustment factor (Li 2008). Nonetheless, the effect on the observed variable
would be smaller than that on the latent variable5.
7. Summary and conclusion
This study has attempted to provide an understanding of the effect of technology adoption
and collective action on the demand for credit among dairy farmers in rural Tanzania. Using
cross-sectional data from four districts in Morogoro and Tanga regions, the incidence of
borrowing among cattle keepers is 7%, which is comparable to that obtained nationally for
livestock keepers. This result suggests that borrowing is a rare occurrence among dairy farmers,
and as such, we employ the rare events logit model to estimate the effects of the two variables of
interest on the probability to borrow.
We find that membership of a household in a group increases the probability of
borrowing but the effect of AI use is not statistically significant. However, both variables
significantly increase the amount of funds borrowed, as revealed by the tobit model. Therefore it
appears that unlike group membership, AI use does not increase access to credit. But just like
group membership, it unequivocally increases the amount of funds borrowed. We conclude that
collective action significantly increases both access to credit and amount of funds borrowed,
while technology adoption primarily increases the latter. It could be that households that adopt
new dairy farming technologies are those that already have access to credit.
Although the study has found collective action to significantly increase the demand for
credit, it raises the question as to why the concept of SACCOS, which is in fact characterized by
collective action and has been supported by the government in terms of policy, has not
5 As a case in point, the maximum likelihood estimator produces a marginal effect of 828,120.50 on the latent variable with respect to AI use, but 97,509.41 on the observed variable for households that borrowed and a much smaller value for all households.
29
considerably increased access to credit among livestock keepers in Tanzania. Our data shows
that only 16% of all households are members of SACCOS compared to 77% that belong to
livestock producer groups. We have established that interest rates do not constrain demand for
credit; therefore to answer this question requires an examination of the additional terms and
conditions related to membership in and borrowing from SACCOS in the context of their
suitability for livestock keepers.
Members of a rural SACCOS are in most cases members of a primary cooperative society
through which they sell their products. The SACCOS operates a group share account with a
commercial bank, and it is through this account that members receive payment for their product
from the cooperative. Using the SACCOS’ savings, an individual may be given a collateral-free
loan that is proportional to his/her savings with the SACCOS, and refunds are automatically
deducted from the cooperative’s payments to the borrower.
The linking of credit with both aggregate and individual savings presents a challenge to
the formation of SACCOS based on livestock production. Clearly, the success of a credit scheme
that is product-based or sector-dependent is attendant on the extent to which production is
market-oriented. According to Covarrubias, Nsiima and Zezza (2012), only 8% of total
agricultural output marketed are livestock products, and the share of livestock in total household
income is 13%. Given the small share of income, savings from livestock income are bound to be
relatively small and unattractive for mobilization towards formation of livestock SACCOS.
Nonetheless, collective action among smallholder dairy farmers has the potential to boost
demand for credit and therefore as the Tanzanian government supports the formation of dairy
farmer groups and cooperative societies, it ought to assess and support other forms of rural
finance initiatives such as those based on interlinked credit-product transactions that seek to

30
adequately lend to this category of farmers. Moreover, the government’s continued support for
technology adoption certainly makes the need for livestock-tailored credit services an imperative.

31
References Abdulai, A and W.E. Huffman. 2005. The Diffusion of New Agricultural Technologies: The
Case of Crossbred-Cow Technology in Tanzania. American Journal of Agricultural Economics 87(3): 645–659.
Ali, D.A., and K. Deininger. 2012. Causes and Implications of Credit Rationing in Rural Ethiopia: The Importance of Spatial Variation. Policy Research Working Paper 6096. Washington DC: World Bank.
Amani, H., L.A. Msambichaka, S. Hedlund and M. Lundahl. 1987. Agricultural Credit in Tanzania: A Peasant Perspective. Savings and Development 4(XI): 379–400.
Atieno, R. 1997. Determinants of Credit Demand by Smallholder Farmers in Kenya: An Empirical Analysis. Journal of Agriculture in the Tropics and Subtropics 98(1): 63–71.
Barham, J and C. Chitemi. 2009. Collective Action Initiatives to Improve Marketing Performance: Lessons from Farmer Groups in Tanzania. Food Policy 34: 53–59.
Bratton, M. 1986. Farmer Organizations and Food Production in Zimbabwe. World Development 14(3): 367–384.
Briones, R.M. 2009. Do Small Farmers Borrow Less when the Lending Rate Increases? Interest Rate Elasticity of Rice Farmers in the Philippines. Asian Economic Journal 23(4): 439–455.
Clar de Jesus, R.B and C.E. Cuevas. 1988. The Demand for Funds among Agricultural Households in the Philippines. Working Paper Series No. 88-21. Makati City: Philippine Institute for Development Studies
Covarrubias, K., L. Nsiima and A. Zezza. 2012. Livestock and Livelihoods in Rural Tanzania: A Descriptive Analysis of the 2009 National Panel Survey. World Bank, FAO, AU-IBAR, ILRI and Tanzania Ministry of Livestock and Fisheries http://documents.worldbank.org/curated/en/2012/06/19356801/livestock-livelihoods-rural-tanzania-descriptive-analysis-2009-national-panel-survey (accessed on November 8, 2014).
David, C.C and R.L. Meyer. 1979. A Review of Empirical Studies of Demand for Agricultural Loans. Columbus: Ohio State University.
De Wolf, J. 1995. Privatization and Livestock Owners Organization in Kagera. In Strategies for Market Orientation of Small Scale Milk Producers and their Organizations. (Eds) Kurwijila, L.R, J. Henriksen, A.O.O. Aboud and G.C. Kifaro. Proceedings of a Workshop held at Morogoro Hotel, Morogoro, Tanzania, March 20-24, 1995. FAO and Sokoine University of Agriculture
Dercon, S. 1998. Wealth, Risk and Activity Choice: Cattle in Western Tanzania. Journal of Development Economics 55: 1–42.
Desai, B.M and J.W. Mellor. 1993. Institutional Finance for Agricultural Development: An Analytical Survey of Critical Issues. Food Policy Review 1, Washington D.C: International Food Policy Research Institute
Diagne, A. 1999. Determinants of Household Access to and Participation in Formal and Informal Credit Markets in Malawi. FCND Discussion Paper No. 67. Washington D.C: International Food Policy Research Institute
Fatima, A. 2009. Socioeconomic Constraints to Demand for Borrowing among Rural Females of Pakistan. International Journal of Social Economics 36(11): 1050–1070.
32
Fischer, E and M. Qaim. 2012. Linking Smallholders to Markets: Determinants and Impacts of Farmer Collective Action in Kenya. World Development 40(6): 1255–1268.
Freeman, H.A., S.K. Ehui and M.A. Jabbar. 1998. Credit Constraints and Smallholder Dairy Production in the East African Highlands: Application of a Switching Regression Model. Agricultural Economics 19: 33–44.
Giné, X and D. Yang. 2009. Insurance, Credit, and Technology Adoption: Field Experimental Evidence from Malawi. Journal of Development Economics 89: 1–11.
Guirkinger, C. 2008. Understanding the Coexistence of Formal and Informal Credit Markets in Piura, Peru. World Development 36(8): 1436–1452.
Jabbar, M.A., S.K. Ehui and R. Von Kaufmann. 2002. Supply and Demand for Livestock Credit in Sub-Saharan Africa: Lessons for Designing New Credit Schemes. World Development 30(6): 1029–1042.
Iqbal, F. 1983. The Demands for Funds by Agricultural Households: Evidence from Rural India. Journal of Development Studies 20(1): 68–86.
Jia, X., C. Xiang and J. Huang. 2013. Microfinance, Self-Employment, and Entrepreneurs in Less Developed Areas of Rural China. China Economic Review 27: 94–103.
Kaliba, A.R.M., A.M. Featherstone and D.W. Norman. 1997. A Stall-Feeding Management for Improved Cattle in Semiarid Central Tanzania: Factors Influencing Adoption. Agricultural Economics 17: 133–146.
Khoi, P.D., C. Gan, G.V. Nartea and D.A. Cohen. 2013. Formal and Informal Rural Credit in the Mekong River Delta of Vietnam: Interaction and Accessibility. Journal of Asian Economics 26: 1–13.
Kimuyu, P.K. 1999. Rotating Savings and Credit Associations in Rural East Africa. World Development 27(7): 1299–1308.
King, G and L. Zeng. 2001a. Explaining Rare Events in International Relations. International Organization 55(3): 693–715.
King, G and L. Zeng. 2001b. Logistic Regression in Rare Events Data. Political Analysis 9(2): 137–163.
Kurwijila, L.R. 1995. Milk Marketing and Processing Options for Smallholder Dairy Cooperative Organizations: The Case of Serengeti and Mwakaleli Dairy Cooperatives in Tanzania. In Strategies for Market Orientation of Small Scale Milk Producers and their Organizations. (Eds) Kurwijila, L.R, J. Henriksen, A.O.O. Aboud and G.C. Kifaro. Proceedings of a Workshop held at Morogoro Hotel, Morogoro, Tanzania, March 20-24, 1995. FAO and Sokoine University of Agriculture
Land O’Lakes, Inc. 2007. Tanzania Dairy Enterprise Initiative. Final Report http://pdf.usaid.gov/pdf_docs/PDACI870.pdf (accessed January 20, 2015)
Li, L. 2008. Three Essays on China’s Economic Reform. PhD dissertation, University of Maryland
Maro, P.S. 1990. The Impact of Decentralization on Spatial Equity and Rural Development in Tanzania. World Development 18(5): 673–693.
Ministry of Livestock and Fisheries Development. 2011. Livestock Sector Development Programme. Dar es Salaam: United Republic of Tanzania
Mohamed, K. 2003. Access to Formal and Quasi-Formal Credit by Smallholder Farmers and Artisanal Fishermen: A Case of Zanzibar. Research Report No. 03.6. Zanzibar: Ministry of Agriculture, Natural Resources, Environment and Cooperation
Mpuga, P. 2008. Constraints in Access to and Demand for Rural Credit: Evidence from Uganda. Paper Presented at the African Economic Conference, November 12-14, 2008, Tunis
33
Njehu, A and A. Omore. 2014. Milk Production, Utilization and Marketing Channels in Tanga and Morogoro Regions of Tanzania. Brief 8. Nairobi: International Livestock Research Institute
Okten,C and U.O. Osili. 2004. Social Networks and Credit Access in Indonesia. World Development 32(7): 1225–1246.
Pal, D and A.K. Laha. 2015. Sectoral Credit Choice in Rural India. Journal of Choice Modelling 14: 1–16.
Rahji, M.A.Y and O.I.Y. Ajani. 2007. Demand for Loans under the Small and Medium Enterprises Equity Investment Scheme (SMEEIS) in Nigeria. Journal of Food, Agriculture and Environment 5(1): 378–381.
Rushalaza, V.G and J.S. Kasonta. 1992. Dual-Purpose Cattle in Central Tanzania. In Future of Livestock Industries in East and Southern Africa. (Eds) Kategile, J.A and S. Mubi. Addis Ababa: International Livestock Centre for Africa
Rweyemamu, D.C., M.P. Kimaro and O.M. Urassa. 2003. Assessing Micro-Finance Services in Agricultural Sector Development. A Case Study of Semi-formal Financial Institutions in Tanzania. Economic and Social Research Foundation 1–46.
Salami, A., A.B. Kamara and Z. Brixiova. 2010. Smallholder Agriculture in East Africa: Trends, Constraints and Opportunities, Working Papers Series N° 105. Tunis: African Development Bank
Shoji, M., K. Aoyagi, R. Kasahara, Y. Sawada and M. Ueyama. 2012. Social Capital Formation and Credit Access: Evidence from Sri Lanka. World Development 40(12): 2522–2536.
Stiglitz, J.E and A. Weiss. 1981. Credit Rationing in Markets with Imperfect Information. American Economic Review 71(3): 393–410.
Swain, R.B. 2007. The Demand and Supply of Credit for Households. Applied Economics 39(21): 2681–2692.
Swaminathan, H., R.S. Du Bois and J.L. Findeis. 2010. Impact of Access to Credit on Labor Allocation Patterns in Malawi. World Development 38(4): 555–566.
Trigeorgis, L. 1996. Real Options: Managerial Flexibility and Strategy in Resource Allocation. Cambridge, MA: MIT Press
United Republic of Tanzania. 2001. Rural Development Strategy. Main Report. Dar es Salaam: Prime Minister’s Office
United Republic of Tanzania. 2005. The Cooperative Reform and Modernization Program 2005 – 2015. Dodoma: Cooperative Development Department
Wangwe, S and M. Lwakatare. 2004. Innovation in Rural Finance in Tanzania. Paper Presented at the Third Annual Conference on Microfinace, Arusha, March 15-17, 2004.
Yuan, Y and L. Xu. 2015. Are Poor Able to Access the Informal Credit Market? Evidence from Rural Households in China. China Economic Review 33: 232–246.
Zylstra, L., C. Lyimo and I. Rutamu. 1995. Milk Production and Marketing in Tanga Region: Efficiency of Farmer Cooperatives versus Private Sector. In Strategies for Market Orientation of Small Scale Milk Producers and their Organizations. (Eds) Kurwijila, L.R, J. Henriksen, A.O.O. Aboud and G.C. Kifaro. Proceedings of a Workshop held at Morogoro Hotel, Morogoro, Tanzania, March 20-24, 1995. FAO and Sokoine University of Agriculture