Credit Suisse Financial Services Forum February 10, 2015 · Credit Suisse Financial Services Forum...
21
Citi | Investor Relations Credit Suisse Financial Services Forum February 10, 2015 Jane Fraser CEO, U.S. Consumer & Commercial Banking and CitiMortgage
Transcript of Credit Suisse Financial Services Forum February 10, 2015 · Credit Suisse Financial Services Forum...
Citi | Investor Relations
Credit Suisse
Financial Services Forum
February 10, 2015
Jane Fraser
CEO, U.S. Consumer & Commercial Banking and CitiMortgage
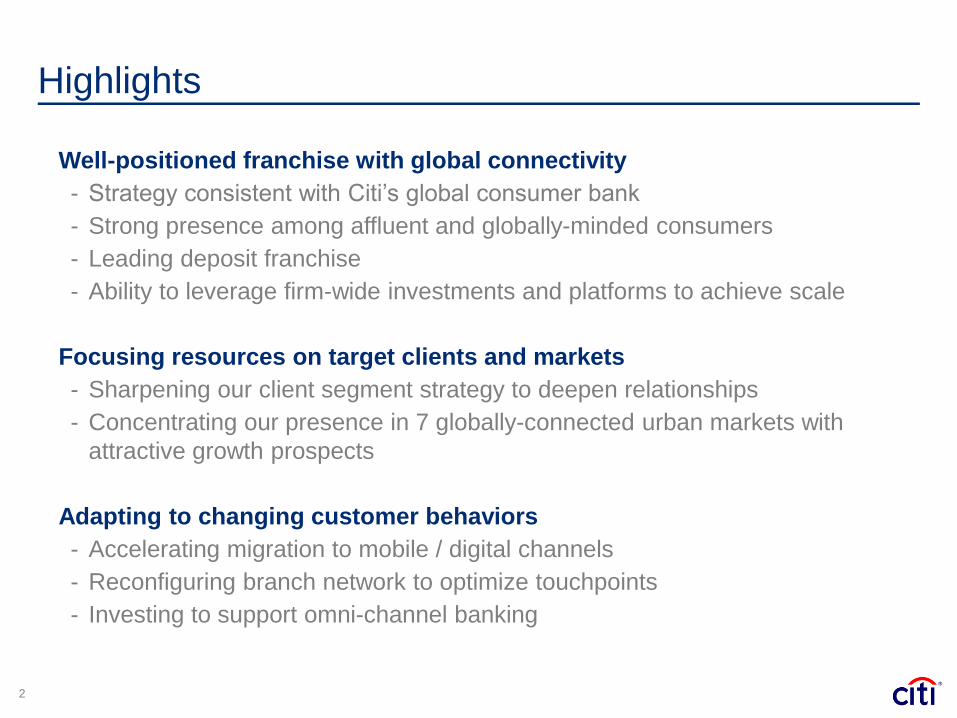
Highlights
2
Well-positioned franchise with global connectivity
- Strategy consistent with Citi’s global consumer bank
- Strong presence among affluent and globally-minded consumers
- Leading deposit franchise
- Ability to leverage firm-wide investments and platforms to achieve scale
Focusing resources on target clients and markets
- Sharpening our client segment strategy to deepen relationships
- Concentrating our presence in 7 globally-connected urban markets with
attractive growth prospects
Adapting to changing customer behaviors
- Accelerating migration to mobile / digital channels
- Reconfiguring branch network to optimize touchpoints
- Investing to support omni-channel banking
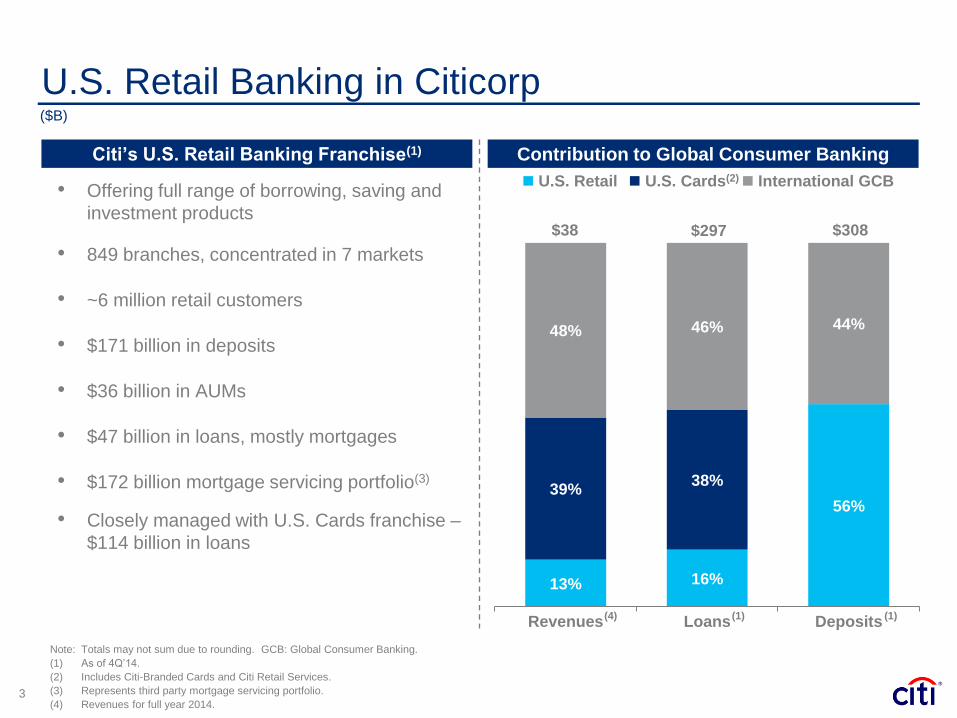
13% 16%
56% 39%
38%
48% 46% 44%
Revenues Loans Deposits
Contribution to Global Consumer Banking
($B)
3
U.S. Retail International GCB
Note: Totals may not sum due to rounding. GCB: Global Consumer Banking.
(1) As of 4Q’14.
(2) Includes Citi-Branded Cards and Citi Retail Services.
(3) Represents third party mortgage servicing portfolio.
(4) Revenues for full year 2014.
(1)
• Offering full range of borrowing, saving and
investment products
• 849 branches, concentrated in 7 markets
• ~6 million retail customers
• $171 billion in deposits
• $36 billion in AUMs
• $47 billion in loans, mostly mortgages
• $172 billion mortgage servicing portfolio(3)
• Closely managed with U.S. Cards franchise –
$114 billion in loans
Citi’s U.S. Retail Banking Franchise(1)
(1) (4)
U.S. Retail Banking in Citicorp
U.S. Cards(2)
$38 $297 $308
4
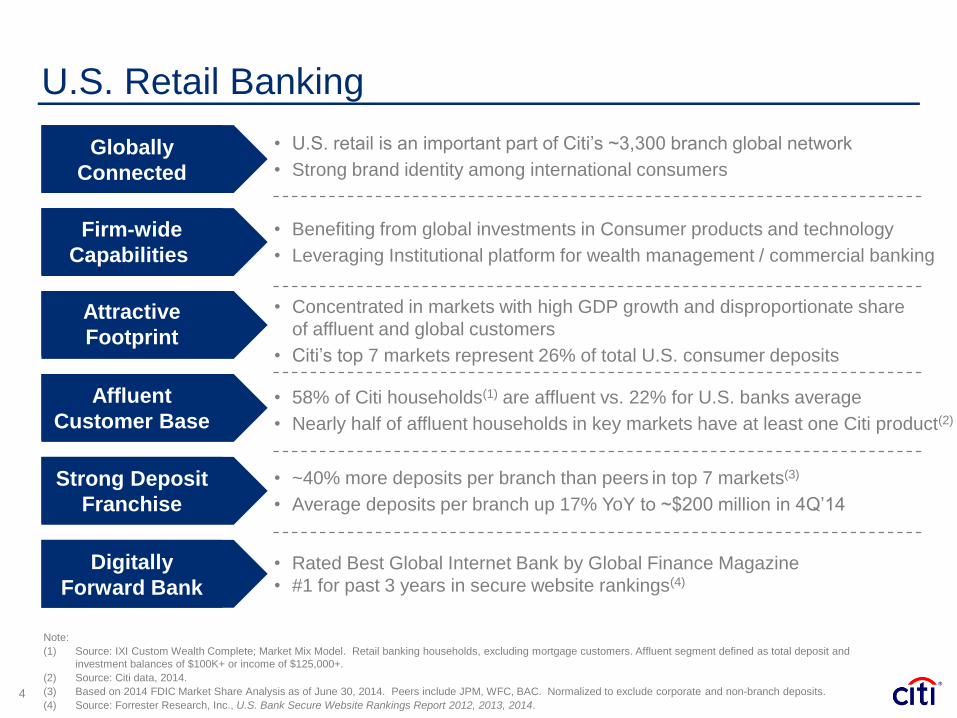
U.S. Retail Banking
Globally
Connected
Firm-wide
Capabilities
Attractive
Footprint
Affluent
Customer Base
Strong Deposit
Franchise
Digitally
Forward Bank
• U.S. retail is an important part of Citi’s ~3,300 branch global network
• Strong brand identity among international consumers
• Benefiting from global investments in Consumer products and technology
• Leveraging Institutional platform for wealth management / commercial banking
• Concentrated in markets with high GDP growth and disproportionate share
of affluent and global customers
• Citi’s top 7 markets represent 26% of total U.S. consumer deposits
• 58% of Citi households(1) are affluent vs. 22% for U.S. banks average
• Nearly half of affluent households in key markets have at least one Citi product(2)
• ~40% more deposits per branch than peers in top 7 markets(3)
• Average deposits per branch up 17% YoY to ~$200 million in 4Q’14
• Rated Best Global Internet Bank by Global Finance Magazine
• #1 for past 3 years in secure website rankings(4)
Note:
(1) Source: IXI Custom Wealth Complete; Market Mix Model. Retail banking households, excluding mortgage customers. Affluent segment defined as total deposit and
investment balances of $100K+ or income of $125,000+.
(2) Source: Citi data, 2014.
(3) Based on 2014 FDIC Market Share Analysis as of June 30, 2014. Peers include JPM, WFC, BAC. Normalized to exclude corporate and non-branch deposits.
(4) Source: Forrester Research, Inc., U.S. Bank Secure Website Rankings Report 2012, 2013, 2014.
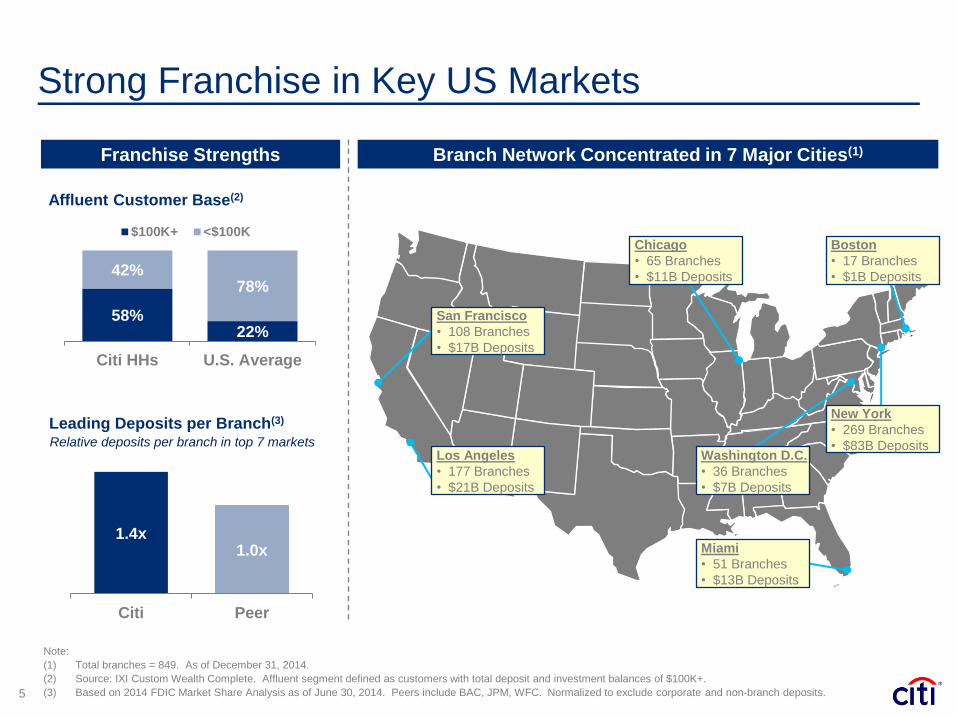
1.4x 1.0x
Citi Peer
Strong Franchise in Key US Markets
Branch Network Concentrated in 7 Major Cities(1)
5
San Francisco
• 108 Branches
• $17B Deposits
Los Angeles
• 177 Branches
• $21B Deposits
Miami
• 51 Branches
• $13B Deposits
Washington D.C.
• 36 Branches
• $7B Deposits
New York
• 269 Branches
• $83B Deposits
Boston
• 17 Branches
• $1B Deposits
Chicago
• 65 Branches
• $11B Deposits
Affluent Customer Base(2)
Leading Deposits per Branch(3)
Franchise Strengths
58% 22%
42% 78%
Citi HHs U.S. Average
$100K+ <$100K
Relative deposits per branch in top 7 markets
Note:
(1) Total branches = 849. As of December 31, 2014.
(2) Source: IXI Custom Wealth Complete. Affluent segment defined as customers with total deposit and investment balances of $100K+.
(3) Based on 2014 FDIC Market Share Analysis as of June 30, 2014. Peers include BAC, JPM, WFC. Normalized to exclude corporate and non-branch deposits.
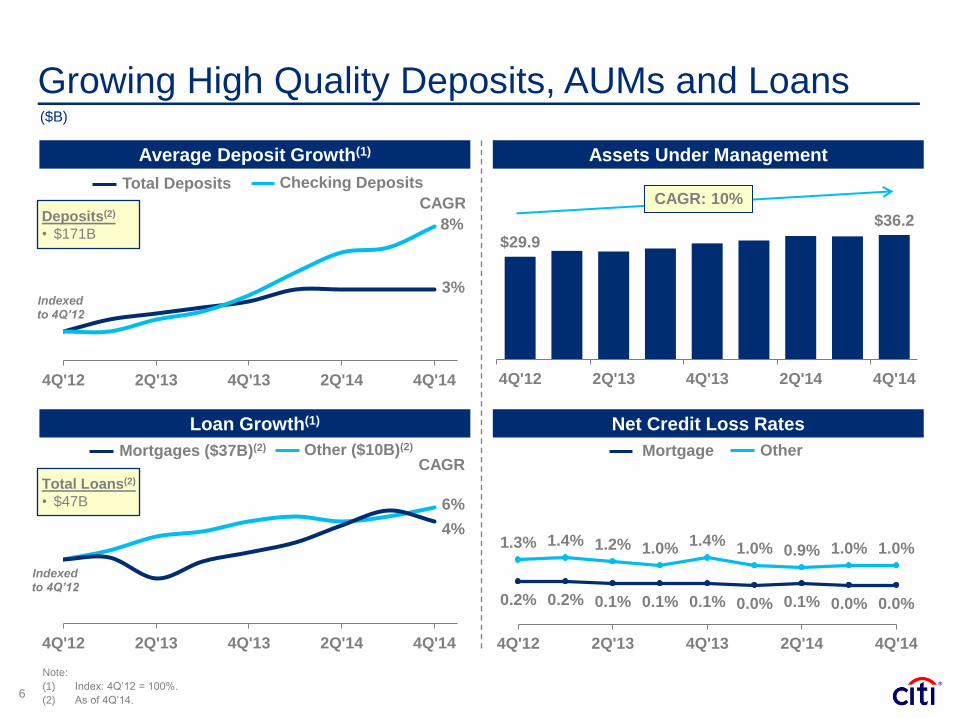
1.3% 1.4% 1.2% 1.0% 1.4%
1.0% 0.9% 1.0% 1.0%
0.2% 0.2% 0.1% 0.1% 0.1% 0.0% 0.1% 0.0% 0.0%
4Q'12 2Q'13 4Q'13 2Q'14 4Q'14
6%
Indexed to 4Q’12
4%
4Q'12 2Q'13 4Q'13 2Q'14 4Q'14
Growing High Quality Deposits, AUMs and Loans
6
Note:
(1) Index: 4Q’12 = 100%.
(2) As of 4Q’14.
($B)
Loan Growth(1)
Average Deposit Growth(1)
3% Indexed to 4Q’12
8%
4Q'12 2Q'13 4Q'13 2Q'14 4Q'14
Total Deposits Checking Deposits
Total Loans(2)
• $47B
CAGR
Deposits(2)
• $171B
Assets Under Management
Other Mortgage
Net Credit Loss Rates
$29.9
$36.2
4Q'12 2Q'13 4Q'13 2Q'14 4Q'14
CAGR: 10% CAGR
Mortgages ($37B)(2) Other ($10B)(2)
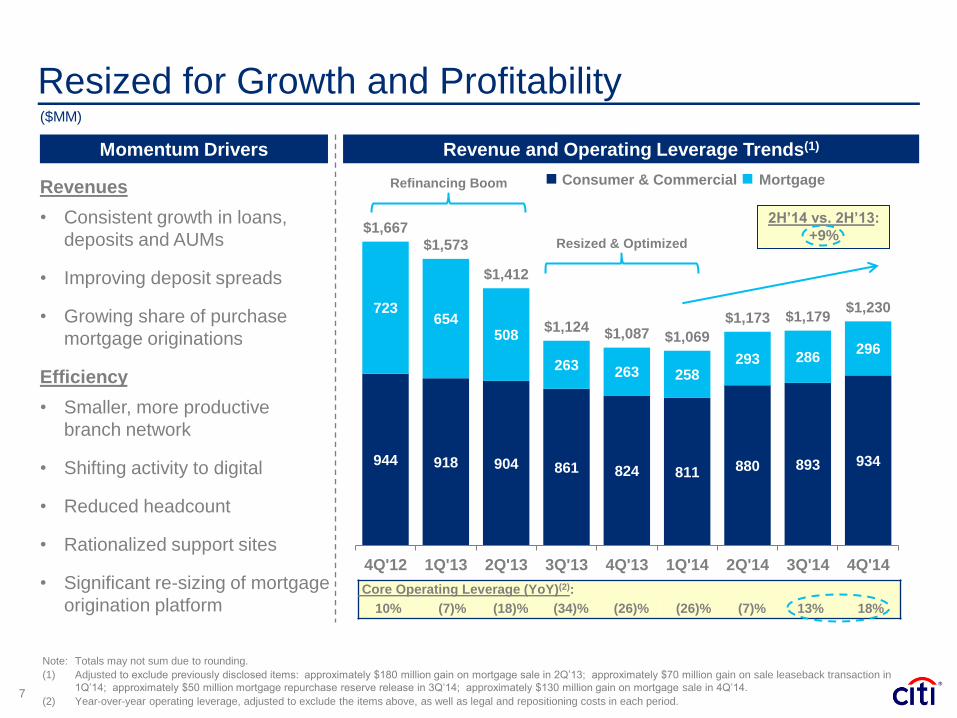
Revenues
• Consistent growth in loans,
deposits and AUMs
• Improving deposit spreads
• Growing share of purchase
mortgage originations
Efficiency
• Smaller, more productive
branch network
• Shifting activity to digital
• Reduced headcount
• Rationalized support sites
• Significant re-sizing of mortgage
origination platform
Resized for Growth and Profitability
7
Momentum Drivers Revenue and Operating Leverage Trends(1)
2H’14 vs. 2H’13:
+9%
Core Operating Leverage (YoY)(2):
10% (7)% (18)% (34)% (26)% (26)% (7)% 13% 18%
Refinancing Boom
Resized & Optimized
Note: Totals may not sum due to rounding.
(1) Adjusted to exclude previously disclosed items: approximately $180 million gain on mortgage sale in 2Q’13; approximately $70 million gain on sale leaseback transaction in
1Q’14; approximately $50 million mortgage repurchase reserve release in 3Q’14; approximately $130 million gain on mortgage sale in 4Q’14.
(2) Year-over-year operating leverage, adjusted to exclude the items above, as well as legal and repositioning costs in each period.
944 918 904 861 824 811 880 893 934
723 654
508
263 263 258 293 286
296
$1,667 $1,573
$1,412
$1,124 $1,087 $1,069
$1,173 $1,179 $1,230
4Q'12 1Q'13 2Q'13 3Q'13 4Q'13 1Q'14 2Q'14 3Q'14 4Q'14
Consumer & Commercial Mortgage
($MM)
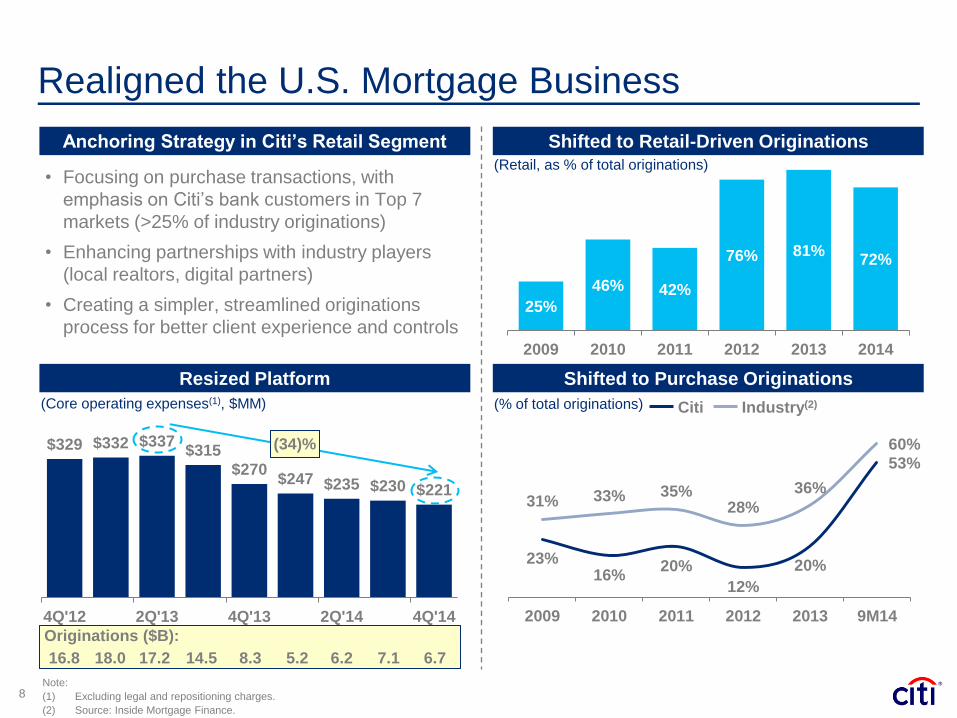
$329 $332 $337 $315
$270 $247 $235 $230 $221
4Q'12 2Q'13 4Q'13 2Q'14 4Q'14
Realigned the U.S. Mortgage Business
8 Note:
(1) Excluding legal and repositioning charges.
(2) Source: Inside Mortgage Finance.
25%
46% 42%
76% 81% 72%
2009 2010 2011 2012 2013 2014
(Retail, as % of total originations) • Focusing on purchase transactions, with
emphasis on Citi’s bank customers in Top 7
markets (>25% of industry originations)
• Enhancing partnerships with industry players
(local realtors, digital partners)
• Creating a simpler, streamlined originations
process for better client experience and controls
(34)%
Anchoring Strategy in Citi’s Retail Segment
Resized Platform Shifted to Purchase Originations
Shifted to Retail-Driven Originations
23% 16%
20%
12%
20%
53%
31% 33% 35% 28%
36%
60%
2009 2010 2011 2012 2013 9M14
(% of total originations) Citi Industry(2)
Originations ($B):
16.8 18.0 17.2 14.5 8.3 5.2 6.2 7.1 6.7
(Core operating expenses(1), $MM)

Executing in a Dynamic Environment
Regulatory Changes
Low Interest Rates
Changing Customer
Behaviors
Drive to Digital
Disintermediation
Environment Industry Response
• Increasing competition for
affluent / emerging affluent
customer segment
• Reducing number and size
of physical branches
• Driving basic transactions to
lower cost channels
• Redesigning sales models in
branch and online for more
specialized services
• Driving towards seamless,
omni-channel banking
experience
Citi’s Advantages
• Rationalized branch
footprint concentrated in
major cities
• Strong existing base of
affluent households
• Leading deposit franchise
• Ability to leverage global
investments in digital /
mobile platforms
• Next generation global
operating platform will
support omni-channel
banking
9

Adapting to Changing
Customer Behaviors
Execution Priorities
10
Sharpening Our Customer
Segment Strategy
Concentrating Our Resources
in Key Markets
• Differentiate value propositions and service models for each segment
• Deepen customer relationships
Delivering an Omni-Channel
Banking Experience
• Establish ecosystem of physical locations, digital platforms, service centers and targeted marketing
• Drive digital adoption
• Optimize branch size and staffing model
• Adapt branches to multi-format, hub-and-spoke model
• Focus on major cities, consistent with global strategy
• Allocate resources to markets with the best growth prospects for Citi
• Deliver seamless, omni-channel banking to enhance customer experience and improve efficiency
• Use technology to facilitate transformation
Adapting to our customers’ changing needs and behaviors
1
3
2
4
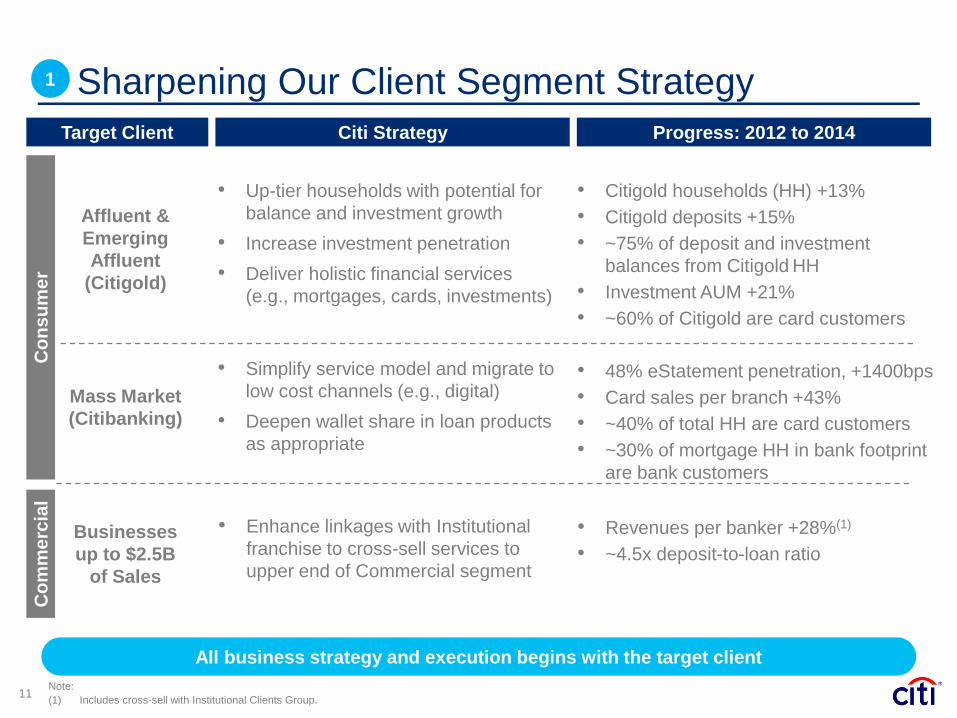
Sharpening Our Client Segment Strategy
11
All business strategy and execution begins with the target client
Co
ns
um
er
Co
mm
erc
ial
Progress: 2012 to 2014
• Up-tier households with potential for
balance and investment growth
• Increase investment penetration
• Deliver holistic financial services
(e.g., mortgages, cards, investments)
• Simplify service model and migrate to
low cost channels (e.g., digital)
• Deepen wallet share in loan products
as appropriate
Affluent &
Emerging
Affluent
(Citigold)
Mass Market
(Citibanking)
Target Client Citi Strategy
Businesses
up to $2.5B
of Sales
1
• Citigold households (HH) +13%
• Citigold deposits +15%
• ~75% of deposit and investment
balances from Citigold HH
• Investment AUM +21%
• ~60% of Citigold are card customers
• 48% eStatement penetration, +1400bps
• Card sales per branch +43%
• ~40% of total HH are card customers
• ~30% of mortgage HH in bank footprint
are bank customers
• Enhance linkages with Institutional
franchise to cross-sell services to
upper end of Commercial segment
• Revenues per banker +28%(1)
• ~4.5x deposit-to-loan ratio
Note:
(1) Includes cross-sell with Institutional Clients Group.
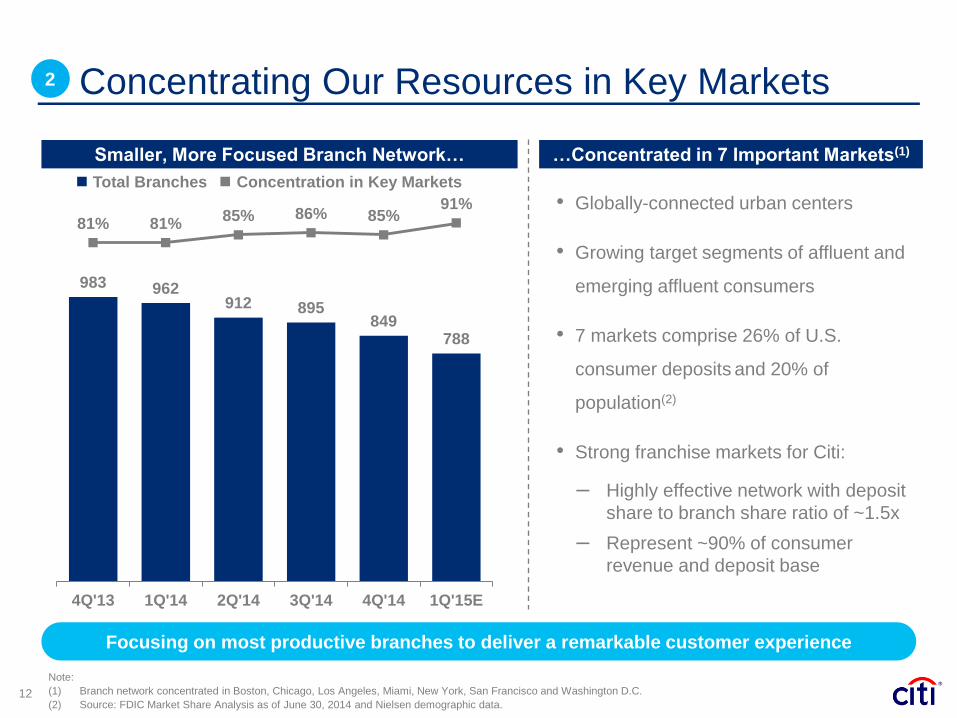
983 962 912 895
849 788
81% 81% 85% 86% 85%
91%
4Q'13 1Q'14 2Q'14 3Q'14 4Q'14 1Q'15E
Concentrating Our Resources in Key Markets
12
Focusing on most productive branches to deliver a remarkable customer experience
Note:
(1) Branch network concentrated in Boston, Chicago, Los Angeles, Miami, New York, San Francisco and Washington D.C.
(2) Source: FDIC Market Share Analysis as of June 30, 2014 and Nielsen demographic data.
…Concentrated in 7 Important Markets(1) Smaller, More Focused Branch Network…
• Globally-connected urban centers
• Growing target segments of affluent and
emerging affluent consumers
• 7 markets comprise 26% of U.S.
consumer deposits and 20% of
population(2)
• Strong franchise markets for Citi:
‒ Highly effective network with deposit
share to branch share ratio of ~1.5x
‒ Represent ~90% of consumer
revenue and deposit base
Total Branches Concentration in Key Markets
2
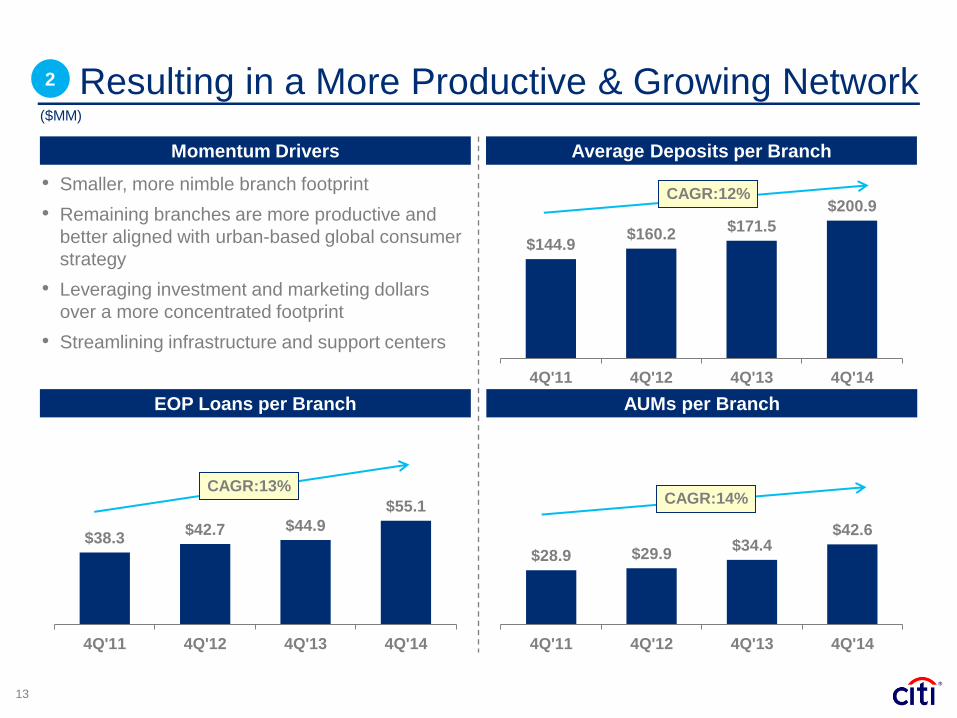
$28.9 $29.9 $34.4
$42.6
4Q'11 4Q'12 4Q'13 4Q'14
$38.3 $42.7 $44.9
$55.1
4Q'11 4Q'12 4Q'13 4Q'14
$144.9 $160.2
$171.5
$200.9
4Q'11 4Q'12 4Q'13 4Q'14
Resulting in a More Productive & Growing Network
13
Momentum Drivers
($MM)
Average Deposits per Branch
EOP Loans per Branch
• Smaller, more nimble branch footprint
• Remaining branches are more productive and
better aligned with urban-based global consumer
strategy
• Leveraging investment and marketing dollars
over a more concentrated footprint
• Streamlining infrastructure and support centers
CAGR:12%
AUMs per Branch
CAGR:14% CAGR:13%
2
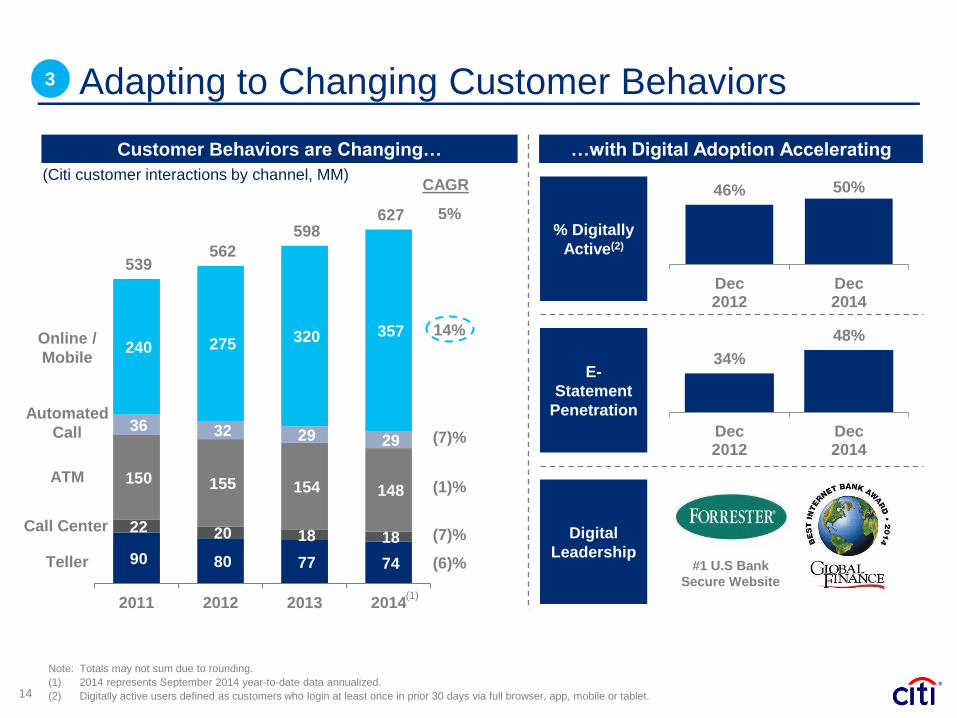
Adapting to Changing Customer Behaviors
14
90 80 77 74
22 20 18 18
150 155 154 148
36 32 29 29
240 275 320 357
539 562
598 627
2011 2012 2013 2014
(7)%
14%
(1)%
(7)%
5%
(6)%
(Citi customer interactions by channel, MM)
Teller
Call Center
ATM
Online /
Mobile
Automated
Call
3
CAGR
Note: Totals may not sum due to rounding.
(1) 2014 represents September 2014 year-to-date data annualized.
(2) Digitally active users defined as customers who login at least once in prior 30 days via full browser, app, mobile or tablet.
E-
Statement
Penetration
34%
48%
Dec2012
Dec2014
Digital
Leadership
% Digitally
Active(2)
46% 50%
Dec2012
Dec2014
…with Digital Adoption Accelerating Customer Behaviors are Changing…
#1 U.S Bank
Secure Website (1)
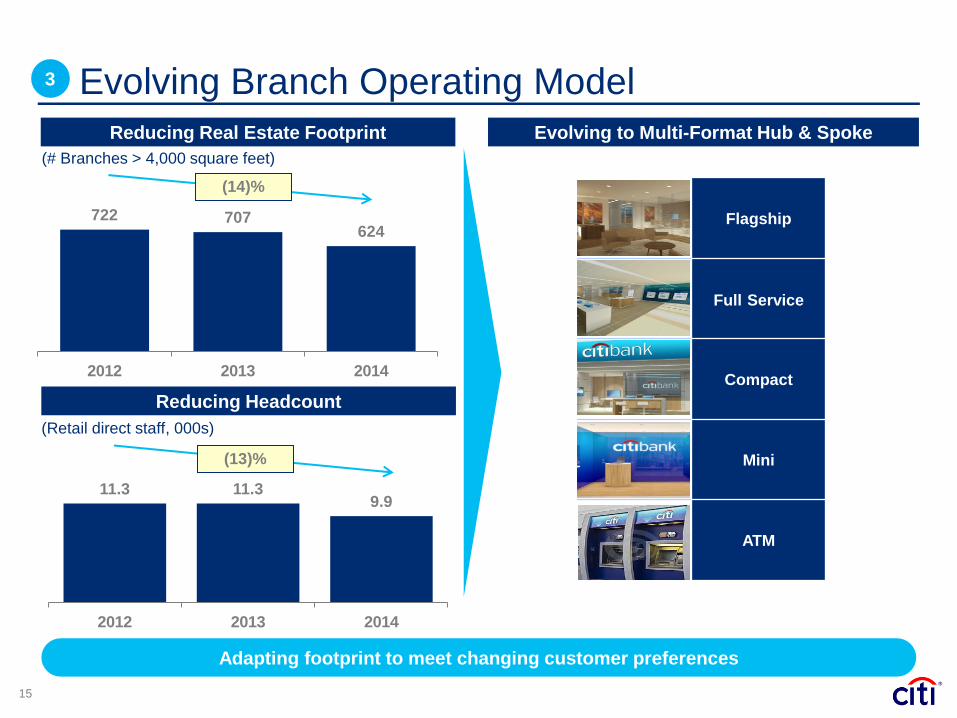
722 707 624
2012 2013 2014
Evolving Branch Operating Model
15
Adapting footprint to meet changing customer preferences
3
(14)%
Reducing Real Estate Footprint
Reducing Headcount
11.3 11.3 9.9
2012 2013 2014
(13)%
Flagship
Full Service
Compact
Mini
ATM
Evolving to Multi-Format Hub & Spoke
(# Branches > 4,000 square feet)
(Retail direct staff, 000s)
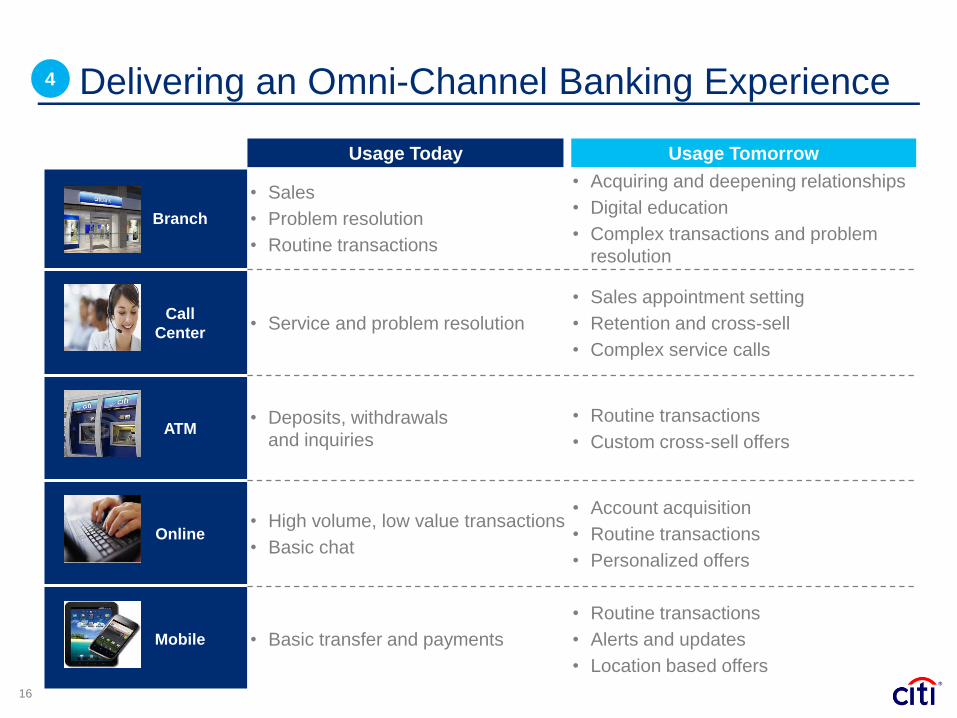
Delivering an Omni-Channel Banking Experience
16
Branch
• Sales
• Problem resolution
• Routine transactions
• Acquiring and deepening relationships
• Digital education
• Complex transactions and problem
resolution
Call
Center • Service and problem resolution
• Sales appointment setting
• Retention and cross-sell
• Complex service calls
ATM • Deposits, withdrawals
and inquiries
• Routine transactions
• Custom cross-sell offers
Online • High volume, low value transactions
• Basic chat
• Account acquisition
• Routine transactions
• Personalized offers
Mobile • Basic transfer and payments
• Routine transactions
• Alerts and updates
• Location based offers
4
Usage Today Usage Tomorrow
17
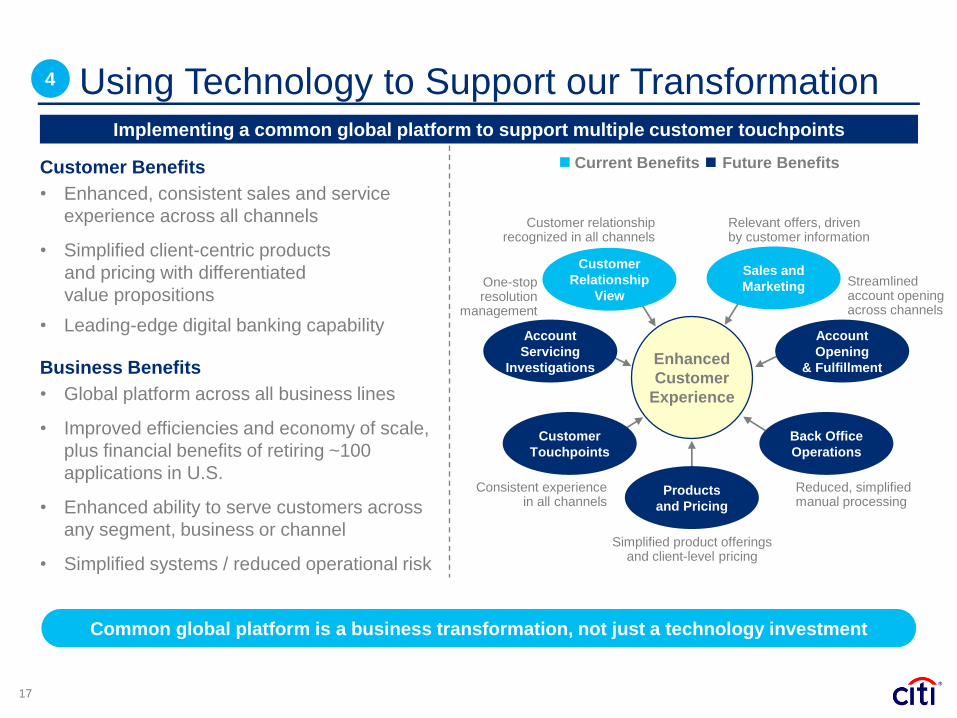
Common global platform is a business transformation, not just a technology investment
Customer Benefits
• Enhanced, consistent sales and service
experience across all channels
• Simplified client-centric products
and pricing with differentiated
value propositions
• Leading-edge digital banking capability
Business Benefits
• Global platform across all business lines
• Improved efficiencies and economy of scale,
plus financial benefits of retiring ~100
applications in U.S.
• Enhanced ability to serve customers across
any segment, business or channel
• Simplified systems / reduced operational risk
Using Technology to Support our Transformation Implementing a common global platform to support multiple customer touchpoints
Enhanced
Customer
Experience
Sales and
Marketing
Account
Opening
& Fulfillment
Products
and Pricing
Customer
Touchpoints
Account
Servicing
Investigations
Customer
Relationship
View Streamlined account opening across channels
Consistent experience in all channels
Relevant offers, driven by customer information
Customer relationship recognized in all channels
Simplified product offerings and client-level pricing
One-stop resolution
management
Reduced, simplified manual processing
Back Office
Operations
Current Benefits Future Benefits
4
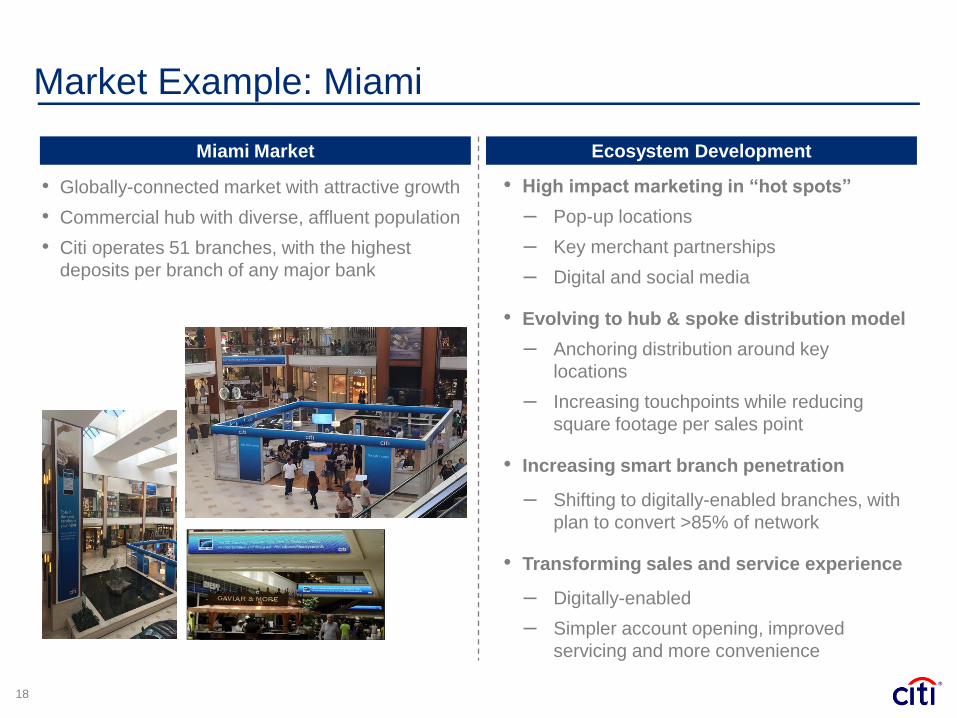
Market Example: Miami
18
Miami Market Ecosystem Development
• Globally-connected market with attractive growth
• Commercial hub with diverse, affluent population
• Citi operates 51 branches, with the highest
deposits per branch of any major bank
• High impact marketing in “hot spots”
‒ Pop-up locations
‒ Key merchant partnerships
‒ Digital and social media
• Evolving to hub & spoke distribution model
‒ Anchoring distribution around key
locations
‒ Increasing touchpoints while reducing
square footage per sales point
• Increasing smart branch penetration
‒ Shifting to digitally-enabled branches, with
plan to convert >85% of network
• Transforming sales and service experience
‒ Digitally-enabled
‒ Simpler account opening, improved
servicing and more convenience
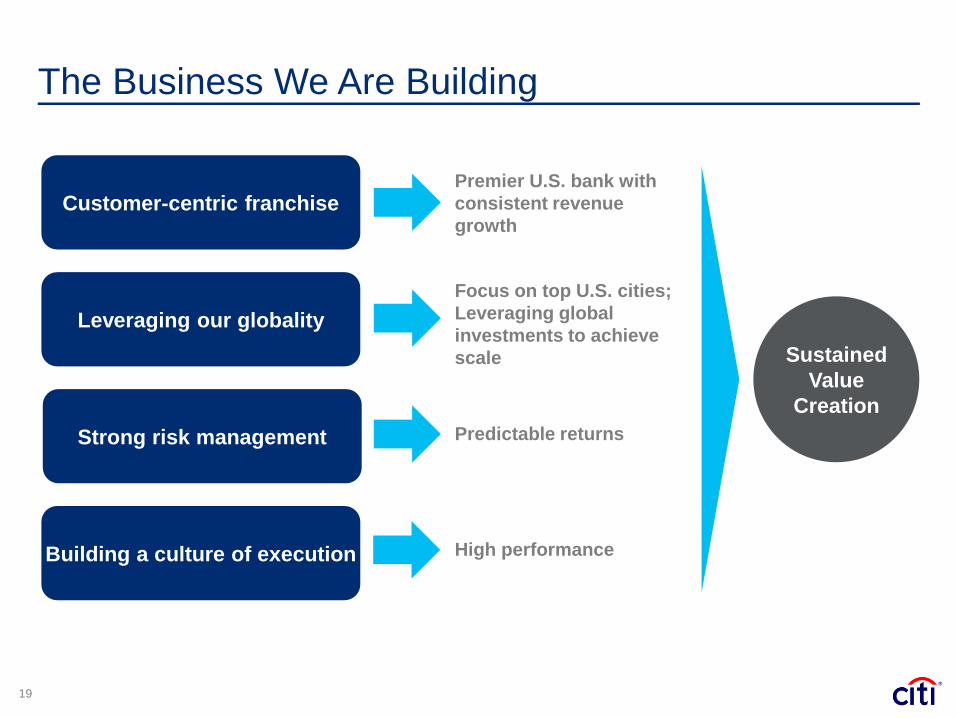
19
The Business We Are Building
Customer-centric franchise
Leveraging our globality
Strong risk management
Building a culture of execution
Premier U.S. bank with
consistent revenue
growth
Focus on top U.S. cities;
Leveraging global
investments to achieve
scale
Predictable returns
High performance
Sustained
Value
Creation
Certain statements in this document are “forward-looking statements”
within the meaning of the U.S. Private Securities Litigation Reform Act of
1995. These statements are based on management’s current
expectations and are subject to uncertainty and changes in circumstances.
These statements are not guarantees of future results or occurrences.
Actual results and capital and other financial condition may differ materially
from those included in these statements due to a variety of factors,
including the precautionary statements included in this document and
those contained in Citigroup’s filings with the U.S. Securities and
Exchange Commission, including without limitation the “Risk Factors”
section of Citigroup’s 2013 Form 10-K. Any forward-looking statements
made by or on behalf of Citigroup speak only as to the date they are made,
and Citi does not undertake to update forward-looking statements to reflect
the impact of circumstances or events that arise after the date the forward-
looking statements were made.
20