CREDIT APPRAISAL & RISK ASSESSMENT MODEL FOR MSME’s
104
A PROJECT REPORT ON “CREDIT APPRAISAL & RISK ASSESSMENT MODEL FOR MSME’s ” At SMALL INDUSTRIES DEVELOPMENT BANK OF INDIA (Submitted in partial fulfillment of requirement for the PGDM Course 2012-14) Under the guidance of: Prof. Neeti Shikha Internal Faculty guide And Mrs Ranjana Bhattacharjee AGM, GSC Department, SIDBI SUBMITTED BY: ANKITA AGARWAL ROLL NO.: 211020 PGDM 2012-14 i
-
Upload
arup-sarkar -
Category
Documents
-
view
128 -
download
2
description
Credit appraisal and risk assessmant at SIDBI
Transcript of CREDIT APPRAISAL & RISK ASSESSMENT MODEL FOR MSME’s

A PROJECT REPORT
ON
“CREDIT APPRAISAL & RISK ASSESSMENT MODEL FOR MSME’s”
At
SMALL INDUSTRIES DEVELOPMENT BANK OF INDIA
(Submitted in partial fulfillment of requirement for the PGDM Course 2012-14)
Under the guidance of:
Prof. Neeti Shikha
Internal Faculty guide
And
Mrs Ranjana Bhattacharjee
AGM, GSC Department, SIDBI
SUBMITTED BY:
ANKITA AGARWAL
ROLL NO.: 211020
PGDM 2012-14
FORE SCHOOL OF MANAGEMENT
B-18, QUTUB INSTITUTIONAL AREA, NEW DELHI
i

CERTIFICATE
This is to certify that Ms. Ankita Agarwal, Roll No. 211020, has completed her summer
internship at Small Industries Development Bank Of India(SIDBI) , and has submitted
this project report entitled (Credit Appraisal and Risk Assessment Model for
MSME’s) towards part fulfillment of the requirements for the award of the Post Graduate
Diploma in Management (FMG-21) 2012-2014.
This Report is the result of her own work and to the best of my knowledge no part of it
has earlier comprised any other report, monograph, dissertation or book. This project
was carried out under my overall supervision.
Date:
Place:
————————————- Company Project Guide
ii

CERTIFICATE
This is to certify that Ms. Ankita Agarwal, Roll No. 211020, has completed her summer
internship at Small Industries Development Bank Of India(SIDBI) , and has submitted
this project report entitled (Credit Appraisal and Risk Assessment Model for
MSME’s) towards part fulfillment of the requirements for the award of the Post Graduate
Diploma in Management (FMG-21) 2012-2014.
This Report is the result of her own work and to the best of my knowledge no part of it
has earlier comprised any other report, monograph, dissertation or book. This project
was carried out under my overall supervision.
Date:
Place:
————————————- Internal Faculty Guide
iii
ACKNOWLEDGEMENT
Behind every fruitful endeavour lies the advice, guidance and inspiration of all the
people directly or indirectly involved with the report. I wish to express my gratitude to all
the people involved in the completion of this report. I am thankful to all of them for their
help and encouragement throughout the completion of the report. They have been a
constant source of support for me.
I would like to extend my sincere gratitude to the management of SIDBI for providing me
the enriching opportunity of working with the organization and its team for a period of 2
months. In particular, I would like to thank my Company Guide, Mrs. Ranjana
Bhattacharjee for sparing the time to provide me with necessary guidance and advice
from time to time, with utmost patience, in spite of their extremely busy schedule. I
would also like to express my sincere gratitude to Mr. Kaushlendra Kumar and Mr.
Mukesh Jaiswal of the Central Loan Processing Cell (CLPC) Department for providing
me with valuable inputs.
My heartfelt gratitude and warm salutations are also due to Prof .Neeti Shikha, the
faculty of our Institute, for inculcating in me the principles of dedication and hard work,
and proving her guidance and support throughout the Project.
Their constructive criticism of the approach to the problem and the result obtained
during the course of this work has helped me to a great extent in bringing work to its
present shape.
ANKITA AGARWAL
iv

EXECUTIVE SUMMARY
The project titled ‘Credit Appraisal and Risk Assessment Model for MSME’s’ is
concerned with the analysis of the various aspects of project financing and the
importance of rating the various MSME’s which forms the basis for assessing the risk
and charging rate of interest on the loan proposal.
Since micro, small and medium enterprises are important drivers for the economy of the
country therefore it is important for nodal agencies like SIDBI to assist them with the
credit requirement at a cost effective and timely manner. So the aim of the study is to
study thoroughly the various aspects(technical, economic, financial and commercial
aspects) of credit appraisal and to study the various norms which are followed by SIDBI
towards disbursement of loans. Moreover SIDBI assists the MSME’s with various
subsidy schemes which cover various sectors like textile, leather, food etc where
technology upgradation is important for the growth of the sector. So an attempt has
been made to study the various subsidy schemes provided by SIDBI.
The most common teething problem faced by MSMEs is getting access to credit. One of
the best ways to ensure credit worthiness, as recommended by many organizations, is
to go for credit rating by a third party. This report also tries to delve deeper into the
rating model used by SIDBI to rate various proposals. Moreover an in depth comparison
has been made on the parameters used by the model for the manufacturing and service
sector. This has been done to see the effectiveness of the risk assessment model used
by the company.
v

TABLE OF CONTENTS
ACKNOWLEDGEMENT……………………………………………………………………….iv
EXECUTIVE SUMMARY…………………………………………………………………………………………………………………v
1.INTRODUCTION 1
1.1 INDUSTRY OVERVIEW 1
1.2 COMPANY PROFILE 4
1.3 RELEVANCE OF THE STUDY…………………………………………………………………………………………………………..11
1.4 OBJECTIVES OF THE PROJECT……………………………………………………………………………………………………….12
2.LITERATURE REVIEW 13
2.1 SCOPE OF THE STUDY…………………………………………………………………………………………………………………..13
2.2 INTRODUCTION TO PROJECT FINANCING 16
2.3 PROCEDURAL ASPECTS OF PROJECT FINANCING IN BANKS………………………………………………………….16
3.METHODOLOGY 19
3.1 UNIVERSE OF THE STUDY 19
3.2 LOCALE OF THE STUDY 19
3.3 SAMPLE SELECTION…………………………………………………………..………………………………………………………..19
3.4 DATA COLLECTION 19
3.5 ANALYSIS OF DATA 20
3.6 FIELD EXPERIENCE…………………………………………………………..………………………………………………………….20
4.TERM LOAN AND WORKING CAPITAL CASE STUDIES AT SIDBI………………………………………………………..21
4.1 CASE 1-TERM LOAN 21
4.1.1 TECHNICAL APPRAISAL 21
4.1.2 COMMERCIAL APPRAISAL………………………………………………………………………………………………..22
4.1.3 FINANCIAL APPRAISAL 22
4.1.4 MANAGEMENT APPRAISAL 31
4.1.5 COMPLIANCE ANALYSIS FOR SUBSIDY ASSISSTANCE…………………………………………………………31
4.2 CASE 2-WORKING CAPITAL LOAN………………………………………………………………………………………………37
5.RISK ASSESSMENT AT SIDBI……………………………………………………………………………………………………………39
vi

5.1 IMPORTANCE OF CREDIT RATING FOR MSME’s 39
5.2 SCOPE OF CREDIT RATING 39
5.3 RATING REPORT FOR ‘ABC’ COMPANY…………………………………………………………..………………………….41
5.4 COMPARISON OF RAM MODEL OF MANUFACTURING AND SERVICE INDUSTRY 49
6. CONCLUSION AND SUGGESTIONS 56
ANNEXURE………………………………………………………………………………………………………………………………………………i
BIBLIOGRAPHY……………………………………………………………………………………………………………………………………..xii
vii

LIST OF TABLES
Table 1: Past Financial Performance of ‘ABC’ company................................................23
Table 2: Desirable Norms and parameters for eligibility of assistance...........................25
Table 3: Breakeven point................................................................................................27
Table 4: Discounted Cash Flow Techniques..................................................................27
Table 5: Sensitivity Analysis...........................................................................................28
Table 6: Projected Profitability........................................................................................30
Table 7: Eligibility under JICA scheme...........................................................................31
Table 8: Financial Parameters for JICA scheme............................................................33
Table 9: Eligibility under CLCSS Subsidy.......................................................................35
Table 10: Nayak Committee Method..............................................................................37
Table 11: Second Method Of Lending............................................................................38
Table 12: Ratings and their significance.........................................................................40
Table 13: Rating Summary Table...................................................................................41
Table 14: Obligor Rating Table.......................................................................................42
viii

LIST OF FIGURES
Figure 1: Number of enterprises in the MSME sector......................................................1
Figure 2: Employment in MSME sector............................................................................2
Figure 3: Growth comparison : MSME vs IIP & GDP%....................................................3
Figure 4: Structure of Indian Banking...............................................................................4
Figure 5: Categorization of micro, small and medium enterprises...................................6
Figure 6: Trend in the growth of MSEs and employment generated..............................13
Figure 7: Graphical representation of BEP.....................................................................27
Figure 8: Graphical representation of ROCE,IRR and CoC...........................................28
ix

CHAPTER-1
INTRODUCTION
1.1 INDUSTRY OVERVIEW
The Micro, Small and Medium Enterprises (MSMEs) play a key role in the economic and social development of the country. They also play a major role in the development of the economy with their effective, efficient and flexible entrepreneurial spirit. The MSME sector contributes to the country’s manufacturing output, exports and employment and is credited with generating the highest employment growth.
The MSME sector in India is highly heterogeneous in terms of the size of the enterprises, variety of products and services, and levels of technology. The sector not only plays a critical role in providing employment opportunities at comparatively lower capital cost than large industries but also helps in industrialization of rural and backward areas, reducing regional imbalances and assuring more equitable distribution of national income and wealth. MSMEs complement large industries as ancillary units and contribute enormously to the socioeconomic development of the country. The continuous increase in the MSME industries and the employment in the sector shows the importance and credibility of this sector.
Fig 1. Number of Enterprises in the MSME sector(Source: Annual report 2012-13,www.msme.gov.in)
Fig 2. Employment in MSME sector(Source: Annual report 2012-13-www.msme.gov.in)
x

Key highlights of the MSME Sector:
• MSMEs account for about 45% of India’s manufacturing output.
• MSMEs account for about 40% of India’s total exports.
• The sector is projected to employ about 73 mn people in more than 31 mn units spread across the country.
• MSMEs manufacture more than 6,000 products ranging from traditional to high tech items.
• For FY11, total production coming from the MSME sector was projected at Rs 10,957.6 bn, an increase of more than 11% over the previous year.
MSMEs have outperformed IIP and GDP growth rates in the past five years. The total production of MSMEs for FY11 was Rs 10,957.6 bn (at 2001-02 prices). Between FY07 and FY11, the sector’s total production grew at a CAGR of 11.5% - a clear indication of the substantial contribution of MSMEs to the Indian economy. During FY12, total production of MSMEs was projected to grow at 11.48%, compared to industrial and GDP growth of 8.2% and 8.4% respectively.
Fig 3. Growth Comparison: MSME vs IIP & GDP(%)
xi

A dynamic global economic scenario has thrown up various opportunities and challenges to the MSME sector in India. On the one hand, numerous opportunities have opened up for this sector to enhance productivity and look at new national and international markets. On the other hand, these opportunities compel the MSMEs to upgrade their competencies to contend with competition since obsolescence is rapid with new products being launched at an incredible pace and are available worldwide in a short time.
Despite the various challenges it has been facing, the MSME sector has shown admirable innovativeness, adaptability and resilience to survive the recent economic downturn and recession.
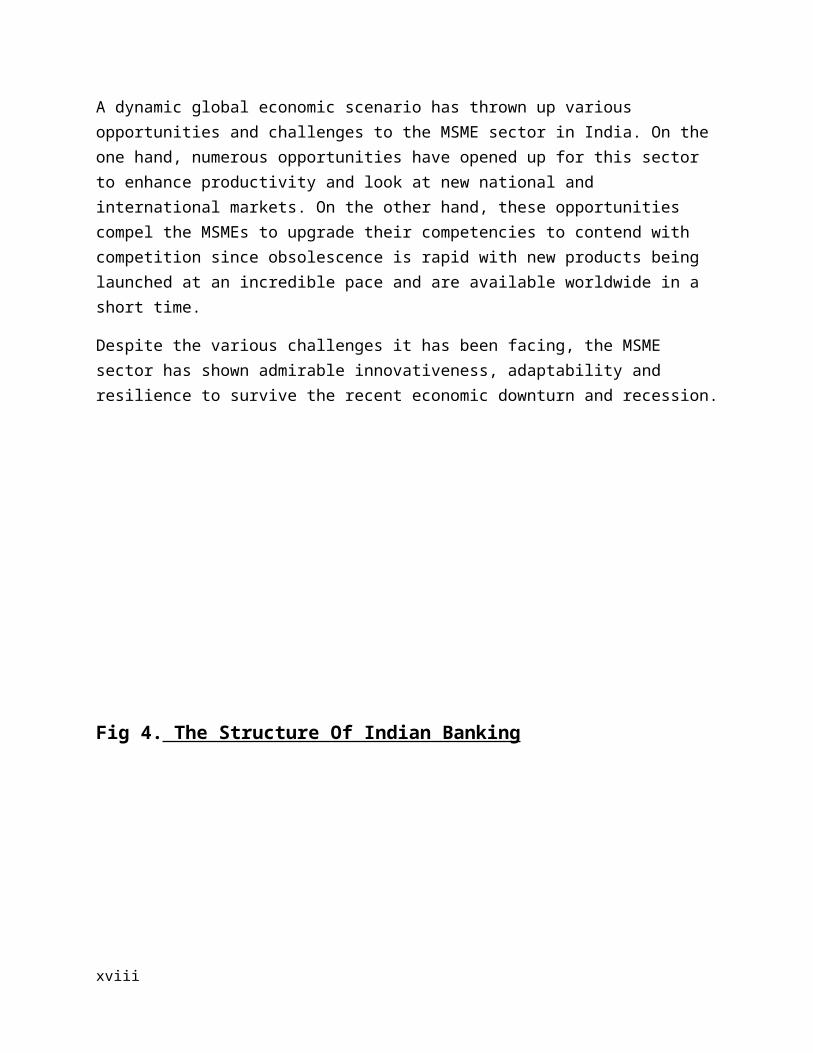
Fig 4. The Structure Of Indian Banking
xii

1.2 COMPANY PROFILE
Small Industries Development Bank of India (SIDBI), set up on April 2, 1990 under an Act of Indian Parliament, is the Principal Financial Institution for the Promotion, Financing and Development of the Micro, Small and Medium Enterprise (MSME) sector and for Co-ordination of the functions of the institutions engaged in similar activities.
Business Domain of SIDBI
The business domain of SIDBI consists of Micro, Small and Medium Enterprises (MSMEs), which contribute significantly to the national economy in terms of production, employment and exports. MSME sector is an important pillar of Indian economy as it contributes greatly to the growth of Indian economy with a vast network of around 3 crore units, creating employment of about 7 crore, manufacturing more than 6,000 products, contributing about 45% to manufacturing output and about 40% of exports,
xiii

directly and indirectly. In addition, SIDBI's assistance also flows to the service sector including transport, health care, tourism sectors etc.
Objectives of SIDBI
Four basic objectives are set out in the SIDBI Charter. They are:
Financing
Promotion
Development
Co-ordination
for orderly growth of industry in the small scale sector. The Charter has provided SIDBI considerable flexibility in adopting appropriate operational strategies to meet these objectives. The activities of SIDBI, as they have evolved over the period of time, now meet almost all the requirements of small scale industries which fall into a wide spectrum constituting modern and technologically superior units at one end and traditional units at the other
Development Outlook
The major issues confronting MSMEs are identified to be:
Technology obsolescence
Managerial inadequacies
Delayed Payments
Poor Quality
Incidence of Sickness
Lack of Appropriate Infrastructure and
Lack of Marketing Network
There can be many more similar issues hindering the orderly growth of MSMEs. Over the years, SIDBI has put in place financing schemes either through its direct financing mechanism or through indirect assistance mechanism and special focus programmes under its P&D initiatives. In its approach, SIDBI has struck a good balance between financing and providing other support services.
SIDBI’s MISSION AND VISION
xiv

Mission
"To facilitate and strengthen credit flow to MSMEs and address both financial and developmental gaps in the MSME eco-system"
Vision
“To emerge as a single window for meeting the financial and developmental needs of the MSME sector to make it strong, vibrant and globally competitive, to position SIDBI Brand as the preferred and customer - friendly institution and for enhancement of share - holder wealth and highest corporate values through modern technology platform.”
Fig 5. CATEGORIZATION OF MICRO,SMALL AND MEDIUM ENTERPRISES
SIDBI AS NODAL AGENCY FOR GOVERNMENT SCHEMES
SIDBI has been identified as a Nodal Agency for the releasing of assistance, monitoring, interface and coordination with Financial Institutions, Banks and the Government. SIDBI provides subsidies to the MSME’s under the following schemes:-
1) Technology Upgradation Fund Scheme-Textile Sector(TUFS)
The Scheme was launched by the Ministry of Textiles, GoI on April 1, 1999 and its objective is to upgrade & modernize the Indian Textile Industry by encouraging it to undertake & adopt modern technological process or undertake capacity expansion.
SIDBI is the nodal agency for the SSI in the textile and cotton ginning and pressing sector.
xv

TUFS Objective & Incentives
i) A reimbursement of 5% on the interest charged by the lending agency on a project of technology up gradation in conformity with the Scheme. However, for spinning machinery the scheme will provide 4% for new stand alone / replacement / modernization of spinning machinery; and 5% for spinning units with matching capacity in weaving / knitting / processing / garmenting.
ii) Additional option to the powerlooms units and independent preparatory units to avail 20% Margin Money subsidy under Restructured TUFS in lieu of 5% interest reimbursement on investment in TUF compatible specified machinery subject to a capital ceiling of Rs. 500 lakh and ceiling on margin money subsidy of Rs.60 lakh. However, for brand new shuttleless looms the ceiling on margin money subsidy will be Rs.1 crore. A minimum of 15% equity contribution from beneficiaries will be ensured.
iii) An option to SSI textile and jute sector to avail of 15% Margin Money subsidy in lieu of 5% interest reimbursement on investment in TUF compatible specified machinery subject to a capital ceiling of Rs. 500 lakh and ceiling on margin money subsidy of Rs.45 lakh. A minimum of 15% equity contribution from beneficiaries will be ensured.
iv) 5% interest reimbursement plus 10% capital subsidy for specified processing, garmenting and technical textile machinery..
v) 5% interest reimbursement plus 10% capital subsidy for brand new shuttleless looms.
vi) 25% capital subsidy in lieu of 5% interest reimbursement on purchase of the new machinery and equipments for the pre-loom & post-loom operations, handlooms/up-gradation of handlooms and testing & Quality Control equipments, for handloom production units.
vii) 25% capital subsidy in lieu of 5% interest reimbursement on benchmarked machinery of silk sector as applicable for Handloom sector.
2) Credit Linked Capital Subsidy Scheme
he objective of this subsidy is to facilitate technology up gradation of SSI units in the specified products / sub-sectors by providing 15 % capital subsidy for induction of well established and improved technologies.
xvi

Other than SIDBI and NABARD, following nine banks have been inducted as Nodal Banks for the purpose of CLCSS:
• State Bank of India
• Canara Bank
• Bank of Baroda
• Punjab National Bank
• Bank of India
• Andhra Bank
• State Bank of Bikaner & Jaipur
• Tamil Nadu Industrial Investment Corporation
• The National Small Industries Corporation
The eligible borrowers for this subsidy include sole proprietorships, partnerships, Co-operative Societies and Private and Public Limited Companies in SSI sector
Eligibility
Units going for upgradation with state of the art technology with or without expansion
New units setting up facilities only with the appropriate and proven technology approved by GTAB
The units registered with State Directorate of Industries.
Maximum Ceiling of loan eligible for support
15% of the investment in eligible plant & machinery
Ceiling on Loan- Rs.100 lakh
Ceiling on subsidy-Rs. 15 lakh
xvii
3) Integrated Development of Leather Sector Scheme
In order to increase employment opportunities, productivity and competitiveness in the global market, it is essential for the Leather Industry to have access to timely and adequate capital for upgrading its technology level.
In light of the foregoing the present scheme is aimed at enabling existing tanneries, footwear, footwear components and leather products units to upgrade leading to productivity gains, right-sizing of capacity, cost cutting, design and development.
QUANTUM AND NATURE OF ASSISTANCE
Cases prior to August 29, 2008
The Scheme provides investment subsidy to the extent of 30% of cost of plant & machinery for SSI and 20% of cost of plant & machinery for other units (i.e. non-SSI units) subject to a ceiling of Rs. 50 lakh for technology up gradation / modernization and/or expansion.
Cases subsequent to August 29, 2008
The Scheme provides investment subsidy to the extent of 30% of cost of plant & machinery for SSI and 20% of cost of plant & machinery for other units (i.e. non-SSI units), subject to a ceiling of Rs. 50 lakh for technology up gradation /modernization and/or expansion and setting up a new unit. The subsidy amount would be @ 20% for all units (both SSI and non-SSI) above Rs. 50 lakh, subject to a ceiling of Rs. 200 lakh. Investment subsidy would also be available to units investing their own resources.
SIDBI FINANCING SCHEME FOR ENERGY SAVING PROJECTS IN MSME SECTION
OBJECTIVE
The Japan International Cooperation Agency (JICA) has extended a Line of Credit toSmall Industries Development Bank of India (SIDBI) for financing Energy SavingProjects in Micro, Small, and Medium Enterprises (MSMEs) Sector. The project is
xviii
expected to encourage MSME units to undertake energy saving investments in plant& machinery / production process to reduce energy consumption, enhance energyefficiency, reduce CO2 emissions and improve the profitability in the long run.The financial assistance to MSMEs will be through SIDBI, as well as through refinanceto banks / State Finance Corporations (SFCs) and Non Banking Financial Companies(NBFCs). Under the Line technical assistance is also provided to financial institutionsand MSME units for dissemination of information and successful implementation ofEnergy Saving projects in MSME Sector.
FINANCIAL PARAMETERS
The financial parameters for assistance under the Scheme are:
PARAMETER NORM
Minimum Assistance Rs. 10 lakh
Minimum Promoters Contribution
25% for existing units
33% for new units
Debt-Equity Ratio Maximum 2.5:1
Interest Rate The interest rate is based on internal risk rating within the band given below:
Fixed rate :9.5-10% p.a Floating rate:9.75-10.5% p.a
Security First Charge over assets acquired under the scheme;
first/second charge over existing assets and collateral security
as may be deemed necessary.
Asset coverage Minimum Assets Coverage should be 1.4:1 for new units and 1.3: 1 for existing units.
Repayment
Period
Need based. Normally, the repayment period doesn’t extend
beyond 7 years. However, longer repayment period of more
than 7 years can be considered under the Line if
xix

considered
necessary.
During the year 2011-12, capital subsidy claims of 638 eligible Micro and Small Enterprises (MSEs) directly assisted by SIDBI and amounting to `43.86 crore were settled under CLCSS. Further, subsidy claims of 909 MSEs amounting to `53.29 crore in respect of co-opted Primary Lending Institutions were also settled. Since the launch of the Scheme in October 2000, capital subsidy claims of 9,324 units aggregating `463 crore (cumulative) were settled. Similarly under TUFS, subsidy claims (both interest incentive subsidy & capital/ margin money subsidy) of 305 eligible textile units for SIDBI’s directly assisted cases amounting to `24 crore and subsidy claims aggregating `14 crore were settled in respect of the co-opted PLIs for their assistance to MSEs. Since the launch of the TUFS in April 1999, capital subsidy and interest incentive claims for an amount of `636 crore (cumulative) have been settled. Under IDLSS, which was launched in November 2005, cumulative claims of 1094 units aggregating `179 crore were settled including 139 units amounting to `22 crore during FY 2011-12.
1.3 RELEVANCE OF THE STUDY
The MSME sector has shown impressive potential during the last few years but it faces a number of challenges to its growth story. MSME’s suffer the high cost of credit which does not reach them on time. There is inadequate capital infusion compounded by insufficient data on credit requirement. In order to capture some of the major challenges related to the credit requirement of the MSME’s this project is taken up to understand how SIDBI has put up a robust procedure to the disbursement of term loan and working capital loan in order to help MSME’s in technological upgradation as well as providing them with timely financial assistance.
Since giving credit rating is one of the most important procedures taken by financial institutes that offer credit to MSMEs to scrutinize their credit rating status in order to get a clear picture of the creditworthiness of the enterprises therefore an attempt has been made to study the Risk Assessment Model used by SIDBI to rate the MSME’s and thus determine the risk and the interest rates for the project undertaken. An attempt is also made to compare the different parameters taken into consideration for a manufacturing sector proposal and a service sector proposal and then it is deduced why certain parameters are taken into consideration and why some are not taken for the two industries.
xx
1.4 OBJECTIVES OF THE PROJECT
The objective of this project is:-
1) To have an overview of the working and structure of SIDBI.
2) To understand Project Financing procedure with emphasis on Project Appraisal part and the analytical techniques (DSCR, IRR, BEP, DE Ratio etc.) used in Small Industries Development Bank Of India (SIDBI) for the disbursement of loans.
3) To study the credit risk scoring and rating model at SIDBI.
4) To gain in depth knowledge of project appraisal by taking up a case study of SIDBI highlighting the technical, economical, financial and commercial aspects of project appraisal.
5) To do a comparative study of the parameters of the Risk Assessment Model which are considered in the manufacturing and the service sector proposals.
These objectives help in understanding how SIDBI has struck a good balance between financing and providing other support services to the MSME’s.
CHAPTER-2
LITERATURE REVIEW
2.1 SCOPE OF THE STUDY
The contribution of micro, small and medium enterprises (MSME) sector to manufacturing output, employment and exports of the country is quite significant. According to estimates, in terms of value, the sector accounts for about 45 per cent of the manufacturing output and 40 percent of the total exports of India. The MSME sector employs about 42 million persons in over 13 million units throughout the country. There
xxi

are more than 6000 products, ranging from traditional to high-tech items, which are being manufactured by the Indian MSMEs.
Fig 6. Trends in the growth of Micro and Small Enterprises (MSEs) and theEmployment Generated (in lakh)
Source: Annual Report, 2008-09. Ministry of Micro, Small and Medium Enterprises,www.msme.gov.in
It can be deciphered from the graph that the number of MSEs has increased steadily in India from 67.87 lakhs in 1990-91 to 133.68 lakhs in 2007-08. This could be possible due to the conducive policy environment during the liberalization era (post 1991). Similarly, number of persons employed in MSEs has risen from 158.34 lakhs in 1990-91 to 322.28 lakhs in 2007-08. The yawning gap between the two lines over the years indicates that employment elasticity of the MSE sector has improved. However, much of the labour absorption has taken place in the unorganized/ informal enterprises.Inspite of being an important sector in the Indian economy MSME’s are facing some issues.According to The Challenge of Employment in India: An Informal Economy Perspective (NCEUS,2009) shows that between August 2007 and 2008, credit for credit cards increased by 86.3 per cent, all services sectors by 35.3 per cent, construction by 48.3 per cent, and real estate by 46.3 per cent. However, the increase to credit agriculture and allied activities has been 18.5 percent and for small-scale industries (including micro enterprises) just 9.7 per cent.
xxii

The overall availability of credit to small and micro enterprises as percentage of net bank credit (NBC) of the Scheduled Commercial Banks (SCB) has declined from 15.5 per cent in 1996-97 to 6.6 per cent in 2007-08. Banks’ credit to micro enterprises (investment up to Rs 25 lakh in plant and machinery) declined from 4.2 percent in 2002- 03 to 2.8 percent in 2007-08. The lower segment of micro enterprises (with investment up to Rs 5 lakh in plant and machinery) has experienced a decline from 2.2 per cent to 1.6 percent in the same period. The proportion of net bank credit flows to the small scale sector has been falling in recent years (from 16 per cent in early 1990s to 8 percent in 2006–2007)Banks show their reluctance to extend credit to small enterprises because of the following reasons:• High administrative costs of small-scale lending• Asymmetric information;• High risk perception• Lack of collateral.Credit guarantee schemes diminishes the risk incurred by lenders and are mainly a reaction to small firms’ lack of collateral. Such schemes do have the potential to reduce the costs of small-scale lending and to improve the information available on borrowers. They enable small firms to access formal credit and also improve the terms of a loan. Such schemes assist small enterprises to obtain finance for working capital, investment and/or leasing purposes at reasonable conditions. This enables SMEs to improve their competitiveness and to extend their economic activity. Weaknesses of credit guarantee schemes can be avoided through proper design and private sector involvement.
Some of the key constraints that are being faced by the Indian MSMEs are:
Accessing adequate and timely financing on competitive terms, particularly longer tenure loans.
Accessing credit on easy terms has become difficult in the backdrop of current global financial crisis and the resultant liquidity constraints in the Indian financial sector, which has held back the growth of SMEs and impeded overall growth and development.
The financing constraints faced by Indian SMEs are attributable to a combination of factors that include policy, legal/regulatory framework (in terms of recovery, bankruptcy and contract enforcement), institutional weaknesses (absence of good credit appraisal and risk management/ monitoring tools), and lack of reliable credit information on SMEs.
It has become difficult for lenders to be able to assess risk premiums properly, creating differences in the perceived versus real risk profiles of SMEs.
Access to skilled manpower, R&D facilities and marketing channels is limited.
xxiii

Availability of finance at cheaper rates, skills about decision-making and good management and accounting practices, and access to modern technology.
Looking at all the above constraints it is essential for organizations that are associated with small-scale industry/ MSMEs like SIDBI to put in place an effective project appraisal system so that MSME’s can get timely and effective disbursement of loans for up gradation of technology in the various sectors.
The government of India has taken a large number of steps in the form of formation of nodal bodies as well as providing a number of schemes like TUFS,CLCSS etc in order to provide financial assistance to MSME’s. Some of the products and services offered by SIDBI in this regard as follows:-
Institutional: Focuses on refinance schemes, like Mahila Udyam Nidhi, finance to small transport operators, technology upgradation fund for textile units, loans for acquisition of ISO certification, self-employment loan for ex-servicemen, single window finance for short term credit, all of them operated through SFCs or SIDCs or primary lending institutions or Banks or other microfinance institutions, depending upon the category of loans.
Promotional: SIDBI acts as a nodal agency for several Government schemes such as Technology Upgradation Fund Scheme for the textile sector, Integrated Development of Leather Sector Scheme for the leather sector and Modernization/Upgradation of Food Processing Industry.SIDBI Venture Capital Fund Ltd (SVCL) manages two funds set up by SIDBI at the national level.The National Venture Capital Fund for Software and IT Industry (NFSIT) is worth 100 crore INR, established with the focus of supporting incubation projects of small-scale units in the IT and related business.The SME Growth Fund has a corpus of 500 crore INR which targets growth-oriented businesses in the areas of life sciences, retailing, light engineering, food processing, IT, infrastructure related services, healthcare, logistics and distribution, for making primary equity and equity related investment.
Apart from these provisions more support is needed for MSMEs from the government in the form of priority sector lending, government procurement programme, credit and performance ratings and marketing support. Technology transfers (such as green technology) and networking can revive the growth of MSMEs.
2.2 INTRODUCTION TO PROJECT FINANCING
Project Financing is the financing of long-term infrastructure and industrial projects based upon a complex financial structure where project debt and equity are used to finance the project. Risk identification and allocation are key components of project finance.
xxiv

Banks and other financial institutions have to ensure the viability of the project i.e the project will generate sufficient returns on the resources invested in it.Any surplus available from the project should be sufficient to pay interest on term loans and repay the principal amount within a reasonable period depending on the nature of the project.The viability of a project depends on technical feasibility, marketability of products at a profitable price, availability of financial resources in time and proper management of the unit.
2.3 PROCEDURAL ASPECTS OF PROJECT FINANCING IN BANKS
Development operations financed by follow a procedure cycle, which is almost identical for all kinds of projects whose technical, economic, and financial feasibility has been established. These projects must have a reasonable economic rate of return and should be intended to promote development in the beneficiary country. The procedure consists of the following:-
IDENTIFICATION OF THE PROJECT
The project’s idea is introduced to providers by various sources: a request from the government concerned or financials identification missions may identify a proposal from other financiers, or it. Applications for financing are then sorted out and classified: projects to be financed are selected from amongst projects which have top priority in the development plans of the beneficiary countries and which meet the requirements established by the rules for financing set out by the providers and agreed upon by the government concerned. In all cases, an official request from the government should be submitted to financials before it decides to participate in the financing.
DESK REVIEW AND DETERMINATION OF THE PROJECT’S SCOPE
Experts, each in his field of specialization, study all the documents available on the project and examine its components, its estimated local and foreign costs, the preliminary financing plan, the position of the other sources of financing, the current economic situation and the development policy of the beneficiary country and, generally, review all elements which may help in making the project a success.
PRELIMINARY APPROVAL
The findings of the project’s review are set out in a report prepared by financials experts and submitted to Board of Directors for preliminary approval for undertaking further studies on the said project with the intention of considering the possibility of organization’s participation in its financing.
xxv

PROJECT APPRAISAL AND SUBMISSION TO THE BOARD
After the project has been granted preliminary approval, organizations usually dispatches an appraisal mission to the project’s site. The appraisal stage is considered to be one of the key stages of the procedure in this stage the project’s objectives, components, cost, financing plan, justification and all its economic, technical and legal aspects are determined. The project’s implementation schedule, the methods of procurement of goods and services, the economic and financial analysis and the implementing and operating agencies are also examined at this stage. Based on the results of the appraisal mission, an appraisal report is prepared, as well as a Director General’s report which is submitted to the Board of Directors for final approval.
CONSULTATIONS WITH OTHER COFINANCERS
Consultations are considered to be one of the important stages in the procedure. It is during this stage that agreement is reached regarding the financing plan, the type of financing, and distribution of the components of the project so as to ensure the smooth flow of disbursements during execution of the various components of the project. This coordination should continue throughout the project implementation period to ensure the fulfillment of its objectives.
NEGOTIATIONS AND SIGNATURE OF THE LOAN AGREEMENT
After the beneficiary government is informed of the Board of Directors’ decision to extend the loan according to the terms agreed upon during the appraisal of the project, the loan agreement is prepared and negotiated, and eventually signed with the government concerned.
DECLARATION OF EFFECTIVENESS OF THE LOAN AGREEMENT
A loan agreement is declared effective after continuous contacts with the government concerned and the other co-financiers and after fulfillment of all conditions precedent to effectiveness stipulated in the loan agreement.
PROJECT IMPLEMENTATION AND DISBURSEMENT FROM THE LOAN After the declaration of effectiveness of the loan agreement, the project’s implementation and, consequently, the disbursements from the loan funds start according to the plan agreed upon during the appraisal process and in line with the rules and provisions of the loan agreement signed between the two parties.
SUPERVISION AND FOLLOW UP Financials undertakes the follow-up of the project’s implementation through its field missions sent to the project’s site or through the periodic reports which it requires the beneficiary country to provide on a quarterly basis. These reports enable them to advise the government concerned on the best ways to implement the project.
xxvi

CURRENT STATUS REPORTS Whenever necessary, experts prepare status reports which include the most recent information and developments on the project’s implementation. These reports are submitted to the Board of Directors for information and approval of any possible amendments, which may be required for implementation. This is done in coordination and agreement with the government concerned and the other co-financiers.
PROJECT COMPLETION REPORT This report is prepared at the project’s site and in the office as well, after completion of the project. This report enables organizations to make use of the experience gained from the completed project, when implementing similar projects in future. In addition, it may help in identifying a new project in the same sector.
CHAPTER-3
METHODOLOGY
Methodology is description of the process, rules, methods employed in a study. Research refers to a search for knowledge. One can also define research as a scientific and systematic search for pertinent information on a specific topic. In fact, research is an art of scientific investigation. This chapter deals with universe of the study, locale of the study, method of data collection, tools used for data collection, types of sampling used, sample sized used for study and analysis of the study.
3.1 UNIVERSE OF THE STUDYThe universe of the study consists of all the employees of the organization(SIDBI) across the country. For this research the universe of the study considered is the India Division of the Small Industries Development Bank Of India.
xxvii

3.2 LOCALE OF THE STUDY
The locale of the study has been narrowed down to the Head Office, Lucknow office of Small Industries Development Bank Of India. The study is categorized into many departments of the SIDBI but it mainly deals with the Central Loan Processing Cell Of SIDBI. A term loan proposal recently came to SIDBI for approval. So the researcher decided to take up this proposal for appraisal purpose. A working capital loan proposal also came for approval and its appraisal is also studied. The findings may or may not be similar to the other branches of the company across the country. 3.3 SAMPLE SELECTION
The study has been done based on the detailed project report submitted by the project developer and queries regarding the report were answered by the developer of SIDBI.
3.4 DATA COLLECTION For the purpose of data collection, two different sources were adopted for the study:
Primary Sources
Secondary Sources
The primary data collection method has been used to complete the research activity. But the researcher has done secondary research for major study.
Secondary - The researcher has gathered material from various research papers, journals and magazines on the Indian MSME’s. Various books and articles were referred to understand Project Financing/Project Appraisal. Moreover the project reports of various working capital and term loan proposals were studied thoroughly to get an insight into the actually procedure undertaken to disburse the loans.
3.5 ANALYSIS OF DATA
An actual term loan proposal and a working capital loan proposal was done to get a hands on experience on the procedure of Project Appraisal. Excel statistical tools have been used for analyzing the data. Following steps were taken for analysis (appraising the project):
Doing a management appraisal-checking the promoters contribution, credentials and years of experience in the business.
Doing a technical appraisal-visiting the locality of the project and checking whether the machines and other utilities for the plant are sufficient to sustain the project.
Doing a financial appraisal-Doing a ratio analysis and checking whether the ratios adhere to the prescribed norms. Calculating Debt Service Coverage Ratio, IRR,NPV and doing a sensitivity analysis.
xxviii
Doing a commercial appraisal- Checking the demand and supply of the project.
Moreover for comparing the parameters of RAM model for manufacturing and service sector the study was taken up on a micro level and the detailed analysis of the parameters used in each sector was done. This was done by comparing the RAM reports of proposals of manufacturing and service sector.
3.6 FIELD EXPERIENCE
The data analyzed was the result of interviews and questioning from the officials of two departments of SIDBI. One department dealt with the project appraisal and disbursement of loans called the Central Loan Processing Cell(CLPC) and the other department dealt with the issue of subsidy schemes called the Government Schemes Cell(GSC).As a part of the project a number of field visits were done to do the technical appraisal of the proposals.
CHAPTER-4
TERM LOAN AND WORKING CAPITAL CASE STUDIES AT SIDBI
4.1 CASE 1-TERM LOAN
The case analyzed is a proposal for sanction of term loan of Rs 57 lakh under Direct Credit Scheme for expansion of project by way of purchase of additional machinery covered under JICA(Japan International Cooperation Agency) Line of Credit with CLCSS Subsidy of Rs 13,40,904 /-.The company is manufacturing plastic moulded items which are used by retail consumers as well as institutional users.
xxix

DETAILED APPRAISAL FOR LOAN DISBURSEMENT
4.1.1 TECHNICAL APPRAISAL
Scope of the project: The project envisages expansion by way of purchase of additional equipment viz. – Injection Moulding Machine, Injection unit assembly, High Speed Mixture machine, moulds and electrical fittings. Location of the project: The unit is not located in industrial Area, However the land is converted for industrial use and it is connected with the road.
Technology & Manufacturing Process: The proposed expansion project is for purchase of Injection Moulding machine, its accessories and electrical fittings. Presently the unit is already having one machine from the same supplier, which is used for manufacturing of plastic moulded household items– chairs and tables.
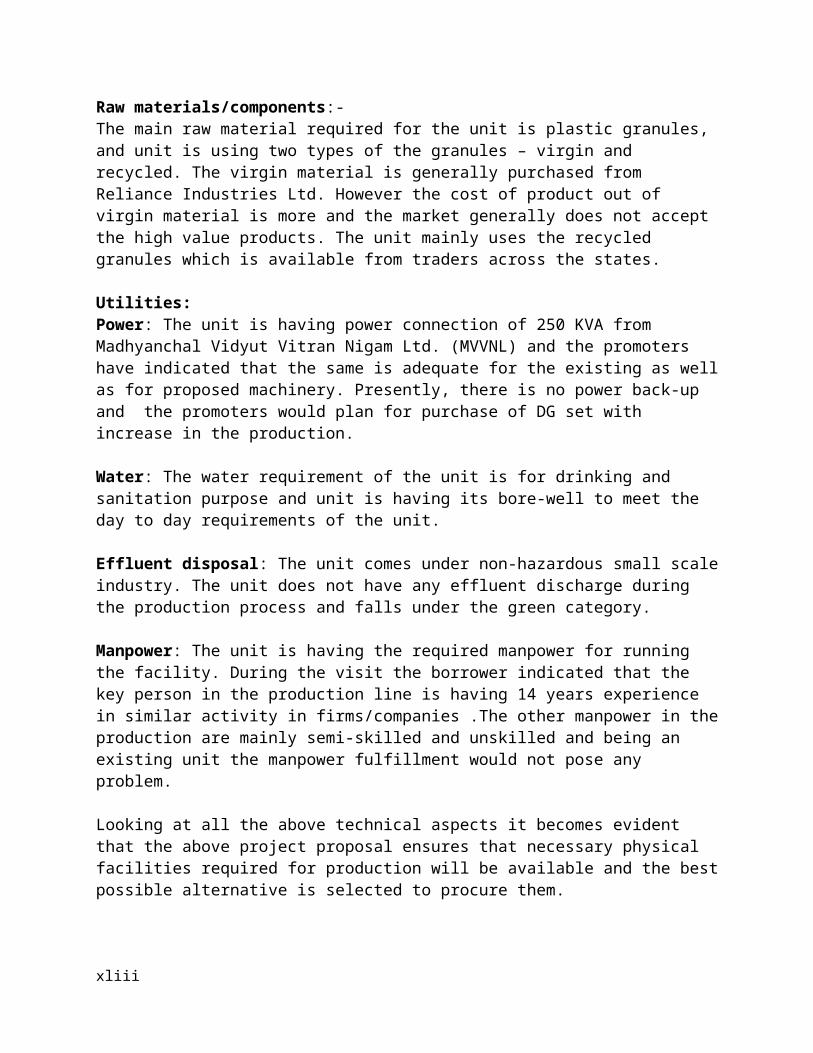
Raw materials/components:- The main raw material required for the unit is plastic granules, and unit is using two types of the granules – virgin and recycled. The virgin material is generally purchased from Reliance Industries Ltd. However the cost of product out of virgin material is more and the market generally does not accept the high value products. The unit mainly uses the recycled granules which is available from traders across the states.
Utilities:Power: The unit is having power connection of 250 KVA from Madhyanchal Vidyut Vitran Nigam Ltd. (MVVNL) and the promoters have indicated that the same is adequate for the existing as well as for proposed machinery. Presently, there is no power back-up and the promoters would plan for purchase of DG set with increase in the production.
Water: The water requirement of the unit is for drinking and sanitation purpose and unit is having its bore-well to meet the day to day requirements of the unit.
Effluent disposal: The unit comes under non-hazardous small scale industry. The unit does not have any effluent discharge during the production process and falls under the green category. Manpower: The unit is having the required manpower for running the facility. During the visit the borrower indicated that the key person in the production line is having 14 years experience in similar activity in firms/companies .The other manpower in the production are mainly semi-skilled and unskilled and being an existing unit the manpower fulfillment would not pose any problem.
xxx

Looking at all the above technical aspects it becomes evident that the above project proposal ensures that necessary physical facilities required for production will be available and the best possible alternative is selected to procure them.
4.1.2 COMMERCIAL APPRAISAL
Plastic in the recent times is most widely used product due to its durability and malleability. Furniture is conventionally made out of wood but due to the availability and environmental issues wood has become dearer. For furniture typical wood is continued to be used. The requirement of the wood has been to great extent replaced by plastic and plastic moulded furniture which is widely accepted. The demand for the plastic moulded furniture has witnessed continuous increase and expected to continue.
4.1.3 FINANCIAL APPRAISAL
Capital cost of projects and sources of finance
For expansion the firm needs to purchase one “Injection Moulding Machine” of Rs. 89.39 lakh, one “Injection Unit Assembly” (DC Unit) of Rs 3.88 lakh, one “High Speed Mixture Machine” of Rs 1.53 lakh, two number of moulds of Rs 25 lakh and other charges of Rs 5 lakh viz. Insurance, Fright charges, loading & unloading charges and electrical fitting, cables, bus bars etc.The total project cost comes out to be the borrower Rs 125 lakh.Based on the merits, the total project cost has been worked out to Rs 93.27 lakh including cost of one “Injection Moulding Machine” of Rs 89.39 lakh and one “Injection Unit Assembly” (DC Unit) of Rs 3.88 lakh. The borrower has agreed to raise/bring funds from his own sources for the other remaining machinery/activity.Out of the total project cost of Rs 93.27 lakh the contribution of the promoters is Rs 36.30 lakh which comes out to be [36.30/93.27*100]=38.80%.
Financial analysis is done based on the balance sheet and P/L account sheet attached in the annexure.
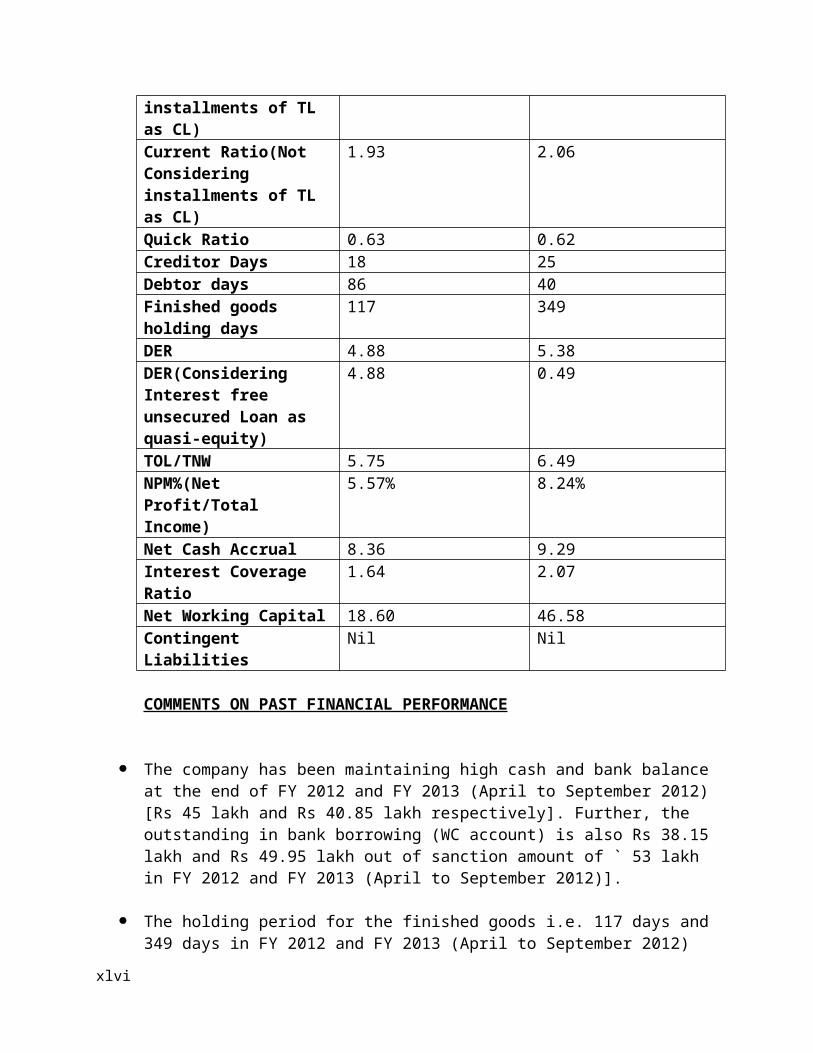
Table 1. PAST FINANCIAL PERFORMANCE OF THE APPLICANT UNIT
(in lakh)Particulars FY2012 FY 2013 (Provisional, 1st &
2nd Quarter ) April to September 2012
Net Sales 78.11 55.95
xxxi

Non operational Income 8.72 0.03PBIT 13.76 17.29Interest Paid 16.18 10.48Depreciation 4.01 4.51Operating Profit -2.42 6.81PAT 4.35 4.61Equity Share Capital 50.40 50.40Reserve and Surplus 4.35 8.96Tangible Net Worth 54.75 58.17Interest free unsecured loan
0.00 190.42
Interest bearing unsecured loan
132.92 0.00
Current Liabilities 71.98 83.08Total Long term Liabilities
242.93 294.45
Total Outside Liabilities(Current liabilities +total long term liabilities)
314.81 377.52
Net Block(Gross block-depreciation)
257.24 261.76
Current Assets 90.58 129.66Current Ratio(Considering installments of TL as CL)
1.26 1.56
Current Ratio(Not Considering installments of TL as CL)
1.93 2.06
Quick Ratio 0.63 0.62Creditor Days 18 25Debtor days 86 40Finished goods holding days
117 349
DER 4.88 5.38DER(Considering Interest free unsecured Loan as quasi-equity)
4.88 0.49
TOL/TNW 5.75 6.49NPM%(Net Profit/Total Income)
5.57% 8.24%
Net Cash Accrual 8.36 9.29Interest Coverage Ratio 1.64 2.07
xxxii

Net Working Capital 18.60 46.58Contingent Liabilities Nil Nil
COMMENTS ON PAST FINANCIAL PERFORMANCE
The company has been maintaining high cash and bank balance at the end of FY 2012 and FY 2013 (April to September 2012) [Rs 45 lakh and Rs 40.85 lakh respectively]. Further, the outstanding in bank borrowing (WC account) is also Rs 38.15 lakh and Rs 49.95 lakh out of sanction amount of ` 53 lakh in FY 2012 and FY 2013 (April to September 2012)].
The holding period for the finished goods i.e. 117 days and 349 days in FY 2012 and FY 2013 (April to September 2012) respectively. The borrower has increased its production in anticipation of good sales due to festive season in September and hence reflected as high holding period.
The borrower has stated that the company has been allotted power connection of two machinery (250 KVA), but is presently using power for one machinery [due to 1st year of its operations]. Accordingly, the cost of electricity has been high in its 1st year of operations.
The borrower has converted interest bearing unsecured loan of Rs. 132.92 lakh to interest free unsecured loan aggregating to Rs.190.42 lakh [from FY 2012 to FY 2013 (April to Sept 2012)]. As the DER is high, a suitable condition is being stipulated for the borrower to maintain atleast an amount of Rs.50 lakh during the currency of the loan. On account of this, it is felt that the DER (considering interest free unsecured loan as quasi equity) shall be in the range of less than 2:1.
Table 2. DESIRABLE NORMS AND PARAMETERS FOR ELIGIBILITY OF ASSISSTANCE
Desirable Norms and parameters
FY 2012
FY 2013 (Provisional, 1st & 2nd
Quarter ) [April to September 2012
Remarks/ Status
(i) DER((SIDBI term loan+term loan from other banks+int bearing unsecured loans)/networth)
Generally not exceeding 2:1 for the firm as a whole.
4.89 5.38
xxxiii

DER (Considering Interest Free Unsecured loan as quasi-equity)
Generally not exceeding 2:1 for the firm as a whole.
4.89 0.49
DER for company as a whole including current assistance of Rs 57 lakh (Considering Interest Free Unsecured loan as quasi-equity)
Generally not exceeding 2:1 for the firm as a whole.
4.89 0.56[(Long Term Debts as on 30/09/2012 + Proposed TL) / (Net worth as on 30/09/2012 + Existing Interest Free Unsecured loan+ Proposed Capital)] = [(102.47+57)/ (58.17+190.42+36.30)]=(159.47 / 284.89) = 0.56
(ii) Projected DSCR
Generally not below 1.5:1 but it can be relaxed up to 1.25:1.
Average DSCR: 1.29 Not complied with so it will be relaxed.
iii)Minimum promoter’s contribution
New projects-33%, lower contribution [upto 25%] could be accepted in respect of existing well performing companies / firms. Others – 25% (minimum
[(93.27-57.00)/ 93.27]*100= 38.88%
Complied with
(iv) Period of loan / limit
Minimum 6 months to maximum 8-10 years for term loan (including moratorium
60 months for installments of TL and moratorium period of 6 months
Complied with
xxxiv

of not exceeding 18 months)
(v) Upfront fee [non refundable]
Up-to 1% of the term loan sanctioned at the time of issue of LOI
1% with applicable service tax. Complied with
(vi) Overall Asset Coverage
Minimum overall asset coverage of 1.3 for existing companies and 1.4 for new projects should be ensured.
2.07 (118.27/57) Complied with
(vii) Min Credit Rating
Not below CR5 for Rupee assistance and Not below CR4 for FC assistance Not Below CR4 for leather & leather products.
CR3 / SME4/SIDBI5 Complied with
. Table 3. BREAKEVEN POINT
Breakeven point in optimum year 2017(% of installed capacity)
31.92%
Cash break even in optimim year 2017 18.43%
Table 4. DISCOUNTED CASH FLOW TECHNIQUES
xxxv

IRR(Post tax) 12.66%IRR(Pre-tax) 16.95%NPV(Pre-tax) 102.70NPV(Post tax) 3.51
Significance of NPV-Since the NPV post tax and pre-tax is positive therefore the project is productive and proposal for term loan is accepted.Significance of IRR-Since the IRR before tax and after tax is greater than the rate of interest(cost of capital) which is calculated to be 10.33% therefore the proposal for term loan is accepted.(Calculation of DSCR, Breakeven point, IRR, NPV, Cost of Capital and ROCE is given in the annexure)
Fig 7. GRAPHICAL REPRESENTATION OF BEP
Fig 8. GRAPHICAL REPRESENTATION OF ROCE,IRR AND COST OF CAPITAL
xxxvi

SENSTIVITY ANALYSIS
Sensitivity analysis has been attempted to observe impact on DSCR. The Unit is operating on a margin of 5.57% (FY 2012) and based on the past trend, it is projected that the margin will be in the range of 3% to 8%. As such it will be possible on the part of the unit to sustain sensitivity up to +/- 5%.
Table 5.Senstivity Analysis
(Rs. lakh)
Percentage DSCR BEP Cash BEP
ROCE Cost of Capital
IRR (before tax)
IRR (post tax)
NPV (before tax)
NPV (post tax)
Base Case 1.29 31.92% 18.43% 19.60% 10.33% 16.95% 12.66% 102.70 3.51Decreasing Sales& Job Income by
5.0% 1.01 42.24% 24.38% 14.59% 10.11% 12.26% 9.11% -5.26 -71.18
Increasing RawMaterial Cost by
5.0% 1.10 38.36% 22.14% 16.14% 10.19% 13.80% 10.29% 29.32 -47.20
Decreasing Production Cap.Utilisation by
5.0% 1.20 31.93% 18.43% 18.41% 10.30% 15.51% 11.56% 68.52 -20.27
FINANCIAL PROJECTIONS/ECONOMIC VIABILITY
The projections have been carried out based on the past operations/performance, CMA data submitted by the borrower and future business prospects of the firm.
The borrower has proposed for expansion of existing business by installing of one number of Injection Moulding Machine and the capacity of the plant will be
xxxvii

doubled after installation of proposed machinery. Accordingly the production and sales have been projected.
The unit has submitted CMA data/projected sales of Rs 332.60 lakh, Rs 462.80 lakh, Rs 582.20 lakh, Rs 702.40 lakh, Rs 819.60 lakh, Rs 836.40 lakh, and Rs 841.40 lakh in FY 2013, FY 2014, FY 2015, FY 2016, FY 2017, FY 2018 and FY 2019 respectively.
Based on the past trend the sales projections submitted by the unit have been accepted though with a conservative approach. Accordingly Sales have been projected of Rs 224.22 lakh, Rs 311.27 lakh, Rs 361.46 lakh Rs 382.20 lakh, Rs 406.16 lakh, Rs 430 lakh and Rs 430 lakh in FY 2013, FY 2014, FY 2015, FY 2016, FY 2017, FY 2018 and FY 2019 respectively.
The firm has started commercial production since October 2011 and FY 2012 (6 months of operation only) is the first year of commercial operation.
The company has achieved sales of Rs 78.11 lakh and of Rs 55.95 lakh in FY 2012 and FY 2013 (April to September 2012) respectively.
The other non-operational income of the company is Rs. 8.72 lakh in FY 2012, accordingly we have assumed of Rs. 10 lakh non-operational income in FY 2013 and onwards.
The unit is using 40% of capacity utilization in FY 2012 based on that the production capacity has been assumed at 45%, 55%, 65%, 75%, 80%, 80%, and 80% for FY2013, FY2014, FY2015, FY2016, FY2017, FY2018 and FY2019 respectively.
The cost of production/net sales is 107.27 % in FY 2012 and accordingly operating profit is negative in its 1st year of operation. However the unit has made PAT on account of other income earned by it. The unit has been able to improve its efficiency by reducing the raw material cost steadily over the year’s i.e approx 82 to 89 % onwards FY 2013.
Other costs are also considered at around/average actual cost of last FY i.e. FY2012 and FY 2013 (April to September 30, 2012).
The power consumption of Rs 13 lakh (16.66% of net sales) and Rs 17.78 lakh (31.77% of net sales) against sales of Rs 78 lakh and Rs 55.95 lakh in FY 2012 and FY 2013 (April to September 2012) respectively due to 1st year of operation of FY 2012 and sanction of power of proposed project, However we have assumed the cost of power for FY 2013 and onwards as per the data given by the borrower approx 5 to 7 % of net sales in FY 2013 and onwards.
The depreciation and income tax have been calculated at the prevailing rates.
xxxviii
The administrative and selling cost has been calculated at 1.22% of the sales in FY 2012 accordingly we have assumed for FY 2013 and onwards.
Annual increase of 10% has been assumed for salaries/wages and repairs and maintenance activity.
The retention of atleast Rs 50 lakh as interest free unsecured loan has been assumed during the currency of the loan has resulted in the projected DER [considering interest free unsecured loan as quasi equity] from 2013 onwards to be maintained at level below 2:1.
Assumptions underlying profitability statement, projected profitability statement, projected balance sheet and projected cash flow are given in Annexure.Based on the above assumptions, the projected profitability and select ratios of the project are presented below:
Table 6. Projected Profitability
xxxix

4.1.4 APPRAISAL OF MANAGEMENT
It has been perceived by the Lucknow Branch Office that the promoters have experience of 10-12 years in this line of business, and one of the promoters of the unit is involved in 4 units and resourceful. Further a positive feedback about the promoters has been received from one of the customers of SIDBI LKBO.
4.1.5 DETAILED COMPLIANCE ANALYSIS FOR SUBSIDY ASSISTANCE
Eligibility under JICA Energy Saving Line of Credit-The unit is already having one such machine which is installed and under operations.Further the name of the equipment supplier is also listed in the JICA list.
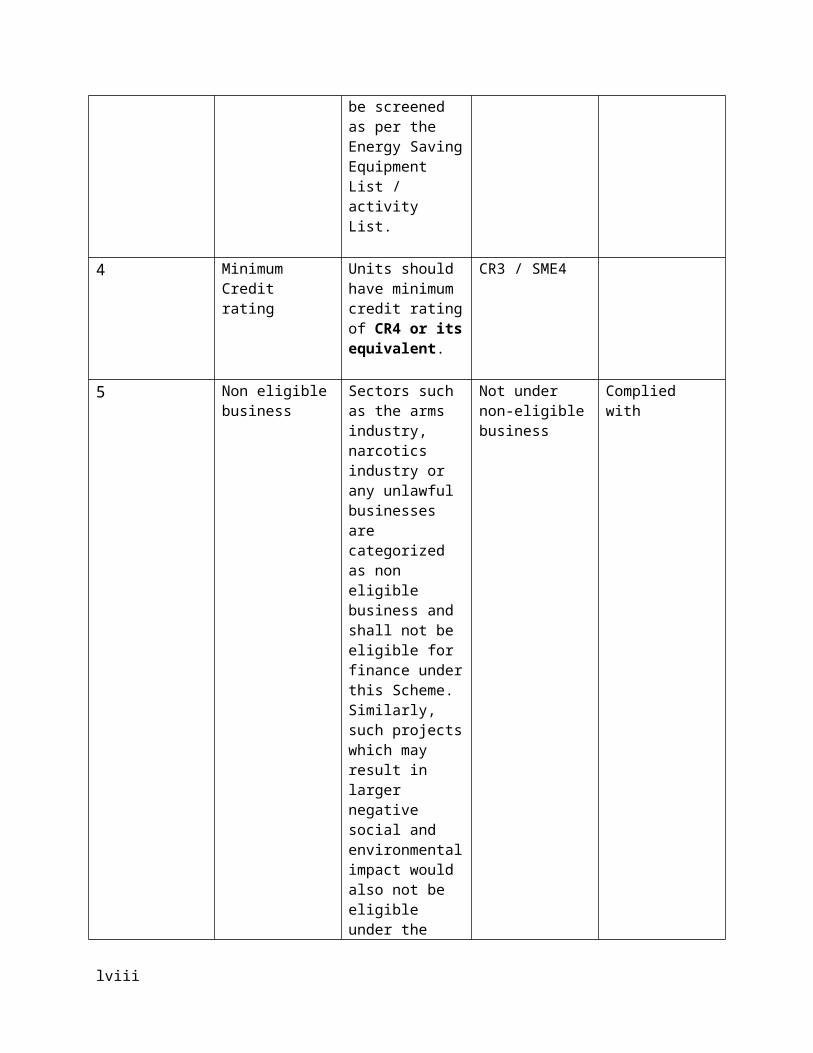
Table 7. Eligibility under JICA scheme
Sr. No Parameter - Norm
Particulars Actual under the project
Compliance
1 Eligible units New / existing MSME units, as per the definition
existing MSME unit
Complied with
xl

of the MSMED Act, shall be eligible for assistance under the scheme.
2 Track record & Financial position
Existing units should have satisfactory track record of past performance and sound financial position and should not be in default to institutions/banks.
Positive feedback about the promoter Credit Report from the existing Banker has been sought and yet to be received. A pre-LoI condition is stipulated in this regard.
Complied with
3 Eligible machinery
The projects which will be eligible for finance under the Scheme will be energy saving projects which are to be screened as per the Energy Saving Equipment List / activity List.
Saving Equipment List (Release 7.2) Sr.No.20.5, Page No. 52 as per JICA list*.
Complied with
4 Minimum Credit rating
Units should have minimum credit rating of CR4 or its equivalent.
CR3 / SME4
5 Non eligible business
Sectors such as the arms industry, narcotics industry or any unlawful businesses are categorized as non eligible business and shall not be eligible for finance under this Scheme. Similarly, such
Not under non-eligible business
Complied with
xli

projects which may result in larger negative social and environmental impact would also not be eligible under the Line of Credit.
Table 8. Financial Parameters for JICA scheme:
Sr. No Parameter Norm Compliance
1 Minimum assistance
Generally not less than Rs 10 lakh The assistance under the
current project is of Rs 57 lakh, Complied with 2 Maximum
Assistance Generally not more than Rs 15 crore per project.
3 Minimum promoters contribution
25% for existing units 33% for new units
Promoters' contribution: [(93.27-57.00)/ 93.27]*100= 38.88%
4 Debt equity ratio (for Project) :
Maximum 2.5 :1 [57/(36.30)] = 1.57 (Rs. 36.30 lakh in the form of share capital)
Debt equity ratio (for Firm as whole) : (Calculated based on latest CA certified provisional B/s)
Maximum 2.5 :1 0.56 [(Long Term Debts as on 30/09/2012 + Proposed TL) / (Net worth as on 30/09/2012 + Existing Interest Free Unsecured loan+ Proposed Capital)] = [(102.47+57)/ (58.17+190.42+36.30)]=(159.47 / 284.89) = 0.56
5 Interest rate Based on the rating of the customer and applicable interest rate for Energy Efficiency projects, as per extant RiMD Guidelines. Further
75 bps lower than the applicable rate under the scheme. Floating Interest Rate @ [PLR+0.50-0.75 % p.a.] Since, the present effective PLR being is 12.75%, the rate of interest is 12.50% p.a
xlii
– BO should negotiate floating rate of interest. Bank reserves the right to charge normal [DCS] interest rate if the account becomes NPA. Bank reserves the right to charge normal [DCS] rate of interest if there is irregularity in implementation of the project [equipment is not of the same specification for which approval was taken, equipment has been shifted to another premises, etc)
[12.75 + 0.50 – 0.75 % p.a] with monthly rests for TL of ` 57 lakh under JICA [Rating: CR3]; Hence, complied with.
6 Upfront fee Non refundable upfront fee of 1% of sanctioned loan plus applicable service tax.
1%, Complied with
7 Security First charge over assets acquired under the scheme; first/second charge over existing assets and collateral security as may be deemed necessary as per extant guidelines on asset coverage.
Complied with
xliii

8 Asset coverage Asset coverage norms as per the existing DCS norms. Could be reduced to a minimum of 1.2:1 by sanctioning authorities in case of well run existing units
Complied with
9 Repayment period Need based. Normally, the repayment period shall not extend beyond 7 years. However, longer repayment period of more than 7 years may be considered under the Line if considered necessary.
5 years and moratorium period of 6 months. Complied with.
ELIGIBILITY UNDER CLCSS SUBSIDY:
The project envisages expansion by way of purchase of additional equipment viz. – Injection Moulding Machine, and Injection unit assembly. The only Injection Moulding Machine is eligible for CLCSS.
Table 9. Eligibility under CLCSS Subsidy
Sr. No. Norm under the scheme
Actual under the project
Compliance Status / Remarks
1 In terms of GSC Circular No. 03/ 2006-2007 dated June 01, 2006, proposal is covered under the scheme. “First supplement of the revised guidelines on the CLCSS for technology upgradation of small scale industries (SSI) approved by the technical sub-committee on the
As per Booklet/Revised Guidelines on Credit Link Capital Subsidy Scheme (CLCSS) for Technology Up gradation of Small Scale Industries (SSI) (As on April 20, 2006,Fully automatic Micro processor controlled Plastic Injection Moulding machines is eligible under Plastic
Complied with
xliv

CLCSS (TSC) in its 6th meeting held on the 10th day of August, 2006”
Moulded/ Extruded Products and Parts/ Components including reinforced plastic/composite Material.
2 The Company/ Firm is registered with the State Directorate of Industries (Provisional registration certificate has been obtained by the company.)
Yes, Registered at DIC Lucknow as Small Enterprise (Manufacturing)
Complied with.
3 Management of the Company/ Firm is competent to implement the project.
Keeping in view that the promoters are having experience in similar line of activity and have recruited competent personnel. Hence, the overall management may be considered competent.
Complied with.
4 The Company/ Firm would not avail any benefit including Interest/capital subsidy under any other scheme of the Central Government / state Govt.
A pre-disbursement condition for borrower to furnish an undertaking / declaration in this regard has been stipulated.
Condition Stipulated
Details of eligible machinery:-
The total cost of machinery eligible under CLCSS is Rs. 89,39,362 /-. However, the maximum amount of CLCSS subsidy is 15% of the actual cost of machinery eligible under the scheme or Rs. 15.00 lakh whichever is lower. Hence, the company is eligible for capital subsidy of ` 13,40,904 /- as per Booklet/Revised Guidelines on Credit Link
xlv
Capital Subsidy Scheme (CLCSS) for Technology Up gradation of Small Scale Industries (SSI) (As on April 20, 2006).
4.2 CASE 2-WORKING CAPITAL LOAN
The case study for the renewal of working capital was of a ‘XYZ’ company which is in the food processing sector/rice milling industry. The proposal for renewal of working capital limit was of Rs 80 lakh. The promoters have an established marketing channel and has prior experience in similar line of activity which shows a well established business. The demand for the rice is also stable with U.P. Supply Department as the major customer, which purchase 60% of the output under the levy scheme. The rest 40% of the output is sold in open market.Looking at the financial ratios and other aspects it was found that the current ratio and TOL/TNW of the unit was not satisfactory(Expected Norms-CR>=1.33 and TOL/TNW<=4:1) and not as per the norms of the Banks guidelines and also beyond the relaxable norms of TOL/TNW.In these conditions the borrower was notified to ensure the minimum benchmarks by a suitable date failing which penal interest of 1% p.a will be levied. As per loan policy FY 2012 the relaxation of TOL/TNW, Current Ratio, Interest Coverage, Margin on stocks & Book Debts, Debtor days shall be considered only when the overall asset coverage is not less than 1.5 times.Here the asset coverage ratio was 2.66 but as regards the existing accounts coming for renewals and/or need based additional limits,a softer approach with regard to extent of relaxation could be taken, based on the performance of the account, with a stipulation that those accounts should at least meet the relaxed norms as proposed above, before the next renewal.If the minimum norms in respect of overall asset coverage and internal rating are not met possibilities of exit from the account(s) would be explored.
To assess the working capital limit we use two methods Nayak Committee method or the second method of lending method.We use Nayak committee when the working capital requirement is less than five crores.If it is more than five crores then we use the second method of lending.So the calculations for assessing the working capital limit is as follows:-
Table 10. As per Turnover Method (Nayak Committee)S. No
Particulars For Estimated/ Projected Year ended as on 31/03/2013
1 Gross Sales 650.00
2 Working Capital Requirement (@ 25 % of Gross Sales)
162.50
3 Minimum stipulated Margin Money for Working Capital (@ 5 % of Gross Sales)
32.50
4 Projected net working capital 21.15
xlvi

5 Net Working Capital (3 or 4 whichever is higher) 32.50
6 Permissible Bank Borrowing (2 - 5) – Based on projected net working capital
130.00
Table 11. As per Second Method of Lending :S. No
Particulars For Estimated/ Projected Year ended as on 31/03/2013
1 Working Capital Gap 101.15
2 Minimum stipulated Margin Money for Working Capital (25% of Total Current Assets)
84.22
3 Projected net working capital 21.15
4 Net Working Capital (2 or 3 whichever is higher) 84.22
5 Permissible Bank Borrowing (1-4) - Based on projected net working capital
16.93
So as per Nayak Committee of lending, the renewal of working capital limit at existing level of Rs 80.00 lakh was recommended. As the actual net working capital of Rs 19.29 lakh is less than the minimum stipulated margin money of Rs 32.50 lakh,a suitable condition was stipulated that the borrower shall raise the deficit amount of Rs 13.21 lakh by increasing the partners capital latest by a suitable date failing which penal interest of 1% p.a will be levied.
xlvii

CHAPTER-5 RISK ASSESSMENT AT SIDBI
One of the most important procedures taken by financial institutes that offer credit to MSMEs is to scrutinize their credit rating status in order to get a clear picture of the creditworthiness of the enterprises. Credit rating is done on the basis of credit scores that are numerical values assigned to the MSMEs based on a statistical analysis to notify their credit worthiness. The government of India also operates a specialized rating agency known as the SME Rating Agency of India Limited (SMERA), which is a third-party rating agency exclusively set up for micro, small and medium enterprises in India for ratings on creditworthiness. It provides ratings which enable only MSME units to raise bank loans at competitive rates of interest.
Some of the important credit rating agencies working in India are CRISIL, CARE, ICRA, FITCH RATING, NDIA and ONICRA.
5.1 IMPORTANCE OF CREDIT RATING FOR MSME’s
Credit rating not only ensures the credibility of the SME, but also helps them to get interest relaxation against credit from banks even in future credit applications.
Credit rating assists the MSMEs in building their business credibility and hence, reduces the perceived risk of default from the banks’ perspective.
Credit rating also helps an MSME by getting more financial support as banks may increase their credit limits due to higher comfort factor in transacting with a well rated MSME.
The rating also allows the MSMEs to expand their market base, get new contracts from export markets.
5.2 SCOPE FOR CREDIT RATING
Credit worthiness may be further improved by increasing the level of transparency and process rigour in record keeping and financial reporting. Most micro enterprises are weak in this aspect and this may be greatly improved through rating. Rating involves analysis for which the starting point is the financial statement of the firm.
xlviii

Financing institutes also apply qualitative parameters extensively in gauging the credit worthiness of an MSME applicant since the financial statements furnished may not reflect the correct business strength. Such parameters would include typically organisation structure, background check of promoters (and family), management strength, resilience of the firm, quality of product, supplier and client network, trade relationships, previous credit defaults (by any director or kin), etc. Hence, maintaining transparency is of utmost importance in building credit worthiness. The other aspect is of having well-defined processes and adhering to them that would ensure quality of product, consistency of delivery, etc.
The credit scoring model used in SIDBI is Risk Assessment Model developed by CRISIL for measuring risks for both the servicing and manufacturing industry. The relevance of the different ratings are given in the table below.
Table 12.Ratings and their significance
Rating Significance
CR 1 HighestCR 2 HighCR 3 Above averageCR 4 AverageCR 5 Below average
Basically RAM does the company/project rating and facility rating. The company rating is done taking into consideration the overall health and financial stability of the company while facility rating is done in case of secured loans where we assess the value of the securities(both primary and collateral) which are taken by the bank while giving the loans.
For the case study explained above the scores as determined by the RAM model is given below. The models measure risk based on four major types of risks namely:-
1) INDUSTRY RISK
2) MANAGEMENT RISK
3) FINANCIAL RISK
4) BUSINESS RISK
xlix

5.3 RATING REPORT FOR ‘ABC’ COMPANY(CASE STUDY 1-MANUFACTURING COMPANY)
Model Name: SME ModelCompany Name :ABC CompanyIndustry Name: PLASTIC MOULDED GOODS
Table 13.RATING SUMMARY TABLE
Borrower Rating - Model Specific SME4Single Scale Borrower Rating SIDBI5Score 6Combined Rating CR3
Table 14. OBLIGOR RATING SUMMARY TABLE
Top Level Risk Entity Name
CURRENT LEVELGRADE SCORE
OVERALL RATING SME46
OVERALL PROJECT RISK SME4 6
POST PROJECT IMPLEMENTATION RISK
6.31
PROJECT IMPLEMENTATION RISK6.15
OVERALL COMPANY RATING SME4 5.88
Score Type: Company
INDUSTRY RISKIII 6.57
MANAGEMENT RISKIII 7.11
FINANCIAL RISKVI 3.15
BUSINESS RISKIII 6.65
Score Type: Company
INDUSTRY RISK – PROJECTIII 6.57
FUNDING RISKP2 6
CONSTRUCTION RISKP2 6.3
FINANCIAL RISK – PROJECTV 4.86
MANAGEMENT RISK – PROJECTIII 7.11
III 6.67
l

BUSINESS RISK – PROJECT
Overall Weighted RiskScore Range
RiskGrade
Grade Description Degree Of Safety W.R.T Debt Serving Capacity
5.85 - 6.50 SME4 Investment GradeChanges in circumstances are more likely to lead to weakened debt servicing capacity than for highergrades. Degree of safety with respect to Debt servicing capacity is moderate.
COMPARISON OF SCORES OF THE COMPANY AND THE PROJECT
INDUSTRY RISK
Industry Risk Overall Score GradeCompany 6.57 IIIProject 6.57 III
li

012345678
8 8
6
8 8
6
2
8 8
6
8 8
6
2
Company Project
BUSINESS RISK
Business Risk Overall Score GradeCompany 6.65 IIIProject 6.67 III
a) MARKET POSITION(50% WEIGHTAGE)
Market Position Overall Score GradeCompany 6.29 -Project 6 -
lii

012345678
6 6
8 8
6 6
4
6 6
4
Company Project
N.A
Note: The parameter ‘Assessment of immediate buyers’ will be judged for the company as a whole and not for the project because the project is the addition of an extra machine in the production line so the buyers for the company as a whole is judged.
b) OPERATING EFFICIENCY(50% WEIGHTAGE)
Operating efficiency Overall Score GradeCompany 7 -Project 7.33 -
liii

012345678
8 8
6
8
6
8
6 6
Company Project
NA NA
FINANCIAL RISK
Financial Risk Overall Score GradeCompany 3.15 VIProject 4.86 V
a) FINANCIAL FLEXIBILITY(20% WEIGHTAGE)-Company score-6
Ability to raise debt Ability to raise equity0123456
6 6
Company
b) PAST FINANCIALS(70% WEIGHTAGE)-company score-2.1
liv

Networth
Current R
atio
Return
on capita
l employe
d
Net Pro
fit Marg
in
Cash Pro
fits/To
tal Deb
t
Inventory
and Rece
ivables
to Sa
les
Interest
Coverag
e
Total
Outsi
de Liab
ilities/
Tangib
le Netw
orth012345678
2
6
2
8
0 0
4
0
Capital
c) FUTURE FINANCIALS(10% WEIGHTAGE)-company score-4.8
0
2
4
6
8
10
4
02
810
4
8
2
Company
FINANCIAL RISK-PROJECT
lv

0123456789
10
0
10
2
6
4
10
8
project
MANAGEMENT RISK
Management Risk Overall Score GradeCompany 7.11 IIIProject 7.11 III
lvi

0
1
2
3
4
5
6
7
8
9
10
6 6 6 6
8 8 8
6
10
6 6 6
8 8
10
Company Project
CONSTRUCTION RISK(PROJ)-6.3(P2)
lvii
012345678 6
8
6 6 6
Project
FUNDING RISK(PROJECT)-6(P2)
Tie-up of Funds Financial flexibility0
2
4
6
6 6
Project
FACILITY RATING REPORT
In the case of the company ‘ABC’ the total term loan given is 57 lakh against the total value of security of 118.27lakh which comprises of primary and collateral security.
Primary security-Hypothecation of the plant and machinery which are to be purchased by the company from the term loan granted. The total value comes out to be Rs 93.27 lakh.
lviii

Collateral security- Mortgage of immovable property of the owners of the company worth Rs 25 lakh.
5.4 COMPARISON OF RAM MODEL OF MANUFACTURING AND SERVICE INDUSTRY
Here we will compare the RAM model of a manufacturing company( a company manufacturing plastic moulded goods) and the RAM model of a company in the service sector(healthcare company).
COMPANY RATING/PROJECT RATING
While assessing the company/project as a whole the weightages for the four types of parameters namely industry, business, financial and management risk for both the sectors is the same. The pie-chart below shows the weightages of the different parameters.
15%
35%25%
25%
RISK WEIGHTAGES
INDUSTRY RISKBUSINESS RISKFINANCIAL RISKMANAGEMENT RISK
INDUSTRY RISK
lix

02468
101214161820
14.29 14.29 14.29 14.29 14.29 14.29 14.29
0
20 20 20
0
20
0 0
20
Manufacturing Industry
Service Industry
COMMENTS
It is seen from the above bar graph that for the manufacturing sector the RAM model considers seven important parameters in equal proportions to measure the industry risk. However for the service sector the model considers five important parameters in equal proportions. Though environment is affected by the wastes from healthcare units but this impact is considerably less than the environmental issues linked with pollution from manufacturing things therefore weightage is given to this parameter for the manufacturing sector and not for the service sector. Length of the operating cycle is mainly seen in the manufacturing sector.As far as input related risks are concerned the manufacturing sector is predominated by the availability of raw materials so input related risks are high in manufacturing industry.In the service sector availability of skilled human resources is the main requirement so input related risks are considerably less in the service sector.
BUSINESS RISK
a) MARKET POSITION(50% WEIGHTAGE)
lx

Geogra
phical R
each
Of E
ntity
Position O
f entry
in its
targe
t mark
et
Proxim
ity to
custo
mers
Assessm
ent o
f immed
iate b
uyers
Sellin
g term
s and Dep
endan
ce on Custo
mers
Marketi
ng and se
lling a
rrange
ment
Critical
ity of th
e componen
t man
ufactured
Manag
emen
t of fu
nds/rece
ivables
Perceiv
ed Se
rvice
Quality
Capab
ility/P
otential
for Innova
tion/Crea
tivity
0
2
4
6
8
10
12
14
1612.5 12.5 12.5 12.5 12.5 12.5 12.5 12.5
0 00 0 0
14.29 14.29 14.29
Manufacturing Industry
Service Industry
COMMENTS-The hospital under consideration has a monopoly in its area so proximity to customers and marketing and selling arrangements are not given any weightage because it is having customers from the whole area. Since no component is manufactured in the service sector the parameter ‘criticality of the component manufactured’ is not considered. Moreover the quality of service is considered in the service sector so the parameter ‘perceived service quality’ is not considered in the manufacturing sector. The parameter ‘Capability/Potential for Innovation/Creativity’ is predominant in the service sector because creative means of servicing in the healthcare industry can lead to better treatments and can boost the profitability of the business. However in the concerned manufacturing sector there is a predefined procedure of production so this parameter is of less importance here.
OPERATING EFFICIENCY(50% WEIGHTAGE)
lxi
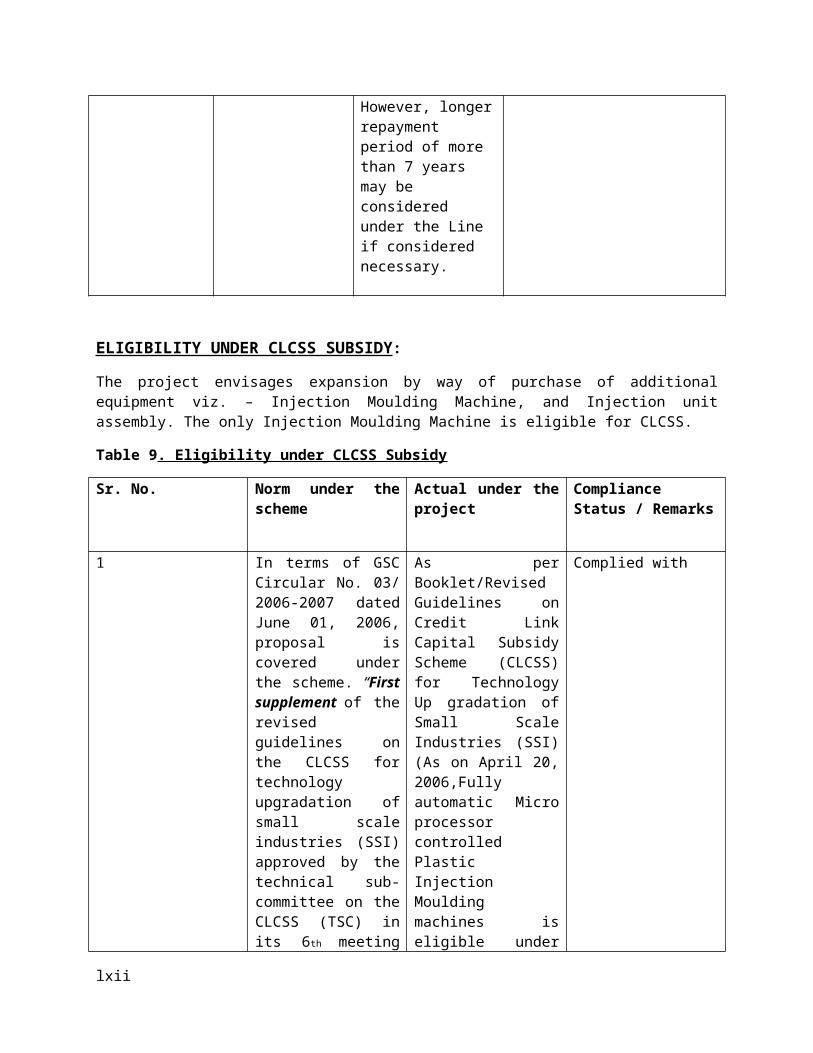
02468
101214161820
12.5 12.5 12.5 12.5 12.5 12.5 12.5 12.5
0
20 20
0 0
20
Manufacturing Industry
Service Industry
COMMENTS-As discussed above the consideration of environmental risk in the healthcare industry is negligible as compared to the manufacturing industry. Since the raw materials used are not that significant as compared to the availability of skilled manpower therefore the parameter ‘trend in the unit price of raw materials’ is not given so much importance in the service sector as compared to the manufacturing sector. In an industry manufacturing plastic moulded items the technology and the machinery used to manufacture plays a key role. The turnover of unskilled workers is not so significant as they can be easily replaced in the manufacturing sector. However in a service industry where the skilled manpower plays a key role the turnover if high can prove detrimental to the business therefore this parameter is given more importance in the healthcare industry than in the industry manufacturing plastic moulded items.
The parameter ‘Availability of power and other utilities’ is given more importance in the industry manufacturing plastic moulded items since power and fuel is the key ingredient in the manufacture of plastic items.However in the healthcare industry predominated by skilled manpower this parameter is of less importance.
lxii

FINANCIAL RISK
a) FINANCIAL FLEXIBILITY(20% WEIGHTAGE)
Ability to raise debt Ability to raise equity0
10
20
30
40
50
50 5050 50Manufacturing In-dustry
Service Industry
b) PAST FINANCIALS(70% WEIGHTAGE)
Networth
Current R
atio
Return
on capita
l employe
d
Net Pro
fit Marg
in
Cash Pro
fits/To
tal Deb
t
Inventory
and Rece
ivables
to Sa
les
Interest
Coverag
e
Total
Outsi
de Liab
ilities/
Tangib
le Netw
orth
Unhedge
d Forei
gn Ex
chan
ge Risk
0
5
10
15
20
25
10
20
5 5
10
20
5
25
0
7.55 5
17.5
5 5
Manufacturing In-dustry
Service Industry
COMMENTS-In the case of the concerned manufacturing unit there are no export/import dealings therefore there are no issues of unhedged foreign exchange
lxiii

risk.But in the case of the the concerned service unit the unit deals with foreign clients also so there can be a little risk pertaining to this parameter.
c) FUTURE FINANCIALS(10% WEIGHTAGE)
Interest
Coverag
e
TOL/T
NW
Networth
Inventory
and Rece
ivables
to Sa
les
Current R
atio
Return
On Cap
ital E
mployed
Net Pro
fit Marg
in
Cash Pro
fits/To
tal Deb
t0
5
10
15
20
25
5
25
10
20 20
5 5
10
5
10
20
5 5
Manufacturing In-dustryService Industry
lxiv

MANAGEMENT RISK
0
2
4
6
8
10
12
14
16
11.1111.11
11.1111.11 11.11 11.11 11.11 11.11
11.11
14.285 14.285
0 0
14.285
Manufacturing Industry
Service Industry
COMMENTS
Since the concerned service unit is managed by only one person therefore the parameters ‘Credentials, background and experience of the promoters’ and ‘Group support’ is not taken into consideration.
lxv
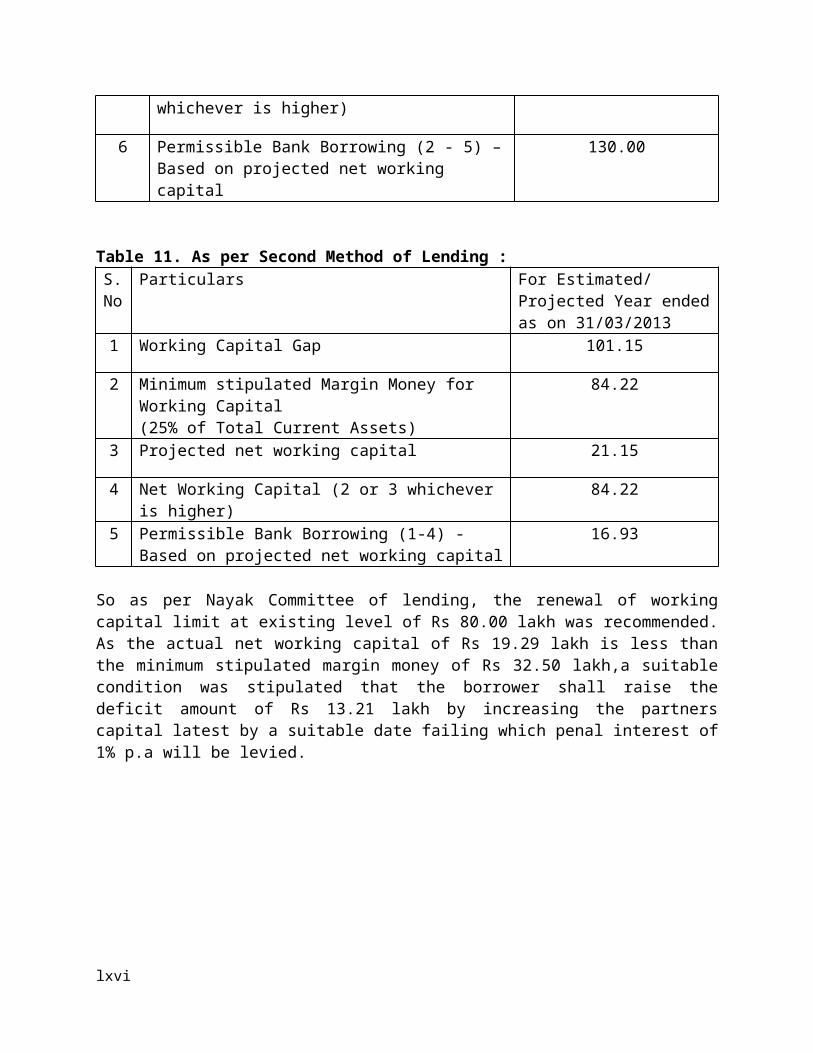
CHAPTER-6
CONCLUSION AND SUGGESTIONS
This chapter deals with the findings, conclusions and suggestions of the report so that relevant facts does not get lost in heap of information generated during the analysis and the interviews.
6.1 MAJOR FINDINGS
The study of project appraisal for MSME’s revealed that in many cases the balance sheets and P/L accounts were not maintained properly and accurately. This constraint made it difficult for SIDBI to conduct the financial appraisal correctly and accurately and in most cases the loan was sanctioned based on the bank’s perception of the management and the business.
The projections made by the borrower as well as the bank was not based on any clear trend analysis but it was mostly done based on perceptions. This constraint therefore could not predict the profitability figures, DSCR and other important parameters accurately.
While rating the proposals for term loan, working capital and term loan-working capital it was seen that the scoring for the different parameters was done on a 0-10 point scale. Therefore rating the qualitative parameters like industry, business and management risks were purely subjective.
In most cases it was found that SIDBI tried to assist maximum number of MSME’s so it was seen that to improve the rating the qualitative parameters were manipulated to increase the overall scoring.
The general rule that if IRR(Post tax-12.66% and pre-tax-16.95%) > rate of interest (cost of capital), then accept the project is applicable here as rate of interest in 10.33%.
It was found that for riskier projects(new projects) the rating model used was RAM which was a bit more detailed in terms of the number of parameters in each type of risk. While for already existing projects the rating model used was CART. In many cases it was found that this rule was not applied and some riskier projects were rated by CART which could not assess the risk properly.
In a particular case it was seen that a borrower had defaulted and was unable to pay back the loan amount. Initially it was given a rating of CR3 and when it was rated again the rating came to be CR4.In case of CR4 rating the rate of interest to be charged would become higher. Since the borrower was already not in a position to pay back therefore it was tried to manipulate the rating and keep it to its original
lxvi

rating CR3.Therefore it was seen that strict measures like taking the primary and collateral security was not applied here.
6.2 SUGGESTIONS OF THE STUDY
Proper trend analysis should be done to project the sales figures for the upcoming years.
Care should be taken while scoring the qualitative parameters as these can be easily manipulated so that accurate risk can be assessed.
Since risk assessment plays an important role in the disbursement of loans therefore SIDBI can take help of an external agency to assess the risk properly rather than doing it themselves so that the rating is not biased and preconceived.
6.3 LIMITATIONS OF THE STUDY
The comparison of the parameters for the manufacturing and service sector was based on 5-6 rating reports of each sector. Therefore an attempt is made to cover a majority of the parameters taken into consideration for each sector but all the parameters may not be covered.
In most cases due to the time limitations of the SIDBI officials some of the information obtained may not be complete. However an attempt is made to present a majority of the information learned and analyzed.
6.4 FURTHER SCOPE OF THE STUDY
As it is known no study is an end in itself, scope exists for further exploration of the study. So, more samples can be studied and an in-depth analysis can be carried out about the parameters of the risk model and the project appraisal aspects. The scope could be increased by taking projects of different industries, from different countries and in different regions of India itself.
lxvii

ANNEXURE
BALANCE SHEET OF THE FIRM
(Rs. lakh)
AS ON AS ON AS ON AS ON 31-
Mar-10
31-Mar-11
31-Mar-12
9/30/2012
FIXED AND NON-CURRENT ASSETS
AUDITED
AUDITED
AUDITED
PROV.
1 Gross Block (a) Land 60.89 60.89 (b) Buildings 45.63 45.00 (c) Plant & Machinery 141.07 146.65 (d) Others 13.66 17.74 Gross Fixed Assets 0.00 0.00 261.25 270.282 Less: Depreciation to date 4.01 8.523 Less: Revaluation Reserves 4 Net Fixed Assets (1-2-3) 0.00 0.00 257.24 261.765 Capital Work-in-Progress (Incl. adv. for
capex) 4.16
6 Non Current Assets (a) Sundry debtors over 6 months 18.32 1.65 (b) Investment/ Advances to Group
Cos./ Subsidiaries
(c) Other Investments (d) Deferred Tax Assets 1.05 (e) Security Deposits 2.50 2.52 (f) Others 1.02 34.90 Sub-total 0.00 0.00 21.84 40.127 Total Fixed and Non-Current Assets
(4+5+6)0.00 0.00 279.08 306.04
CURRENT ASSETS 8 Inventory a) Raw Materials 22.40 2.40 b) Stock-in-Process (SIP) c) Finished goods 20.40 72.20 d) Consumable Stores & Spares 2.43 3.64 Total Inventory 0.00 0.00 45.23 78.249 Sundry Debtors less than 6 months 10.5710 Advances to Suppliers of RM and
lxviii

Stores/ Spares11 Investments 12 Cash & Bank Balances 45.00 40.8513 Loans and Other Advances 0.01 14 Other Current Assets 0.34 15 Total Current Assets (8 to 14) 0.00 0.00 90.58 129.66 CURRENT LIABILITIES 16 Sundry Creditors 4.22 8.5617 Bank Borrowings for Working Capital 38.15 49.9518 Instalments (Payable in one year) (a) SIDBI Term Loan(s) (b) Other Term Loan(s) 25.00 20.00 (c) Deferred Payment Credits (d) Interest Bearing Unsecured
Loans
(e) Interest Free Unsecured Loans Sub-total 0.00 0.00 25.00 20.0019 Advances 20 Provisions 0.22 1.2521 Other Current Liabilities 4.39 3.3222 Total Current Liabilities (16 to 21) 0.00 0.00 71.98 83.0823 Net Working Capital (Surplus of CA
over CL) (15-22)0.00 0.00 18.60 46.58
24 Net Tangible Assets (7+23) 0.00 0.00 297.68 352.62 LONG TERM LIABILITIES 25 SIDBI Term Loan(s) 26 Other Term Loan(s) 109.26 102.4727 Deferred Payment Credits 28 Interest Bearing Unsecured Loans 132.92 29 Interest Free Unsecured Loans 190.4230 Other Long Term Liability 31 Deferred Tax Liabilities 0.75 1.5632 Total Long Term Liabilities (25 to 31) 0.00 0.00 242.93 294.4533 Net Worth (24-32) 0.00 0.00 54.75 58.17 Networth represented by 34 Equity Share Capital 50.40 50.4035 Equity Share Capital- SIDBI / Others 36 Preference Share Capital 37 Reserves & Surplus 4.3538 Subsidies 39 Profit & Loss Account (only credit
balance) 4.35 4.61
lxix

40 Less: Intangibles/ Misc. / Prelim. / Def.Rev.Exp. not written off
1.19
41 Less: Accumulated Losses 42 Net Worth (34+35+36+37+38+39-40-
41)0.00 0.00 54.75 58.17
43 Contingent Liabilities (Rs. lakh) 44 Repayment of loan during the year
(Rs. lakh) 0.00 0.00 25.00
P/L ACCOUNT OF THE FIRM
lxx
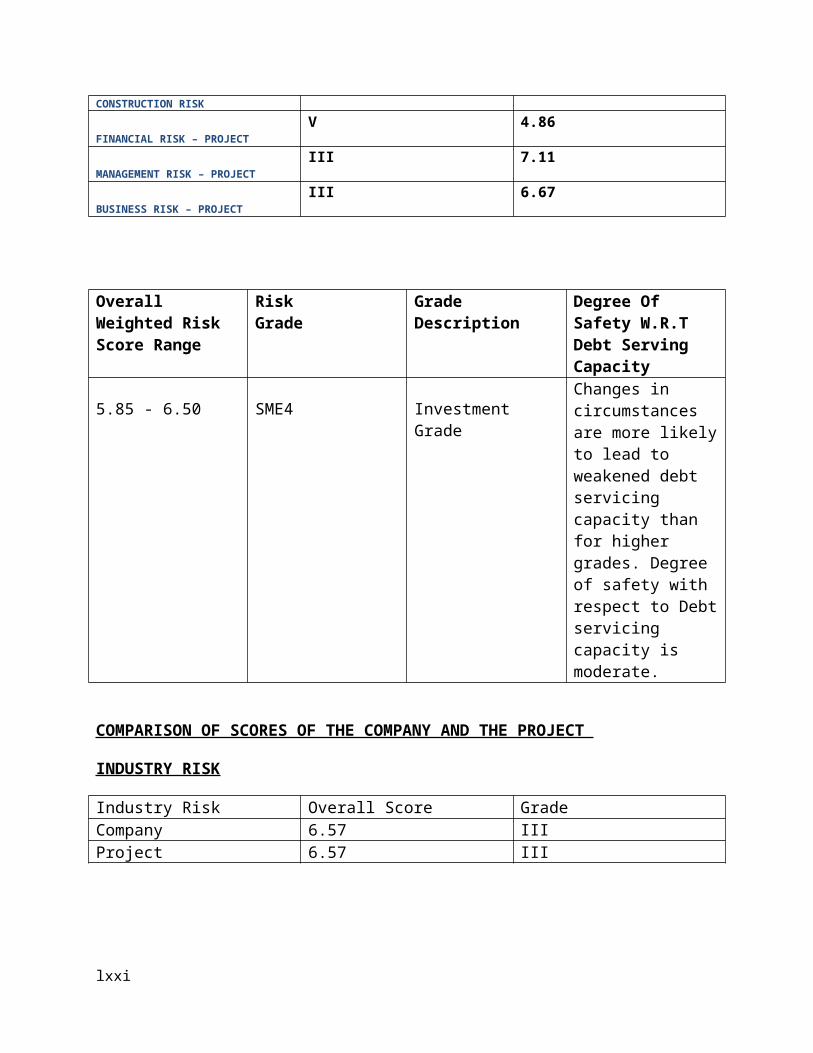
(Rs. lakh)
Period ended on
3/31/2010 3/31/2011 3/31/2012 9/30/2012
SALES/ TOTAL INCOME AUDITED AUDITED AUDITED PROV.
Capacity Utilisation (%) 40.00% 45.00%No of Months 12 12 12 6Gross Sales
1 Domestic Sales 78.11 55.952 Export Sales3 Gross Sales (1+2) 0.00 0.00 78.11 55.954 Less : Excise Duty5 Net Sales (3-4) 0.00 0.00 78.11 55.95
% age rise or fall in net sales N.A. N.A. -28.37%6 Income from Job Work7 Other Operational Income8 Total Income (5+6+7) 0.00 0.00 78.11 55.95
COST OF PRODUCTION/ SALES9 Raw Material Consumed 56.95 57.9110 Consumable Stores & Spares 4.73 3.4011 Power, Fuel & Other Utilities 13.00 17.7812 Factory Salaries & Wages 5.05 5.9413 Repairs & Maintenance 0.05 0.0414 Other Manufacturing Expenses15 Other Variable Expenses16 Depreciation 4.01 4.5117 Sub-total (9 to 16) 0.00 0.00 83.79 89.5818 Add: Opening Stock in Process19 Less: Closing Stock in Process20 Cost of Production (17+18-19) 0.00 0.00 83.79 89.5821 Add: Opening Stock of Finished Goods 0.00 20.3922 Less: Closing Stock of Finished Goods 20.39 72.2023 Cost of Sales (20+21-22) 0.00 0.00 63.40 37.7724 Selling, Packing & Distribution Expenses 0.95 0.8925 Administrative & Misc. Expenses26 Sub-total (23+24+25) 0.00 0.00 64.35 38.6627 Profit before Interest, Lease Rentals (PBIT) (8-26) 0.00 0.00 13.76 17.2928 Interest on SIDBI Term Loan(s)29 Interest on Other Term Loan(s)30 Interest on Interest Bearing Unsecured Loans31 Interest on Bank Borrowing 16.18 10.4832 Lease Rentals33 Operating Profit (27-28-29-30-31-32) 0.00 0.00 -2.42 6.8134 Misc. exp. / def. rev. exp. / prelim. exp. Written off 0.1735 Non-operational Income/ Expenses 8.72 0.0336 Profit before Tax (PBT) (33-34+35) 0.00 0.00 6.30 6.6737 Provision for Taxation 1.95 2.0638 Profit after Tax (PAT) (36-37) 0.00 0.00 4.35 4.6139 Dividend40 Retained Earnings (38-39) 0.00 0.00 4.35 4.6141 Gross Cash Accruals (16+34+38) 0.00 0.00 8.36 9.2942 Net Cash Accruals (16+34+40) 0.00 0.00 8.36 9.29
43 Net Forex Inflows (Rs. lakh)
For the year ended on
PROJECTED BALANCE SHEET OF THE FIRM
lxxi

(Rs. lakh)As on As on Impl. As on As on As on As on As on As on As on As on As on As on
3/31/2011 3/31/2012 Period 3/31/2013 3/31/2014 3/31/2015 3/31/2016 3/31/2017 3/31/2018 3/31/2019 3/31/2020 3/31/2021 3/31/2022
A. LIABILITIESEquity Share Capital 0.00 50.40 36.30 86.70 86.70 86.70 86.70 86.70 86.70 86.70 86.70 86.70 86.70Preference Share Capital 0.00 0.00 0.00 0.00 0.00 0.00 0.00 0.00 0.00 0.00 0.00 0.00 0.00Equity Share Capital- SIDBI/ Others 0.00 0.00 0.00 0.00 0.00 0.00 0.00 0.00 0.00 0.00 0.00 0.00 0.00Reserves & Surplus 0.00 4.35 0.00 14.13 35.96 64.21 95.36 133.61 178.21 221.30 262.92 303.14 341.89Interest free Unsecured Loans 0.00 0.00 0.00 50.00 50.00 50.00 50.00 50.00 50.00 50.00 50.00 50.00 50.00Subsidy 0.00 0.00 0.00 0.00 0.00 0.00 0.00 0.00 0.00 0.00 0.00 0.00 0.00Quasi-Equity Others (Pl Specify) 0.00 0.00 0.00 0.00 0.00 0.00 0.00 0.00 0.00 0.00 0.00SIDBI Term Loan(s)-Existing 0.00 0.00 0.00 0.00 0.00 0.00 0.00 0.00 0.00 0.00 0.00 0.00Other Term Loan(s)-Existing 0.00 134.26 109.26 84.26 59.26 34.26 9.26 0.00 0.00 0.00 0.00 0.00Deferred Payment Credits-Existing 0.00 0.00 0.00 0.00 0.00 0.00 0.00 0.00 0.00 0.00 0.00 0.00Interest Bearing Unsecured Loans-Existing 0.00 132.92 132.92 132.92 132.92 132.92 132.92 132.92 132.92 132.92 132.92 132.92SIDBI Term Loan-Proposed 57.00 57.00 48.45 37.05 25.65 14.25 2.85 0.00 0.00 0.00 0.00Term Loan from Other Banks-Proposed 0.00 0.00 0.00 0.00 0.00 0.00 0.00 0.00 0.00 0.00 0.00Interest Bearing Unsecured Loans-Proposed 0.00 0.00 0.00 0.00 0.00 0.00 0.00 0.00 0.00 0.00 0.00Other Long Term Liabilities 0.00 0.75 0.75 0.75 0.75 0.75 0.75 0.75 0.75 0.75 0.75 0.75Bank Borrowings for WC 0.00 38.15 44.85 62.26 72.30 76.44 81.23 86.00 86.00 86.00 86.00 86.00Current Liabilities 0.00 8.83 9.77 12.88 14.89 15.70 16.50 17.31 17.31 17.31 17.31 17.31
TOTAL LIABILITIES 0.00 369.66 93.30 505.38 514.18 518.08 517.78 525.22 554.74 594.98 636.60 676.82 715.57
B. ASSETSGross Block 0.00 261.25 93.27 354.52 354.52 354.52 354.52 354.52 354.52 354.52 354.52 354.52 354.52Less : Depreciation to date 0.00 4.01 0.00 17.52 31.03 44.54 58.05 71.56 85.07 98.58 112.09 125.60 139.11Net Fixed Assets 0.00 257.24 93.27 337.00 323.49 309.98 296.47 282.96 269.45 255.94 242.43 228.92 215.41Non Current Assets 0.00 3.52 3.52 3.52 3.52 3.52 3.52 3.52 3.52 3.52 3.52 3.52Current Assets 0.00 63.90 65.83 90.70 105.26 111.25 118.04 124.81 124.81 124.81 124.81 124.81Cash & Bank Balance 0.00 45.00 0.03 99.03 96.47 99.32 106.54 120.70 156.96 210.71 265.84 319.57 371.83Misc. / Prelim. / Def. rev. exp. not written off 0.00 0.00 0.00 0.00 0.00 0.00 0.00 0.00 0.00 0.00 0.00 0.00 0.00 TOTAL ASSETS 0.00 369.66 93.30 505.38 514.18 518.08 517.78 525.22 554.74 594.98 636.60 676.82 715.57
Current Ratio (not considering instalments of T/L as CL)
N.A. 1.93 3.02 2.49 2.35 2.36 2.44 2.73 3.25 3.78 4.30 4.81
Current Ratio (considering instalments of T/L as CL)
N.A. 1.26 1.87 1.68 1.66 1.69 2.02 2.65 3.25 3.78 4.30 4.81
Debt Equity Ratio N.A. 4.89 1.57 3.47 2.58 1.86 1.34 0.94 0.70 0.60 0.53 0.47 0.43Debt Equity Ratio (Considering Interest Free Unsecured Loans as Quasi Equity)
N.A. 4.89 1.57 1.99 1.54 1.14 0.83 0.58 0.43 0.37 0.33 0.30 0.28
TOL/ TNW N.A. 5.75 4.01 3.19 2.43 1.84 1.38 1.09 0.93 0.82 0.74 0.67
PROJECTED P/L ACCOUNT OF THE FIRM
lxxii

(Rs. lakh)FY2011 FY2012 FY2013 FY2014 FY2015 FY2016 FY2017 FY2018 FY2019 FY2020 FY2021 FY2022
Production Capacity Utilisation NA 40% 45.00% 55.00% 65.00% 75.00% 80.00% 80.00% 80.00% 80.00% 80.00% 80.00%Sales as percentage of Installed Capacity 40.36% 53.50% 63.50% 73.50% 79.25% 80.00% 80.00% 80.00% 80.00% 80.00%SALES/ TOTAL INCOMEGross Domestic Sales 0.00 78.11 224.22 311.27 361.46 382.20 406.16 430.00 430.00 430.00 430.00 430.00Less : Excise Duty 0.00 0.00 0.00 0.00 0.00 0.00 0.00 0.00 0.00 0.00 0.00 0.00Net Domestic Sales 0.00 78.11 224.22 311.27 361.46 382.20 406.16 430.00 430.00 430.00 430.00 430.00Export Sales 0.00 0.00 0.00 0.00 0.00 0.00 0.00 0.00 0.00 0.00 0.00 0.00Net Sales 0.00 78.11 224.22 311.27 361.46 382.20 406.16 430.00 430.00 430.00 430.00 430.00Income from Job Work 0.00 0.00 0.00 0.00 0.00 0.00 0.00 0.00 0.00 0.00 0.00 0.00Other Operational Income 0.00 0.00 0.00 0.00 0.00 0.00 0.00 0.00 0.00 0.00 0.00 0.00Total Income 0.00 78.11 224.22 311.27 361.46 382.20 406.16 430.00 430.00 430.00 430.00 430.00
COST OF PRODUCTION/ SALESRaw Material Consumed 0.00 56.95 162.50 211.20 244.20 257.40 270.60 283.80 283.80 283.80 283.80 283.80Consumable Stores & Spares 0.00 4.73 5.00 9.60 11.10 11.70 12.30 12.90 12.90 12.90 12.90 12.90Power, Fuel & Other Utilities (Fixed) 0.00 13.00 3.13 5.60 6.48 6.83 7.18 7.53 7.53 7.53 7.53 7.53Power, Fuel & Other Utilities (Variable) 9.38 16.80 19.43 20.48 21.53 22.58 22.58 22.58 22.58 22.58Factory Salaries & Wages (Fixed) 0.00 5.05 1.25 1.76 2.24 2.60 3.00 3.46 3.81 4.19 4.61 5.07Factory Salaries & Wages (Variable) 3.75 5.28 6.72 7.79 9.00 10.39 11.43 12.57 13.83 15.21Repairs & Maintenance 0.00 0.05 0.13 0.18 0.22 0.26 0.30 0.35 0.38 0.42 0.46 0.51Other Manufacturing Expenses 0.00 0.00 0.00 0.00 0.00 0.00 0.00 0.00 0.00 0.00 0.00 0.00Other Variable Expenses 0.00 0.00 0.00 0.00 0.00 0.00 0.00 0.00 0.00 0.00 0.00 0.00Depreciation 0.00 4.01 13.51 13.51 13.51 13.51 13.51 13.51 13.51 13.51 13.51 13.51Sub-total 0.00 83.79 198.65 263.93 303.90 320.57 337.42 354.52 355.94 357.50 359.22 361.11Add: Opening Stock in Process 0.00 0.00 0.00 0.00 0.00 0.00 0.00 0.00 0.00 0.00 0.00 0.00Less: Closing Stock in Process 0.00 0.00 0.00 0.00 0.00 0.00 0.00 0.00 0.00 0.00 0.00 0.00Cost of Production 0.00 83.79 198.65 263.93 303.90 320.57 337.42 354.52 355.94 357.50 359.22 361.11Add: Opening Stock of Finished Goods 0.00 0.00 20.39 28.57 38.15 44.61 47.63 50.22 52.79 53.31 53.58 53.84Less: Closing Stock of Finished Goods 0.00 20.39 28.57 38.15 44.61 47.63 50.22 52.79 53.31 53.58 53.84 54.12Cost of Sales 0.00 63.40 190.47 254.35 297.44 317.55 334.83 351.95 355.42 357.23 358.96 360.83Selling, Packing & Distri. Expenses (Fixed) 0.00 0.95 0.56 0.78 0.90 0.96 1.02 1.08 1.08 1.08 1.08 1.08Selling, Packing & Distri. Expenses (Variable) 1.68 2.33 2.71 2.87 3.05 3.23 3.23 3.23 3.23 3.23Administrative & Misc. Expenses 0.00 0.00 0.22 0.93 1.08 1.15 1.22 1.29 1.29 1.29 1.29 1.29Sub-total 0.00 64.35 192.93 258.39 302.13 322.53 340.12 357.55 361.02 362.83 364.56 366.43Profit before Interest, Lease Rentals (PBIT) 0.00 13.76 31.29 52.88 59.33 59.67 66.04 72.45 68.98 67.17 65.44 63.57Interest on SIDBI Term Loan(s) 0.00 0.00 2.36 6.70 5.32 3.91 2.47 1.05 0.04 0.00 0.00 0.00Interest on Other Term Loan(s) 0.00 0.00 18.26 14.51 10.76 7.01 3.26 0.69 0.00 0.00 0.00 0.00Interest on Interest Bearing Unsecured Loans 0.00 0.00 0.00 0.00 0.00 0.00 0.00 0.00 0.00 0.00 0.00 0.00Interest on Bank Borrowing 0.00 16.18 6.73 9.34 10.85 11.47 12.18 12.90 12.90 12.90 12.90 12.90Lease Rentals 0.00 0.00 0.00 0.00 0.00 0.00 0.00 0.00 0.00 0.00 0.00 0.00Operating Profit 0.00 -2.42 3.94 22.33 32.40 37.28 48.13 57.81 56.04 54.27 52.54 50.67Misc. exp. / def. rev. exp. / prelim. exp. Written off 0.00 0.00 0.00 0.00 0.00 0.00 0.00 0.00 0.00 0.00 0.00 0.00Non-operational Income 0.00 8.72 10.00 10.00 10.00 10.00 10.00 10.00 10.00 10.00 10.00 10.00Profit before Tax (PBT) 0.00 6.30 13.94 32.33 42.40 47.28 58.13 67.81 66.04 64.27 62.54 60.67Provision for Taxation 0.00 1.95 4.16 10.50 14.15 16.13 19.88 23.21 22.95 22.65 22.32 21.92Profit after Tax (PAT) 0.00 4.35 9.78 21.83 28.25 31.15 38.25 44.60 43.09 41.62 40.22 38.75Dividend 0.00 0.00 0.00 0.00 0.00 0.00 0.00 0.00 0.00 0.00 0.00 0.00Retained Earnings 0.00 4.35 9.78 21.83 28.25 31.15 38.25 44.60 43.09 41.62 40.22 38.75Gross Cash Accruals 0.00 8.36 23.29 35.34 41.76 44.66 51.76 58.11 56.60 55.13 53.73 52.26Net Cash Accruals 0.00 8.36 23.29 35.34 41.76 44.66 51.76 58.11 56.60 55.13 53.73 52.26PBDIT/ Total Income (%) NA 22.75% 19.98% 21.33% 20.15% 19.15% 19.59% 19.99% 19.18% 18.76% 18.36% 17.93%Operating Profit/ Total Income (%) NA -3.10% 1.76% 7.17% 8.96% 9.75% 11.85% 13.44% 13.03% 12.62% 12.22% 11.78%Net Profit/ Total income (%) NA 5.57% 4.36% 7.01% 7.82% 8.15% 9.42% 10.37% 10.02% 9.68% 9.35% 9.01%Raw Material Cost/ Cost of Production (%) NA 67.97% 81.80% 80.02% 80.36% 80.29% 80.20% 80.05% 79.73% 79.38% 79.00% 78.59%Cost of Production/ Net Sales (%) NA 107.27% 88.60% 84.79% 84.08% 83.87% 83.08% 82.45% 82.78% 83.14% 83.54% 83.98%Cost of Sales/ Net Sales (%) NA 81.17% 84.95% 81.71% 82.29% 83.08% 82.44% 81.85% 82.66% 83.08% 83.48% 83.91%Interest Coverage Ratio NA 0.85 1.14 1.73 2.20 2.67 3.69 4.95 5.33 5.21 5.07 4.93Return on Capital Employed (ROCE) (%) N.A. 6.23% 10.41% 15.53% 17.17% 17.61% 19.60% 21.67% 21.52% 21.83% 22.19% 22.54%
CALCULATION OF DSCR
lxxiii

FY2013 FY2014 FY2015 FY2016 FY2017 FY2018 FY2019 FY2020 FY2021 FY2022 TOTAL
Net Profit After Tax 9.78 21.83 28.25 31.15 38.25 44.60 10.77 NA NA NANon-cash Charges 13.51 13.51 13.51 13.51 13.51 13.51 3.38 NA NA NAInterest on SIDBI Term Loan 2.36 6.70 5.32 3.91 2.47 1.05 0.04 0.00 0.00 0.00Interest on Other Term Loan(s) 18.26 14.51 10.76 7.01 3.26 0.69 0.00 0.00 0.00 0.00Interest on Interest Bearing Unsecured Loans 0.00 0.00 0.00 0.00 0.00 0.00 0.00 NA NA NALease Rentals 0.00 0.00 0.00 0.00 0.00 0.00 0.00 NA NA NA
TOTAL A 43.91 56.55 57.84 55.58 57.49 59.85 14.19 0.00 0.00 0.00 345.41
Interest on SIDBI Term Loan 2.36 6.70 5.32 3.91 2.47 1.05 0.04 0.00 0.00 0.00Interest on Other Term Loan(s) 18.26 14.51 10.76 7.01 3.26 0.69 0.00 0.00 0.00 0.00Interest on Interest Bearing Unsecured Loans 0.00 0.00 0.00 0.00 0.00 0.00 0.00 NA NA NARepayment of SIDBI Term Loan 0.00 8.55 11.40 11.40 11.40 11.40 2.85 0.00 0.00 0.00 57.00Repayment of Term Loans from Other Banks 25.00 25.00 25.00 25.00 25.00 9.26 0.00 0.00 0.00 0.00 134.26Repayment of Interest Bearing Unsecured Loans 0.00 0.00 0.00 0.00 0.00 0.00 0.00 0.00 0.00 0.00 0.00Lease Rentals 0.00 0.00 0.00 0.00 0.00 0.00 0.00 NA NA NA
TOTAL B 45.62 54.76 52.48 47.32 42.13 22.40 2.89 0.00 0.00 0.00 267.60
DSCR 0.96 1.03 1.10 1.17 1.36 2.67 4.91 NA NA NA 1.29
Average DSCR 1.29
CALCULATION OF BREAKEVEN POINT
lxxiv

(Rs. lakh)FY2013 FY2014 FY2015 FY2016 FY2017 FY2018 FY2019 FY2020 FY2021 FY2022
Production Capacity Utilisation 45.00% 55.00% 65.00% 75.00% 80.00% 80.00% 80.00% 80.00% 80.00% 80.00%
Total Income (incl. increase in SIP & FG) 232.40 320.85 367.92 385.22 408.75 432.57 430.52 430.27 430.26 430.28
Variable CostRaw Material Consumed 162.50 211.20 244.20 257.40 270.60 283.80 283.80 283.80 283.80 283.80Consumable Spares 5.00 9.60 11.10 11.70 12.30 12.90 12.90 12.90 12.90 12.90Power, Fuel & Other Utilities (Variable) 9.38 16.80 19.43 20.48 21.53 22.58 22.58 22.58 22.58 22.58Factory Salaries & Wages (Variable) 3.75 5.28 6.72 7.79 9.00 10.39 11.43 12.57 13.83 15.21Other Manufacturing Expenses 0.00 0.00 0.00 0.00 0.00 0.00 0.00 0.00 0.00 0.00Other Variable Expenses 0.00 0.00 0.00 0.00 0.00 0.00 0.00 0.00 0.00 0.00Selling, Packing & Distribution Expenses (Variable)
1.68 2.33 2.71 2.87 3.05 3.23 3.23 3.23 3.23 3.23
Interest on Bank Borrowing 6.73 9.34 10.85 11.47 12.18 12.90 12.90 12.90 12.90 12.90
Total Variable Cost 189.04 254.55 295.01 311.71 328.66 345.80 346.84 347.98 349.24 350.62
Contribution 43.36 66.30 72.91 73.51 80.09 86.77 83.68 82.29 81.02 79.66
Fixed CostPower, Fuel & Other Utilities (Fixed) 3.13 5.60 6.48 6.83 7.18 7.53 7.53 7.53 7.53 7.53Factory Salaries & Wages (Fixed) 1.25 1.76 2.24 2.60 3.00 3.46 3.81 4.19 4.61 5.07Repairs & Maintenance 0.13 0.18 0.22 0.26 0.30 0.35 0.38 0.42 0.46 0.51Selling, Packing & Distribution Expenses (Fixed)
0.56 0.78 0.90 0.96 1.02 1.08 1.08 1.08 1.08 1.08
Depreciation 13.51 13.51 13.51 13.51 13.51 13.51 13.51 13.51 13.51 13.51Administrative & Misc. Expenses 0.22 0.93 1.08 1.15 1.22 1.29 1.29 1.29 1.29 1.29Interest on SIDBI Term Loans 2.36 6.70 5.32 3.91 2.47 1.05 0.04 0.00 0.00 0.00Interest on Other Term Loan(s) 18.26 14.51 10.76 7.01 3.26 0.69 0.00 0.00 0.00 0.00Interest on Interest Bearing Unsecured Loans 0.00 0.00 0.00 0.00 0.00 0.00 0.00 0.00 0.00 0.00Lease Rentals 0.00 0.00 0.00 0.00 0.00 0.00 0.00 0.00 0.00 0.00
Total Fixed Cost 39.42 43.97 40.51 36.23 31.96 28.96 27.64 28.02 28.48 28.99
Break Even Point (% of Installed Capacity) 40.91% 36.48% 36.12% 36.96% 31.92% 26.70% 26.42% 27.24% 28.12% 29.11%
Cash Break Even Point (% of Installed Capacity)
26.89% 25.27% 24.07% 23.18% 18.43% 14.24% 13.51% 14.11% 14.78% 15.55%
Optimum year FY2017
BEP in the Optimum Year (%) 31.92%
Cash BEP in the Optimum Year (%) 18.43%
The capacity utilizations are defined from beforehand.
The formulas for calculation of breakeven point are as follows:-
1)Breakeven Point(% of Installed Capacity)=Total Fixed Cost/Contribution*Production capacity utilization
2)Cash Breakeven Point(% of Installed Capacity)=(Total Fixed Cost-Depreciation)/Contribution*Production capacity utilization
(Contribution=Total Income-Total Variable Cost)
CALCULATION OF COST OF CAPITAL
lxxv

Amount Cost of Funds (%)
Tax Rate Cost of Funds (Post-Tax)
Total Cost (Post Tax)
Equity Share Capital 36.30 15.00% 1.00 15.00% 5.45Share Premium 0.00 15.00% 1.00 15.00% 0.00Preference Share Capital
0.00 15.00% 1.00 15.00% 0.00
SIDBI Equity Contribution
0.00 15.00% 1.00 15.00% 0.00
Internal Accruals 0.00 15.00% 1.00 15.00% 0.00Interest free Unsecured Loans
0.00 15.00% 1.00 15.00% 0.00
Subsidy 0.00 15.00% 1.00 15.00% 0.00Quasi-Equity Others (Pl Specify)
0.00 15.00% 1.00 15.00% 0.00
SIDBI Term Loan 57.00 12.50% 0.65 8.15% 4.64Term Loan from Other Banks
0.00 0.00% 0.65 0.00% 0.00
Interest Bearing Unsecured Loans
0.00 0.00% 0.65 0.00% 0.00
Internal Accruals (Optimum Year)
0.00 15.00% 1.00 15.00% 0.00
Bank Borrowing for WC (Optimum Year)
81.23 15.00% 0.65 9.78% 7.94
Total 174.53 18.03
Cost of Capital 10.33%
Cost of Funds(Post Tax)=Cost of funds(%)*Tax rate
Total Cost(Post Tax)=(Cost of Funds(Post Tax)*Amount)/100
Cost of Capital=(Total Cost(Post Tax)/Total Amount)*100
CALCULATION OF RETURN ON CAPITAL EMPLOYED
lxxvi

(Rs. lakh)
FY2013 FY2014 FY2015 FY2016 FY2017 FY2018 FY2019 FY2020 FY2021 FY2022
Production Capacity Utilisation 45% 55% 65% 75% 80% 80% 80% 80% 80% 80%
RETURNOperating Profit 3.94 22.33 32.40 37.28 48.13 57.81 56.04 54.27 52.54 50.67Non-Operational Income 10.00 10.00 10.00 10.00 10.00 10.00 10.00 10.00 10.00 10.00Interest 27.35 30.55 26.93 22.39 17.91 14.64 12.94 12.90 12.90 12.90Lease Rentals 0.00 0.00 0.00 0.00 0.00 0.00 0.00 0.00 0.00 0.00
TOTAL 41.29 62.88 69.33 69.67 76.04 82.45 78.98 77.17 75.44 73.57
Net Fixed Assets 337.00 323.49 309.98 296.47 282.96 269.45 255.94 242.43 228.92 215.41Non Current Assets 3.52 3.52 3.52 3.52 3.52 3.52 3.52 3.52 3.52 3.52Current Assets less Creditors 56.06 77.82 90.37 95.55 101.54 107.50 107.50 107.50 107.50 107.50
TOTAL B 396.58 404.83 403.87 395.54 388.02 380.47 366.96 353.45 339.94 326.43
ROCE 10.41% 15.53% 17.17% 17.61% 19.60% 21.67% 21.52% 21.83% 22.19% 22.54%
ROCE in the Optimum Year 19.60%
CALCULATION OF INTERNAL RATE OF RETURN AND NPV
lxxvii
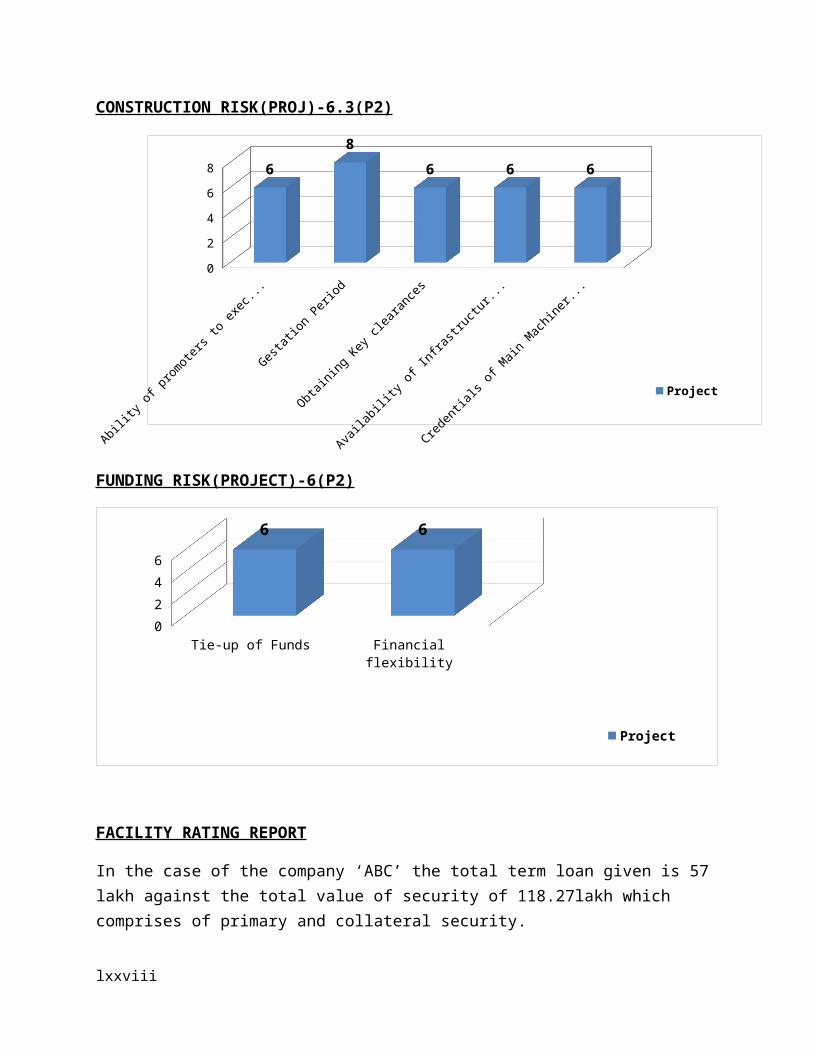
(Rs. lakh)IRR BEFORE TAX
FY2012 FY2013 FY2014 FY2015 FY2016 FY2017 FY2018 FY2019 FY2020 FY2021 FY2022 FY2023 FY2024OUTFLOWSExisting Assets 257.24Working Capital Gap 100.07Capital Expenditure 93.27 0.00 0.00 0.00 0.00 0.00 0.00 0.00 0.00 0.00 0.00 0.00Increase in WC Gap -44.01 21.76 12.55 5.18 5.99 5.96 0.00 0.00 0.00 0.00 0.00 0.00TOTAL OUTFLOWS 357.31 49.26 21.76 12.55 5.18 5.99 5.96 0.00 0.00 0.00 0.00 0.00 0.00
INFLOWSProfit before Tax 13.94 32.33 42.40 47.28 58.13 67.81 66.04 64.27 62.54 60.67 60.67 60.67Depreciation/ Write offs 13.51 13.51 13.51 13.51 13.51 13.51 13.51 13.51 13.51 13.51 13.51 13.51Interest 27.35 30.55 26.93 22.39 17.91 14.64 12.94 12.90 12.90 12.90 12.90 12.90Lease Rentals 0.00 0.00 0.00 0.00 0.00 0.00 0.00 0.00 0.00 0.00 0.00 0.00Salvage Value 183.07TOTAL INFLOWS 54.80 76.39 82.84 83.18 89.55 95.96 92.49 90.68 88.95 87.08 87.08 270.15
NET FLOWS -357.31 5.54 54.63 70.29 78.00 83.56 90.00 92.49 90.68 88.95 87.08 87.08 270.15
IRR BEFORE TAX 16.95%
NPV (before tax) 102.70 Discount Rate taken 12.50%
FY2012 FY2013 FY2014 FY2015 FY2016 FY2017 FY2018 FY2019 FY2020 FY2021 FY2022 FY2023 FY2024OUTFLOWSExisting Assets 257.24Working Capital Gap 100.07Capital Expenditure 93.27 0.00 0.00 0.00 0.00 0.00 0.00 0.00 0.00 0.00 0.00 0.00Increase in WC Gap -44.01 21.76 12.55 5.18 5.99 5.96 0.00 0.00 0.00 0.00 0.00 0.00TOTAL OUTFLOWS 357.31 49.26 21.76 12.55 5.18 5.99 5.96 0.00 0.00 0.00 0.00 0.00 0.00
INFLOWSProfit after Tax 9.78 21.83 28.25 31.15 38.25 44.60 43.09 41.62 40.22 38.75 38.75 38.75Depreciation/ Write offs 13.51 13.51 13.51 13.51 13.51 13.51 13.51 13.51 13.51 13.51 13.51 13.51Interest 27.35 30.55 26.93 22.39 17.91 14.64 12.94 12.90 12.90 12.90 12.90 12.90Lease Rentals 0.00 0.00 0.00 0.00 0.00 0.00 0.00 0.00 0.00 0.00 0.00 0.00Salvage Value 183.07TOTAL INFLOWS 50.64 65.89 68.69 67.05 69.67 72.75 69.54 68.03 66.63 65.16 65.16 248.23
NET FLOWS -357.31 1.38 44.13 56.14 61.87 63.68 66.79 69.54 68.03 66.63 65.16 65.16 248.23
IRR AFTER TAX 12.66%
NPV (after tax) 3.51 Discount Rate taken 12.50%
BIBLIOGRAPHY
lxxviii

BOOKS REFERRED:
1. M.Y.Khan and P.K.Jain, Management Accounting (Third Edition), Tata McGrawHill.2. 2.M.Y.Khan and P.K.Jain, Financial Management (Fourth Edition), Tata McGrawHill.3. 3.D.M.Mittal, Money, Banking, International Trade and Public Finance
(EleventhEdition), Himalaya Publishing House.
WEB SITES
1.www.sidbi.com
2.www.icicidirect.com
3.www.rbi.org
4.www.indiainfoline.com
5.www.google.com
BANKS INTERNAL RECORDS:
1.Annual Reports of SIDBI.
2.SIDBI Manuals for subsidy schemes.
3.Appraisal reports of proposals.
4.Rating reports of proposals.
lxxix