credible sources and sophisticated voters: when does new ...
74
C REDIBLE SOURCES AND SOPHISTICATED VOTERS : W HEN DOES NEW INFORMATION INDUCE ECONOMIC VOTING ? * JAMES E. ALT † DAVID D. L ASSEN ‡ J OHN MARSHALL § MAY 2015 When does new economic information cause voters to re-evaluate the government’s competence, and ultimately vote economically? Since politically-relevant information is often conveyed by actors with incentives to influence voter perceptions, the credibil- ity of information sources can vary significantly. This article randomly varies whether voters receive an aggregate unemployment forecast from the central bank, government or main opposition party using a survey experiment in Denmark with access to detailed panel data. We find that politically sophisticated voters discern differences in institu- tional credibility and the political cost of the signal, and update their unemployment expectations accordingly. Despite failing to differentiate political costs, unsophisti- cated voters still substantially update their expectations. However, while sophisticated voters intend to engage in substantial prospective economic voting, unsophisticated voters do not link their new unemployment expectations to their vote intention. These findings suggest that economic information supports economic voting most when it is credible and reaches sophisticated voters. * We wish to thank Alberto Abadie, Charlotte Cavaille, Ryan Enos, Alex Fouirnaies, Anthony Fowler, Torben Iversen, Horacio Larreguy and Victoria Shineman for valuable advice, comments and suggestions, as well as partic- ipants at presentations at Harvard, the NYU Center for Experimental Social Science Conference 2014, the Midwest Political Science Association Annual Conference 2014, MIT Political Economy Breakfast, LSE and the European Political Science Association Annual Conference 2014. Lassen thanks the Danish Council for Independent Research under its Sapere Aude program for financial assistance. † Department of Government, Harvard University, james [email protected]. ‡ Department of Economics, University of Copenhagen, [email protected]. § Department of Government, Harvard University. [email protected].
-
Upload
phungnguyet -
Category
Documents
-
view
214 -
download
1
Transcript of credible sources and sophisticated voters: when does new ...

CREDIBLE SOURCES AND SOPHISTICATED VOTERS:WHEN DOES NEW INFORMATION INDUCE ECONOMIC
VOTING? ∗
JAMES E. ALT† DAVID D. LASSEN‡ JOHN MARSHALL§
MAY 2015
When does new economic information cause voters to re-evaluate the government’scompetence, and ultimately vote economically? Since politically-relevant informationis often conveyed by actors with incentives to influence voter perceptions, the credibil-ity of information sources can vary significantly. This article randomly varies whethervoters receive an aggregate unemployment forecast from the central bank, governmentor main opposition party using a survey experiment in Denmark with access to detailedpanel data. We find that politically sophisticated voters discern differences in institu-tional credibility and the political cost of the signal, and update their unemploymentexpectations accordingly. Despite failing to differentiate political costs, unsophisti-cated voters still substantially update their expectations. However, while sophisticatedvoters intend to engage in substantial prospective economic voting, unsophisticatedvoters do not link their new unemployment expectations to their vote intention. Thesefindings suggest that economic information supports economic voting most when it iscredible and reaches sophisticated voters.
∗We wish to thank Alberto Abadie, Charlotte Cavaille, Ryan Enos, Alex Fouirnaies, Anthony Fowler, TorbenIversen, Horacio Larreguy and Victoria Shineman for valuable advice, comments and suggestions, as well as partic-ipants at presentations at Harvard, the NYU Center for Experimental Social Science Conference 2014, the MidwestPolitical Science Association Annual Conference 2014, MIT Political Economy Breakfast, LSE and the EuropeanPolitical Science Association Annual Conference 2014. Lassen thanks the Danish Council for Independent Researchunder its Sapere Aude program for financial assistance.†Department of Government, Harvard University, james [email protected].‡Department of Economics, University of Copenhagen, [email protected].§Department of Government, Harvard University. [email protected].

Obtaining and processing politically-relevant information is an essential feature of how voters se-
lect governments and hold them to account (e.g. Manin, Przeworski and Stokes 1999). This is
particularly true for economic voting, where aggregate economic information is critical for voters
evaluating the competence of their government (Anderson 1995; Fearon 1999). Our goal is to ex-
amine the interaction between three key aspects of politically-relevant information: the credibility
of its source, the ability of voters to recognize costly signals as more credible, and the extent to
which voters translate their updated beliefs into political choices.
Since much of the information available to voters is biased,1 economic information may only
affect voter perceptions of economic performance when they regard it as credible. Even then,
many voters lack the cognitive capacity to translate such perceptions into vote choices (Duch and
Stevenson 2008; Gomez and Wilson 2001, 2006). Given that political actors devote significant time
and money to such efforts, relatively incredible information could substantially affect economic
voting if voters fail to discern differences in credibility.
In this article, we analyze the conditions under which providing aggregate unemployment fore-
casts causes different types of voters to re-evaluate the government’s competence, and act po-
litically on their beliefs by engaging in prospective economic voting. Our survey experiment,
embedded in a rich Danish panel survey conducted in the aftermath of the financial crisis when
macroeconomic concerns were the main political issue, focuses on the interaction between varying
types and levels of information credibility and the political sophistication of voters. Like Gomez
and Wilson (2006) and Luskin (1987), we regard political sophistication as both awareness of
politically-relevant economic information and the cognitive ability to associate information and
political choice. Using a novel context-specific measure, we define political sophistication by the
accuracy of a voter’s pre-treatment current unemployment estimate. We demonstrate that this mea-
sure is both highly correlated with standard proxies for political sophistication and is the key factor
1For example, Chiang and Knight (2011), Ladd and Lenz (2009), and Nadeau et al. (1999)document that voters do understand that sources of information may be biased.
1

even when such proxies are controlled for.
The existing literature primarily focuses on differences in credibility emanating from differ-
ences in institutional expertise or trust (see Gilens and Murakawa 1994; Lupia and McCubbins
1998; Mondak 1994). We incorporate these insights and also designed our treatments to capture
the political incentives of an information source. Building on the logic of costly signals (Spence
1973), we argue that a message becomes more credible when the source has incentives to have
stated otherwise.2 Although sending such messages can be politically costly, Grose, Malhotra
and Van Houweling (forthcoming) show that U.S. Senators often, and successfully, seek to ex-
plain to voters why their roll call votes deviate from constituent preferences. In our context, an
opposition claim that the economy is doing well is more credible than an identical government
claim because such a claim is costly since it may hurt the opposition’s election prospects. Con-
versely, the government has a clear incentive to tell voters that the economy is performing well.
To capture both institutional credibility and costly signals, we randomly assign voters to receive
identical unemployment forecasts from either the Danish Central Bank (DCB), the government,
or the main opposition party. We thus focus on prospective economic voting, where the selection
motive for evaluating government competence is particularly sensitive to variation in the quality of
performance signals (Ashworth 2012; Fearon 1999).
Models of prospective economic voting rely heavily on information affecting voter percep-
tions of incumbent competence and well-informed voters possessing the will and capacity to vote
according to perceptions of economic competence (Healy and Malhotra 2013). Scholars of U.S.
politics have argued that the most politically aware voters may respond least to such information
because they already possess strong priors (e.g. Converse 1962; Zaller 1992). On the other hand,
it may be that only such sophisticated voters possess the cognitive skills and political knowledge
required to detect differences in source credibility and vote on the basis of this information. Since
we examine a valence issue about which even the most aware voters are imperfectly informed,
2In other political contexts, see Adolph (2014), Fearon (1997), or Gilligan and Krehbiel (1987).
2

and given the complexity of the Danish political system, political sophistication may be necessary
for voters to detect differences in source credibility and ultimately vote economically. In contrast
with more ideological issues, where individual partisanship is likely to moderate voter beliefs and
interpretations of the information that they receive (e.g. Druckman, Peterson and Slothuus 2013;
Gaines et al. 2007; Jerit and Barabas 2012; Zaller 1992), voters are more likely to internalize
information about valence issues like unemployment when they deem such information credible.
We first examine how the source and content of unemployment projections affect unemploy-
ment expectations. We find that all voters significantly update their unemployment expectations
in response to our treatments. However, only sophisticated voters are able to differentiate be-
tween information sources. Among such voters, a DCB or opposition forecast that the economy
is performing well reduces unemployment expectations significantly more than an equivalent gov-
ernment forecast, while a DCB or government forecast that the economy is performing badly
increases unemployment expectations significantly more than an equivalent opposition forecast.
While unsophisticated voters substantially downgrade their initially pessimistic expectations and
regard the DCB as more credible, they fail to discern differences in message credibility across po-
litical parties. Previous vote choices, which are uncorrelated with political sophistication, do not
differentially impact belief updating across different treatments.
Using our treatments to instrument for unemployment expectations, our instrumental variable
(IV) estimates also show that new economic information translates into economic voting. A per-
centage point decrease in unemployment expectations increases the probability that the average
complier intends to vote for Denmark’s coalition government by 3.5 percentage points. This ef-
fect, which only affects the parties of the Prime Minister and Minister for the Economy and Interior,
could have altered the outcome of Denmark’s recent close elections. Providing further evidence
of economic voting, lower unemployment expectations increase confidence in the government, but
do not affect support for non-government left-wing parties or attitudes toward redistributive or
unemployment insurance policies. Given the difficulty of identifying the effects of economic per-
3

formance on support for the government, our findings exploiting experimental variation in a large
nationally representative sample provide strong causal evidence for economic voting.
However, economic voting is only induced among sophisticated voters. For sophisticated vot-
ers, a percentage point decrease in unemployment expectations increases the likelihood of voting
for the government by 6 percentage points. Despite substantially updating their beliefs, unsophis-
ticated voters do not translate lower unemployment expectations into support for the government.
Since unsophisticated voters are disproportionately swing voters, who change their vote choices
and vote intentions across time, this difference cannot be attributed to such voters being strong
partisans. Similarly, differences in political preferences do not explain this difference.
Ultimately, our findings suggest that more sophisticated voters better understand the differing
incentives of parties to send certain types of messages to voters, and update accordingly. Even
though more sophisticated voters update less on average, given that their priors are more accu-
rate, changes in their posterior beliefs are more important for vote choice. We thus conclude that
economic information supports economic voting to the extent that it is credible and reaches sophis-
ticated voters. Furthermore, this finding may explain why parties tend to target their messages at
politically-engaged voters who may act upon the new information (Adams and Ezrow 2009; Gilens
2005).
1 When does new economic information spur economic voting?
The idea that governments may be rewarded or sanctioned by voters on the basis of their economic
performance is well-established (see Anderson 2007; Lewis-Beck and Stegmaier 2000). Its logic
is that voters impose sanctions retrospectively on the basis of economic outcomes to deter re-
election seeking politicians from choosing suboptimal policies (Barro 1973; Ferejohn 1986), or
prospectively use the available information to select the most competent candidate (Fearon 1999).3
3Voter motives could be either sociotropic or self-interested, or prospective or retrospective. AsAnsolabehere, Meredith and Snowberg (2014) have shown, parsing out these effects is challenging.
4

Both backward- and forward-looking information can help to evaluate the competence of office-
holders, but the presence of reliable information is essential (Manin, Przeworski and Stokes 1999).
To the extent that voting is economic, most studies conclude that it is macroeconomic “so-
ciotropic” aggregates rather than individual-specific “pocketbook” calculations that drive this re-
lationship (e.g. Kiewiet 1983; Lewis-Beck and Stegmaier 2000). Despite its appealing simplicity,
the evidence that economic success translates into higher likelihoods of an incumbent being re-
elected is mixed (Anderson 2007), and researchers have struggled to provide compelling evidence
of a causal relationship (Healy and Malhotra 2013).
The conditions under which an individual votes economically can be demanding (Healy and
Malhotra 2013). Specifically, prospective economic voting requires that voters obtain economic
information, use credible information to evaluate the incumbent’s economic competence, and re-
elect sufficiently competent incumbents (compared to the alternatives). Even assuming that voters
possess the necessary information, economic voting may still not occur if: (1) receiving new infor-
mation does not affect voter appraisals; or (2) well-informed voters lack the motivation or cognitive
capacity to link their vote to their appraisal. We focus on these two conditions, and thus examine
when the provision of new economic information affects economic voting.
1.1 Source credibility
Most politically-relevant information is conveyed by agents with well-understood ideological bi-
ases and incentives to distort perceptions of the true state of the world (e.g. Baron 2006; Besley
and Prat 2006; Gentzkow and Shapiro 2006; Huckfeldt 2001).4 For example, Larcinese, Puglisi
and Snyder (2011) have shown that pro-Democrat newspapers in the U.S. are more likely to report
high unemployment under Republican Presidents. Accordingly, voters must evaluate the informa-
tion they receive in terms of the credibility of the information source.
This is because the same information can be used for all such goals.4Voters receiving biased information is also a demand side phenomenon (see Mullainathan and
Shleifer 2005). We focus on supply by varying the sources voters are provided with.
5

A large literature in social and political psychology has argued that the perceived expertise and
trustworthiness of an information source is a key determinant of whether a voter internalizes a
message’s content (e.g. Gilens and Murakawa 1994; Mondak 1994). In particular, when individ-
uals do not seriously engage with the arguments they receive, Petty and Cacioppo (1981) theorize
that “peripheral” persuasion may still occur if the source of the message is regarded as credible.
Given the low day-to-day salience of politics for many voters, source cues are frequently relied
upon by voters—especially when the information source is knowledgeable and trusted (Lupia and
McCubbins 1998). Consequently, independent sources with context-specific expertise, such as
independent central banks staffed by highly-trained economists and providing detailed technical
data,5 are more likely to affect voter beliefs than political parties.
While the importance of institutional credibility is relatively clear, the interaction between
the source and content of a message has not been studied. We argue that an information source
can also attain greater credibility if voters understand the source’s incentives to send a particular
message. If the credibility of a signal increases with the perceived cost to the sender, a message
becomes more credible when the source has incentives to have stated otherwise. In Spence’s (1973)
seminal example of a costly signal, the level of education an individual attains can only signal high
ability to employers if the cost of such education is too large for a low ability worker to attain.
Similarly, Chiang and Knight (2011) and Ladd and Lenz (2009) find that “surprising” newspaper
endorsements disproportionately affect vote intentions.
The role of costly signals is particularly clear in the case of election-motivated political parties
talking about the economy. Governments have strong incentives to play up their competence at
dealing with the economy, and often point to effective policies and macroeconomic forecasts to
support their claims. Conversely, opposition parties typically emphasize government failures and
argue that they would instead do a better job. Consequently, voters that recognize that opposition
5Tetlock (2010) describes the demand for expert information. Barro and Gordon (1983) de-scribe how independent central banks can credibly solve politicians’ commitment problems.
6
politicians face strong incentives to downgrade the government’s economic performance should
regard an opposition claim that the government is managing the economy well as more credible
than an identical government claim. Similarly, government statements pointing to poor economic
performance are more credible than identical opposition claims. Our treatments exploit this logic.
1.2 Voter sophistication
Which types of voters are able to link political context to the cost and credibility of providing cer-
tain types of information, and update accordingly? An influential literature has argued that sophis-
ticated voters—those that are both politically informed and possess the cognitive skills required
to evaluate the information they receive—are least sensitive to politically-relevant information be-
cause they possess strong priors on political issues due to strong partisan biases or because they
are already well informed on the issue (e.g. Converse 1962; Lodge and Taber 2013; Zaller 1992).
Recent studies in the U.S. show that a voter’s partisan biases affect their willingness to internalize
new information (e.g. Jerit and Barabas 2012; Boudreau and MacKenzie 2014; Bullock 2011;
Gerber and Huber 2010), while European studies have indicated that poorly informed voters are
most sensitive to new information (e.g. Duch 2001). When faced with credible information, to the
extent that such voters can discern it, we might therefore expect the least sophisticated voters to up-
date their beliefs most. Provided such beliefs are internalized, this could translate into significant
changes in political behavior.
However, this account ignores the possibility that differences in the source and content of
messages—and thus their credibility—may not be perceived equally by sophisticated and unso-
phisticated voters. Although unsophisticated voters may be especially susceptible to new infor-
mation because they are politically unaware, this lack of awareness—in conjunction with lower
cognitive capacity—may prevent such voters from evaluating a source’s credibility. As Duch and
Stevenson (2008) and Gomez and Wilson (2001, 2006) have shown, less educated and politically
informed voters struggle to detect subtle factors that are relevant for attributing government re-
7

sponsibility for economic performance. Similarly, voters vary in their ability to differentiate subtle
differences in source credibility. Due to a relatively strong understanding of the parties in and out
of office and their incentives to win office at the next election (e.g. Prior 2013), sophisticated voters
are more likely to recognize differences in source credibility and update their beliefs accordingly.
On the other hand, unsophisticated voters may fail to grasp differences in the costliness of different
messages and even fail to differentiate expert from non-expert sources.
These differences may be particularly pronounced for valence issues containing factual infor-
mation. Since there is consensus among voters that lower unemployment, for example, is regarded
as good (Slothuus and De Vreese 2010), credible information is likely to play a key role in chang-
ing the beliefs of all voters. For such valence issues, the interpretation of numeric information
through a partisan lens is likely to be less salient (Gerber and Green 1998). In contrast, partisan
biases may be more important for ideologically-charged issues such as immigration (Druckman,
Peterson and Slothuus 2013) or welfare policy (Slothuus and De Vreese 2010), where there is also
greater scope for a disjuncture between fact-based beliefs and interpretations (Gaines et al. 2007).
Furthermore, even when economic information does affect politically unsophisticated voters,
it is not clear that their political behavior will change. First, models of survey responses argue that
such voters simply sample from recent pieces of information without considering their political im-
plications (Zaller 1992). However, while more sophisticated voters may update their beliefs less,
their posterior beliefs regarding government competence are more important for their vote choice
(Delli Carpini and Keeter 1996). Second, even if unsophisticated voters do internalize new infor-
mation, they may lack the cognitive capacity to translate it into political action (Gomez and Wilson
2006). This is particularly true when assigning responsibility in institutional contexts character-
ized by an open economy and multiple loci of decision-making power or coalitions governments,
where even the most willing economic voter may struggle to assign responsibility for economic
performance (e.g. Anderson 1995; Duch and Stevenson 2008; Powell Jr. and Whitten 1993). To-
gether, these considerations imply that even if unsophisticated voters receive politically relevant
8

information, it may not affect their political behavior.6
2 Research design
We examine the political effects of providing politically-relevant economic information in Den-
mark, a country where left-right differences over economic policy remain the salient political di-
vision and governments have oscillated between center-left and center-right coalitions. In 2011,
Social Democrat Helle Thorning-Schmidt became Denmark’s first female Prime Minister, having
narrowly led the left bloc—containing the Social Democratic, Social Liberal and Socialist Peo-
ple’s parties as coalition partners, and supported by the Red-Green Alliance—to victory over a
center-right coalition led by the Liberals that had held office since 2001.
Dissatisfaction with the government’s economic performance was the major issue in the 2011
election (Stubager 2012).7 Having sustained very low levels of aggregate (gross) unemployment
throughout the 2000s, reaching nearly 2% in early 2008, unemployment almost trebled to around
6% by the 2011 election.8 Sharp increases in the budget deficit also left Denmark with hard fiscal
choices regarding welfare and pension reform. The center-right’s austerity policies were widely
blamed for the failure to produce a stronger economic recovery.9 Despite this, the left bloc only
barely achieved a parliamentary majority in 2011; the seat distribution in Denmark’s legislative
assembly is shown in the Online Appendix. The shift in political power primarily reflected the rise
6Alternatively, although unsophisticated voters are typically poorer, it is also possible that suchvoters care about orthogonal policy issues. We test this alternative explanation empirically.
7The Danish Election Study polls, available here, show that the economy was the most im-portance issue for voters, while nearly 20% specifically cited unemployment. The study alsoshows that left-wing voters thought the labor market was the biggest issue, while right-wing votersthought the economy in general was the biggest issue. Voters similarly divided over whether a leftor right coalition would best fight unemployment.
8Gross unemployment is the definition used by the government and Statistics Denmark (andreported in the media), and is based on administrative records. Net unemployment, which excludesthose in active labor market programs, is around one percentage point lower.
9Although Denmark’s government did not cause the financial crisis, governments are often heldresponsible for exogenous shocks (Duch and Stevenson 2008), or for failing to respond effectively.
9

of the Social Liberals at the expense of the Conservatives.
The Danish economy struggled to improve after the 2011 election, and unemployment rates
became more politically salient. In January 2013, unemployment reached 6.5%. Importantly for
our study, the DCB estimated that this rate could rise to just below 7% by January 2014.10 The
share of Danes regarding unemployment as the biggest political problem rose from 18% at the
2011 election to 20% by November 2012, and 36% by late 2013.11 Moreover, within-coalition
tensions between the economically liberal Social Liberals and the socialist Socialist People’s par-
ties increased, and culminated with the Socialist People’s Party leaving the coalition in January
2014 over unpopular plans to privatize the country’s state-owned energy company.
2.1 Data and experimental design
To evaluate the conditions under which economic information with varying levels of credibility
affects individual beliefs and economic voting, we embedded a survey experiment in the 2013
wave of the Danish Panel Study of Income and Asset Expectations, an annual panel survey of
around 6,000 working age Danes conducted every January/February.12 The panel, conducted by
telephone since 2010, asks about the respondent’s financial position, behavioral dispositions and
political preferences. Furthermore, the survey data has been linked by Statistics Denmark to the
Danish Central Person Registry, a rich administrative dataset containing wide-ranging government
information about all Danes. The combination of panel political data and detailed respondent
histories allows us to describe differential responses to politically-relevant information in detail.
Treatments. We examine source credibility by varying the source of simple unemployment
forecasts, as well as the forecast itself. Respondents were randomly assigned to one of eight
10The Online Appendix provides additional detail about DCB forecasts.11See the DR Nyheder November 2012 poll here, and Jyllands-Posten December 2013 poll here.12The first wave randomly chose c.6,000 working age respondents from the Central Person Reg-
istry. Annual attrition is around 20%. The sample has been replenished with respondents randomlychosen from the Registry, and remains representative of the working age population. The final dataset made available for research was anonymized.
10

different groups with around 700 members each. The control group received no information, while
six treated groups were read the following statement:
“Assume that that the [DCB/government/Liberals] estimates that unemployment in
2013 will be [almost 7%/around 5%].”13
Respondents were therefore informed that the DCB, the government or main opposition party
forecast that unemployment over the next year will be “almost 7%” or “around 5%”. As noted
above, the true DCB forecast for gross unemployment was almost 7%. However, because only
the DCB has publicly stated this, ethical considerations required that our other primes begin with
“assume that...”. In order to examine the extent to which such wording weakens the treatment, our
final treatment group was truthfully told “The DCB estimates unemployment in 2013 to be almost
7%.” We compare this treatment to the analogous “assume” version, and will show no statistical
difference in the distribution of unemployment expectations.
Unemployment projections, typically one and two years in the future, from both the DCB and
the government are frequently communicated in print and electronic media. This information is
communicated either in the form of predicted (gross) unemployment percentages or as the pre-
dicted number of full-time equivalent unemployed. News reporting of such projections often, if
not always, notes the direction of the change relative to current unemployment levels.14 This last
feature is implicit in our measure, where subjects are themselves first asked to state their own belief
about the current unemployment rate before being treated.
These sources vary considerably in their credibility among voters of all political stripes. The
DCB is highly regarded by voters, and is not perceived as right-wing or an instrument of gov-
ernment, while political parties are viewed with skepticism. Among our control group, 67% of
respondents trusted or greatly trusted the DCB while only 17% and 27% trusted or greatly trusted
13Survey treatments and questions are translated from Danish; see Online Appendix for Danishphrasing. It is important to emphasize that in Danish the prime translates as a prospective estimate.
14We provide links to two examples from two major newspapers: Berlingske and Politiken.
11

the government and Liberals respectively.15 Eurobarometer data indicates that trust in Denmark’s
political parties is very similar to the European Union mean (European Commission 2011).
Outcome variables. We consider two types of outcomes: unemployment expectations and
economic voting. To capture unemployment expectations we asked respondents “What is your
best estimate of what unemployment will be in 2013? We would like your best estimate, even if
you are not entirely sure.”16 This question was asked immediately after respondents received their
treatment, and the 20 respondents who answered that the unemployment rate would exceed 50%
were removed.17 Unlike more partisan issues, Lenz (2012) finds no evidence of reactivity biases
for valence issues like unemployment. Summary statistics are provided in the Online Appendix.
Economic voting is measured by vote intention and evaluations of the government, although
we also consider various placebo tests examining other outcomes. We code indicator variables for
intending to vote for Denmark’s main political parties, as well as groups for the governing coali-
tion (Social Democrats, Social Liberals and Socialist People’s parties) and right-wing parties. To
reduce concerns about experimental demand biases, vote intention was elicited 18 questions—10-
20 minutes later, after detours through unrelated questions—after the treatment was administered.
Because turnout in Denmark regularly exceeds 85%,18 and 72% of respondents ultimately reported
voting for the party they intended to vote for eight months prior to the 2011 election, vote intention
represents a good approximation for what would happen if an election was held immediately. To
assess voter perceptions of government competence, we asked respondents how much confidence
they have in the government. Respondents were provided a five-point scale ranging from little
great mistrust (1) to great trust (5) in the government.19
15These numbers are in line with mass surveys conducted by Statistics Denmark: in 2011, theyfound that while 82% trusted the DCB, only 59% trusted Parliament. See report summary here.
16From a Bayesian perspective (see Online Appendix), this response can be thought of as anindividual’s posterior unemployment belief (updated after receiving new information).
17These individuals were very evenly spread across treatment conditions, with between 2 and 4omitted respondents in each group. Including these observations does not affect the results.
18See the Institute for Democracy and Electoral Assistance.19This question was asked 11 questions after the treatment was administered.
12

Political sophistication. To capture both political awareness and cognitive skills, political so-
phistication is measured by a respondent’s estimate of the current unemployment rate. We oper-
ationalize a sophisticated voter as one whose (pre-treatment) current unemployment estimate is
within 1.5 percentage points of the true 6.5% level. We thus count around half the sample as
sophisticated, while 70% describe themselves as well informed about Danish politics.20 Our mea-
sure not only accurately captures awareness of politically-relevant economic information, but the
Online Appendix shows that it also represents a “sufficient statistic” for political engagement and
cognitive skills in two important respects. First, the absolute difference between the current unem-
ployment rate and the respondent’s estimate is significantly negatively correlated with frequency
of watching the news, regular discussion of politics, income, education, the number of correct an-
swers on a math test, and a respondent’s self-reported level of political information. Second, our
measure of political sophistication captures the effect of other measures of political sophistication
on unemployment expectations. In particular, the Online Appendix shows that when we interact
the absolute difference between the respondent’s estimate and the true unemployment rate with our
treatments, the previously-significant baseline effects of standard proxies for political sophistica-
tion, and their interactions with our treatments, all cease to be statistically significant. In addition,
we show in the Online Appendix that our measure of political sophistication is uncorrelated with
measures of partisanship based on previous vote choice.
2.2 Identification and estimation
Given its random assignment, treatment status is well balanced across pre-treatment covariates.
The Online Appendix confirms such balance across 16 political and socioeconomic variables fre-
quently included in observational studies regressing political preferences on a set of covariates.
Our empirical analysis can now straight-forwardly identify the causal effects of the treatments.
20We obtain very similar results using other cutoffs such as guessing within one or two percent-age points, or when using the absolute deviation from the true current unemployment estimate.
13

To estimate the average treatment effect on the treated of each information treatment on unem-
ployment expectations, we estimate the following equation using ordinary least squares (OLS):
Unemployment expectationi = Ziα + εi, (1)
where α represents the effect of each treatment contained in our vector of treatment conditions,
Zi. To examine how the effects of our treatments vary across sophisticated and unsophisticated
voters, we split our sample and estimate the effects for different types of voter separately.21 Robust
standard errors are reported throughout.
To identify our ultimate quantity of interest—the effect of unemployment expectations on eco-
nomic voting—we instrument for unemployment expectations using our information treatments.
By exploiting only random variation induced by our randomly assigned treatments, this IV strategy
overcomes the concern that economic expectations may be correlated with omitted variables that
also affect political preferences. Since voters with different prior beliefs about the unemployment
rate may update their beliefs in different directions in response to the same treatment, a benefit of
this approach is the ability to scale the reduced form effect of each treatment by its impact upon
the average voter’s unemployment expectations. This means that the most credible sources will be
weighted more heavily. Using equation (1) as the first stage, we thus estimate the average causal
effect among compliers—individuals for whom our information treatments induced respondents
to change their unemployment expectations—across different unemployment expectation levels.22
Accordingly, we estimate the following equation using two stage least squares (2SLS):
Yi = τUnemployment expectationi + δCurrent unemployment estimatei + ξi, (2)
21We obtain very similar results when interacting our treatments with voter sophistication, butsplit the sample to simplify interpretation when comparing many treatment effects across groups.
22More formally, we estimate the local average causal response—the linearized causal effectof unemployment expectations, weighted toward areas where the density function of complierresponses is greatest (Angrist and Imbens 1995).
14

where Yi is vote intention, confidence in the government, or a placebo outcome. We include the
respondent’s pre-treatment estimate of the current unemployment rate to enhance efficiency, al-
though the Online Appendix shows that this choice does not affect our results. We again examine
heterogeneity using subsamples.
The key additional assumption underpinning the IV estimates is the exclusion restriction. This
requires that our instruments only affect our outcomes through unemployment expectations.23 Per-
haps the most plausible risk of violating this assumption arises where information treatments prime
respondents to think more carefully about government performance and policies (beyond the effect
of changing beliefs about unemployment expectations), inducing bias if such thinking systemati-
cally affects support for the government. We assess this possibility by looking at whether belief in
the importance of political information for either private economic decisions or as part of the re-
spondent’s job differs across treatment groups (or comparing the control to all treated respondents),
and find no difference (see Online Appendix).
3 Effects of information source on unemployment expectations
We first examine how our information treatments affect the unemployment expectations of the
average voter. Addressing our main hypothesis, we then show that the average effects mask the
key role played by voter sophistication in explaining systematic differences in how different types
of voters respond to economic information with varying levels of credibility.
3.1 Belief updating on average
Figure 1 plots the distribution of unemployment expectation responses by treatment condition.
Before turning to our main results, it is clear from Panel A that the “assume” wording does not
23Although some respondents update in different directions in response to our treatments, thediscussion in the Online Appendix shows that the monotonicity assumption is unproblematic.
15

affect the distribution of the DCB 7% projection responses.24 This suggests that the statement
wording is not biasing voter responses. Henceforth we pool the DCB 7% treatment groups.25
0 5 10 15 20
0.00
0.10
0.20
0.30
Panel A
2013 unemployment expectation (%)
Den
sity
0 5 10 15 20
0.00
0.10
0.20
0.30
0 5 10 15 20
0.00
0.10
0.20
0.30
0 5 10 15 20
0.00
0.10
0.20
0.30
ControlDCB 7%Assume DCB 7%Assume DCB 5%
0 5 10 15 20
0.00
0.10
0.20
0.30
Panel B
2013 unemployment expectation (%)
Den
sity
0 5 10 15 20
0.00
0.10
0.20
0.30
0 5 10 15 20
0.00
0.10
0.20
0.30
0 5 10 15 20
0.00
0.10
0.20
0.30
0 5 10 15 20
0.00
0.10
0.20
0.30
ControlAssume govt. 7%Assume govt. 5%Assume opp. 7%Assume opp. 5%
Figure 1: Unemployment expectations by DCB treatments
Note: For graphical exposition, the x-axis is truncated so that the 1% of the sample with expectationsabove 20% are not visible.
The leftward shift in density associated with all treatments indicates that all information sources
reduce unemployment expectations on average across respondents. The reduction reflects system-
atic pessimism in a population where the mean control group member expected an unemployment
24Tests comparing the mean and variance of the distributions cannot reject the null hypothesisof identical sample moments.
25This similarity may not extend to other treatments; however, any bias is likely to be downward.
16

rate of 9.0%. Despite its optimism relative to the true DCB claim, the 5% treatments dragged
expectations below the 7% treatment groups. In all cases, the information treatments reduced the
variance of the distributions, providing further evidence that the treatments affected respondents.26
Consistent with previous findings regarding differences in credibility due to higher trust and
greater expertise, receiving information from political parties caused the average voter to update
their beliefs less than receiving information from the DCB. The DCB treatments also induced more
similar responses from voters (i.e. a smaller standard deviation in responses), especially compared
to the opposition treatments. Although it could have been the case that simply being primed by a
source increased confidence in the source, the Online Appendix shows that receiving a treatment
does not affect trust in either political party.
The government and opposition source treatments also reduced unemployment expectations.
Panel B clearly shows a downward shift in modal unemployment expectations for both treatments.
Surprisingly, given that the opposition has a political incentive to criticize government economic
performance, the Liberal party’s projections did not cause voters to differentially change their be-
liefs relative to the predictably optimistic government message. Averaging across the full sample,
we therefore find no evidence that voters are sensitive to costly signals.
Estimating equation (1), Column (1) in Table 1 confirms our graphical analysis. Receiving
a 7% treatment reduces unemployment expectations by around 1 percentage point, while a 5%
treatment subtracts a further 0.5 percentage points. The tests of the differences between treatment
effects at the foot of the table show that, at both forecast levels, the DCB’s claim has a significantly
larger impact on unemployment expectations than the government’s, while the difference between
the DCB and the opposition is almost statistically significant. There is no discernible difference
between the government and opposition 5% or 7% treatments. However, we now demonstrate that
averaging across all respondents hides important differences by voter sophistication.
26Distributional tests confirm that the variance reduction is statistically significant. Althoughthese belief shifts could in part reflect anchoring biases (Tversky and Kahneman 1974), it is hardto see how such explanations could explain the changes in economic voting we document below.
17

Table 1: Effect of information treatments on unemployment expectations (%)
Outcome: unemployment expectations(1) (2) (3)Full Unsophist. Sophist.
sample voters voters
Control 9.012*** 11.461*** 7.070***(0.185) (0.362) (0.078)
DCB 7% treatment (combined) -1.123*** -2.498*** -0.031(0.197) (0.387) (0.084)
Government 7% treatment -0.848*** -1.876*** 0.066(0.213) (0.421) (0.096)
Opposition 7% treatment -0.923*** -1.801*** -0.226**(0.223) (0.435) (0.098)
DCB 5% treatment -1.663*** -2.391*** -0.907***(0.230) (0.470) (0.098)
Government 5% treatment -1.218*** -2.294*** -0.621***(0.233) (0.446) (0.098)
Opposition 5% treatment -1.335*** -2.194*** -0.781***(0.236) (0.458) (0.104)
Coefficient equality F tests (p values)DCB 7% = Government 7% 0.08* 0.02** 0.13DCB 7% = Opposition 7% 0.26 0.01** 0.00***Government 7% = Opposition 7% 0.65 0.82 0.00***
DCB 5% = Government 5% 0.02** 0.81 0.00***DCB 5% = Opposition 5% 0.10 0.63 0.16Government 5% = Opposition 5% 0.57 0.79 0.08*
Observations 5,705 2,533 3,172Outcome mean 7.98 9.51 6.76Outcome std. dev. 3.55 4.72 1.24Current unemployment estimate mean 8.58 10.97 6.67
Notes: The dependent variable is a respondent’s unemployment expectation for the end of 2013 (%).All specifications are estimated using OLS, with robust standard errors in parentheses. ∗p < 0.1,∗∗ p <
0.05,∗∗∗ p < 0.01. The coefficient tests at the foot of the table report the p value from a two-sided F testof coefficient equality. Sophisticated voters are defined as respondents whose current unemploymentestimate is within 1.5 percentage points of the true rate in January 2013 (see main text for furtherdetails).
18
3.2 Voter sophistication and differences in source credibility
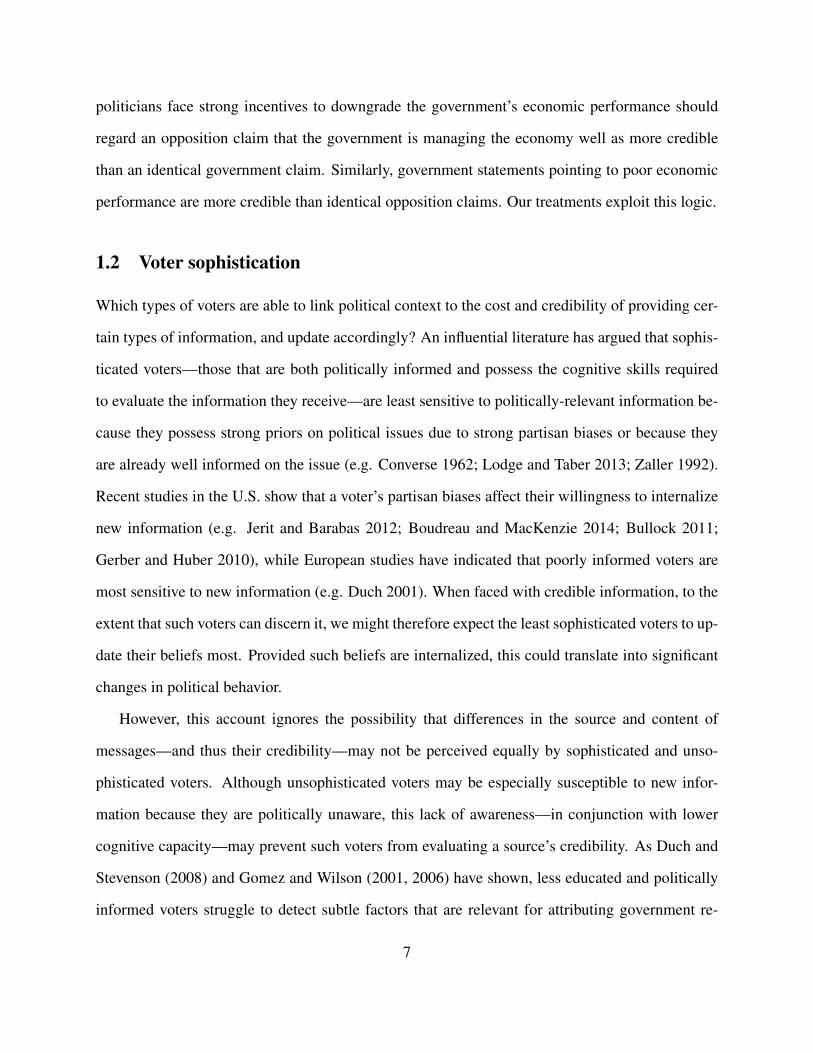
Respondents saw credibility differences between the DCB and political parties on average. How-
ever, our main argument is that politically sophisticated and unsophisticated voters respond differ-
ently. We explore this possibility in columns (2) and (3) of Table 1 by respectively splitting the
sample between unsophisticated and sophisticated voters. The results show that sophisticated and
unsophisticated voters indeed respond very differently to unemployment forecasts.
Politically unsophisticated voters regard the DCB as more credible, but do not differentiate
between political sources. Our estimates in column (2) show that the DCB treatments substan-
tially reduced unemployment expectations among unsophisticated voters. The first and second
coefficient equality tests at the foot of the column indicate that the DCB 7% treatment reduced
expectations significantly more than the 7% treatment from either political party. The final three
coefficient tests, however, indicate that the 5% treatments are statistically indistinguishable. Fur-
thermore, the almost identical coefficients for different political parties—in the third and sixth
coefficient tests—clearly demonstrate that unsophisticated voters do not detect differences in the
incentives of political parties to send the messages that they receive.
In contrast to unsophisticated voters, sophisticated voters systematically perceive significant
differences in source credibility. In particular, only sophisticated voters differentially update in ac-
cordance with the incentives for each party to claim that the economy is doing well. Relative to the
7.1% average forecast among sophisticated voters in the control group, sophisticated voters dis-
count positive economic appraisals by the government and emphasize positive economic appraisals
by the opposition. For the 7% treatments, the opposition claim that the government is performing
slightly better than sophisticated voters previously believed causes voters to significantly reduce
their unemployment expectations. The second and third tests at the foot of column (3) show that re-
ceiving this message from the opposition significantly reduces unemployment expectations relative
to the DCB and government 7% treatments. This finding accords with our theoretical expectation
19

that voters are more likely to regard the economy as doing better than previously-believed after
receiving a claim from a source with incentives to claim otherwise. This finding suggests that vot-
ers may even overshoot the specific opposition forecast, potentially believing that the opposition
is still under-stating economic performance, while high trust of the DCB does not cause voters to
deviate from their prior when it is confirmed by the DCB. Among sophisticated voters with current
unemployment estimates between 5% and 7%, and who are thus expected to increase their expec-
tations in response to the 7% treatment, the converse relationship also holds: the Online Appendix
shows that receiving a pessimistic forecast (relative to their current perspective) from the DCB or
government is more credible than from the opposition. Turning to the 5% treatments, the fourth
and sixth coefficient tests similarly show that the DCB and opposition sources cause significantly
larger reductions in unemployment expectations than the government source. In this more posi-
tive outlook, we also cannot reject the possibility that voters regard the DCB’s and opposition’s
forecasts as equally credible. These results support our claim that sophisticated voters are indeed
particularly sensitive to the source of new economic information.
Although they fail to systematically discern differences in source credibility, unsophisticated
voters still substantially alter their unemployment expectations. Since the average unsophisticated
voter believes the current unemployment rate is 11.0% and expects the rate to reach 11.5% at the
end of 2013 (in the control group), the large reductions after receiving either forecast are consistent
with previous research emphasizing the malleability of the least informed (e.g. Converse 1962;
Zaller 1992). However, contrary to such theories, we find that sophisticated voters also update
their beliefs after receiving new economic information. Column (3) shows that all treatments
except the DCB and government 7% projections significantly alter the unemployment expectations
of sophisticated voters. The lack of effect for these two treatments reflects the prior of 7.1% (in
the control group) hardly deviating from the 7% treatment. Furthermore, relative to the difference
between their current unemployment estimate and the treatment projection, sophisticated voters
proportionately change their beliefs as much as unsophisticated voters. The next section examines
20

whether these changes in stated beliefs are sufficiently important to translate into vote intentions.
3.3 Alternative interpretations
A key concern that could potentially undermine the interpretation of our findings is that differences
in sophistication actually reflect differences in partisanship. Although analyses in European con-
texts have generally found policy preferences to more strongly drive partisan choices (e.g. Adams
2012; Budge, Crewe and Farlie 1976), an influential literature—based primarily on studies from
the U.S.—has found that differential updating is strongly moderated by partisanship (e.g. Boudreau
and MacKenzie 2014; Bullock 2011; Healy and Malhotra 2013). However, contrary to the expec-
tation that partisanship would reduce voter responses to the treatments, we find that sophisticated
voters are more sensitive to source credibility. Furthermore, in addition to our measure of political
sophistication being balanced across measures of previous vote choice, we also find no evidence of
differential updating by political allegiance: the Online Appendix demonstrates that respondents
who voted for a government (right) party at the 2011 election did not differentially update their
beliefs when provided with information from the government (opposition). We similarly found
no difference when defining left and right-wing supporters as respondents who voted left or right
party in the 2007 election. Furthermore, we find no evidence of a more complex conditional rela-
tionship: the Online Appendix shows that even within sophisticated and unsophisticated groups of
voters, there are no differential responses to treatments by past partisanship.
Although, as noted above, our measure of voter sophistication is highly correlated with mea-
sures used in previous studies, and serves as a sufficient statistic for such alternative measures in
the context of updating economic expectations, we nevertheless examine the robustness of this
measure. We compute a summative scale containing commonly used (standardized) indicators of
sophistication—namely education, frequency of watching the news, frequency of discussing pol-
itics, self-identification as politically informed, and (log) wages—and divided respondents above
and below the median scale score. In the Online Appendix, we show broadly similar differences
21

by this measure of sophistication. For both the 5% and 7% treatments, sophisticated voters up-
date significantly more when the information is provided by the DCB than political parties, while
the opposition but not the government 5% claim is statistically significant. Conversely, unsophis-
ticated voters do not differentially update across sources. Unsurprisingly, given the contextual
relevance of our measure and its predictive power vis-a-vis standard measures, these estimates are
less precise than our preferred measure.
4 Effects of unemployment expectations on economic voting
The preceding analysis has shown that information about aggregate unemployment projections
affects the expectations of all Danes regarding the economy’s prospects. While sophisticated re-
spondents were sensitive to differences in source credibility, unsophisticated voters updated their
beliefs more indiscriminately. We now examine the implications for economic voting. We first ask
whether lower unemployment expectations increase the likelihood that respondents would vote for
the government. Of particular importance for standard political economy models of vote choice,
but also strategists determining a party’s public statements, we then ask which types of voters
vote according to their unemployment expectations. Finally, we examine mechanisms to ensure to
check our economic voting interpretation of the evidence.
4.1 Evidence of economic voting on average
Table 2 reports estimates of equation (2), identifying the average effect of a percentage point in-
crease in unemployment expectations on vote intention among individuals whose expectations are
affected by the instruments. The outcomes in columns (1)-(6) are indicators for supporting a par-
ticular party or group of parties. The large F statistic confirms a strong first stage (see Online
Appendix for point estimates).
Providing strong evidence for economic voting, the exogenous provision of economic infor-
22

Table 2: Effect of unemployment expectations on vote intention
(1) (2) (3) (4) (5) (6)Govt. Soc. Dem. Soc. Lib. Soc. Peop. Right Liberals
Unemployment -0.035** -0.016 -0.016* -0.003 0.034** 0.024*expectations (%) (0.014) (0.011) (0.009) (0.007) (0.015) (0.014)
First stage F statistic 32.64 32.64 32.64 32.64 32.64 32.64Observations 5,705 5,705 5,705 5,705 5,705 5,705Outcome mean 0.32 0.17 0.09 0.06 0.41 0.28Unem. exp. mean 7.98 7.98 7.98 7.98 7.98 7.98Unem. exp. std. dev. 3.55 3.55 3.55 3.55 3.55 3.55
Notes: The dependent variables are indicators for intending to vote for (1) a party in the governing coalition, (2)the Social Democratic Party, (3) the Social Liberal Party, (4) the Socialist People’s Party, (5) any right-wing party,and (6) the Liberal Party. All specifications are estimated using 2SLS, and control for current unemploymentexpectations. Robust standard errors are provided in parentheses. ∗p < 0.1,∗∗ p < 0.05,∗∗∗ p < 0.01.
mation causes voters to substantially alter their vote intention. Column (1) finds that a percentage
point decrease in unemployment expectations causes the average complier to increase their support
for the parties of government by 3.5 percentage points.27 Increased government support is almost
exactly mirrored by the decrease in support for right-wing parties in column (5), with the majority
of votes coming from the main right-wing Liberal party shown in column (6). In the context of
coalition politics, proportional representation, and especially the extremely close recent Danish
elections, information about aggregate unemployment could easily have altered the composition
of government. Even by the standards of countries with greater clarity of responsibility, the effect
is very substantial—in spite of vote intention being asked 18 questions after the treatment.
While the allocation of credit and blame for the economy’s progress is usually relatively clear
when there is a single-party government, voter sanctioning is not obvious among coalition part-
ners (Anderson 1995; Duch and Stevenson 2008). Columns (2)-(4) disaggregate the government
vote share by the three parties in the governing coalition. The results clearly indicate that the two
27The reduced form estimates show similar results in the Online Appendix.
23

largest coalition partners—the Social Democrats and the Social Liberal Party, who had 44 and
17 seats and 10 and 6 cabinet positions respectively—are the sole beneficiaries, both gaining 1.6
percentage point increases in the probability of a respondent voting for them for each percent-
age point decrease in unemployment expectations. This represents a relatively larger gain for the
smaller Social Liberal party. In line with the findings of Anderson (1995) and Duch, Przepiorka
and Stevenson (N.d.), responsibility is assigned to the parties with greatest control over economic
policy: while the Social Democrats led the coalition and secured the Premiership, the leader of the
Social Liberals—who campaigned on their centrist economic agenda—became Minister for the
Economy and Interior. The intended vote share of the more extreme left-wing Socialist People’s
Party, which held 16 seats and 6 cabinet positions, is essentially unaffected.
4.2 Voter sophistication and the capacity to vote economically
While unemployment expectations significantly affect respondent vote intention on average, it is
not clear that unemployment expectations equally affect the political preferences of all voters. We
examine the heterogeneous effects—primarily by voter sophistication—of unemployment expec-
tations on intending to vote for a party in the governing coalition in Table 3 by splitting our sample.
Despite substantially altering unemployment expectations among unsophisticated voters, our es-
timates provide clear evidence that economic information only induces economic voting among
sophisticated voters.
The small and statistically insignificant coefficient in column (1) indicates that unemployment
expectations do not substantially affect vote choice among unsophisticated voters. Thus, although
those with the least accurate beliefs about current unemployment both receive and accept informa-
tion about unemployment, this does not translate into vote intentions.
Conversely, column (2) reports a large effect among sophisticated voters: a percentage point
decrease in unemployment expectations increases the probability that a respondent intends to vote
for a government party by six percentage points. To demonstrate the robustness of these differ-
24
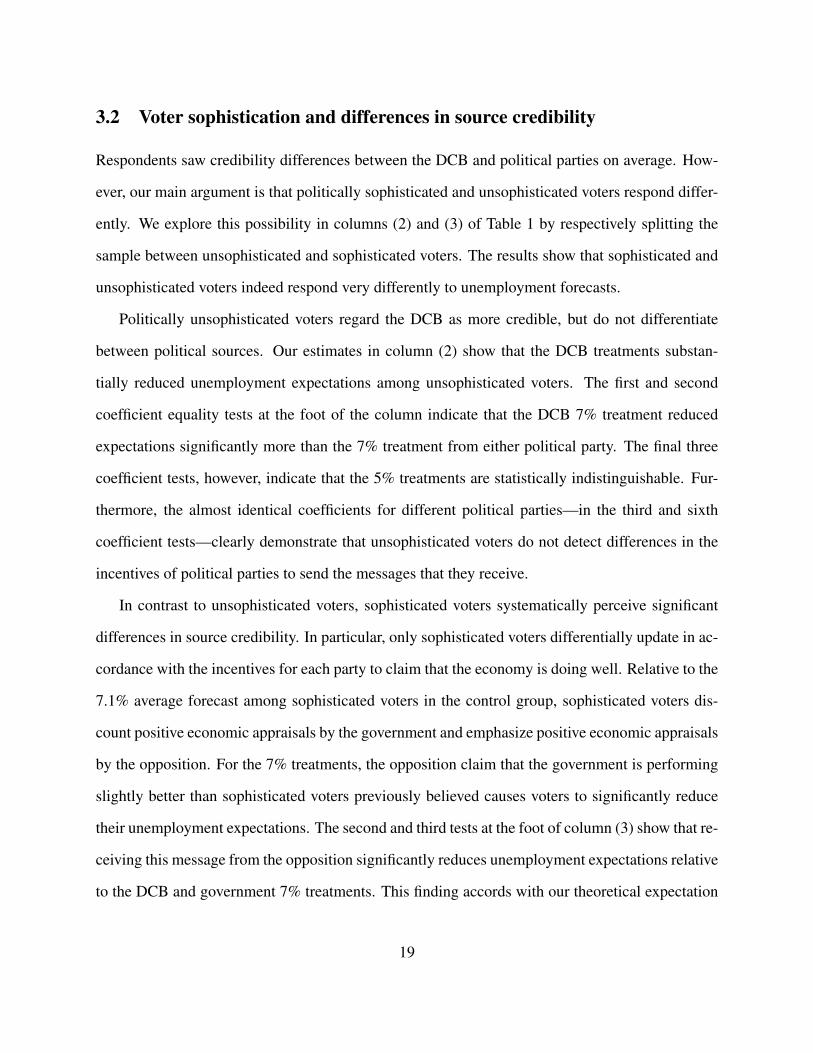
Table 3: Effect of unemployment expectations on vote intention, by voter sophistication
Outcome: intend to vote for the government(1) (2) (3) (4) (5) (6)
Unsophist. Sophist. Non-swing Swing Keep Lowervoters voters voters voters immig. immig.
benefits benefits
Unemployment -0.016 -0.061*** -0.050** -0.036 -0.028* -0.035expectations (%) (0.013) (0.024) (0.023) (0.023) (0.016) (0.027)
Observations 2,533 3,172 2,173 1,654 4,303 1,402First stage F statistic 20.34 66.63 13.43 13.14 23.37 12.71Outcome mean 0.30 0.34 0.37 0.26 0.27 0.47Unem. exp. mean 9.51 6.76 7.91 7.91 8.01 7.90Unem. exp. std. dev. 4.72 1.24 3.57 3.47 3.51 3.69
Notes: The dependent variable in all specifications is an indicator for voting for a party in the governing coalition.The head of each column defines the subset of respondents that each specification was estimated for. All spec-ifications are estimated using 2SLS, and control for current unemployment expectations to increase efficiency.Robust standard errors are provided in parentheses. ∗p < 0.1,∗∗ p < 0.05,∗∗∗ p < 0.01.
ences by sophistication, the Online Appendix also shows substantively similar results when using
our alternative measure of sophistication combining commonly popular measures of political so-
phistication. Since, as noted above, sophistication is uncorrelated with measures of partisanship,
the differential voting responses by sophistication are not being driven by partisan affiliation.28
Together, these findings highlight an important limit on the provision of political information:
only a subset of those who update their beliefs translate such beliefs into actions, and those who
update the most are not necessarily most likely to vote economically. In conjunction with our ear-
lier finding that only sophisticated voters are able to discern subtle differences in source credibility,
the results suggest that politically unsophisticated voters lack the will or the capacity to vote ac-
cording to their evaluations of government competence. To better differentiate a lack of will from
a lack of capacity, we investigate whether unsophisticated voters are disproportionately partisan or
28The Online Appendix also demonstrates that voters that voted for a left party are not morelikely to support the leftist governing coalition when their unemployment expectations are lower.
25

simply care about other policy issues.
Some standard political economy models suggest an alternative interpretation of our results,
that non-partisan “swing” voters are the most likely to transfer their votes to a party on the basis
of competence (e.g. Lindbeck and Weibull 1987). If our sophisticated voters are swing voters, this
would explain our results. We test this by exploiting the panel structure of the dataset to define an
indicator for the 43% of respondents who reported voting for different parties at the 2007 and 2011
elections.29 Columns (3)-(4) of Table 3 demonstrate that such swing voters are not driving changes
in government support. Rather, the effect of unemployment expectations among swing voters,
which is identical across swing voter definitions, is statistically indistinguishable from zero.30
Despite the fact that they do not fail to update their expectations, the Online Appendix clearly
shows that Denmark’s swing voters—who discuss politics less, are less educated and have lower
math test scores—are characterized by low political sophistication. These differences are also
likely to be compounded by the complexity of assigning responsibility over economic policy to
different parties in Denmark’s PR electoral system defined by coalition governments, many parties
and unstable alliances in the political center (Anderson 1995; Powell Jr. and Whitten 1993).
A second alternative explanation for swing and less sophisticated voters not engaging in eco-
nomic voting is that economic competence is not a salient issue among these voters (e.g. Shayo
2009). Rising immigration in Denmark has become a second political cleavage in recent years,
so it is possible that such voters are instead principally concerned with this issue. However, voter
opinions and contextual data do not support this possibility. Columns (5) and (6) in Table 3 show
that economic voting is similarly prevalent across those supporting and opposing the reinstate-
29The Online Appendix shows that the results are robust to instead using an indicator for the23% whose 2011 vote differed from their 2012 vote intentions.
30Given the first stage for swing voters is especially strong, this result does not reflect swingvoters failing to update their unemployment expectations. To ensure our definition of swing votersis not picking up shifts to parties offering similar platforms, we also calculated measures for leftand right party groupings and examined swings to the left and swing to the right and in each casefound similar results. The results are similarly robust to defining swing voters as individuals whose2011 and 2012 survey vote intentions differed.
26
ment of separate and lower state benefits for immigrants.31 Furthermore, we show in the Online
Appendix that there are no differences by parish (or municipality) immigrant share.
4.3 Mechanisms
The key theoretical claim underpinning economic voting is that, conditional on receiving credible
information, unemployment expectations affect vote choice through voter perceptions of govern-
ment competence. We test this mechanism in column (1) of Table 4 by examining the effect of
unemployment expectations on respondent confidence in the government. The results show that
lower unemployment expectations significantly increase confidence in the Danish government,
and thus further support the occurrence of economic voting. Consistent with sophisticated voters
regarding unemployment as a more important signal of government performance than unsophisti-
cated voters, columns (2) and (3) show that the confidence of sophisticated voters is three times
more responsive to a given change in unemployment expectations.
Nevertheless, a potentially confounding explanation of our results is that evaluations of govern-
ment competence are not changing, but rather that lower unemployment expectations have shifted
policy preferences toward those associated with left-wing parties (e.g. Meltzer and Richard 1981).
Self-interested voters maximizing their expected income should decrease their support for redis-
tribution and unemployment insurance to the extent that higher aggregate unemployment expecta-
tions are taken as a signal of economy-wide, rather than individual-specific, economic prospects.
If aggregate unemployment expectations instead primarily update a voter’s subjective probability
of being unemployed, support for redistribution and unemployment insurance should increase. We
show these predictions formally in the Online Appendix.
However, changes in policy preferences cannot account for our results. First, we examine five-
and three-point scales that respectively increase with general support for redistribution and specific
support for unemployment benefits. The precisely estimated null effects in columns (4) and (5) of
31We use 2012 survey responses here because the 2013 question is post-treatment.
27

Table 4: Economic voting mechanism tests
(1) (2) (3) (4) (5) (6)Conf. govt. Conf. govt. Conf. govt. Redist. Unem. Red-
(unsophist.) (sophist.) insurance Green
Unemployment -0.100*** -0.051* -0.141*** 0.032 -0.011 0.004expectations (%) (0.029) (0.029) (0.048) (0.030) (0.018) (0.008)
First stage F statistic 33.43 21.22 66.67 32.64 33.51 32.64Observations 5,688 2,524 3,164 5,705 5,614 5,705Outcome mean 2.69 2.64 2.73 3.20 2.23 0.06Outcome std. dev. 1.00 1.03 0.97 1.02 0.61 0.25
Notes: The dependent variables are (1) a five-point scale of confidence in the government, (2) a five-point scalemeasuring support for redistribution, (3) a three-point scale measuring support for increasing unemploymentinsurance, and (4) an indicator for intending to vote for the Red-Green Alliance. All specifications are estimatedusing 2SLS, and control for current unemployment expectations to increase efficiency. Robust standard errors areprovided in parentheses. ∗p < 0.1,∗∗ p < 0.05,∗∗∗ p < 0.01.
Table 4 show no support for either claim.32 Second, the existence of left-wing parties outside the
government provide a further placebo test for our economic voting interpretation. The Red-Green
Alliance—the most left-wing party represented in the Danish Parliament—might expect to pick up
votes if the information treatments were inducing a change in preferences. Column (6) shows that
changes in unemployment expectations do not affect the probability of voting for the Red-Green
Alliance. Together, this evidence reinforces the conclusion that economic voting is the principal
political manifestation of changes in aggregate unemployment expectations.
5 Conclusion
A key question for democratic accountability is when information causes voters to re-evaluate the
government’s competence and act politically on their beliefs by voting economically. We move
32Unreported results show that the effect does not differ by income level. However, the OnlineAppendix shows that economic voting is confined to those individuals with relatively moderateredistributive preferences.
28

beyond existing work by focusing on the interaction between source credibility and voter polit-
ical sophistication. We show that although unemployment forecasts cause all types of voters to
update their unemployment expectations, only sophisticated voters are able to discern both in-
stitutional and political differences in source credibility. Despite the fact that poorly informed
voters at least minimally engage with new information, only among sophisticated voters—which
are neither extreme partisans nor voters that regularly vote for different parties—does information
impact economic voting. We conclude that it is the interaction of credible information and political
sophistication that explains when new economic information will affect political behavior.
We acknowledge several limits on the external validity of this experiment. First, we only
examine Denmark. However, finding effects in Denmark’s complex institutional environment and
open economy may represent a lower bound on information’s effects. Also, in few other countries
could we so easily draw the panel and registry data that we use. Second, we cannot study the
likelihood that the least politically engaged voters do not translate information into political action
because they do not consume the information in the first place. Rather, we force respondents to
receive new economic information, but—contrary to Zaller (1992)—find that the political behavior
of sophisticated voters is more responsive to such information than the behavior of unsophisticated
voters. Finally, we do not model or analyze the “real” process by which voters filter information
out of conflicting signals. That would be another valuable project.
The democratic implications of our findings are somewhat mixed. While economic voting is
generally regarded as positive for democracy (Anderson 2007), our results show that information
about aggregate unemployment is insufficient to induce politically unsophisticated voters to link
their unemployment expectations to government performance—and this is not because such vot-
ers care about other issues. Nevertheless, finding any effect in Denmark’s complex institutional
environment and open economy is an important result because it may represent a lower bound on
information’s effects. Furthermore, since unsophisticated voters cannot differentiate credible from
incredible information, the fact that such voters do not act on their information ensures the process
29

cannot be strategically manipulated by political parties supplying incredible information.
Our results also illuminate political party communication strategies. That the least politically
engaged voters do not translate their information into political action may explain why political
parties in developed democracies target their platforms toward prominent and well-informed vot-
ers (Adams and Ezrow 2009; Gilens 2005). Furthermore, our results suggest that parties can bene-
fit electorally from providing specific macroeconomic information, and this is of course prevalent
among successful governments. However, since less credible information still affects voter beliefs,
our results question why parties do not distort the facts more often. While this may entail los-
ing credibility in some instances (see Druckman 2001), the line between proclaiming truths and
falsehoods is often unclear if multiple numbers are available. An important challenge for future
research is to understand when political parties choose to send more or less credible signals.
30

References
Adams, James. 2012. “Causes and electoral consequences of party policy shifts in multiparty elec-
tions: Theoretical results and empirical evidence.” Annual Review of Political Science 15:401–
419.
Adams, James and Lawrence Ezrow. 2009. “Who do European parties represent? How West-
ern European parties represent the policy preferences of opinion leaders.” Journal of Politics
71(1):206–223.
Adolph, Christopher. 2014. Bankers, Bureaucrats, and Central Bank Politics: The Myth of Neu-
trality. Cambridge University Press.
Anderson, Christopher. 1995. Blaming the Government: Citizens and the Economy in Five Euro-
pean Democracies. ME Sharpe.
Anderson, Christopher J. 2007. “The End of Economic Voting? Contingency Dilemmas and the
Limits of Democratic Accountability.” Annual Review of Political Science 10:271–296.
Angrist, Joshua D. and Guido W. Imbens. 1995. “Two-Stage Least Squares Estimation of Average
Causal Effects in Models With Variable Treatment Intensity.” Journal of the American Statistical
Association 90(430):431–442.
Ansolabehere, Stephen, Marc Meredith and Erik Snowberg. 2014. “Mecro-Economic Voting:
Local Information and Micro-Perceptions of the Macro-Economy.” Economics and Politics
26(3):380–410.
Ashworth, Scott. 2012. “Electoral accountability: recent theoretical and empirical work.” Annual
Review of Political Science 15:183–201.
Baron, David P. 2006. “Persistent Media Bias.” Journal of Public Economics 90(1):1–36.
31

Barro, Robert J. 1973. “The Control of Politicians: An Economic Model.” Public Choice 14:19–
42.
Barro, Robert J. and David B. Gordon. 1983. “Rules, discretion and reputation in a model of
monetary policy.” Journal of Monetary Economics 12(1):101–121.
Besley, Timothy and Andrea Prat. 2006. “Handcuffs for the Grabbing Hand? Media Capture and
Government Accountability.” American Economic Review 96(3):720–736.
Boudreau, Cheryl and Scott A. MacKenzie. 2014. “Informing the Electorate? How Party Cues
and Policy Information Affect Public Opinion about Initiatives.” American Journal of Political
Science 58(1):48–62.
Budge, Ian, Ivor Crewe and Dennis Farlie. 1976. Party identification and beyond: representations
of voting and party competition. John Wiley and Sons.
Bullock, John. 2011. “Elite Influence on Public Opinion in an Informed Electorate.” American
Political Science Review 105(3):496–515.
Chiang, Chun-Fang and Brian Knight. 2011. “Media Bias and Influence: Evidence from Newspa-
per Endorsements.” Review of Economic Studies 78(3):795–820.
Converse, Philip E. 1962. The nature of belief systems in mass publics. Survey Research Center,
University of Michigan.
de Chaisemartin, Clement. 2014. “Tolerating defiance? Local average treatment effects without
monotonicity.” Warwick Economics Research Paper Series No. 1020.
Delli Carpini, Michael X. and Scott Keeter. 1996. What Americans Know about Politics and Why
It Matters. New Haven, CT: Yale University Press.
32
Druckman, James N. 2001. “On the limits of framing effects: who can frame?” Journal of Politics
63(4):1041–1066.
Druckman, James N., Erik Peterson and Rune Slothuus. 2013. “How elite partisan polarization
affects public opinion formation.” American Political Science Review 107(1):57–79.
Duch, Raymond M. 2001. “A developmental model of heterogeneous economic voting in new
democracies.” American Political Science Review pp. 895–910.
Duch, Raymond M. and Randolph T. Stevenson. 2008. The Economic Vote: How Political and
Economic Institutions Condition Election Results. Cambridge University Press.
Duch, Raymond M., Wojtek Przepiorka and Randolph T. Stevenson. N.d. “Responsibility Attribu-
tion for Collective Decision Makers.” American Journal of Political Science. Forthcoming.
European Commission. 2011. “Eurobarometer 74, Autumn 2010.”.
Fearon, James D. 1997. “Signaling Foreign Policy Interests Tying Hands versus Sinking Costs.”
Journal of Conflict Resolution 41(1):68–90.
Fearon, James D. 1999. Electoral accountability and the control of politicians: Selecting good
types versus sanctioning poor performance. In Democracy, Accountability, and Representation,
ed. Adam Przeworski, Susan C. Stokes and Bernard Manin. New York: Cambridge University
Press pp. 55–97.
Ferejohn, John. 1986. “Incumbent Performance and Electoral Control.” Public Choice 50:5–25.
Gaines, Brian J., James H. Kuklinski, Paul J. Quirk, Buddy Peyton and Jay Verkuilen. 2007. “Same
facts, different interpretations: Partisan motivation and opinion on Iraq.” Journal of Politics
69(4):957–974.
33

Gentzkow, Matthew and Jesse M. Shapiro. 2006. “Media Bias and Reputation.” Journal of Political
Economy 114(2):280–316.
Gerber, Alan and Donald P. Green. 1998. “Rational learning and partisan attitudes.” American
Journal of Political Science pp. 794–818.
Gerber, Alan S. and Gregory A. Huber. 2010. “Partisanship, political control, and economic as-
sessments.” American Journal of Political Science 54(1):153–173.
Gilens, Martin. 2005. “Inequality and Democratic Responsiveness.” Public Opinion Quarterly
69(5):778–796.
Gilens, Martin and Naomi Murakawa. 1994. Elite Cues and Political Decision-Making. In Political
Decision-Making, Deliberation and Participation, ed. Michael X. Delli Carpini, Leonie Huddy
and Robert Y. Shapiro. Oxford: Elsevier Science pp. 117–142.
Gilligan, Thomas W. and Keith Krehbiel. 1987. “Collective decisionmaking and standing commit-
tees: An informational rationale for restrictive amendment procedures.” Journal of Law, Eco-
nomics, and Organization 3(2):287–335.
Gomez, Brad T. and J. Matthew Wilson. 2001. “Political Sophistication and Economic Voting in
the American Electorate: A Theory of Heterogeneous Attribution.” American Journal of Politi-
cal Science 45(4):899–914.
Gomez, Brad T. and J. Matthew Wilson. 2006. “Cognitive heterogeneity and economic voting:
A comparative analysis of four democratic electorates.” American Journal of Political Science
50(1):127–145.
Grose, Christian R., Neil Malhotra and Robert P. Van Houweling. forthcoming. “Explaining Ex-
planations: How Legislators Explain Their Policy Positions and How Citizens React.” American
Journal of Political Science .
34

Healy, Andrew and Neil Malhotra. 2013. “Retrospective Voting Reconsidered.” Annual Review of
Political Science 16:285–306.
Huckfeldt, Robert. 2001. “The Social Communication of Political Expertise.” American Journal
of Political Science 45(2):425–438.
Jerit, Jennifer and Jason Barabas. 2012. “Partisan perceptual bias and the information environ-
ment.” Journal of Politics 74(3):672–684.
Kiewiet, D. Roderick. 1983. Macroeconomics and Micropolitics: The Electoral Effects of Eco-
nomic Issues. Chicago, IL: University of Chicago Press.
Ladd, Jonathan M. and Gabriel S. Lenz. 2009. “Exploiting a rare communication shift to document
the persuasive power of the news media.” American Journal of Political Science 53(2):394–410.
Larcinese, Valentino, Riccardo Puglisi and James M. Snyder. 2011. “Partisan bias in economic
news: Evidence on the agenda-setting behavior of U.S. newspapers.” Journal of Public Eco-
nomics 95(9):1178–1189.
Lenz, Gabriel S. 2012. Follow the Leader? How Voters Respond to Politicians’ Policies and
Performance. University of Chicago Press.
Lewis-Beck, Michael S. and Mary Stegmaier. 2000. “Economic Determinants of Electoral Out-
comes.” Annual Review of Political Science 3:183–219.
Lindbeck, Assar and Jorgen W. Weibull. 1987. “Balanced-budget redistribution as the outcome of
political competition.” Public choice 52(3):273–297.
Lodge, Milton and Charles S. Taber. 2013. The Rationalizing Voter. Cambridge University Press.
Lupia, Arthur and Mathew D. McCubbins. 1998. The Democratic Dilemma: Can Citizens Learn
What They Need to Know. Cambridge: Cambridge University Press.
35

Luskin, Robert C. 1987. “Measuring political sophistication.” American Journal of Political Sci-
ence 31(4):856–899.
Manin, Bernard, Adam Przeworski and Susan C. Stokes. 1999. Elections and Representation.
In Democracy, Accountability, and Representation, ed. Bernard Manin, Adam Przeworski and
Susan C. Stokes. Cambridge, MA: Cambridge University Press pp. 29–54.
Meltzer, Allan H. and Scott F. Richard. 1981. “A rational theory of the size of government.”
Journal of Political Economy 89:914–927.
Mondak, Jeffery J. 1994. Cognitive heuristics, heuristic processing, and efficiency in political
decision making. In Research in Micropolitics, Volume 4, ed. Michael X. Delli Carpini, Leonie
Huddy and Robert Y. Shapiro. Greenwich, Conn.: JAI Press Inc. pp. 117–142.
Mullainathan, Sendhil and Andrei Shleifer. 2005. “The Market for News.” American Economic
Review 95(4):1031–1053.
Nadeau, Richard, Richard G. Niemi, David P. Fan and Timothy Amato. 1999. “Elite Economic
Forecasts, Economic News, Mass Economic Judgments, and Presidential Approval.” Journal of
Politics 61(1):109–135.
Petty, Richard E. and John T. Cacioppo. 1981. Attitudes and Persuasion: Classic and Contempo-
rary Approaches. Westview Press.
Powell Jr., G. Bingham and Guy D. Whitten. 1993. “A Cross-National Analysis of Economic Vot-
ing: Taking Account of the Political Context.” American Journal of Political Science 37(2):391–
414.
Prior, Markus. 2013. “Media and political polarization.” Annual Review of Political Science
16:101–127.
36
Romer, Thomas. 1975. “Individual welfare, majority voting, and the properties of a linear income
tax.” Journal of Public Economics 4(2):163–185.
Shayo, Moses. 2009. “A model of social identity with an application to political economy: Nation,
class, and redistribution.” American Political Science Review 103(2):147–174.
Slothuus, Rune and Claes H. De Vreese. 2010. “Political parties, motivated reasoning, and issue
framing effects.” Journal of Politics 72(3):630–645.
Spence, Michael. 1973. “Job market signaling.” Quarterly Journal of Economics 87(3):355–374.
Stubager, Rune. 2012. “The parliamentary election in Denmark, September 2011.” Electoral Stud-
ies 31(4):861–864.
Tetlock, Philip E. 2010. “Experts all the way down.” The National Interest
November/December:76–86.
Tversky, Amos and Daniel Kahneman. 1974. “Judgment under uncertainty: Heuristics and biases.”
Science 185(4157):1124–1131.
Zaller, John. 1992. The Nature and Origins of Mass Opinion. Cambridge University Press.
37
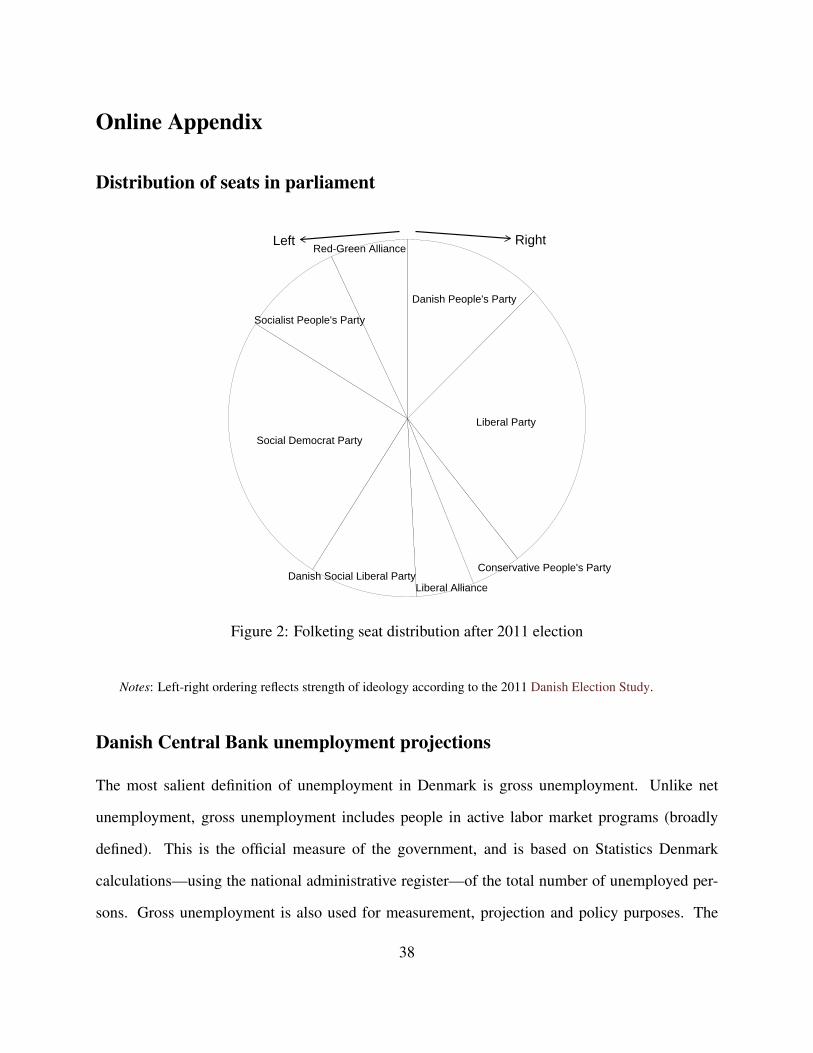
Online Appendix
Distribution of seats in parliament
Danish People's Party
Liberal Party
Conservative People's Party
Liberal AllianceDanish Social Liberal Party
Social Democrat Party
Socialist People's Party
Red-Green AllianceLeft Right
Figure 2: Folketing seat distribution after 2011 election
Notes: Left-right ordering reflects strength of ideology according to the 2011 Danish Election Study.
Danish Central Bank unemployment projections
The most salient definition of unemployment in Denmark is gross unemployment. Unlike net
unemployment, gross unemployment includes people in active labor market programs (broadly
defined). This is the official measure of the government, and is based on Statistics Denmark
calculations—using the national administrative register—of the total number of unemployed per-
sons. Gross unemployment is also used for measurement, projection and policy purposes. The
38
current (not seasonally corrected) gross unemployment rate as announced in January 2013 was
6.4%, although later revisions put it at 6.5%.
The projection that we cite for the DCB was derived as follows. In 2012Q3, the DCB projected
the (not seasonally adjusted) annual change in the number of unemployed persons using both a base
projection and multiple alternative scenarios.33 We estimate the DCB’s projection by adding this
projected change to the current gross unemployment rate.34 We thus added the projected change
for late 2013 over late 2012 to the gross unemployment rate in late 2012 (6.0%). This yields a
projection of 6.8% for the bad state and 6.5% for the baseline projection; we rounded this up to
formulate our “almost 7%” treatment condition.
Bayesian interpretation of information updating
Our approach can be clearly shown in a Bayesian updating framework. Specifically, we write
individual i’s conditional posterior belief about future unemployment level, U , as:
P(U = u|Xi,Zi) = P(U = u|Xi)P(Zi|U = u,Xi)
P(Zi|Xi),
where Zi is an information shock received by i, and Xi captures i’s characteristics (e.g. ideology
and sophistication). The location and specificity of i’s prior belief, P(U = u|Xi), depends upon
Xi. The likelihood P(Zi|U = u,Xi) represents i’s interpretation of the informativeness of the signal
they received: P(Zi|U = u,Xi)/P(Zi|Xi) = 1 or P(Zi|U = u,Xi) = P(Zi|Xi) captures i not believing
that receiving signal Zi is related to the likelihood that the state of the world is U = u. H1 and H2
hypothesize that P(Zi|U = u,Xi) (or more simply P(Zi|U = u) because individual characteristics33See Danmarks Nationalbank. Monetary Review, 3rd Quarter, 2012. Net unemployment is still
computed by macroeconomic models accumulated over many years, despite gross unemploymentbeing the main measure that is ultimately reported. This is because the DCB only projects thetotal number of unemployed persons. The central bank does not provide monthly projections, onlyannual.
34We thus rely on the very reasonable assumption that net and gross unemployment changes arehighly correlated.
39

play a weak role in objective credibility) is large where Zi comes from an expert or surprising
source. H4 instead hypothesizes that updating depends upon the interaction of the source of Zi
and Xi. H3 allows for P(U = u|Xi) to be large, but also implies that Zi does not add much new
information.
Formal model of information and policy preferences
We extend the Romer (1975) and Meltzer and Richard (1981) framework to include uncertainty
over income in a simple way.
Take a continuum of voters of unit mass, differentiated by their income prospects. Voter i’s
realized income is yi ∈ Y ⊆ R+. We build in uncertainty in a simple fashion. Individual i’s
uncertainty at the time of determining their policy preferences is operationalized as follows: with
probability pi(zi) ∈ (0,1) their income is yLi , and with probability 1− pi(zi) their income is yH
i ,
where yHi > yL
i and zi denotes the amount of information i possess about the economy (increases in
zi represent more information). Assume pi(zi) is differentiable and monotonic in zi. To save space,
define i’s expected income as Yi(zi) ≡ pi(zi)yLi +(1− pi(zi))yH
i .
Voters are also uncertain about the aggregate distribution of income. In particular, with voter
i assigns probability q(zi) ∈ (0,1) to economy-wide average income being yL, and probability
1− q(zi) to economy-wide average income being yH , where yH > yL. Assume q is differentiable
and monotonic in zi. Define i’s expected average income in the economy as Y (zi)≡ q(zi)yL+(1−
q(zi))y
The government must choose a tax and benefit policy pair (τ ,T ) to be implemented after
income is realized, where τ ∈ [0,1] is a proportional tax rate levied on y and T ≥ 0 is a lump-sum
transfer made to all citizens. There is a cost φ (τ)y to increasing τ , where∫
y∈Y ydF(y) = y is
the realized mean income and φ : [0,1] 7→ R+ is a convex-increasing function such that φ ′(τ) >
0,φ ′′(τ)> 0 and φ (0) = 0. This cost could be labor supply disincentives, capital misallocation or
the inefficiency of revenue collection. We assume that the tax rate cannot depend upon the realized
40

state of the world.
We now derive individual i’s preferences over policies before income is realized. From the
perspective of voter i, the ex ante government budget constraint is:
[τ−φ (τ)]Y (zi) ≤ T . (3)
Since the budget constraint will bind in equilibrium, the problem is reduced to a single dimensional
problem in τ .
A voter with income y has the following policy utility function, receiving utility from post-tax
income and the lump-sum transfer:
u((1− τ)Yi(zi)+ [τ−φ (τ)]Y (zi)+ (1− τ)Y (zi)+ [τ−φ (τ)]Y (zi)
)= u((1− τ)Yi(zi)+ [τ−φ (τ)]Y (zi)
), (4)
where u : R 7→ R is a concave-increasing function: u′(·) > 0,u′′(·) < 0 and u(0) = 0. Tax rates
have two effects on voter utility: redistribution of income and a (disincentive) cost to increasing
taxation.
Given preferences are strictly concave in τ , they are single-peaked. We can identify the ideal
policy of voter i as:
τ∗i = max
{(φ ′)−1
(1− Yi(zi)
Y (zi)
),0}
. (5)
This reiterates the Romer-Meltzer-Richard logic that i’s preference for taxation is increasing as
their expected income relative to the expected average income falls. Note that all Yi(zi) > Y (zi)
prefer τ∗i = 0.
In the space where τ∗i > 0, or for voters with expected incomes exceeding the average expected
41

income, the comparative static with respect to new information is:
dτ∗idzi
=p′i(zi)(yH
i − yLi )Y (zi)−q′(zi)(yH− yL)Yi(zi)
φ ′′(τ)[Y (zi)]2. (6)
Given yHi − yL
i > 0 and yH − yL > 0, and expected individual and aggregate income is positive, it
is clear that we have opposing effects when sgn(p′i(zi)) = sgn(q′(zi))—this is the obvious case
for this paper as it is very unlikely that aggregate information would cause voters to differentially
update. Intuitively, the first term in the numerator captures how information affects i’s taxation
preferences associated with their own expected income, while the second term captures how infor-
mation affects taxation preferences in the rest of the economy. These are easiest to see by setting
q′(zi) = 0 and p′i(zi) = 0 respectively.
Without loss of generality (the results will just be the opposite), let us focus on the case where
sgn(p′i(zi)) = sgn(q′(zi)) ≤ 0; this turns out to be the most appropriate case for our analysis
because our information treatments cause voters to become more positive about the economy. It
is now clear that new information causing voters to reduce their belief of being unemployed and
reduce their belief of others being unemployed has the expected effects: the fall in the likelihood
of i being unemployed reduces their preference for taxation (first term in (6)), while the fall in
the likelihood of others being unemployed increases their preference for taxation (second term in
(6)). These effects clearly conflict, with the individual income incentive overpowering the general
economy incentive when:
p′i(zi)
q′(zi)>
(yH− yL)Yi(zi)
(yHi − yL
i )Y (zi), (7)
or when the change in pi(zi) is sufficiently large relative to the change in q(zi).
These insights can be easily extended to voter in Denmark, where politics is primarily based
on a left-right axis. Simplifying the analysis such that voters choose between left and right parties,
it is clear that any increase in preferred tax rate should correspond to increased support for the
42

left-wing government.
Variable definitions and summary statistics
Information source treatments. Respondents were randomly assigned to a control group receiving
no information, one of six groups receiving the prime “Assume that that the [DCB/government/Liberals]
estimates unemployment in 2013 will be [almost 7%/around 5%]” or “The DCB estimates unem-
ployment in 2013 to be almost 7%.” Respectively, these statements translate as: “Antag at [Na-
tionalbanken/Regeringen/Venstre] vurderer at arbejdsløsheden i 2013 vil være [knap 7%/ca. 5%]”
and This translates from: “Nationalbanken vurderer at arbejdsløsheden i 2013 vil være knap 7%.”
In the main text, treatments are denoted, for example, by “DCB 7% treatment”.
Unemployment expectations. The percentage (not restricted to integers) reported by the re-
spondent in response to the question “What is your best estimate of what unemployment will be in
2013? We would like your best estimate, even if you are not entirely sure.” This translates from:
“Hvad er dit bedste bud pa hvad arbejdsløsheden vil blive i 2013? Vi vil gerne have dit bedste bud,
ogsa selvom du ikke er helt sikker.” This question immediately followed the treatment.
Current unemployment estimate. The percentage (not restricted to integers) reported by the
respondent in response to the question “Unemployment in Denmark is typically measured by the
unemployment rate, that is, the share of people who want to work but don’t have a job. Over the
last 25 years, the unemployment rate has been between 1.5 and 12 %. What is your estimate of
the current unemployment rate in Denmark? We would like your best estimate, even if you are not
entirely sure.” This question immediately preceded the treatment.
Sophisticated voters. Indicator coded 1 for respondents that correctly identified the current
unemployment rate as between 5% and 8%, or within 1.5 percentage points of the true level (6.5%)
in January 2013.
Vote intention. Respondent stated the party that would vote for in response to the question
“How would you vote tomorrow?” Respondents choose one of the following: Social Democrat
43

Party, Social Liberal Party, Conservative People’s Party, Socialist People’s Party, Danish People’s
Party, Liberal Party, Liberal Alliance, or Red-Green Alliance. Answers not stating a party were:
blank, no answer, other, would not vote, and don’t know. We counted the Conservative People’s
Party, Danish People’s Party, Liberal Party, and Liberal Alliance as right-wing parties. We counted
the Social Democratic Party, Social Liberal Party and Socialist People’s Party as parties in govern-
ment.
Confidence in the government. Responded were asked, on a scale from great mistrust (1) to
great trust (5), how much they trust the government. This question was asked 11 questions after
the treatment was administered.
Redistribution. This variable measures support for redistribution on a five-point scale ranging
from “every man for himself” (1) to the government “should help the poor a lot” (5). This was
in response to the prime “Some think the Government should do all it can to raise the standard of
living for poor Danes: that is 1 on the scale. Others think it is not the responsibility of government,
each should take care of themselves: that is 5.” This question was 19 questions after the treatment.
Unemployment insurance. Three-point “less-same-more” response to the question “The eco-
nomic crisis has meant that many people have lost their job. Do you think that the government
should support the unemployed?” this question was asked immediately after the question eliciting
the respondent’s unemployment expectations.
Lower immigrant benefits. Indicator coded 1 for respondents who responded that separate and
lower benefits for immigrants should be reinstated in 2012.
Denmark economic prospects. Five point scale, from “worsen considerably” to “improve con-
siderably, response to the question of how the Danish economy overall will do in 2013.
Improving economic prospects. Indicator coded 1 for individuals responding that the Danish
economy for 2013 will be “much better” or “better” than 2012. This variable is re-coded from
Denmark economic prospects.
Frequently discuss politics. The sum of the set of indicators coded 1 for respondents who
44

answered that they talk to family, friends, neighbors, work colleagues or others about politics.
News every day. Indicator coded 1 for respondents who state that they watch or read about
politics and economics in the news “every day”.
Wage income 2012 (log). Total wage income before taxation; we then added 1 and took the
natural logarithm.
Own job risk. The probability assigned by the respondent to the possibility that they will
experience a period of unemployment in the forthcoming year.
Education. Three-point scale indicating the level of education achieved by the respondent:
1 is less than university education; 2 is some or complete undergraduate university; 3 is further
academic study.
Woman. Indicator coded 1 for women.
Voted left at last election. Indicator coded 1 for respondents who voted for one of the Social
Democrats, Social Liberals, Socialist People’s, or Red-Green Alliance parties in the 2011 election.
Voted right at last election. Indicator coded 1 for respondents who did not vote for a left party
at the 2011 election.
Voted left at 2007 election. Indicator coded 1 for respondents who voted for one of the Social
Democrats, Social Liberals, Socialist People’s, or Red-Green Alliance parties in the 2007 election.
Voted right at 2007 election. Indicator coded 1 for respondents who did not vote for a left party
at the 2007 election.
Swing voter (previous votes). Indicator coded 1 for respondents who provided different re-
sponses to the question asked respondents to recall who they voted for in the 2007 and 2011
elections.
Swing voter (previous intentions). Indicator coded 1 for respondents who provided different
responses to the vote intention questions asked in 2011 and 2012.
Extreme voter. Indicator coded 1 for respondents who answered either “should help the poor a
lot” or “every man for himself” to the redistribution question in 2012.
45

Municipal immigration share. The share of immigrants in the municipality that the respondent
resides in. Denmark contains 98 municipalities.
Parish immigration share. The share of immigrants in the parish that the respondent resides in.
The average parish contains around 2,500 residents. Parishes are the lowest administrative units in
Denmark.
Voter sophistication measure
We measure voter sophistication according to the accuracy of their current unemployment estimate.
As noted in the main text and above, a respondent is defined as sophisticated if their estimate is
within 1.5 percentage points of the true 6.5% unemployment rate in January 2013. Although this
is not a standard definition of political sophistication, it is particularly relevant for the case of
economic voting. Moreover, it turns out that knowledge of the economy effectively serves as a
sufficient statistic for more standard measures of political sophistication.
First, Table 6 shows that the absolute deviation of a respondent’s unemployment estimate
from the true rate is highly correlated with more standard measures of political sophistication.
In particular, columns (1)-(3) show that the absolute deviation is significantly negatively correlated
with frequency of watching the news, regular discussion of politics, wages (log), undergraduate
and postgraduate education, the number of correct answers on a math test, and a respondent’s
self-reported level of political information. This indicates that our definition of sophistication is
strongly positively correlated with this standard measures (since a low absolute deviation indicates
greater sophistication). Table 7 shows that these correlations equally hold when using the indicator
sophistication variable—an indicator for respondents with an absolute deviation that falls within
1.5 percentage points of the true current unemployment rate—used in the main paper. In this case,
a high value of the dependent variable represents greater sophistication.
Second, Tables 8 and 9 interact our treatments with various measures of political sophistication.
In both tables, all coefficients are estimated from a single regression controlling for all interactions
46

Table 5: Summary statistics
Obs. Mean Std. dev. Min. Max.
Dependent variablesSocial Democrat Party 5,705 0.17 0.37 0 1Social Liberal Party 5,705 0.09 0.29 0 1Socialist People’s Party 5,705 0.06 0.24 0 1Liberal Party 5,705 0.28 0.45 0 1Red-Green Alliance 5,705 0.06 0.25 0 1Confidence in government 5,688 2.69 1.00 1 5Redistribution 5,705 3.20 1.02 1 5Unemployment insurance 5,614 2.23 0.61 1 3
Dependent/endogenous variableUnemployment expectations 5,705 7.98 3.55 0 45
Treatment variablesControl 5,705 0.13 0.33 0 1DCB 7% treatment (combined) 5,705 0.25 0.44 0 1DCB 5% treatment 5,705 0.13 0.33 0 1Government 7% treatment 5,705 0.12 0.33 0 1Government 5% treatment 5,705 0.12 0.33 0 1Opposition 7% treatment 5,705 0.12 0.33 0 1Opposition 5% treatment 5,705 0.12 0.33 0 1
CovariatesCurrent unemployment estimate 5,705 8.58 4.31 0 45Sophisticated voter 5,705 0.56 0.50 0 1Swing voter (previous votes) 3,827 0.43 0.50 0 1Swing voter (previous intentions) 4,566 0.23 0.42 0 1News every day 5,705 0.72 0.45 0 1Improving economic prospects 5,675 0.34 0.47 0 1Municipal immigrant share 5,704 9.74 5.53 3.67 32.75Parish immigrant share 5,704 8.76 7.09 0 69.72Medium education 5,642 0.67 0.47 0 1High education 5,642 0.11 0.31 0 1Woman 5,705 0.49 0.50 0 1Frequently discuss politics 5,705 2.30 1.14 1 4Voted left at last election 5,705 0.50 0.50 0 1Voted right at last election 5,705 0.41 0.49 0 1Voted left at 2007 election 3,827 0.46 0.50 0 1Voted right at 2007 election 3,827 0.43 0.50 0 1Extreme voter 4,566 0.17 0.38 0 1Wage income 2012 (log) 5,532 10.19 5.15 0 *Lower immigrant benefits 5,705 0.25 0.43 0 1
Notes: An asterisk denotes a value that violates Statistics Denmark confidentiality requirements when using theregister data.
47
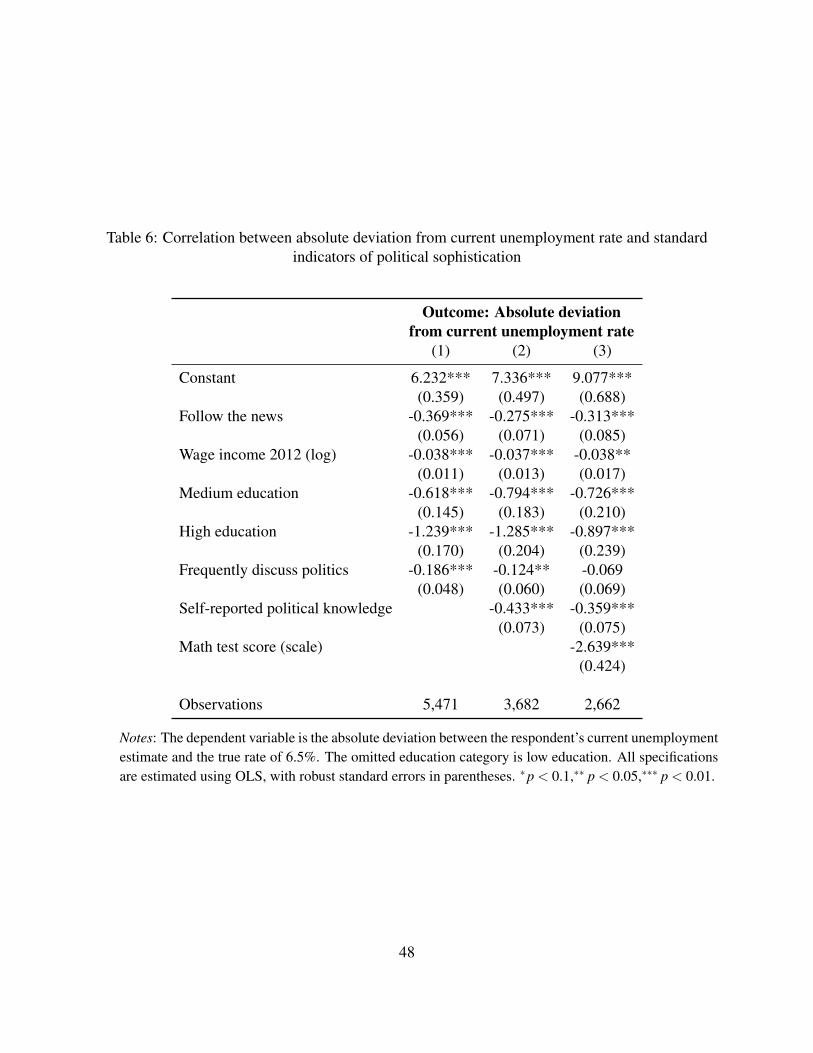
Table 6: Correlation between absolute deviation from current unemployment rate and standardindicators of political sophistication
Outcome: Absolute deviationfrom current unemployment rate
(1) (2) (3)
Constant 6.232*** 7.336*** 9.077***(0.359) (0.497) (0.688)
Follow the news -0.369*** -0.275*** -0.313***(0.056) (0.071) (0.085)
Wage income 2012 (log) -0.038*** -0.037*** -0.038**(0.011) (0.013) (0.017)
Medium education -0.618*** -0.794*** -0.726***(0.145) (0.183) (0.210)
High education -1.239*** -1.285*** -0.897***(0.170) (0.204) (0.239)
Frequently discuss politics -0.186*** -0.124** -0.069(0.048) (0.060) (0.069)
Self-reported political knowledge -0.433*** -0.359***(0.073) (0.075)
Math test score (scale) -2.639***(0.424)
Observations 5,471 3,682 2,662
Notes: The dependent variable is the absolute deviation between the respondent’s current unemploymentestimate and the true rate of 6.5%. The omitted education category is low education. All specificationsare estimated using OLS, with robust standard errors in parentheses. ∗p < 0.1,∗∗ p < 0.05,∗∗∗ p < 0.01.
48

Table 7: Correlation between our voter sophistication indicator and standard indicators ofpolitical sophistication
Outcome: Sophisticated voter(1) (2) (3)
Constant 0.204*** 0.119** -0.038(0.038) (0.050) (0.065)
Follow the news 0.041*** 0.026*** 0.022**(0.006) (0.008) (0.009)
Wage income 2012 (log) 0.002* 0.002 0.000(0.001) (0.002) (0.002)
Medium education 0.044*** 0.053*** 0.056**(0.016) (0.020) (0.024)
High education 0.139*** 0.135*** 0.107***(0.024) (0.029) (0.034)
Frequently discuss politics 0.027*** 0.023*** 0.019**(0.006) (0.007) (0.009)
Self-reported political knowledge 0.050*** 0.051***(0.008) (0.010)
Math test score (scale) 0.262***(0.046)
Observations 5,471 3,682 2,662
Notes: The dependent variable is our indicator of voter sophistication. The omitted education categoryis low education. All specifications are estimated using OLS, with robust standard errors in parentheses.∗p < 0.1,∗∗ p < 0.05,∗∗∗ p < 0.01.
49

simultaneously. The first row indicates the baseline effect in the control and treatment conditions,
while the six rows below show the interaction between each treatment and the specified variable
(this is the lower-order term in the case of the control condition). Table 8 shows that standard
measures of political sophistication indicate that less sophisticated voters update significantly less
on average. It is important to note that when pooling the full sample here, we are not able to capture
the nuances of how voters update. However, Table 9 shows that the inclusion of the interaction
between the absolute deviation from the true current unemployment rate and the treatments breaks
the correlation for all other political sophistication measures—including, as shown in the first
column, in the control group. This forms the basis of our claim that the current unemployment
estimate is a sufficient statistic for measuring political sophistication in our context of economic
voting.
Third, Table 10 shows that our indicator of political sophistication is not correlated with previ-
ous vote choices. Specifically, columns (1)-(8) show that political sophistication is not significantly
correlated with voting for a left or right party in either 2007 or 2011 in any specification. We omit
the effectively identical results for the absolute deviation measure.
Support for the identification assumptions
Balance across treatments
Tables 11 and 12 look at balance over pre-treatment covariates from both the Register and the
survey. F tests of all treatment coefficients being equal are rejected with regularity consistent with
chance: only in one of 16 tests was the joint test statistically different from zero at the 5% level
(and also once at the 10% level). Even in those cases, the differences between treatment conditions
are small. Accordingly, we do not include controls, although the results are robust to including
such variables.
50

Tabl
e8:
Het
erog
eneo
usef
fect
sof
info
rmat
ion
trea
tmen
tson
unem
ploy
men
texp
ecta
tions
(%),
byco
nditi
onal
mar
gina
leff
ecto
fst
anda
rdpo
litic
also
phis
ticat
ion
mea
sure
s
Out
com
e:U
nem
ploy
men
texp
ecta
tions
Con
trol
DC
B7%
(tru
e)D
CB
7%D
CB
5%G
ovt.
7%G
ovt.
5%O
pp.7
%O
pp.5
%
Bas
elin
e(t
reat
men
torc
ontr
ol)e
ffec
t15
.064
***
-6.2
92**
*-5
.928
***
-5.2
54**
*-4
.287
**-5
.641
***
-5.1
40**
*-4
.859
***
(1.3
91)
(1.4
88)
(1.5
18)
(1.7
7)(1
.702
)(1
.648
)(1
.644
)(1
.751
)×
Follo
wth
ene
ws
-0.5
31**
*0.
523*
*0.
459*
*0.
264
0.22
60.
346
0.36
00.
157
(0.2
05)
(0.2
24)
(0.2
32)
(0.2
72)
(0.2
48)
(0.2
48)
(0.2
32)
(0.2
7)×
Freq
uent
lydi
scus
spo
litic
s-0
.264
0.02
00.
062
0.17
40.
219
0.06
20.
161
0.16
6(0
.170
)(0
.187
)(0
.197
)(0
.207
)(0
.191
)(0
.219
)(0
.207
)(0
.212
)×
Wag
ein
com
e20
12(l
og)
-0.1
24**
*0.
110*
*0.
100*
*0.
033
0.08
9*0.
162*
**0.
065*
*0.
115*
*(0
.045
)(0
.049
)(0
.050
)(0
.056
)(0
.049
)(0
.052
)(0
.055
)(0
.054
)×
Med
ium
educ
atio
n-1
.614
***
1.44
5***
1.51
7***
1.80
3***
1.02
21.
006
1.51
8**
1.26
6*(0
.552
)(0
.591
)(0
.604
)(0
.665
)(0
.644
)(0
.669
)(0
.637
)(0
.671
)×
Hig
hed
ucat
ion
-1.9
77**
*1.
585*
*1.
551*
*1.
505*
*0.
793
0.59
91.
692*
*1.
729*
*(0
.640
)(0
.699
)(0
.719
)(0
.755
)(0
.725
)(0
.768
)(0
.747
)(0
.868
)
Not
es:
All
coef
ficie
nts
are
estim
ated
from
asi
ngle
OL
Seq
uatio
nin
tera
ctin
gal
ltre
atm
ents
cond
ition
sw
ithth
eva
riab
les
onth
ele
ftha
ndsi
deof
the
tabl
e(s
eeO
nlin
eA
ppen
dix
fort
heir
defin
ition
s).T
hefir
stco
lum
nco
ntai
nsth
elo
wer
-ord
eref
fect
s(i
nth
eco
ntro
lgro
up),
incl
udin
gth
eco
nsta
ntin
the
first
cell.
The
sam
ple
size
is5,
471.
Rob
usts
tand
ard
erro
rsin
pare
nthe
ses.∗ p
<0.
1,∗∗
p<
0.05
,∗∗∗
p<
0.01
.
51

Tabl
e9:
Het
erog
eneo
usef
fect
sof
info
rmat
ion
trea
tmen
tson
unem
ploy
men
texp
ecta
tions
(%),
byco
nditi
onal
mar
gina
leff
ecto
fst
anda
rdpo
litic
also
phis
ticat
ion
mea
sure
s—co
ntro
lling
fori
nter
actio
nw
ithth
eab
solu
tede
viat
ion
Out
com
e:U
nem
ploy
men
texp
ecta
tions
Con
trol
DC
B7%
(tru
e)D
CB
7%D
CB
5%G
ovt.
7%G
ovt.
5%O
pp.7
%O
pp.5
%
Bas
elin
e(t
reat
men
torc
ontr
ol)e
ffec
t6.
218*
**0.
371
0.09
6-1
.363
1.51
1*-0
.385
0.77
4-0
.264
(0.6
21)
(0.7
58)
(0.9
13)
(0.9
72)
(0.8
87)
(0.9
57)
(0.8
89)
(1.1
14)
×A
bsol
ute
devi
atio
n1.
013*
**-0
.548
***
-0.5
13**
*-0
.242
**-0
.549
***
-0.3
70**
*-0
.400
***
-0.4
18**
*(0
.036
)(0
.071
)(0
.101
)(0
.099
)(0
.092
)(0
.086
)(0
.098
)(0
.1)
×Fo
llow
the
new
s-0
.032
0.11
80.
136
0.11
2-0
.070
-0.0
02-0
.014
-0.0
20(0
.104
)(0
.126
)(0
.139
)(0
.146
)(0
.141
)(0
.142
)(0
.13)
(0.1
72)
×Fr
eque
ntly
disc
uss
polit
ics
-0.0
16-0
.119
-0.0
820.
107
0.08
5-0
.022
-0.1
22-0
.004
(0.0
80)
(0.0
99)
(0.1
12)
(0.1
15)
(0.1
05)
(0.1
22)
(0.1
19)
(0.1
26)
×W
age
inco
me
2012
(log
)-0
.011
-0.0
010.
005
-0.0
42-0
.025
0.03
60.
007
0.01
9(0
.020
)(0
.025
)(0
.026
)(0
.026
)(0
.025
)(0
.028
)(0
.029
)(0
.032
)×
Med
ium
educ
atio
n0.
123
-0.0
93-0
.210
0.19
5-0
.249
-0.2
81-0
.217
0.00
0(0
.249
)(0
.304
)(0
.314
)(0
.347
)(0
.335
)(0
.359
)(0
.337
)(0
.415
)×
Hig
hed
ucat
ion
-0.1
200.
326
0.09
90.
534
-0.4
25-0
.060
0.29
70.
433
(0.3
46)
(0.4
2)(0
.428
)(0
.442
)(0
.425
)(0
.468
)(0
.443
)(0
.542
)
Not
es:
All
coef
ficie
nts
are
estim
ated
from
asi
ngle
OL
Seq
uatio
nin
tera
ctin
gal
ltre
atm
ents
cond
ition
sw
ithth
eva
riab
les
onth
ele
ftha
ndsi
deof
the
tabl
e(s
eeO
nlin
eA
ppen
dix
fort
heir
defin
ition
s).T
hefir
stco
lum
nco
ntai
nsth
elo
wer
-ord
eref
fect
s(i
nth
eco
ntro
lgro
up),
incl
udin
gth
eco
nsta
ntin
the
first
cell.
The
sam
ple
size
is5,
471.
Rob
usts
tand
ard
erro
rsin
pare
nthe
ses.∗ p
<0.
1,∗∗
p<
0.05
,∗∗∗
p<
0.01
.
52

Tabl
e10
:Cor
rela
tion
betw
een
ouri
ndic
ator
ofso
phis
ticat
edvo
ters
and
mea
sure
ofpa
rtis
ansh
ip
Out
com
e:So
phis
ticat
edvo
ter
(1)
(2)
(3)
(4)
(5)
(6)
(7)
(8)
Con
stan
t2.
971*
**0.
546*
**2.
892*
**0.
555*
**2.
900*
**0.
565*
**2.
848*
**0.
571*
**(0
.073
)(0
.009
)(0
.066
)(0
.009
)(0
.086
)(0
.011
)(0
.082
)(0
.011
)Vo
ted
left
atla
stel
ectio
n-0
.153
0.01
9(0
.101
)(0
.013
)Vo
ted
righ
tatl
aste
lect
ion
0.00
40.
001
(0.1
02)
(0.0
13)
Vote
dle
ftin
2007
elec
tion
-0.1
570.
013
(0.1
23)
(0.0
16)
Vote
dri
ghti
n20
07el
ectio
n-0
.049
0.00
2(0
.124
)(0
.016
)
Obs
erva
tions
5,70
55,
705
5,70
55,
705
3,82
73,
827
3,82
73,
827
Not
es:
The
depe
nden
tvar
iabl
eis
our
indi
cato
rof
vote
rso
phis
ticat
ion.
All
spec
ifica
tions
are
estim
ated
usin
gO
LS,
with
robu
stst
anda
rder
rors
inpa
rent
hese
s.∗ p
<0.
1,∗∗
p<
0.05
,∗∗∗
p<
0.01
.
53

Tabl
e11
:Bal
ance
test
s1
(1)
(2)
(3)
(4)
(5)
(6)
(7)
(8)
Cur
rent
UE
st.
Wom
anA
geB
asic
Edu
.M
ed.E
duL
ong
Edu
.Vo
ted
Gov
t.Vo
ted
Lef
t
Con
trol
8.70
4***
0.49
3***
1961
.541
***
0.24
3***
0.66
0***
0.09
7***
0.43
2***
0.49
2***
(0.1
77)
(0.0
19)
(0.4
34)
(0.0
16)
(0.0
18)
(0.0
11)
(0.0
19)
(0.0
19)
DC
B7%
trea
tmen
t-0
.264
-0.0
020.
869
0.00
3-0
.016
0.01
30.
021
0.01
5(0
.230
)(0
.026
)(0
.608
)(0
.023
)(0
.025
)(0
.016
)(0
.026
)(0
.026
)D
CB
7%tr
eatm
ent(
true
)-0
.364
-0.0
090.
171
0.00
20.
012
-0.0
140.
012
-0.0
00(0
.226
)(0
.027
)(0
.617
)(0
.023
)(0
.025
)(0
.015
)(0
.027
)(0
.027
)D
CB
5%tr
eatm
ent
-0.2
490.
025
0.37
4-0
.047
**0.
026
0.02
10.
049*
0.04
2(0
.229
)(0
.026
)(0
.601
)(0
.022
)(0
.025
)(0
.016
)(0
.026
)(0
.026
)G
over
nmen
t7%
trea
tmen
t-0
.086
0.00
90.
234
-0.0
330.
010
0.02
40.
004
-0.0
02(0
.240
)(0
.027
)(0
.601
)(0
.022
)(0
.025
)(0
.017
)(0
.026
)(0
.027
)G
over
nmen
t5%
trea
tmen
t0.
224
-0.0
04-0
.190
-0.0
300.
012
0.01
70.
031
0.01
7(0
.252
)(0
.027
)(0
.626
)(0
.022
)(0
.025
)(0
.016
)(0
.026
)(0
.027
)O
ppos
ition
7%tr
eatm
ent
-0.2
65-0
.024
0.44
3-0
.009
0.01
3-0
.004
-0.0
00-0
.007
(0.2
39)
(0.0
27)
(0.6
07)
(0.0
23)
(0.0
25)
(0.0
16)
(0.0
26)
(0.0
27)
Opp
ositi
on5%
trea
tmen
t0.
011
-0.0
120.
529
-0.0
21-0
.010
0.03
1*0.
050*
0.03
6(0
.249
)(0
.027
)(0
.602
)(0
.023
)(0
.025
)(0
.017
)(0
.026
)(0
.027
)
Obs
erva
tions
5,70
55,
705
5,69
25,
642
5,64
25,
642
5,70
55,
705
Fte
stof
equa
lity
over
trea
tmen
tsp=
0.19
p=
0.75
p=
0.78
p=
0.18
p=
0.74
p=
0.07
p=
0.29
p=
0.47
Not
es:
The
depe
nden
tva
riab
leis
liste
dat
the
top
ofea
chco
lum
n.A
llsp
ecifi
catio
nses
timat
edus
ing
OL
S.R
obus
tst
anda
rder
rors
inpa
rent
hese
s.∗ p
<0.
1,∗∗
p<
0.05
,∗∗∗
p<
0.01
.
54
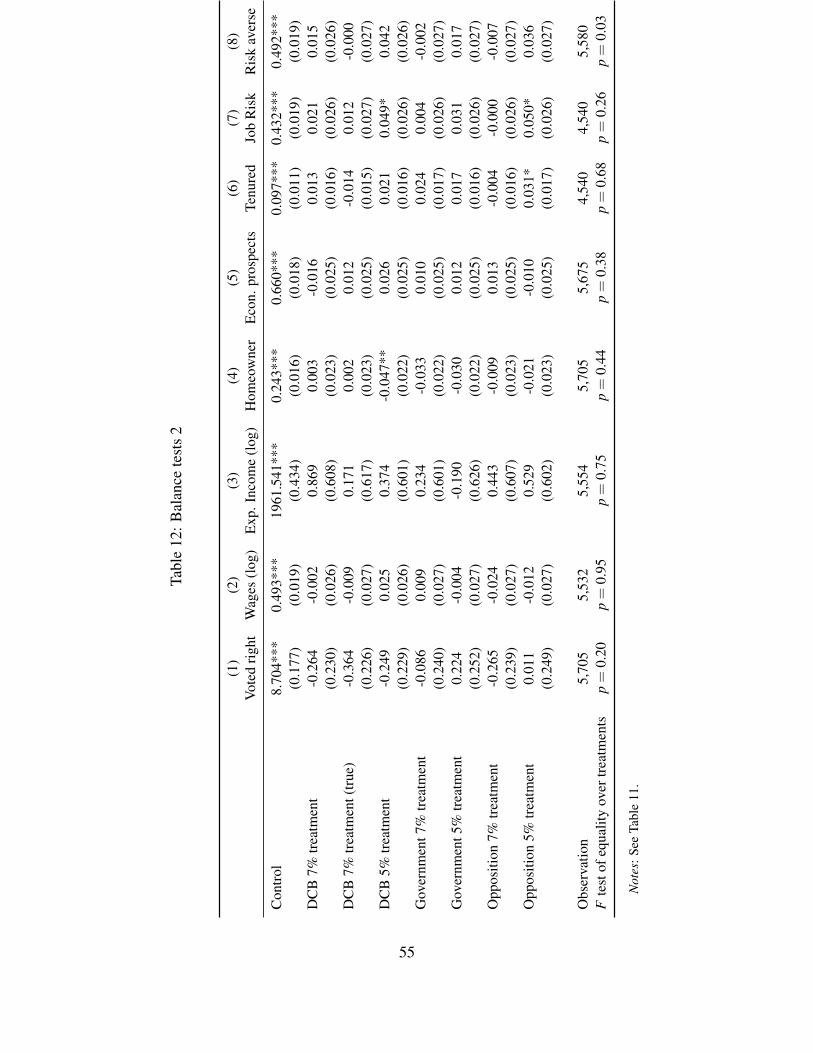
Tabl
e12
:Bal
ance
test
s2
(1)
(2)
(3)
(4)
(5)
(6)
(7)
(8)
Vote
dri
ght
Wag
es(l
og)
Exp
.Inc
ome
(log
)H
omeo
wne
rE
con.
pros
pect
sTe
nure
dJo
bR
isk
Ris
kav
erse
Con
trol
8.70
4***
0.49
3***
1961
.541
***
0.24
3***
0.66
0***
0.09
7***
0.43
2***
0.49
2***
(0.1
77)
(0.0
19)
(0.4
34)
(0.0
16)
(0.0
18)
(0.0
11)
(0.0
19)
(0.0
19)
DC
B7%
trea
tmen
t-0
.264
-0.0
020.
869
0.00
3-0
.016
0.01
30.
021
0.01
5(0
.230
)(0
.026
)(0
.608
)(0
.023
)(0
.025
)(0
.016
)(0
.026
)(0
.026
)D
CB
7%tr
eatm
ent(
true
)-0
.364
-0.0
090.
171
0.00
20.
012
-0.0
140.
012
-0.0
00(0
.226
)(0
.027
)(0
.617
)(0
.023
)(0
.025
)(0
.015
)(0
.027
)(0
.027
)D
CB
5%tr
eatm
ent
-0.2
490.
025
0.37
4-0
.047
**0.
026
0.02
10.
049*
0.04
2(0
.229
)(0
.026
)(0
.601
)(0
.022
)(0
.025
)(0
.016
)(0
.026
)(0
.026
)G
over
nmen
t7%
trea
tmen
t-0
.086
0.00
90.
234
-0.0
330.
010
0.02
40.
004
-0.0
02(0
.240
)(0
.027
)(0
.601
)(0
.022
)(0
.025
)(0
.017
)(0
.026
)(0
.027
)G
over
nmen
t5%
trea
tmen
t0.
224
-0.0
04-0
.190
-0.0
300.
012
0.01
70.
031
0.01
7(0
.252
)(0
.027
)(0
.626
)(0
.022
)(0
.025
)(0
.016
)(0
.026
)(0
.027
)O
ppos
ition
7%tr
eatm
ent
-0.2
65-0
.024
0.44
3-0
.009
0.01
3-0
.004
-0.0
00-0
.007
(0.2
39)
(0.0
27)
(0.6
07)
(0.0
23)
(0.0
25)
(0.0
16)
(0.0
26)
(0.0
27)
Opp
ositi
on5%
trea
tmen
t0.
011
-0.0
120.
529
-0.0
21-0
.010
0.03
1*0.
050*
0.03
6(0
.249
)(0
.027
)(0
.602
)(0
.023
)(0
.025
)(0
.017
)(0
.026
)(0
.027
)
Obs
erva
tion
5,70
55,
532
5,55
45,
705
5,67
54,
540
4,54
05,
580
Fte
stof
equa
lity
over
trea
tmen
tsp=
0.20
p=
0.95
p=
0.75
p=
0.44
p=
0.38
p=
0.68
p=
0.26
p=
0.03
Not
es:S
eeTa
ble
11.
55

IV assumptions
Consistent instrumental variables estimation requires two additional assumptions beyond random
assignment: monotonicity and an exclusion restriction. Monotonicity entails that each individual
would update their unemployment expectations in the same direction after receiving the treatment.
However, the 27% of respondents with lower current unemployment estimates than the treatment
projection they receive may increase their unemployment expectations. Figures 3 and 4 show the
cumulative density functions plotting the proportion of individuals for each instrument expecting
unemployment below a certain level. The key point to note is that while the 7% treatments lie
almost entirely to the left of the control group, the 5% treatments do not. This implies that the
monotonicity assumption underpinning the instrumental variable does not hold in such cases.
Fortunately, IV estimation remains consistent when “few subjects are defiers, or if defiers and
compliers have reasonably similar distributions of potential outcomes” (de Chaisemartin 2014:
7).35 Although updating upward and downward may have similar effects, we also separately exam-
ine voters whose current unemployment estimates are above, below and between the information
provided by the treatments as a further robustness check below.
The exclusion restriction is discussed in the main paper. However, as noted in the main text,
Table 13 shows no treatment affects the respondent’s belief that political information is important.
This serves as an important robustness check for the exclusion restriction concern that simply
receiving the treatment inducing respondents to think about politics differentially without being
affected by the particular unemployment information provided.
Confidence in sources
Table 14 shows that of the treatment sources, only the DCB treatment significantly increases trust
in the source of the information. Trust is a dummy variable for trusting or greatly trusting the
35More precisely, the Wald estimator recovers the average treatment effect for the set of compli-ers not canceled out by the defiers (de Chaisemartin 2014).
56

020
4060
8010
0
Cum
ulat
ive
dens
ity
0 10 20 30 40 50
Unemployment expectations (%)
Control DCB 7% treatmentDCB 5% treatment DCB 7% treatment (true)
Figure 3: Cumulative density plots of unemployment expectations by information treatment 1
57

020
4060
8010
0
Cum
ulat
ive
dens
ity
0 10 20 30 40
Unemployment expectations (%)
Control Government 7% treatmentGovernment 5% treatment Opposition 7% treatmentOpposition 5% treatment
Figure 4: Cumulative density plots of unemployment expectations by information treatment 2
58
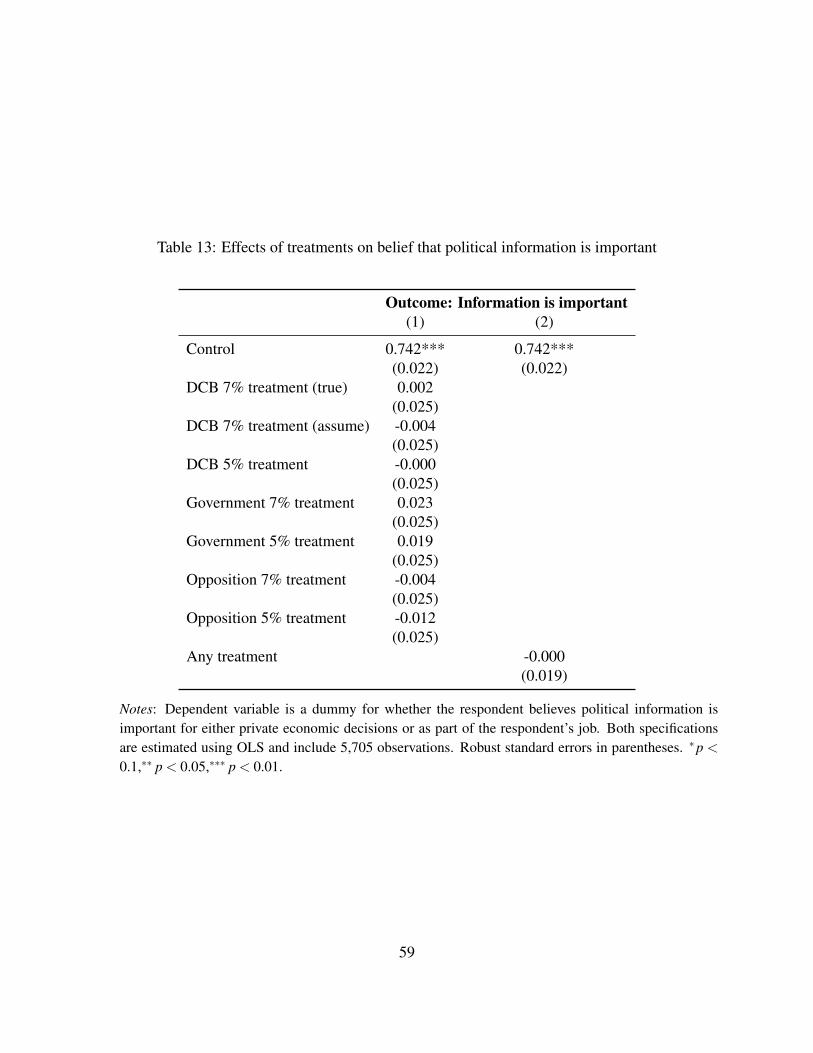
Table 13: Effects of treatments on belief that political information is important
Outcome: Information is important(1) (2)
Control 0.742*** 0.742***(0.022) (0.022)
DCB 7% treatment (true) 0.002(0.025)
DCB 7% treatment (assume) -0.004(0.025)
DCB 5% treatment -0.000(0.025)
Government 7% treatment 0.023(0.025)
Government 5% treatment 0.019(0.025)
Opposition 7% treatment -0.004(0.025)
Opposition 5% treatment -0.012(0.025)
Any treatment -0.000(0.019)
Notes: Dependent variable is a dummy for whether the respondent believes political information isimportant for either private economic decisions or as part of the respondent’s job. Both specificationsare estimated using OLS and include 5,705 observations. Robust standard errors in parentheses. ∗p <
0.1,∗∗ p < 0.05,∗∗∗ p < 0.01.
59
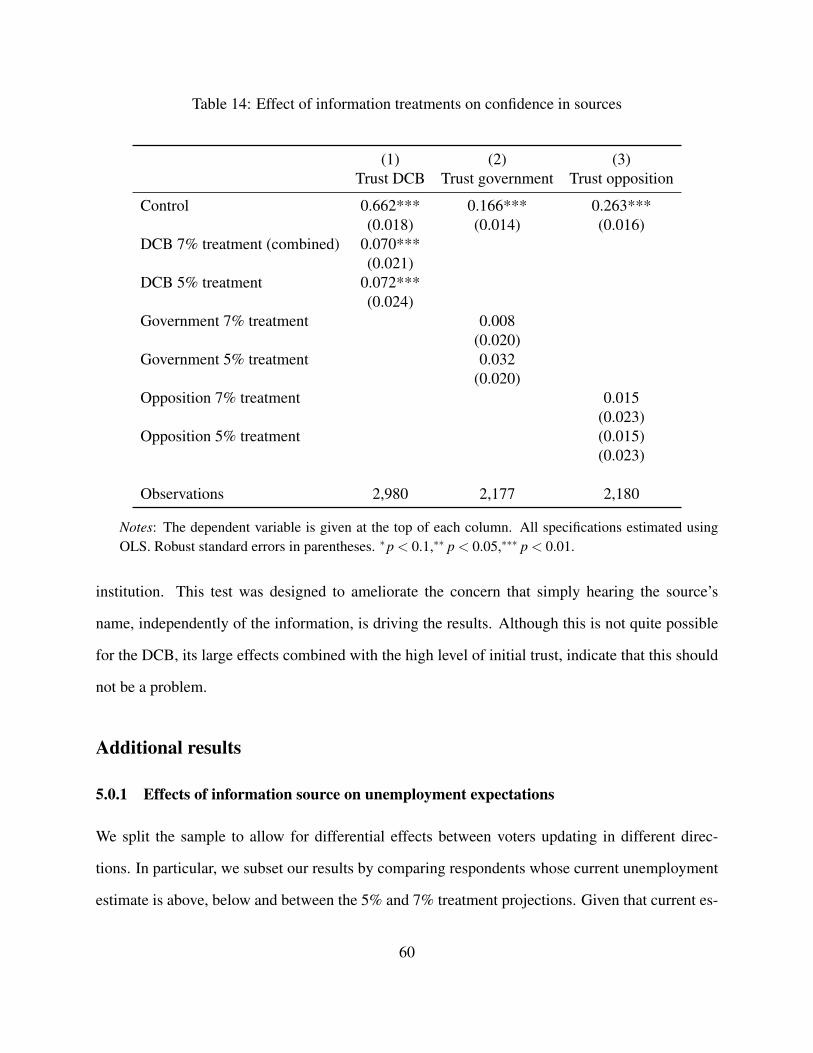
Table 14: Effect of information treatments on confidence in sources
(1) (2) (3)Trust DCB Trust government Trust opposition
Control 0.662*** 0.166*** 0.263***(0.018) (0.014) (0.016)
DCB 7% treatment (combined) 0.070***(0.021)
DCB 5% treatment 0.072***(0.024)
Government 7% treatment 0.008(0.020)
Government 5% treatment 0.032(0.020)
Opposition 7% treatment 0.015(0.023)
Opposition 5% treatment (0.015)(0.023)
Observations 2,980 2,177 2,180
Notes: The dependent variable is given at the top of each column. All specifications estimated usingOLS. Robust standard errors in parentheses. ∗p < 0.1,∗∗ p < 0.05,∗∗∗ p < 0.01.
institution. This test was designed to ameliorate the concern that simply hearing the source’s
name, independently of the information, is driving the results. Although this is not quite possible
for the DCB, its large effects combined with the high level of initial trust, indicate that this should
not be a problem.
Additional results
5.0.1 Effects of information source on unemployment expectations
We split the sample to allow for differential effects between voters updating in different direc-
tions. In particular, we subset our results by comparing respondents whose current unemployment
estimate is above, below and between the 5% and 7% treatment projections. Given that current es-
60

timates are highly correlated with expectations in the control group, they represent a good proxy for
prior beliefs over the unemployment expectation. Accordingly, we thus expect that all treatments,
but especially the 7% treatment, will increase the expectations of those with a current estimate
below 5%. Similarly, we expect that all treatments, but especially the 5% treatment, will decrease
the expectations of those with a current estimate above 7%. For those with an estimate between
5% and 7% we expect that the 5% treatments will decrease expectations and the 7% treatments
will increase expectations; since this group is also comprised entirely by sophisticated voters, we
expect to observe that such voters will be best able to differentiate source credibility.
The results in Table 15 broadly reflect our findings regarding political sophistication. Column
(2) shows that voters with current unemployment estimates between the two treatments behave like
sophisticated voters, recognizing both institutional and political incentive bases for credibility. As
expected, for this group, the 5% and 7% treatment levels have opposite effects. As noted in the
main text, a larger-than-prior opposition forecast is significantly less credible than a similar govern-
ment or DCB forecast, while a smaller-than-prior forecast is most credible from the DCB, although
the opposition claim causes a larger reduction than the government claim. Similarly, in column (3),
those with low current estimates—who have perhaps paid attention in the past but failed to adjust
their beliefs during the financial crisis—find both the DCB and especially the government’s rel-
atively negative economic outlook to be most convincing. However, like unsophisticated voters,
those in column (1) with high initial estimates, if anything, only discern differences in institutional
credibility regarding the DCB. The Online Appendix confirms that the high current estimate sam-
ple disproportionately includes voters with less education and who discuss politics and watch the
news rarely.
We find no evidence that treatments differ across individuals with different prior measures of
partisanship. First, the interaction coefficients in columns (1) and (2) of Table 16 respectively
show that there is no significant difference in response to any treatment across voters that voted for
a left party and voters that voted for a right party at the previous (2011) election. Second, columns
61

Table 15: Effect of information treatments on unemployment expectations (%), by direction ofexpected updating
Outcome: Unemployment expectations(1) (2) (3)
High Current Lowcurrent est. est. ∈ [5,7] current est.
Control 11.691*** 6.505*** 4.027***(0.281) (0.071) (0.181)
DCB 7% treatment (combined) -2.572*** 0.295*** 1.560***(0.302) (0.079) (0.231)
Government 7% treatment -2.177*** 0.340*** 1.882***(0.329) (0.090) (0.315)
Opposition 7% treatment -1.958*** 0.076 1.373***(0.346) (0.095) (0.277)
DCB 5% treatment -2.743*** -0.623*** 0.576**(0.371) (0.091) (0.235)
Government 5% treatment -2.416*** -0.426*** 0.631***(0.354) (0.093) (0.237)
Opposition 5% treatment -2.132*** -0.496*** 0.205(0.371) (0.098) (0.230)
Coefficient equality F tests (p values)DCB 7% = Government 7% 0.31 0.64 0.07*DCB 7% = Opposition 7% 0.08* 0.00*** 0.79Government 7% = Opposition 7% 0.41 0.00*** 0.13
DCB 5% = Government 5% 0.31 0.02** 0.80DCB 5% = Opposition 5% 0.07* 0.15 0.07*Government 5% = Opposition 5% 0.38 0.44 0.04**
Observations 2,961 2,317 427Outcome mean 9.62 6.44 4.99Outcome std. dev. 4.16 1.07 1.53Current unemployment estimate mean 11.15 6.21 3.57
Notes: The dependent variable is a respondent’s unemployment expectation for the end of 2013 (%).All specifications are estimated using OLS, with robust standard errors in parentheses. ∗p < 0.1,∗∗ p <
0.05,∗∗∗ p < 0.01. The coefficient tests at the foot of the table report the p value from a two-sided F testof coefficient equality. “High current est.” (“Low current est.”) voters whose current unemploymentestimate is greater (lower) than all treatments levels.
62

Table 16: Effect of information treatments on unemployment expectations (%), by partisanship
Outcome: Unemployment expectations(1) (2) (3) (4)
Voted Voted Voted Votedleft right left right
at last at last in 2007 in 2007election election election election
Control 8.851*** 9.130*** 9.122*** 9.101***(0.252) (0.244) (0.319) (0.298)
Partisanship measure 0.326 -0.268 -0.260 -0.213(0.370) (0.373) (0.439) (0.445)
DCB 7% treatment (combined) -0.924*** -1.253*** -1.180*** -1.278***(0.268) (0.261) (0.338) (0.314)
× Partisanship measure -0.404 0.294 0.024 0.234(0.394) (0.397) (0.466) (0.473)
Government 7% treatment -0.550* -1.007*** -0.917** -1.025***(0.298) (0.284) (0.372) (0.357)
× Partisanship measure -0.608 0.362 -0.011 0.231(0.426) (0.430) (0.516) (0.521)
Opposition 7% treatment -0.646** -1.076*** -0.998*** -1.018***(0.314) (0.290) (0.384) (0.356)
× Partisanship measure -0.567 0.346 0.058 0.108(0.445) (0.451) (0.533) (0.542)
DCB 5% treatment -1.420*** -1.759*** -1.932*** -1.782***(0.326) (0.299) (0.371) (0.377)
× Partisanship measure -0.482 0.207 0.348 0.005(0.462) (0.470) (0.546) (0.544)
Government 5% treatment -2.743*** -1.411*** -1.043** -1.446***(0.330) (0.307) (0.433) (0.389)
× Partisanship measure -0.540 0.453 -0.340 0.533(0.467) (0.472) (0.580) (0.591)
Opposition 5% treatment -1.110*** -1.384*** -1.580*** -1.546***(0.324) (0.320) (0.394) (0.370)
× Partisanship measure -0.449 0.091 0.160 0.075(0.472) (0.469) (0.556) (0.564)
Observations 5,705 5,705 3,827 3,827
Notes: The dependent variable is a respondent’s unemployment expectation for the end of 2013 (%).The partisanship measure is given at the top of each column. All specifications are estimated using OLS,with robust standard errors in parentheses. ∗p < 0.1,∗∗ p < 0.05,∗∗∗ p < 0.01.
63

(3) and (4) of Table 16 similarly show no significant difference when using left and right vote
choice in the 2007 election. Together, these results show that there are no differences in response
to treatments between left and right partisans.
Even though the average partisanship does not differentially respond to different treatments,
it remains possible that only sophisticated (or unsophisticated) voters respond differentially to
treatment sources. However, Table 17 further shows that there is no significant triple interaction
between our treatments, voting for a left party at the previous election, and our voter sophistication
indicator. To save space, we omit similar results using our other measures of partisanship.
We also show that we obtain similar, albeit less precise, results when using more standard
measures of political sophistication. In particular, we computed a summative rating scale combin-
ing standardized measures of education, frequency of watching the news, frequency of discussing
politics, self-identification as politically informed, and (log) wages in 2012. (α = 0.39). As ex-
pected, this index is highly (negatively) correlated with the absolute deviation between the current
unemployment estimate and the true rate; regressing the deviation on the index returns a highly
statistically coefficient of -1.279 (0.101). Following the analysis in the main paper, we split the
sample between low and high sophistication types—as defined, by above and below median scores
by our political sophistication scale. The results in Table 18 provide broad support for the find-
ings in the main paper. In particular, for both the 5% and 7% treatments, column (2) shows that
sophisticated voters update significantly more when the information is provided by the DCB than
political parties. Although the difference is not statistically significant, only the opposition—but
not the government—5% claim is significantly negative, and is more than twice the size of the gov-
ernment 5% treatment. Column (1) shows that unsophisticated voters do not significantly differen-
tially update across sources, except marginally in the case of comparing the DCB and government
7% treatments. Unsurprisingly, given the contextual relevance of our measure and its predictive
power (see Table 6), these estimates are less precise than our preferred measure.
64

Table 17: Effect of information treatments on unemployment expectations (%), by partisanshipand voter sophistication
Outcome: Unemployment expectations
DCB 7% treatment (combined) -0.577× Voted left at last election (0.775)
DCB 7% treatment (combined) 0.617× Voted left at last election × Sophisticated voter (0.793)
Government 7% treatment -1.079× Voted left at last election (0.842)
Government 7% treatment 1.267× Voted left at last election × Sophisticated voter (0.863)
Opposition 7% treatment -0.796× Voted left at last election (0.869)
Opposition 7% treatment 0.753× Voted left at last election × Sophisticated voter (0.891)
DCB 5% treatment -0.809× Voted left at last election (0.941)
DCB 5% treatment 0.915× Voted left at last election × Sophisticated voter (0.961)
Government 5% treatment -0.670× Voted left at last election (0.892)
Government 5% treatment 0.796× Voted left at last election × Sophisticated voter (0.913)
Opposition 5% treatment -0.318× Voted left at last election (0.917)
Opposition 5% treatment 0.271× Voted left at last election × Sophisticated voter (0.940)
Observations 5,705
Notes: The dependent variable is a respondent’s unemployment expectation for the end of 2013 (%).Lower order terms are omitted. All specifications are estimated using OLS, with robust standard errorsin parentheses. ∗p < 0.1,∗∗ p < 0.05,∗∗∗ p < 0.01.
65

Table 18: Effect of information treatments on unemployment expectations (%), by alternativemeasure of political sophistication
Outcome: Unemployment expectations(1) (2)
Low pol. sophist. High pol. sophist.
Control 9.985*** 8.081***(0.322) (0.170)
DCB 7% treatment (combined) -1.798*** -0.507***(0.340) (0.193)
Government 7% treatment -1.422*** -0.314(0.368) (0.209)
Opposition 7% treatment -1.694*** -0.214(0.370) (0.243)
DCB 5% treatment -2.149*** -1.135***(0.395) (0.241)
Government 5% treatment -2.049*** -0.429(0.374) (0.274)
Opposition 5% treatment -2.060*** -0.671**(0.387) (0.265)
Coefficient equality F tests (p values)DCB 7% = Government 7% 0.07 0.16DCB 7% = Opposition 7% 0.62 0.11Government 7% = Opposition 7% 0.29 0.62
DCB 5% = Government 5% 0.74 0.01DCB 5% = Opposition 5% 0.78 0.07Government 5% = Opposition 5% 0.97 0.40
Observations 2,852 2,853Outcome mean 8.36 7.60Outcome std. dev. 3.97 3.04Current unemployment estimate mean 9.22 7.94
Notes: The dependent variable is a respondent’s unemployment expectation for the end of 2013 (%).All specifications are estimated using OLS, with robust standard errors in parentheses. ∗p < 0.1,∗∗ p <
0.05,∗∗∗ p < 0.01. The coefficient tests at the foot of the table report the p value from a two-sided Ftest of coefficient equality. “High pol. sophist.” (“Low pol. sophist.”) indicate voters whose politicalsophistication scale scores are greater (lower) than the median of our sample.
66

Comparison of sub-sample characteristics
Table 19 shows the summary statistics in terms of political disposition for the main subsamples
that we analyze in the main paper.
Effects of information source on political preferences
Table 20 provides our first stage estimates for vote intention regressions. The results are very
similar to the coefficients provided in Table 1 of the main paper, but gain precision due to the
inclusion of the current unemployment estimate.
Table 21 shows the reduced form estimates. Panel A, which fully separates treatments, gen-
erally shows that the more powerful treatment has a larger effect on support for a political party.
That is to say the treatment effects look to be fairly monotonic given the fact that most individuals
over-estimated the future unemployment rate relative to the true projection. Although most rela-
tionships are not statistically significant, this is due to three reasons. First, as noted in the text, the
7% treatments cause updating from both directions and thus average over countervailing effects.
Second, the reduced form averages give greater weight to those with a large first stage, which are
generally the individuals who seem to be those least capable of mapping information to political
preferences. And finally, we use many treatments and thus relatively small sample sizes for each
separate treatment, whereas the 2SLS estimates pool information across treatments. In fact, our
2SLS estimates are highly consistent with these reduced form estimates—it is easy to see this by
noting the monontonic relationship between the treatments. This is particularly the case once we
group together treatment levels: Panel B shows that grouping together the 5% and 7% treatments
across source produces clearly statistically significant results.
Table 22 provides the 2SLS estimates when we do not control for current unemployment ex-
pectations. Consistent with our claim in the main text, the results are almost identical, but the first
stage is weaker.
67
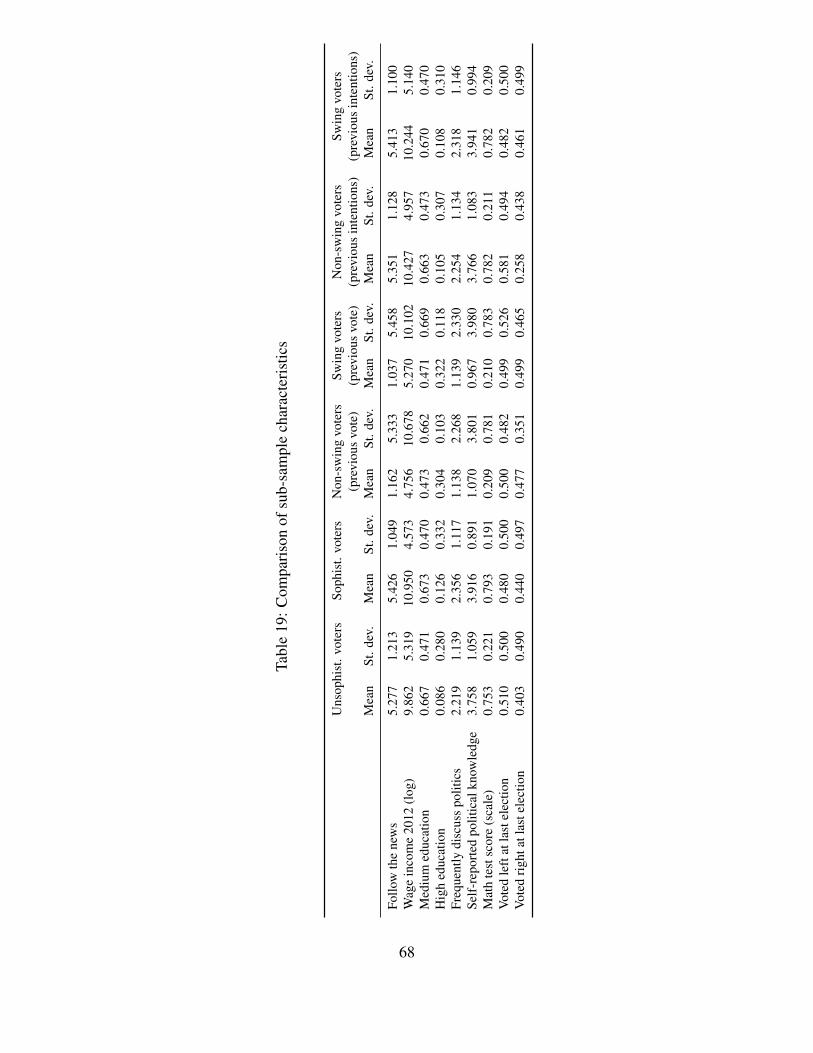
Tabl
e19
:Com
pari
son
ofsu
b-sa
mpl
ech
arac
teri
stic
s
Uns
ophi
st.v
oter
sSo
phis
t.vo
ters
Non
-sw
ing
vote
rsSw
ing
vote
rsN
on-s
win
gvo
ters
Swin
gvo
ters
(pre
viou
svo
te)
(pre
viou
svo
te)
(pre
viou
sin
tent
ions
)(p
revi
ous
inte
ntio
ns)
Mea
nSt
.dev
.M
ean
St.d
ev.
Mea
nSt
.dev
.M
ean
St.d
ev.
Mea
nSt
.dev
.M
ean
St.d
ev.
Follo
wth
ene
ws
5.27
71.
213
5.42
61.
049
1.16
25.
333
1.03
75.
458
5.35
11.
128
5.41
31.
100
Wag
ein
com
e20
12(l
og)
9.86
25.
319
10.9
504.
573
4.75
610
.678
5.27
010
.102
10.4
274.
957
10.2
445.
140
Med
ium
educ
atio
n0.
667
0.47
10.
673
0.47
00.
473
0.66
20.
471
0.66
90.
663
0.47
30.
670
0.47
0H
igh
educ
atio
n0.
086
0.28
00.
126
0.33
20.
304
0.10
30.
322
0.11
80.
105
0.30
70.
108
0.31
0Fr
eque
ntly
disc
uss
polit
ics
2.21
91.
139
2.35
61.
117
1.13
82.
268
1.13
92.
330
2.25
41.
134
2.31
81.
146
Self
-rep
orte
dpo
litic
alkn
owle
dge
3.75
81.
059
3.91
60.
891
1.07
03.
801
0.96
73.
980
3.76
61.
083
3.94
10.
994
Mat
hte
stsc
ore
(sca
le)
0.75
30.
221
0.79
30.
191
0.20
90.
781
0.21
00.
783
0.78
20.
211
0.78
20.
209
Vote
dle
ftat
last
elec
tion
0.51
00.
500
0.48
00.
500
0.50
00.
482
0.49
90.
526
0.58
10.
494
0.48
20.
500
Vote
dri
ghta
tlas
tele
ctio
n0.
403
0.49
00.
440
0.49
70.
477
0.35
10.
499
0.46
50.
258
0.43
80.
461
0.49
9
68

Table 20: Effect of information treatments on unemployment expectations (%), controlling forcurrent unemployment estimate (first stage)
Outcome: unemployment expectations (%)
Control 3.523***(0.216)
DCB 7% treatment (combined) -0.927***(0.104)
DCB 5% treatment -1.501***(0.127)
Government 7% treatment -0.792***(0.122)
Government 5% treatment -1.360***(0.126)
Opposition 7% treatment -0.756***(0.120)
Opposition 5% treatment -1.342***(0.137)
Current unemployment estimate 0.631***(0.025)
Observations 5,705First stage F statistic 32.64
Notes: Estimated using OLS, and controlling for current unemployment estimate. Robust standarderrors in parentheses. ∗p < 0.1,∗∗ p < 0.05,∗∗∗ p < 0.01.
69

Tabl
e21
:Red
uced
form
effe
ctof
trea
tmen
tson
polit
ical
pref
eren
ces
(1)
(2)
(3)
(4)
(5)
(6)
(7)
(8)
(9)
(10)
Pane
lA:a
lltr
eatm
ents
Gov
t.So
c.D
em.
Soc.
Lib
.So
c.Pe
op.
Con
f.go
vt.
Red
-Gre
enR
ight
Lib
eral
sR
edis
t.U
.ins
uran
ce
DC
B7%
trea
tmen
t0.
020
0.03
1*-0
.007
-0.0
040.
091*
*-0
.015
-0.0
18-0
.017
-0.0
91**
-0.0
19(0
.021
)(0
.017
)(0
.013
)(0
.011
)(0
.045
)(0
.022
)(0
.021
)(0
.011
)(0
.045
)(0
.028
)D
CB
5%tr
eatm
ent
0.04
9**
0.01
80.
024
0.00
70.
108*
*-0
.050
*-0
.043
*-0
.012
-0.0
750.
009
(0.0
25)
(0.0
19)
(0.0
16)
(0.0
13)
(0.0
52)
(0.0
26)
(0.0
24)
(0.0
13)
(0.0
52)
(0.0
31)
Gov
ernm
ent7
%tr
eatm
ent
0.00
70.
013
-0.0
120.
006
0.05
00.
005
0.00
2-0
.007
-0.0
84-0
.008
(0.0
24)
(0.0
19)
(0.0
15)
(0.0
13)
(0.0
51)
(0.0
26)
(0.0
24)
(0.0
14)
(0.0
53)
(0.0
32)
Gov
ernm
ent5
%tr
eatm
ent
0.02
70.
009
0.01
9-0
.001
0.07
6-0
.032
-0.0
18-0
.007
-0.0
350.
025
(0.0
25)
(0.0
19)
(0.0
16)
(0.0
12)
(0.0
52)
(0.0
26)
(0.0
24)
(0.0
14)
(0.0
53)
(0.0
32)
Opp
ositi
on7%
trea
tmen
t-0
.011
-0.0
02-0
.007
-0.0
03-0
.028
0.01
4-0
.015
-0.0
10-0
.069
0.00
9(0
.024
)(0
.019
)(0
.015
)(0
.012
)(0
.051
)(0
.026
)(0
.024
)(0
.013
)(0
.053
)(0
.033
)O
ppos
ition
5%tr
eatm
ent
0.04
1*0.
040*
*0.
000
0.00
10.
202*
**-0
.027
-0.0
30-0
.008
-0.0
560.
001
(0.0
25)
(0.0
20)
(0.0
15)
(0.0
12)
(0.0
53)
(0.0
26)
(0.0
24)
(0.0
13)
(0.0
53)
(0.0
33)
Obs
erva
tions
5,80
35,
803
5,80
35,
803
5,78
65,
803
5,80
35,
803
5,80
35,
709
(1)
(2)
(3)
(4)
(5)
(6)
(7)
(8)
(9)
(10)
Pane
lB:c
ombi
ned
trea
tmen
tlev
els
Gov
t.So
c.D
em.
Soc.
Lib
.So
c.Pe
op.
Con
f.go
vt.
Red
-Gre
enR
ight
Lib
eral
sR
edis
t.U
.ins
uran
ce
All
7%tr
eatm
ents
0.00
90.
019
-0.0
08-0
.001
0.05
1-0
.003
-0.0
12-0
.013
-0.0
84**
-0.0
09(0
.019
)(0
.015
)(0
.012
)(0
.010
)(0
.041
)(0
.021
)(0
.019
)(0
.011
)(0
.041
)(0
.025
)A
ll5%
trea
tmen
ts0.
039*
*0.
022
0.01
50.
002
0.12
9***
-0.0
36*
-0.0
30-0
.009
-0.0
550.
012
(0.0
20)
(0.0
16)
(0.0
13)
(0.0
10)
(0.0
43)
(0.0
21)
(0.0
20)
(0.0
11)
(0.0
43)
(0.0
26)
Obs
erva
tions
5,80
35,
803
5,80
35,
803
5,78
65,
803
5,80
35,
803
5,80
35,
709
Not
es:A
llsp
ecifi
catio
nses
timat
edus
ing
OL
S,an
dco
ntro
lfor
curr
entu
nem
ploy
men
texp
ecta
tions
.Rob
usts
tand
ard
erro
rsin
pare
nthe
ses.∗
p<
0.1,∗∗
p<
0.05
,∗∗∗
p<
0.01
.
70

Table 22: Effect of unemployment expectations on vote intention, without controlling for currentunemployment estimate
(1) (2) (3) (4) (5) (6)Govt. Soc. Dem. Soc. Lib. Soc. Peop. Right Liberals
Unemployment -0.032** -0.016 -0.014 -0.002 0.031** 0.025*expectations (%) (0.014) (0.011) (0.009) (0.007) (0.015) (0.014)
Observations 5,705 5,705 5,705 5,705 5,705 5,705First stage F statistic 10.47 10.47 10.47 10.47 10.47 10.47Outcome mean 0.32 0.17 0.09 0.06 0.41 0.28Unem. exp. mean 7.98 7.98 7.98 7.98 7.98 7.98Unem. exp. std. dev. 3.55 3.55 3.55 3.55 3.55 3.55
Notes: The dependent variables are indicators for intending to vote for (1) a party in the governing coalition, (2)the Social Democratic Party, (3) the Social Liberal Party, (4) the Socialist People’s Party, (5) any right-wing party,and (6) the Liberal Party. All specifications are estimated using 2SLS. Robust standard errors are provided inparentheses. ∗p < 0.1,∗∗ p < 0.05,∗∗∗ p < 0.01.
Table 23 shows that economic voting also differs by our alternative measure of political sophis-
tication. Columns (1) and (2) compare respondents below and above the political sophistication
scale median (defined above), and shows that only the more educated voters vote economically
after receiving new economic information. These results provide further support for our finding
that sophisticated voters drive economic voting.
Columns (3) and (4) of Table 23 similarly show relatively similar effects by previous vote
choice. Given support for the government in the right vote choice sample is very small, such
tests are not especially informative. However, a specification instrumenting for the interaction of
unemployment expectations with previous vote choice (not shown here) provides clearer results,
demonstrating that there is no significant difference.
Furthermore, as noted in the main paper, columns (5) and (6) show that the swing voter results
from the main paper are robust to using previous vote intentions to define swing voters.
Although the respondents whose vote intention was affected were not swing voters, they are not
ideological extremists. Coding the 17% of the sample who provided the most extreme responses
71

Tabl
e23
:Add
ition
alhe
tero
gene
ous
effe
cts
ofun
empl
oym
ente
xpec
tatio
nson
inte
ndin
gto
vote
fort
hego
vern
men
t
Out
com
e:in
tend
tovo
tefo
rth
ego
vern
men
t(1
)(2
)(3
)(4
)(5
)(6
)(7
)(8
)L
owpo
l.H
igh
pol.
Vote
dle
ftat
Vote
dri
ghta
tSw
ing
vote
rN
on-s
win
gN
on-e
xtre
me
Ext
rem
eso
phis
t.so
phis
t.la
stel
ectio
nla
stel
ectio
n(p
revi
ous
vote
r(pr
evio
usvo
ters
vote
rsin
tent
ions
)in
tent
ions
)
Une
mpl
oym
ente
xpec
tatio
ns(%
)-0
.007
-0.0
70**
*-0
.028
-0.0
01-0
.050
***
0.03
6-0
.054
***
-0.0
02(0
.015
)(0
.025
)(0
.020
)(0
.007
)(0
.019
)(0
.027
)(0
.019
)(0
.028
)
Obs
erva
tions
2,85
22,
853
2,87
72,
367
3,53
31,
033
3,78
278
4Fi
rsts
tage
Fst
atis
tic18
.63
16.0
424
.99
9.89
21.7
88.
4323
.16
5.18
Out
com
em
ean
0.29
0.36
0.60
0.03
0.33
0.30
0.33
0.30
Une
mpl
oym
ente
xpec
tatio
nsm
eans
8.36
7.60
7.92
7.99
7.83
8.49
7.83
8.49
Une
mpl
oym
ente
xpec
tatio
nsst
d.de
v.3.
973.
043.
563.
483.
354.
093.
354.
09
Not
es:
The
depe
nden
tvar
iabl
ein
alls
peci
ficat
ions
isan
indi
cato
rfo
rvo
ting
for
apa
rty
inth
ego
vern
ing
coal
ition
.T
hehe
adof
each
colu
mn
defin
esth
esu
bset
ofre
spon
dent
sth
atea
chsp
ecifi
catio
nw
ases
timat
edfo
r.A
llsp
ecifi
catio
nsar
ees
timat
edus
ing
2SL
S,an
dco
ntro
lfor
curr
entu
nem
ploy
men
tex
pect
atio
ns.R
obus
tsta
ndar
der
rors
are
prov
ided
inpa
rent
hese
s.∗ p
<0.
1,∗∗
p<
0.05
,∗∗∗
p<
0.01
.
72
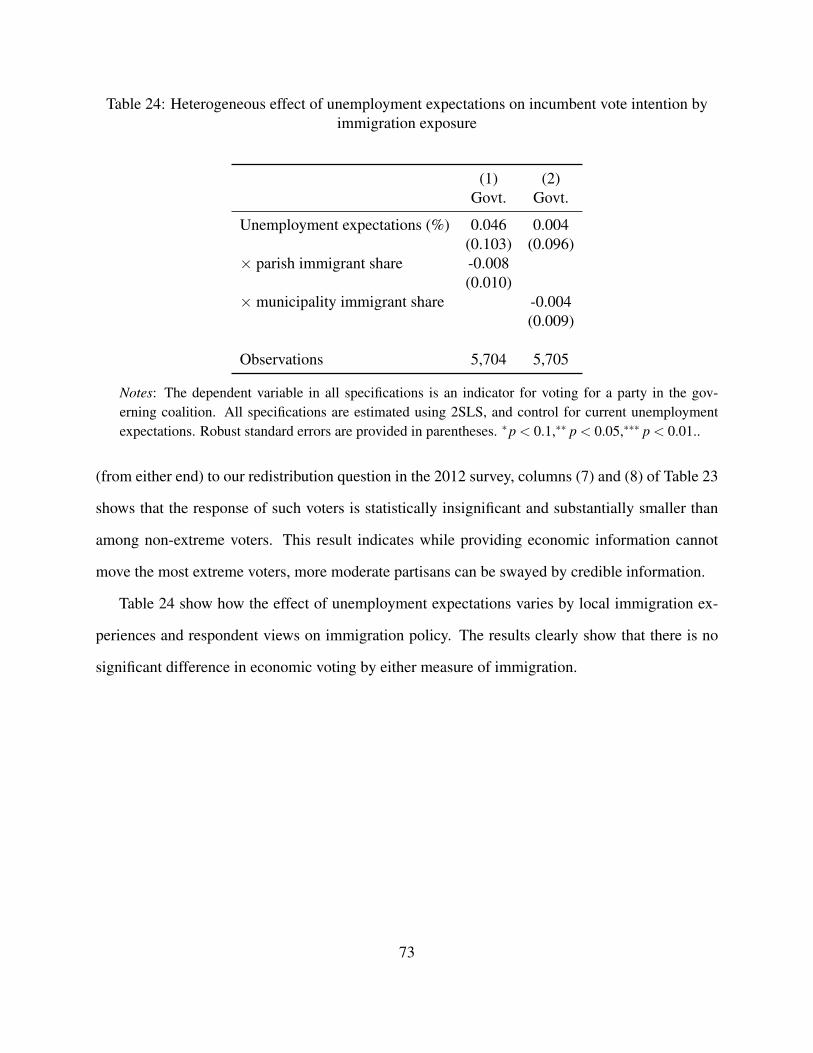
Table 24: Heterogeneous effect of unemployment expectations on incumbent vote intention byimmigration exposure
(1) (2)Govt. Govt.
Unemployment expectations (%) 0.046 0.004(0.103) (0.096)
× parish immigrant share -0.008(0.010)
× municipality immigrant share -0.004(0.009)
Observations 5,704 5,705
Notes: The dependent variable in all specifications is an indicator for voting for a party in the gov-erning coalition. All specifications are estimated using 2SLS, and control for current unemploymentexpectations. Robust standard errors are provided in parentheses. ∗p < 0.1,∗∗ p < 0.05,∗∗∗ p < 0.01..
(from either end) to our redistribution question in the 2012 survey, columns (7) and (8) of Table 23
shows that the response of such voters is statistically insignificant and substantially smaller than
among non-extreme voters. This result indicates while providing economic information cannot
move the most extreme voters, more moderate partisans can be swayed by credible information.
Table 24 show how the effect of unemployment expectations varies by local immigration ex-
periences and respondent views on immigration policy. The results clearly show that there is no
significant difference in economic voting by either measure of immigration.
73


![Does Being Verified Make You More Credible?Account ...dvotipka/papers/CHI2019TwitterCred.… · as credible or not-credible based on their features [5]. They use Amazon Mechanical](https://static.fdocuments.in/doc/165x107/601b34dcebbc2564f1536dba/does-being-verified-make-you-more-credibleaccount-dvotipkapaperschi2019twittercred.jpg)