creating your financial statments-slideshare
69
Solventurer Creating Your Financial Projections for Your Business Plan Creating Your Financial Projections For Your Business Plan The Step-by-Step Manual for Solopreneurs
Transcript of creating your financial statments-slideshare

Solventurer Creating Your Financial Projections for Your Business Plan
Creating Your Financial Projections For Your Business Plan
The Step-by-Step Manual for Solopreneurs

Solventurer Creating Your Financial Projections for Your Business Plan
© Solventurer –All Rights Reserved 2
Table of Contents
I. The Goal....................................................................................................................4
II. The Challenge ..........................................................................................................4
II. Introduction to Bill’s Solopreneur Business.................................................................8
Transactions for Financial Projections ...........................................................................9
III. Projected Balance Sheet.........................................................................................10
A. The Balance Sheet Equation ..................................................................................10
B. Assets .........................................................................................................................10
C. Liabilities.....................................................................................................................11
D. Net Worth...................................................................................................................11
E. The Financial Concerto ............................................................................................11
F. Bill’s Balance Sheet...................................................................................................14
IV. Projected Profit & Loss .............................................................................................22
A. The Basic Statement.................................................................................................22
B. Bill’s Projected P&L ....................................................................................................24
C. Looking at Bill’s P&L and Balance Sheet ..............................................................31
V. Projected Cash Flow ...............................................................................................33
VI. Putting the Projections Together ............................................................................38

Solventurer Creating Your Financial Projections for Your Business Plan
© Solventurer –All Rights Reserved 3
VII. Complex Transactions That You Will Use ..............................................................40
VIII. Putting the Projections Together (V 2.0) ..............................................................48
IX. Creating Your Financial Assumptions.....................................................................50
VIII. Crystal Ball ..............................................................................................................53
IX. Calculation ...............................................................................................................59
Solventurer Creating Your Financial Projections for Your Business Plan
© Solventurer –All Rights Reserved 4
I. The Goal As we all know, a business is built on numbers. A business plan needs to include numbers. Your idea needs to have numbers. This ebook shows you how to create accurate projections for your business.
II. The Challenge Oh, the dreaded financials.
The financials have caused so much stress in Solopreneurs that many business plans are scrapped because there are no numbers attached to the qualitative information.
Many of my former students use to insist on pushing the work of the numbers to the end. The numbers are at the end of the business plan, so save these for the end, right?
No!
Ideally, you want to start working on numbers at the onset of writing. These numbers should be started in a conceptual way when you are conducting your Feasibility.
If you haven’t done Feasibility, revisit it because it breaks down your business into very simple financial terms like unit cost, unit price, unit profit as well as the basic profit and loss statement.
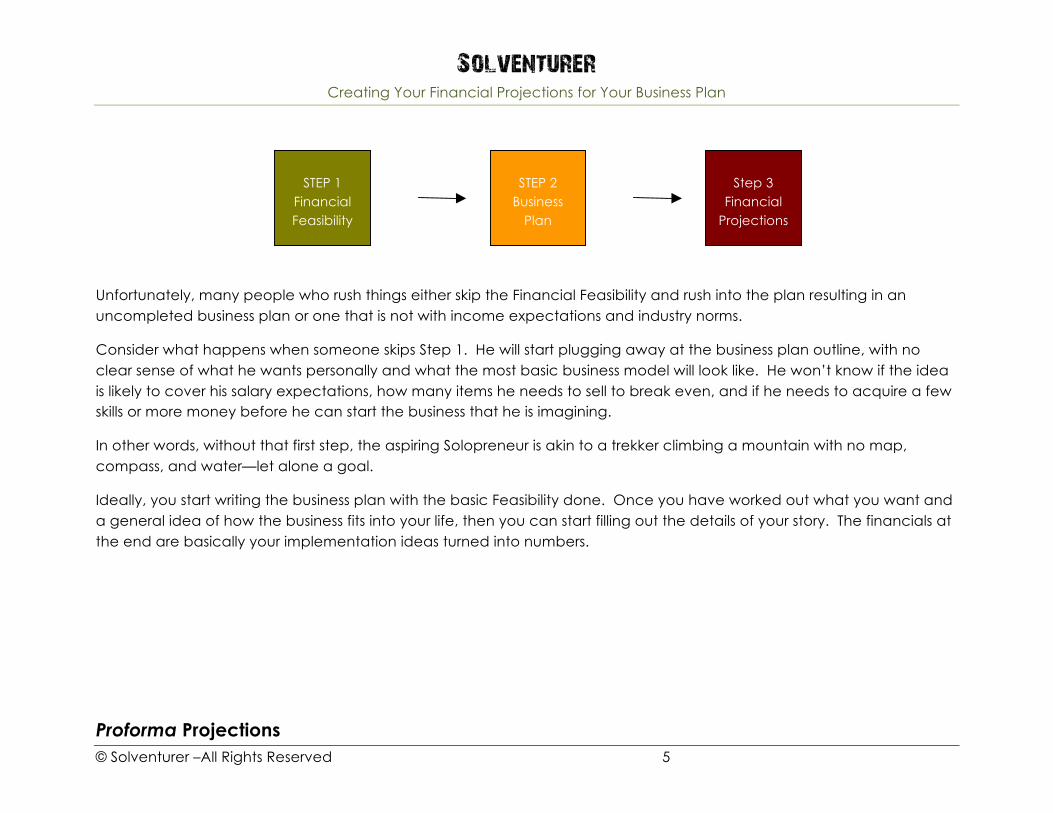
The work that you do in that initial Financial Feasibility is different from constructing your financial projections at the end of your business planning process. Your financial projections must be built on a business plan that is already figured out. So the order must be:
Solventurer Creating Your Financial Projections for Your Business Plan
© Solventurer –All Rights Reserved 5
Unfortunately, many people who rush things either skip the Financial Feasibility and rush into the plan resulting in an uncompleted business plan or one that is not with income expectations and industry norms.
Consider what happens when someone skips Step 1. He will start plugging away at the business plan outline, with no clear sense of what he wants personally and what the most basic business model will look like. He won’t know if the idea is likely to cover his salary expectations, how many items he needs to sell to break even, and if he needs to acquire a few skills or more money before he can start the business that he is imagining.
In other words, without that first step, the aspiring Solopreneur is akin to a trekker climbing a mountain with no map, compass, and water—let alone a goal.
Ideally, you start writing the business plan with the basic Feasibility done. Once you have worked out what you want and a general idea of how the business fits into your life, then you can start filling out the details of your story. The financials at the end are basically your implementation ideas turned into numbers.
Proforma Projections
STEP 1 Financial Feasibility
STEP 2 Business
Plan
Step 3 Financial
Projections
Solventurer Creating Your Financial Projections for Your Business Plan
© Solventurer –All Rights Reserved 6
In the entrepreneurial world, financial projections are considered pro forma statements. These statements model what is going to happen with a business based on a common set of assumptions.
Before I go into proforma projections, I feel compelled to point out one misconception: This is not financial accounting. It is management accounting.
The primary difference between the two is the time period they are depicting: Financial accounting looks at historical numbers to show what happened. Management accounting is more conceptual and shows management decisions in the future.
Management accounting for our purposes has a much lower learning curve than financial accounting because everything does not have to completely balance as it does in financial accounting to meet GAAR (Generally Accepted Accounting Rules).
Our use of management accounting, or proforma projections, is to quickly translate your verbal ideas into numbers to get a sense of how your business story will unfold. If the numbers don’t look good, you can make changes to your assumptions in your plan, and then modify the numbers.
How To Prepare Your Numbers
Startups service based businesses have three options for preparing Financial Projections: 1) use a Business Plan Pro kind of program, 2) disregard the financial projections numbers completely and hope for the best, or 3), create pro forma projections by hand (what I advocate and am teaching).
1) Many clients come in with all three financial statements: the cash flow projections, the balance sheet, and the projected profit and loss. At first glance, it is very impressive. After two or three minutes though, I can tell that is was generated by a Business Plan Pro type of software. It’s clear the person doesn’t understand the numbers. The software asks a series of questions and then spits out all three financial statements (as well as financial ratios!). The problem is not the statements themselves, but the lack of understanding what they mean.

Solventurer Creating Your Financial Projections for Your Business Plan
© Solventurer –All Rights Reserved 7
Every banker will tell you the assumptions behind your numbers are more important than the numbers themselves. So these clients are missing the point! Decisions in your business SHOULD revolve around either cost or income considerations…if you don’t understand how your financial statements are linked, you won’t know the true consequences of making a big decision.
2) The second scenario is not looking at the numbers at all. A rational person has heard from experts that “you need at least a college accounting course to see how the statements are linked” or, “If you can’t do it correctly, don’t do it at all.” Not the case. You need to have numbers to accompany your business plan. Ever see a car move with no wheels?
3) The third option, the best option, is to create a series of projections where you know what is behind each number.
Because our type of business is relatively straightforward, we shouldn’t lose any accuracy by taking this path. The process of doing it “by hand” will empower your understanding of the numbers behind your business and put you in a better situation than without.

Solventurer Creating Your Financial Projections for Your Business Plan
© Solventurer –All Rights Reserved 8
III. Introduction to Bill’s Solopreneur Business I am going to show you how to build all your financial projections through an example Solopreneur, Bill. This example will deviate from the normal financial projection process because I will look at isolated transactions versus trends, what you will be using. Isolated transactions will allow you to understand how each type of transaction affects the Balance Sheet, Profit & Loss, and Cash Flow projections.
An isolated transaction versus a trend can be seen when you are projecting loan payments:
• Isolated: Our avatar Bill will only project ONE loan payment for the entire year. • Trend: Bill in reality will project a loan payment each month moving forward. This will require one more
mathematical step. As I am trying to teach the concepts quickly, this is one step too many. After the initial lesson, I will take another example, Lilly, and show how she builds her statements using Trends. By understanding individual transactions, this should be an easy learn.
So you’ll notice below at the future transactions that will build Bill’s projections, they are broken down into four quarters. Again, this is for simplicity. I didn’t want to have to build out 12 months of transactions to make my point.
While we are changing a few basic things to make the example more simple, we are not sacrificing other norms that you should get used to. All your projections should be one year projections. You can also have more detailed month-to-month projections, but the at the very least, your set of projections should span twelve months.

Solventurer Creating Your Financial Projections for Your Business Plan
Transactions for Financial Projections
Month 0: A. Starting point. Cash, investments…
Quarter 1: B. Receive loan $2,500 C. Marketing expense $2,500 D. Sales $4,000
Quarter 2: E. Pay loan $1,250 F. Owner Withdrawal of $3,000 G. Pay Rent $1,000; Utilities $1,000
Quarter 3: H. Marketing expense $2,000 I. Sales $8,000
Quarter 4: J. Owner Withdrawal of $500
To show later… K. Sales of $4,000, half paid in cash and half later (undefined time) L. Subcontractor X does work for Bill who will pay $1,000 later
Other: M. A line item showing an expected 10% of Account Receivables that won’t be collected. N. Bill will depreciate his equipment

Solventurer Creating Your Financial Projections for Your Business Plan
IV. Projected Balance Sheet
A. The Balance Sheet Equation The Balance Sheet is a snapshot of the company at any time—be it today, tomorrow or Mar 23rd at 10AM next year. This snapshot shows you what you have on hand—your assets and what you owe other people—your liabilities. The difference between Assets and Liabilities, Net Worth, is what part of the company you own.
Seen in equation form, it is
Assets = Liabilities + Net Worth
In a table form, note how the Assets are equal to the sum of the Liabilities and Net Worth. If Assets are worth $3, and Liabilities (Debt) are worth $1, your Net Worth is worth $2 to make the equation true:
Balance Sheet Assets $3 Liabilities $1 Net Worth ? Liabilities + Net Worth $3
Balance Sheet Assets $3 Liabilities $1 Net Worth $2 Liabilities + Net Worth $3
B. Assets Assets are the stuff in your business such as the cash, equipment, property, investments, and inventory and your business. Assets give your business capacity to do business. Compare a Solopreneur web designer with $5,000 of Assets ($3,000 in Cash and $2,000 in computer equipment/software) with one with no Assets. The second web designer is handcuffed in marketing his service, let alone actually producing web pages. Good Solopreneurs reinvest profits into their business’s Asset base to give it more capacity to create and service demand.

Solventurer Creating Your Financial Projections for Your Business Plan
© Solventurer –All Rights Reserved 11
C. Liabilities Liabilities is the stuff your business owes. It consists of outstanding loans and contracted payments (also known as Accounts Payable). Liabilities give you leverage to expand your business through borrowing money to build up your Assets (to give extra capacity). It is split up between Current and Long Term Liabilities. Current Liabilities is the portion of the debt that is due in less than a year. Long term Liabilities is the portion due in more than a year. Note that these Liabilities are not to be confused with bills due next month that you haven’t paid yet, i.e. your utility or rent bill. Those don’t affect your Projected Balance Sheet at all as they are expenses found in the Projected Profit & Loss and are only considered Liabilities on the day that they are due. For your Balance Sheet projections, you’ll only worry about loans and Accounts Payable. Accounts Payable are going to be classified under Current Liabilities. Loans, called Notes Payable in the Balance Sheet, are going to be split between Current and Long Term Payables. If I were to get a loan for $9,000 to be paid over 3 years, roughly $3,000 would be categorized as Current Notes Payable and roughly $6,000 would be listed as Long Term Notes Payable.
D. Net Worth Net Worth, called Owner’s Equity in the corporate world, is how much of the stuff in your company is yours. That is, the amount of “value” that is created from your initial investment and re-investments of the company profits. Net Worth is what business owners look closely at because it is the fruits of labor. When we talk about reinvesting profits into the company or working hard now to benefit later, what we’re really talking about is building our Net Worth. The day we want to get out of our company, the Net Worth is how much we own and can sell. Net Worth is often broken up into three parts: Initial Investment, Retained Earnings, and Net Worth. Initial Investment is how much the Solopreneur actually contributes to the business from his own pocket—usually at the startup phase. Retained Earnings is the amount of Profit that is left in the company rather than taken out for the owner. Net Worth is the sum of the two.
E. Put em’ Together Let’s put all of the elements together. If your Assets are $10, Liabilities are $5, and your Net Worth is $5, the equation and Balance Sheet (table) look like:

Solventurer Creating Your Financial Projections for Your Business Plan
© Solventurer –All Rights Reserved 12
Initial Balance Sheet
Assets = Liabilities + Net Worth
$10 = $5 + $5
Balance Sheet Assets $10 Liabilities $5 Net Worth $5 Liabilities & Net Worth $10
Let’s show some activity. Let’s say you decide to pay off the debt. If you want to reduce your Liabilities balance to zero, you’ll have to take the money from your Assets. You’ll take $5 off your Assets, take $5 from your Liabilities, and your Net Worth will stay the same. See the changes:
Balance Sheet after paying off Liabilities
Assets = Liabilities + Net Worth
$5 = $0 + $5
Balance Sheet Assets $5 Liabilities $0 Net Worth $5 Liabilities & Net Worth $5
The Balance Sheets shows the Assets the same as the Net Worth, meaning all of the Assets in the company are YOURS. No one else has the rights to them. No banker, no friend who has lent you money, no equipment dealer has any right to anything in your business. If your business closed its doors, your would own all of the Assets.
Before we go any further, let’s build out the Balance Sheet in a few steps to include some details.
Step 1
Build out the Assets to two line items, Cash and Equipment. We’ll add other items like Accumulated Depreciation and Accounts Receivable later, but Cash and Equipment is a good place to start.
Under Liabilities, break that down into
Balance Sheet Current Assets
Cash Equipment
Total Assets Liabilities
Current Liabilities Long Term Liabilities

Solventurer Creating Your Financial Projections for Your Business Plan
© Solventurer –All Rights Reserved 13
Current and Long Term Liabilities. Current Liabilities are those that you have to pay within one year, and the Long Term Liabilities are those you’ll pay later.
Total Liabilities Net Worth Liabilities + Net Worth
Step 2
Build out Liabilities to include Notes Payable. Current Notes Payable you’ll have to pay within one year, and the Long Term Notes Payable are the debts you’ll have to pay beyond the immediate year. I’ll abbreviate Notes Payable as “Notes.” Later I’ll add Accounts Payable to Current Liabilities, but I’ll leave it out for now.
Balance Sheet Current Assets
Cash Equipment
Total Assets Liabilities
Current Liabilities Current Notes
Long Term Liabilities Long Term Notes
Total Liabilities Net Worth Liabilities + Net Worth
Step 3
To avoid subcategorizing to death, let’s eliminate Current and Long Term Liabilities.
Balance Sheet Current Assets
Cash Equipment
Total Assets Liabilities
Current Notes Long Term Notes
Total Liabilities Net Worth Liabilities + Net Worth
Solventurer Creating Your Financial Projections for Your Business Plan
© Solventurer –All Rights Reserved 14
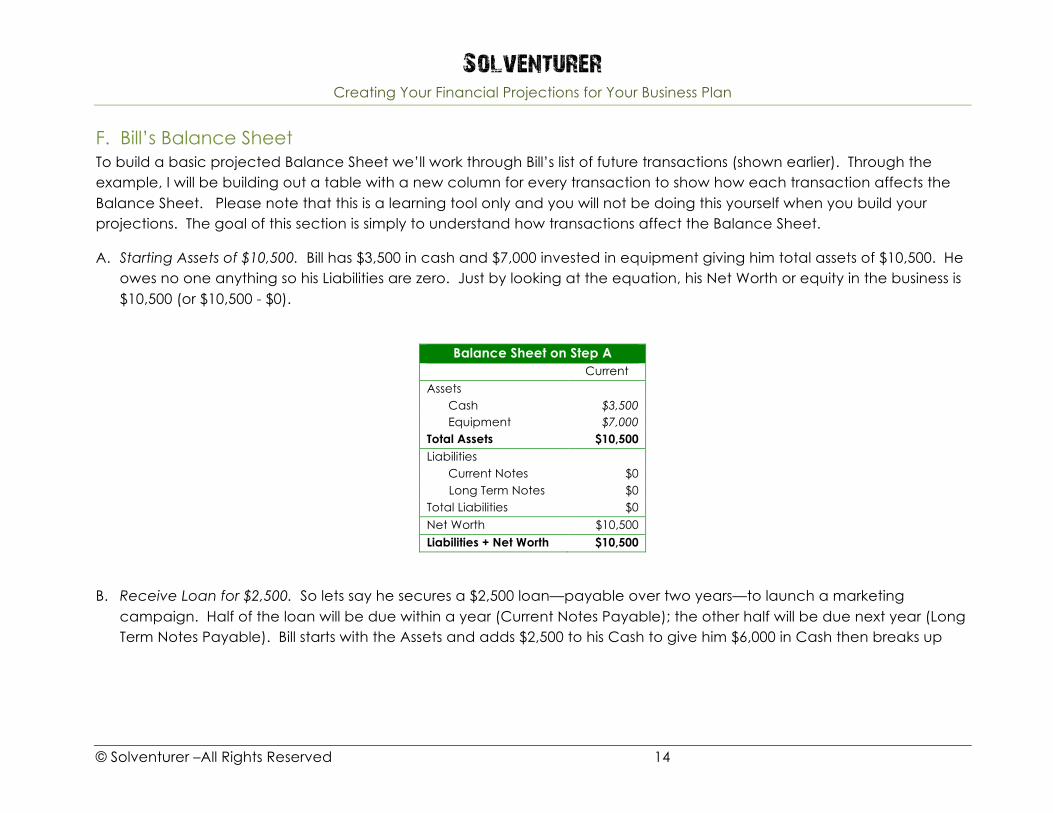
F. Bill’s Balance Sheet To build a basic projected Balance Sheet we’ll work through Bill’s list of future transactions (shown earlier). Through the example, I will be building out a table with a new column for every transaction to show how each transaction affects the Balance Sheet. Please note that this is a learning tool only and you will not be doing this yourself when you build your projections. The goal of this section is simply to understand how transactions affect the Balance Sheet.
A. Starting Assets of $10,500. Bill has $3,500 in cash and $7,000 invested in equipment giving him total assets of $10,500. He owes no one anything so his Liabilities are zero. Just by looking at the equation, his Net Worth or equity in the business is $10,500 (or $10,500 - $0).
Balance Sheet on Step A Current Assets
Cash $3,500 Equipment $7,000
Total Assets $10,500 Liabilities
Current Notes $0 Long Term Notes $0
Total Liabilities $0 Net Worth $10,500 Liabilities + Net Worth $10,500
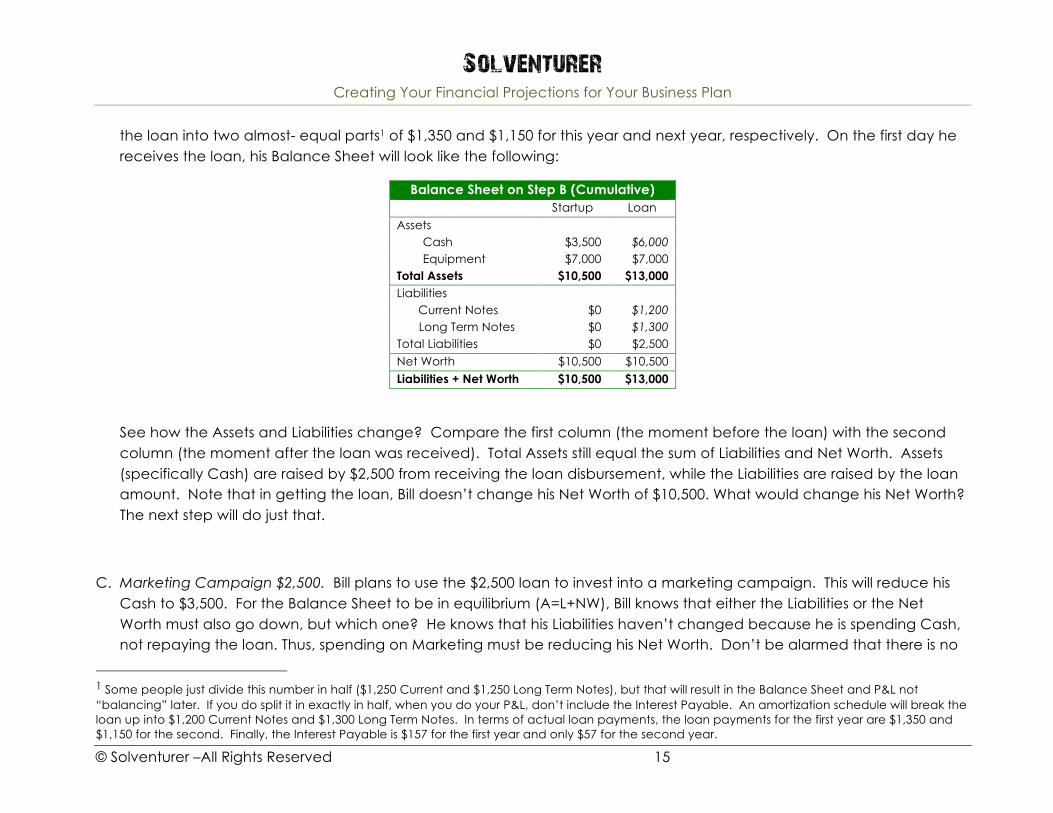
B. Receive Loan for $2,500. So lets say he secures a $2,500 loan—payable over two years—to launch a marketing campaign. Half of the loan will be due within a year (Current Notes Payable); the other half will be due next year (Long Term Notes Payable). Bill starts with the Assets and adds $2,500 to his Cash to give him $6,000 in Cash then breaks up
Solventurer Creating Your Financial Projections for Your Business Plan
© Solventurer –All Rights Reserved 15
the loan into two almost- equal parts1 of $1,350 and $1,150 for this year and next year, respectively. On the first day he receives the loan, his Balance Sheet will look like the following:
Balance Sheet on Step B (Cumulative) Startup Loan Assets
Cash $3,500 $6,000 Equipment $7,000 $7,000
Total Assets $10,500 $13,000 Liabilities
Current Notes $0 $1,200 Long Term Notes $0 $1,300
Total Liabilities $0 $2,500 Net Worth $10,500 $10,500 Liabilities + Net Worth $10,500 $13,000
See how the Assets and Liabilities change? Compare the first column (the moment before the loan) with the second column (the moment after the loan was received). Total Assets still equal the sum of Liabilities and Net Worth. Assets (specifically Cash) are raised by $2,500 from receiving the loan disbursement, while the Liabilities are raised by the loan amount. Note that in getting the loan, Bill doesn’t change his Net Worth of $10,500. What would change his Net Worth? The next step will do just that.
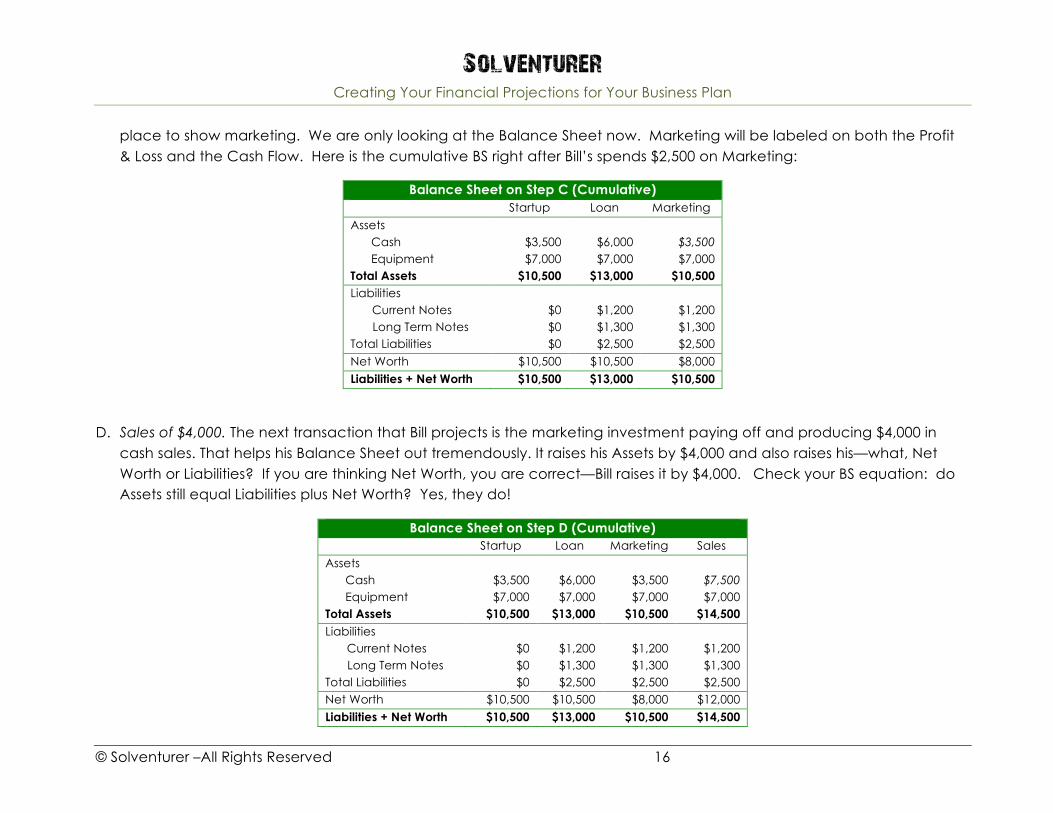
C. Marketing Campaign $2,500. Bill plans to use the $2,500 loan to invest into a marketing campaign. This will reduce his Cash to $3,500. For the Balance Sheet to be in equilibrium (A=L+NW), Bill knows that either the Liabilities or the Net Worth must also go down, but which one? He knows that his Liabilities haven’t changed because he is spending Cash, not repaying the loan. Thus, spending on Marketing must be reducing his Net Worth. Don’t be alarmed that there is no
1 Some people just divide this number in half ($1,250 Current and $1,250 Long Term Notes), but that will result in the Balance Sheet and P&L not “balancing” later. If you do split it in exactly in half, when you do your P&L, don’t include the Interest Payable. An amortization schedule will break the loan up into $1,200 Current Notes and $1,300 Long Term Notes. In terms of actual loan payments, the loan payments for the first year are $1,350 and $1,150 for the second. Finally, the Interest Payable is $157 for the first year and only $57 for the second year.
Solventurer Creating Your Financial Projections for Your Business Plan
© Solventurer –All Rights Reserved 16
place to show marketing. We are only looking at the Balance Sheet now. Marketing will be labeled on both the Profit & Loss and the Cash Flow. Here is the cumulative BS right after Bill’s spends $2,500 on Marketing:
Balance Sheet on Step C (Cumulative) Startup Loan Marketing Assets
Cash $3,500 $6,000 $3,500 Equipment $7,000 $7,000 $7,000
Total Assets $10,500 $13,000 $10,500 Liabilities
Current Notes $0 $1,200 $1,200 Long Term Notes $0 $1,300 $1,300
Total Liabilities $0 $2,500 $2,500 Net Worth $10,500 $10,500 $8,000 Liabilities + Net Worth $10,500 $13,000 $10,500
D. Sales of $4,000. The next transaction that Bill projects is the marketing investment paying off and producing $4,000 in cash sales. That helps his Balance Sheet out tremendously. It raises his Assets by $4,000 and also raises his—what, Net Worth or Liabilities? If you are thinking Net Worth, you are correct—Bill raises it by $4,000. Check your BS equation: do Assets still equal Liabilities plus Net Worth? Yes, they do!
Balance Sheet on Step D (Cumulative) Startup Loan Marketing Sales Assets
Cash $3,500 $6,000 $3,500 $7,500 Equipment $7,000 $7,000 $7,000 $7,000
Total Assets $10,500 $13,000 $10,500 $14,500 Liabilities
Current Notes $0 $1,200 $1,200 $1,200 Long Term Notes $0 $1,300 $1,300 $1,300
Total Liabilities $0 $2,500 $2,500 $2,500 Net Worth $10,500 $10,500 $8,000 $12,000 Liabilities + Net Worth $10,500 $13,000 $10,500 $14,500

Solventurer Creating Your Financial Projections for Your Business Plan
© Solventurer –All Rights Reserved 17
Let’s take a step back and see where Bill stands. From the startup through Step D, Bill projects to grow his Assets by $4,000 ($7,500-$3,500), Liabilities by $2,500 ($2,500-$0), and his Net Worth by $1,500 ($12,000-$10,500).
E. Loan Payment of $1,350. Bill plans to take out $1,350 cash to pay for the entire first year loan balance (Interest + the Notes Payable). This will reduce his Current Notes to zero. Part E of the P&L will explain fully how $1,350 was derived, but note that the cash used paid for all of the Current Notes Payable ($1,200), but also had to draw from the Net Worth to pay for the annual Interest Expense ($150) to make the equation balance.
Balance Sheet on Step E (Cumulative) Startup Loan Marketing Sales Loan Pmt Assets
Cash $3,500 $6,000 $3,500 $7,500 $6,150 Equipment $7,000 $7,000 $7,000 $7,000 $7,000
Total Assets $10,500 $13,000 $10,500 $14,500 $13,150 Liabilities
Current Notes $0 $1,200 $1,200 $1,200 $0 Long Term Notes $0 $1,300 $1,300 $1,300 $1,300
Total Liabilities $0 $2,500 $2,500 $2,500 $1,300 Net Worth $10,500 $10,500 $8,000 $12,000 $11,850 Liabilities + Net Worth $10,500 $13,000 $10,500 $14,500 $13,150
F. Owner Withdrawal of $3,000. Bill foresees his next transaction will be taking money out of the company for personal reasons. This is often called an Owner’s Withdrawal in contrast to Salary, which implies a consistent drawing every month. Aside from Cash, what else is affected? If an owner takes cash out of the business, and it is not used to pay loans or build assets, the only thing it can change is Net Worth. That’s the bad news about paying yourself a salary: you are enriching yourself now at the expense of a higher Net Worth later. A Withdrawal of $3,000 is shown below:

Solventurer Creating Your Financial Projections for Your Business Plan
© Solventurer –All Rights Reserved 18
Balance Sheet on Step F (Cumulative) Startup Loan Marketing Sales Loan
Pmt O.W.
Assets Cash $3,500 $6,000 $3,500 $7,500 $6,150 $3,150 Equipment $7,000 $7,000 $7,000 $7,000 $7,000 $7,000
Total Assets $10,500 $13,000 $10,500 $14,500 $13,150 $10,150 Liabilities
Current Notes $0 $1,200 $1,200 $1,200 $0 $0 Long Term Notes $0 $1,300 $1,300 $1,300 $1,300 $1,300
Total Liabilities $0 $2,500 $2,500 $2,500 $1,300 $1,300 Net Worth $10,500 $10,500 $8,000 $12,000 $11,850 $8,850 Liabilities + Net Worth $10,500 $13,000 $10,500 $14,500 $13,150 $10,150
You see how taking money out of the company for the owner’s expenses sucks the equity out of the business: Bill’s Net Worth dropped by $3,000.
G. Pay Rent $1,000 and Utilities $1,000. He knows he will have to pay his overhead bills. Where would they go? If you’re thinking Cash…that’s right! Where else? Net Worth. By paying bills, Bills is again diluting his Net Worth. So paying bills of $2,000 leaves his Balance Sheet looking like:
Balance Sheet on Step G (Cumulative) Startup Loan Marketing Sales Loan
Pmt O.W. Bills
Assets Cash $3,500 $6,000 $3,500 $7,500 $6,300 $3,150 $1,150 Equipment $7,000 $7,000 $7,000 $7,000 $7,000 $7,000 $7,000
Total Assets $10,500 $13,000 $10,500 $14,500 $13,300 $10,150 $8,150 Liabilities
Current Notes $0 $1,200 $1,200 $1,200 $0 $0 $0 Long Term Notes $0 $1,300 $1,300 $1,300 $1,300 $1,300 $1,300
Total Liabilities $0 $2,500 $2,500 $2,500 $1,300 $1,300 $1,300 Net Worth $10,500 $10,500 $8,000 $12,000 $12,000 $8,850 $6,850 Liabilities + Net Worth $10,500 $13,000 $10,500 $14,500 $13,300 $10,150 $8,150
Solventurer Creating Your Financial Projections for Your Business Plan
© Solventurer –All Rights Reserved 19
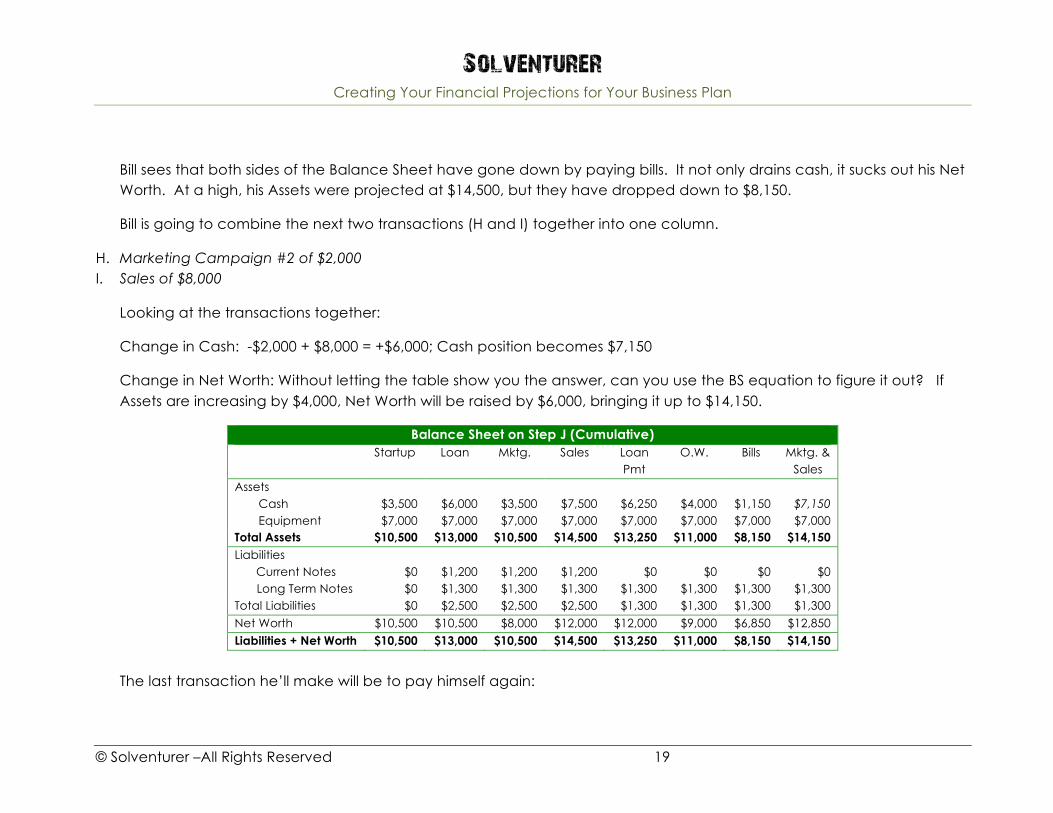
Bill sees that both sides of the Balance Sheet have gone down by paying bills. It not only drains cash, it sucks out his Net Worth. At a high, his Assets were projected at $14,500, but they have dropped down to $8,150.
Bill is going to combine the next two transactions (H and I) together into one column.
H. Marketing Campaign #2 of $2,000 I. Sales of $8,000
Looking at the transactions together:
Change in Cash: -$2,000 + $8,000 = +$6,000; Cash position becomes $7,150
Change in Net Worth: Without letting the table show you the answer, can you use the BS equation to figure it out? If Assets are increasing by $4,000, Net Worth will be raised by $6,000, bringing it up to $14,150.
Balance Sheet on Step J (Cumulative) Startup Loan Mktg. Sales Loan
Pmt O.W. Bills Mktg. &
Sales Assets
Cash $3,500 $6,000 $3,500 $7,500 $6,250 $4,000 $1,150 $7,150 Equipment $7,000 $7,000 $7,000 $7,000 $7,000 $7,000 $7,000 $7,000
Total Assets $10,500 $13,000 $10,500 $14,500 $13,250 $11,000 $8,150 $14,150 Liabilities
Current Notes $0 $1,200 $1,200 $1,200 $0 $0 $0 $0 Long Term Notes $0 $1,300 $1,300 $1,300 $1,300 $1,300 $1,300 $1,300
Total Liabilities $0 $2,500 $2,500 $2,500 $1,300 $1,300 $1,300 $1,300 Net Worth $10,500 $10,500 $8,000 $12,000 $12,000 $9,000 $6,850 $12,850 Liabilities + Net Worth $10,500 $13,000 $10,500 $14,500 $13,250 $11,000 $8,150 $14,150
The last transaction he’ll make will be to pay himself again:
Solventurer Creating Your Financial Projections for Your Business Plan
© Solventurer –All Rights Reserved 20
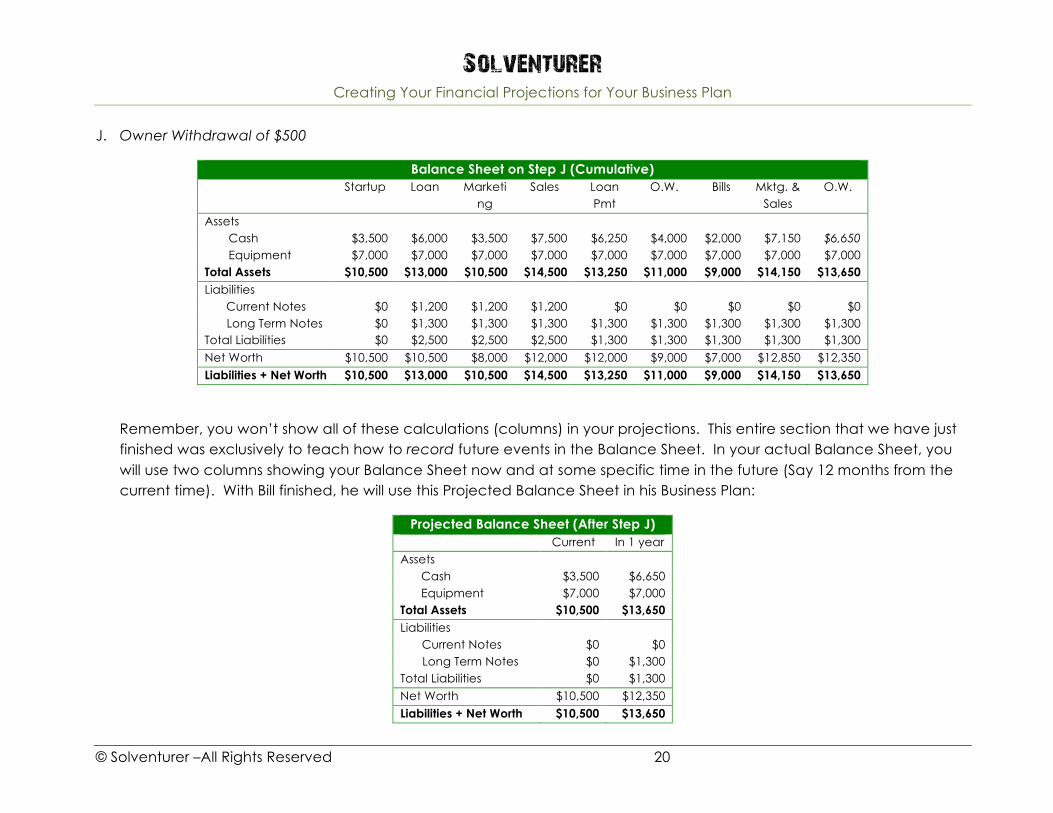
J. Owner Withdrawal of $500
Balance Sheet on Step J (Cumulative) Startup Loan Marketi
ng Sales Loan
Pmt O.W. Bills Mktg. &
Sales O.W.
Assets Cash $3,500 $6,000 $3,500 $7,500 $6,250 $4,000 $2,000 $7,150 $6,650 Equipment $7,000 $7,000 $7,000 $7,000 $7,000 $7,000 $7,000 $7,000 $7,000
Total Assets $10,500 $13,000 $10,500 $14,500 $13,250 $11,000 $9,000 $14,150 $13,650 Liabilities
Current Notes $0 $1,200 $1,200 $1,200 $0 $0 $0 $0 $0 Long Term Notes $0 $1,300 $1,300 $1,300 $1,300 $1,300 $1,300 $1,300 $1,300
Total Liabilities $0 $2,500 $2,500 $2,500 $1,300 $1,300 $1,300 $1,300 $1,300 Net Worth $10,500 $10,500 $8,000 $12,000 $12,000 $9,000 $7,000 $12,850 $12,350 Liabilities + Net Worth $10,500 $13,000 $10,500 $14,500 $13,250 $11,000 $9,000 $14,150 $13,650
Remember, you won’t show all of these calculations (columns) in your projections. This entire section that we have just finished was exclusively to teach how to record future events in the Balance Sheet. In your actual Balance Sheet, you will use two columns showing your Balance Sheet now and at some specific time in the future (Say 12 months from the current time). With Bill finished, he will use this Projected Balance Sheet in his Business Plan:
Projected Balance Sheet (After Step J) Current In 1 year Assets
Cash $3,500 $6,650 Equipment $7,000 $7,000
Total Assets $10,500 $13,650 Liabilities
Current Notes $0 $0 Long Term Notes $0 $1,300
Total Liabilities $0 $1,300 Net Worth $10,500 $12,350 Liabilities + Net Worth $10,500 $13,650
Solventurer Creating Your Financial Projections for Your Business Plan
© Solventurer –All Rights Reserved 21
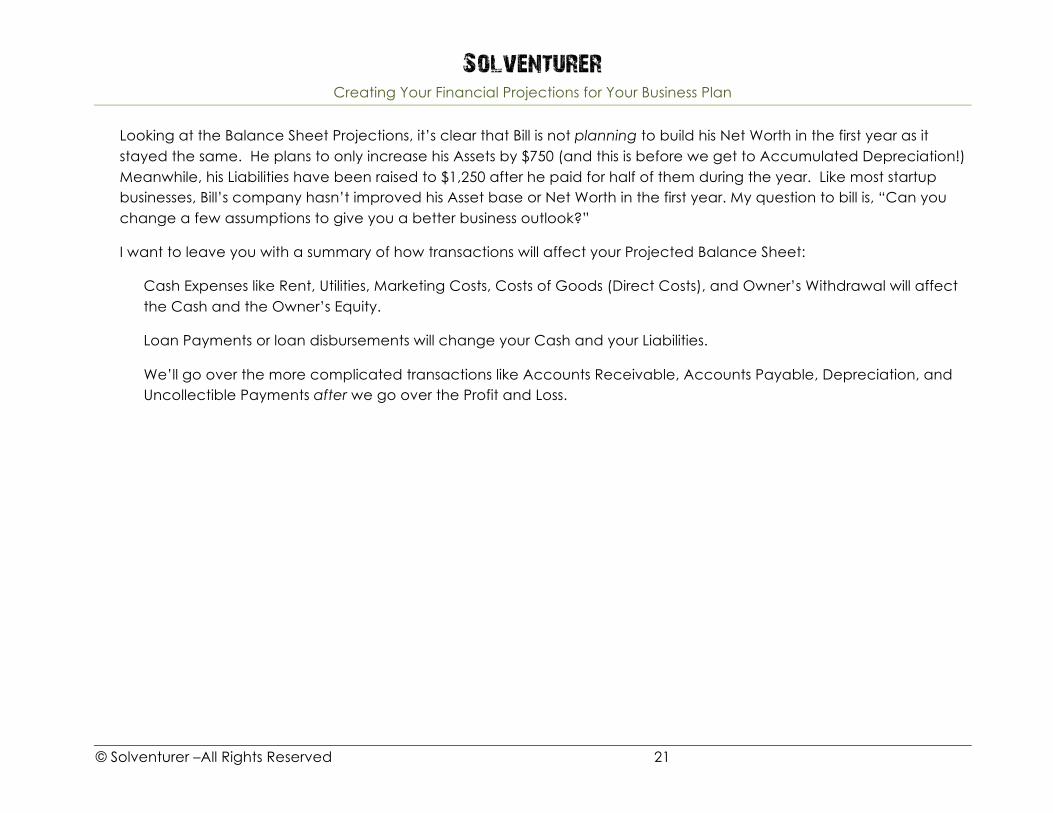
Looking at the Balance Sheet Projections, it’s clear that Bill is not planning to build his Net Worth in the first year as it stayed the same. He plans to only increase his Assets by $750 (and this is before we get to Accumulated Depreciation!) Meanwhile, his Liabilities have been raised to $1,250 after he paid for half of them during the year. Like most startup businesses, Bill’s company hasn’t improved his Asset base or Net Worth in the first year. My question to bill is, “Can you change a few assumptions to give you a better business outlook?”
I want to leave you with a summary of how transactions will affect your Projected Balance Sheet:
Cash Expenses like Rent, Utilities, Marketing Costs, Costs of Goods (Direct Costs), and Owner’s Withdrawal will affect the Cash and the Owner’s Equity.
Loan Payments or loan disbursements will change your Cash and your Liabilities.
We’ll go over the more complicated transactions like Accounts Receivable, Accounts Payable, Depreciation, and Uncollectible Payments after we go over the Profit and Loss.

Solventurer Creating Your Financial Projections for Your Business Plan
© Solventurer –All Rights Reserved 22
V. Projected Profit & Loss
A. The Basic Statement Think of your Balance Sheet as a noun—that is, a moment in time or “a snapshot”. It shows your financial standing at a precise time be it now or tomorrow or March 17, 2013 at 9:33AM. Your Profit and Loss, also called the Income Statement or abbreviated as P&L, can be thought of as a verb. It shows business activity over a period of time. On the Profit and Loss, a time range is always indicated. For a historical P&L, the range might be “1st Quarter 2014” in the year, or “January 1-March 31st 2014”. For a Projected P&L, the range could be from today to twelve months from now, using the appropriate dates. That’s what I’ll be teaching.
The P&L shows three things: Income, Expenses, and Profit. That’s it. Here’s a simple Projected P&L for today through tomorrow having made no sales or incurring no expenses:
Profit and Loss Debit Credit Income
Sales $0 Less Direct Costs $0
Gross Profit $0 Expenses
Rent $0 Utilities $0 Marketing $0 Owner Withdrawal $0 Travel $0
Total Expenses $0
Net Income Before Tax $0
A few things to point out.

Solventurer Creating Your Financial Projections for Your Business Plan
© Solventurer –All Rights Reserved 23
The table is split horizontally by Debits and Credits, which are easy for our simple projections. You Credit all the income coming in and Debit all your costs.
The table is split vertically by the Income items (Sales) and the Expense items (Rent, Utilities, etc.). The two most important numbers are Gross Profit and Net Income Before Tax, thus I bolded them.
Gross Profit is the Sales minus the Direct Costs—also called the Cost of Goods or COGS. The Client-Focused Solopreneurs won’t have Direct Costs or they will be extremely minor. For projections we can treat these as zero. So, our Sales are also our Gross Revenue.
Net Income Before Taxes is the Gross Profit minus the Total Expenses. Typically, you’ll write your Expenses as positive (+) in the column, but the Net Income will be written with a negative if the expenses are greater than the Sales. For the sake of brevity, I’ll abbreviate this as “Net Income”.
Let’s construct a simple P&L. Say you buy something for $1, sell it for $5, and incur a marketing cost of $2.
P & L: Simple Example Income
Sales $5 Less Direct Costs $1
Gross Profit $4 Expenses
Rent $0 Utilities $0 Marketing $2 Owner Withdrawal $0 Interest Payable $0
Total Expenses $2
Net Income Before Tax $2

Solventurer Creating Your Financial Projections for Your Business Plan
© Solventurer –All Rights Reserved 24
B. Bill’s Projected P&L Using the same list of transactions, let’s look at the transactions that Bill already created a Projected Balance Sheet for and create a Projected P&L.
Step A—starting cash—shows a position, not a transaction (remember the P&L is the activity that affects that Balance Sheet) so there is no P&L entry. Step B, a loan disbursement, also won’t change the P & L because it’s neither income nor an expense. More on recording loans in the P&L in step E.
C. Marketing of $2,500. Marketing is an expense. So after a loan payment and marketing expenses, the business is showing a loss of $2,500. Note how the negative is represented by parenthesis.
P & L: Step A – Step C Income
Sales $0 Less Direct Costs $0
Gross Profit $0 Expenses
Rent $0 Utilities $0 Marketing $2,500 Owner Withdrawal $0 Interest Payable $0
Total Expenses $2,500
Net Income ($2,500)
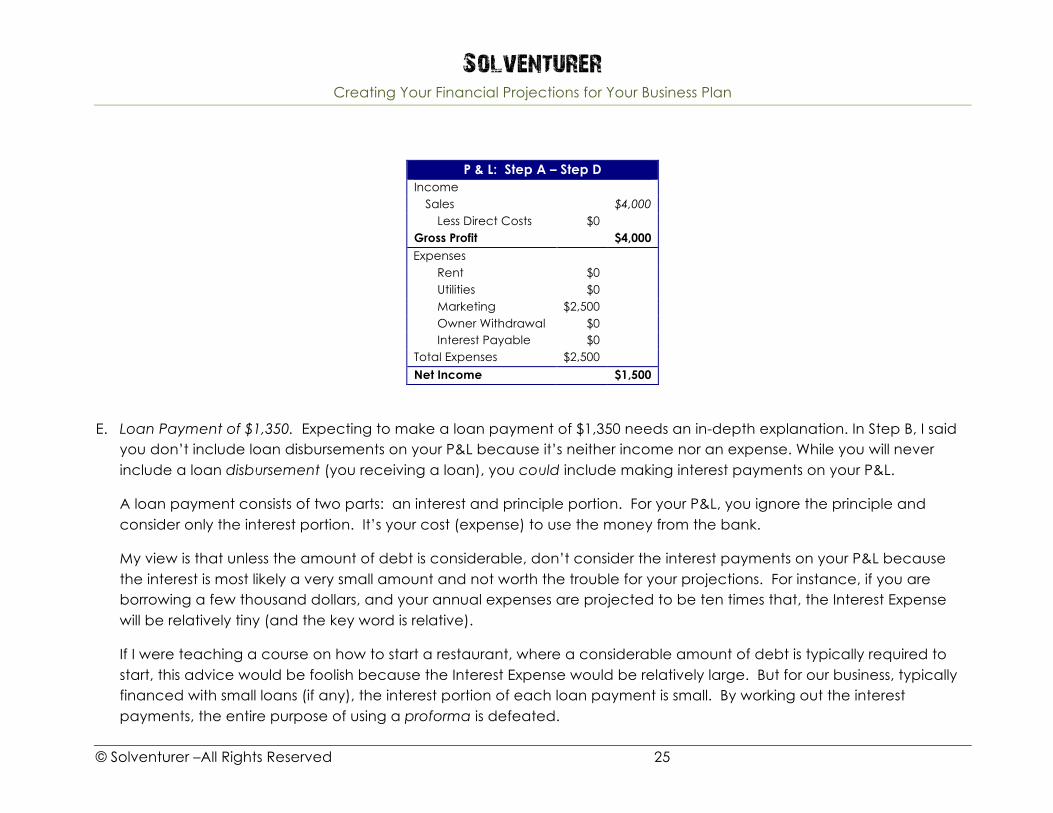
D. Sales of $4,000. We can’t add columns like we did in the Balance Sheet to teach each step. So we’ll just work on top of the last example. Step D is securing $4,000 in Sales. Note that Bill’s expected Direct Costs are zero, so the Gross Profit is the same as the Sales. The Net Income is now a positive $1,500.
Solventurer Creating Your Financial Projections for Your Business Plan
© Solventurer –All Rights Reserved 25
P & L: Step A – Step D Income
Sales $4,000 Less Direct Costs $0
Gross Profit $4,000 Expenses
Rent $0 Utilities $0 Marketing $2,500 Owner Withdrawal $0 Interest Payable $0
Total Expenses $2,500
Net Income $1,500
E. Loan Payment of $1,350. Expecting to make a loan payment of $1,350 needs an in-depth explanation. In Step B, I said you don’t include loan disbursements on your P&L because it’s neither income nor an expense. While you will never include a loan disbursement (you receiving a loan), you could include making interest payments on your P&L.
A loan payment consists of two parts: an interest and principle portion. For your P&L, you ignore the principle and consider only the interest portion. It’s your cost (expense) to use the money from the bank.
My view is that unless the amount of debt is considerable, don’t consider the interest payments on your P&L because the interest is most likely a very small amount and not worth the trouble for your projections. For instance, if you are borrowing a few thousand dollars, and your annual expenses are projected to be ten times that, the Interest Expense will be relatively tiny (and the key word is relative).
If I were teaching a course on how to start a restaurant, where a considerable amount of debt is typically required to start, this advice would be foolish because the Interest Expense would be relatively large. But for our business, typically financed with small loans (if any), the interest portion of each loan payment is small. By working out the interest payments, the entire purpose of using a proforma is defeated.
Solventurer Creating Your Financial Projections for Your Business Plan
© Solventurer –All Rights Reserved 26
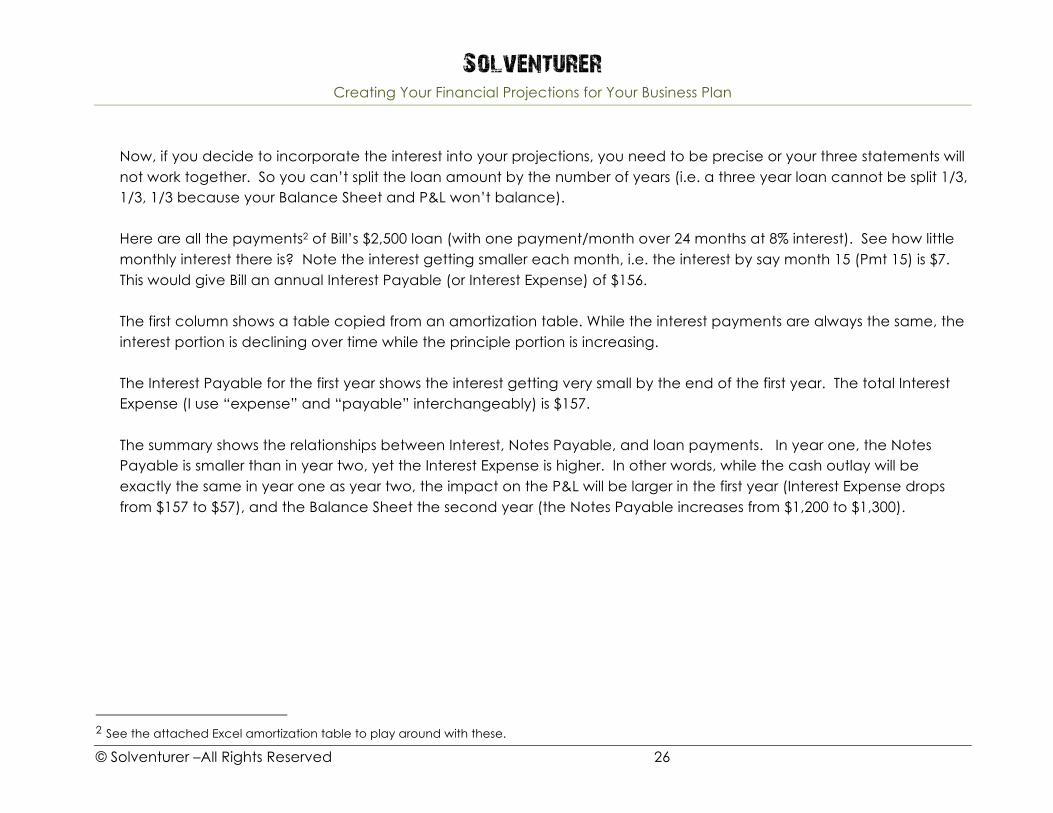
Now, if you decide to incorporate the interest into your projections, you need to be precise or your three statements will not work together. So you can’t split the loan amount by the number of years (i.e. a three year loan cannot be split 1/3, 1/3, 1/3 because your Balance Sheet and P&L won’t balance). Here are all the payments2 of Bill’s $2,500 loan (with one payment/month over 24 months at 8% interest). See how little monthly interest there is? Note the interest getting smaller each month, i.e. the interest by say month 15 (Pmt 15) is $7. This would give Bill an annual Interest Payable (or Interest Expense) of $156. The first column shows a table copied from an amortization table. While the interest payments are always the same, the interest portion is declining over time while the principle portion is increasing. The Interest Payable for the first year shows the interest getting very small by the end of the first year. The total Interest Expense (I use “expense” and “payable” interchangeably) is $157. The summary shows the relationships between Interest, Notes Payable, and loan payments. In year one, the Notes Payable is smaller than in year two, yet the Interest Expense is higher. In other words, while the cash outlay will be exactly the same in year one as year two, the impact on the P&L will be larger in the first year (Interest Expense drops from $157 to $57), and the Balance Sheet the second year (the Notes Payable increases from $1,200 to $1,300).
2 See the attached Excel amortization table to play around with these.
Solventurer Creating Your Financial Projections for Your Business Plan
© Solventurer –All Rights Reserved 27
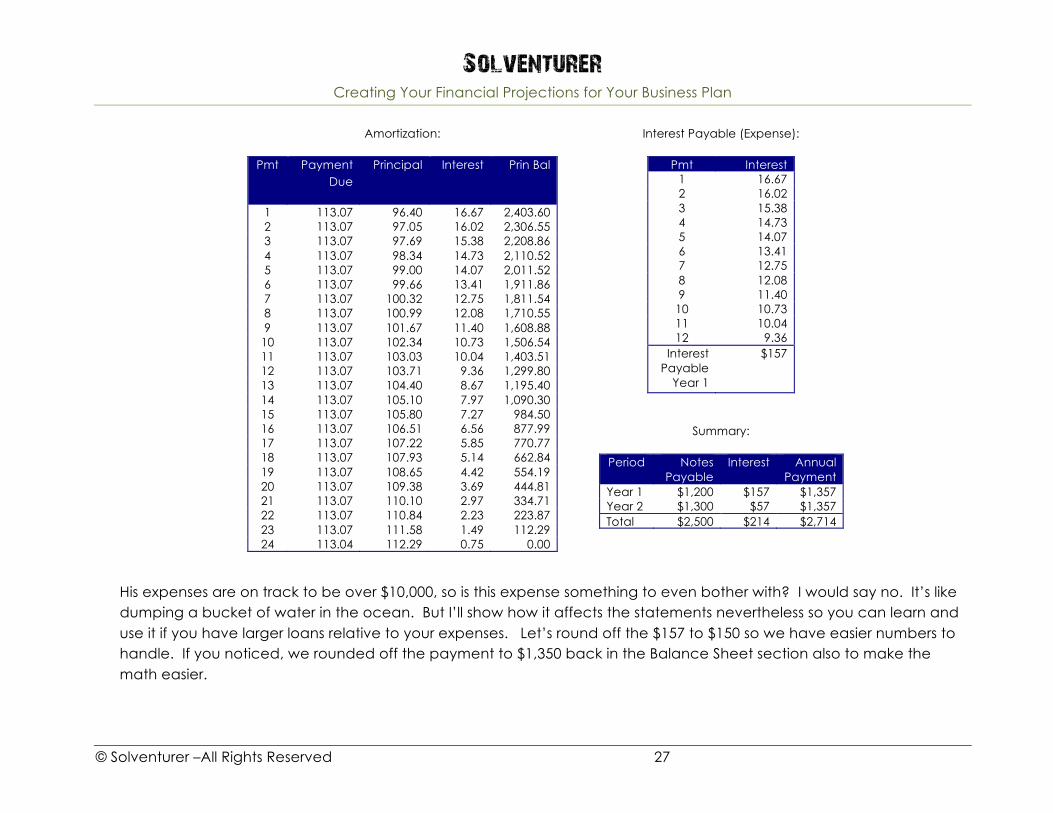
Amortization:
Pmt Payment Due
Principal Interest Prin Bal
1 113.07 96.40 16.67 2,403.60 2 113.07 97.05 16.02 2,306.55 3 113.07 97.69 15.38 2,208.86 4 113.07 98.34 14.73 2,110.52 5 113.07 99.00 14.07 2,011.52 6 113.07 99.66 13.41 1,911.86 7 113.07 100.32 12.75 1,811.54 8 113.07 100.99 12.08 1,710.55 9 113.07 101.67 11.40 1,608.88
10 113.07 102.34 10.73 1,506.54 11 113.07 103.03 10.04 1,403.51 12 113.07 103.71 9.36 1,299.80 13 113.07 104.40 8.67 1,195.40 14 113.07 105.10 7.97 1,090.30 15 113.07 105.80 7.27 984.50 16 113.07 106.51 6.56 877.99 17 113.07 107.22 5.85 770.77 18 113.07 107.93 5.14 662.84 19 113.07 108.65 4.42 554.19 20 113.07 109.38 3.69 444.81 21 113.07 110.10 2.97 334.71 22 113.07 110.84 2.23 223.87 23 113.07 111.58 1.49 112.29 24 113.04 112.29 0.75 0.00
Interest Payable (Expense):
Pmt Interest 1 16.67 2 16.02 3 15.38 4 14.73 5 14.07 6 13.41 7 12.75 8 12.08 9 11.40
10 10.73 11 10.04 12 9.36
Interest Payable
Year 1
$157
Summary:
Period Notes Payable
Interest Annual Payment
Year 1 $1,200 $157 $1,357 Year 2 $1,300 $57 $1,357 Total $2,500 $214 $2,714
His expenses are on track to be over $10,000, so is this expense something to even bother with? I would say no. It’s like dumping a bucket of water in the ocean. But I’ll show how it affects the statements nevertheless so you can learn and use it if you have larger loans relative to your expenses. Let’s round off the $157 to $150 so we have easier numbers to handle. If you noticed, we rounded off the payment to $1,350 back in the Balance Sheet section also to make the math easier.
Solventurer Creating Your Financial Projections for Your Business Plan
© Solventurer –All Rights Reserved 28
P & L: Step A – Step D Income
Sales $4,000 Less Direct Costs $0
Gross Profit $4,000 Expenses
Rent $0 Utilities $0 Marketing $2,500 Owner Withdrawal $0 Interest Payable $150
Total Expenses $2,650
Net Income $1,350
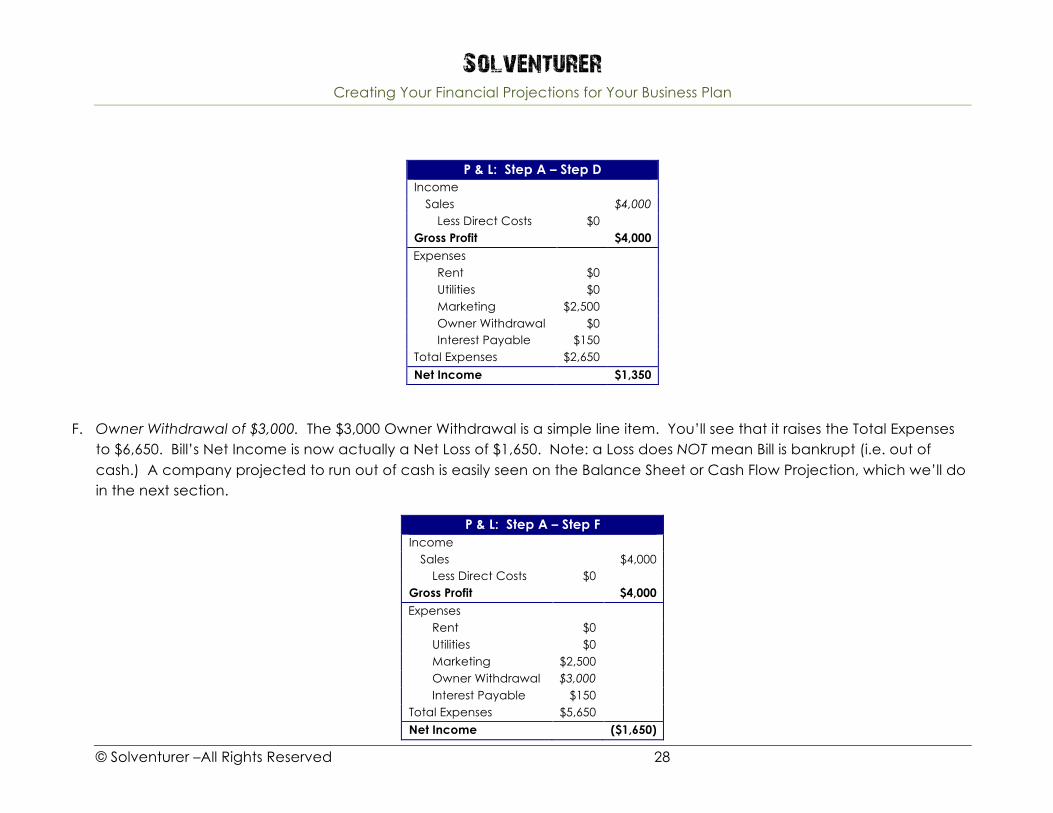
F. Owner Withdrawal of $3,000. The $3,000 Owner Withdrawal is a simple line item. You’ll see that it raises the Total Expenses to $6,650. Bill’s Net Income is now actually a Net Loss of $1,650. Note: a Loss does NOT mean Bill is bankrupt (i.e. out of cash.) A company projected to run out of cash is easily seen on the Balance Sheet or Cash Flow Projection, which we’ll do in the next section.
P & L: Step A – Step F Income
Sales $4,000 Less Direct Costs $0
Gross Profit $4,000 Expenses
Rent $0 Utilities $0 Marketing $2,500 Owner Withdrawal $3,000 Interest Payable $150
Total Expenses $5,650 Net Income ($1,650)

Solventurer Creating Your Financial Projections for Your Business Plan
© Solventurer –All Rights Reserved 29
G. Pay Rent $1,000, Utilities $1,000. Simple.
P & L: Step A – Step G Income
Sales $4,000 Less Direct Costs $0
Gross Profit $4,000 Expenses
Rent $1,000 Utilities $1,000 Marketing $2,500 Owner Withdrawal $3,000 Interest Payable $150
Total Expenses $7,650
Net Income ($3,650)
H. Marketing Campaign #2 of $2,000. Total Marketing Expense is $4,500 now. Bill is digging a big Loss at this point. If this was
a real chronology of a future business, I would be concerned.
P & L: Step A – Step H Income
Sales $4,000 Less Direct Costs $0
Gross Profit $4,000 Expenses
Rent $1,000 Utilities $1,000 Marketing $4,500 Owner Withdrawal $3,000 Interest Payable $150
Total Expenses $9,650
Net Income ($5,650)

Solventurer Creating Your Financial Projections for Your Business Plan
© Solventurer –All Rights Reserved 30
I. Sales of $8,000. Finally, Income! $8,000 helps Bill’s Net Income climb out of the red.
P & L: Step A – Step J Income
Sales $12,000 Less Direct Costs $0
Gross Profit $12,000 Expenses
Rent $1,000 Utilities $1,000 Marketing $4,500 Owner Withdrawal $3,000 Interest Payable $150
Total Expenses $9,650
Net Income $2,350
J. Owner Withdrawal—this time it’s $500, bringing the Net Income to $1,850.
P & L: Step A – Step J Income
Sales $12,000 Less Direct Costs $0
Gross Profit $12,000 Expenses
Rent $1,000 Utilities $1,000 Marketing $4,500 Owner Withdrawal $3,500 Interest Payable $150
Total Expenses $10,150
Net Income $1,850
Solventurer Creating Your Financial Projections for Your Business Plan
© Solventurer –All Rights Reserved 31
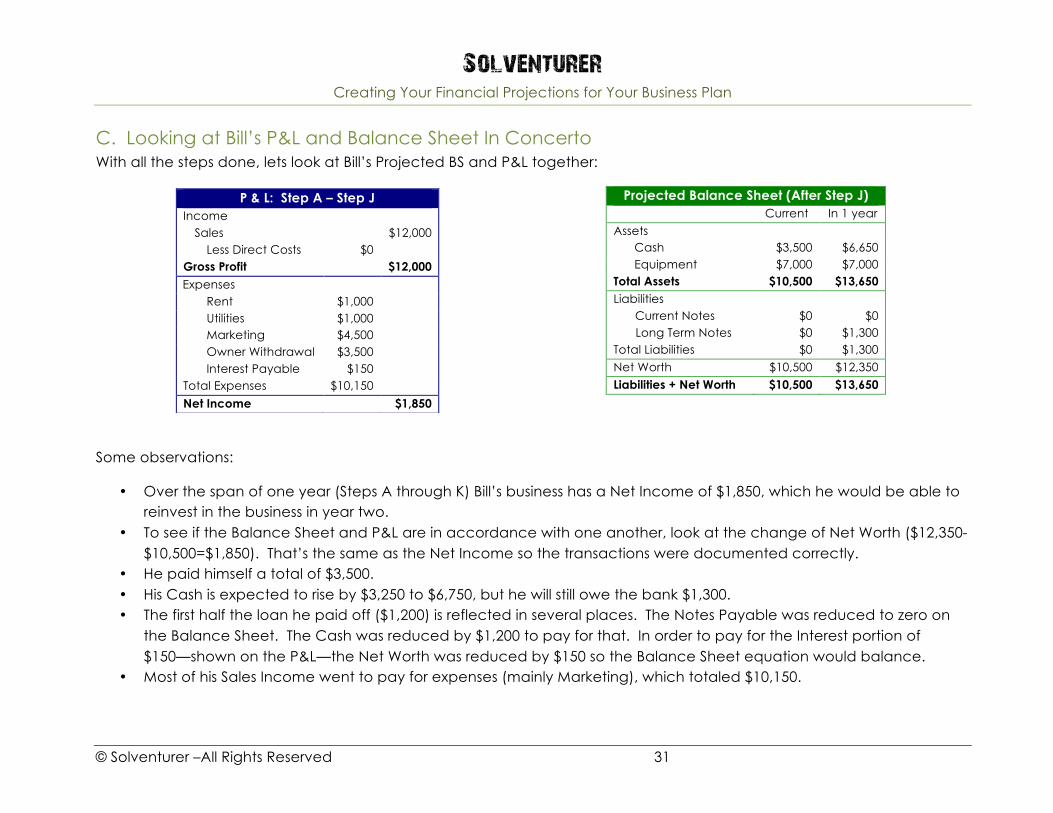
C. Looking at Bill’s P&L and Balance Sheet In Concerto With all the steps done, lets look at Bill’s Projected BS and P&L together:
P & L: Step A – Step J Income
Sales $12,000 Less Direct Costs $0
Gross Profit $12,000 Expenses
Rent $1,000 Utilities $1,000 Marketing $4,500 Owner Withdrawal $3,500 Interest Payable $150
Total Expenses $10,150
Net Income $1,850
Projected Balance Sheet (After Step J) Current In 1 year
Assets Cash $3,500 $6,650 Equipment $7,000 $7,000
Total Assets $10,500 $13,650 Liabilities
Current Notes $0 $0 Long Term Notes $0 $1,300
Total Liabilities $0 $1,300 Net Worth $10,500 $12,350 Liabilities + Net Worth $10,500 $13,650
Some observations:
• Over the span of one year (Steps A through K) Bill’s business has a Net Income of $1,850, which he would be able to reinvest in the business in year two.
• To see if the Balance Sheet and P&L are in accordance with one another, look at the change of Net Worth ($12,350-$10,500=$1,850). That’s the same as the Net Income so the transactions were documented correctly.
• He paid himself a total of $3,500. • His Cash is expected to rise by $3,250 to $6,750, but he will still owe the bank $1,300. • The first half the loan he paid off ($1,200) is reflected in several places. The Notes Payable was reduced to zero on
the Balance Sheet. The Cash was reduced by $1,200 to pay for that. In order to pay for the Interest portion of $150—shown on the P&L—the Net Worth was reduced by $150 so the Balance Sheet equation would balance.
• Most of his Sales Income went to pay for expenses (mainly Marketing), which totaled $10,150.

Solventurer Creating Your Financial Projections for Your Business Plan
© Solventurer –All Rights Reserved 32
Before we move to the Cash Flow, I wanted to show a few more complex transactions that a Client Focused Solopreneur comes across regularly.
Solventurer Creating Your Financial Projections for Your Business Plan
© Solventurer –All Rights Reserved 33
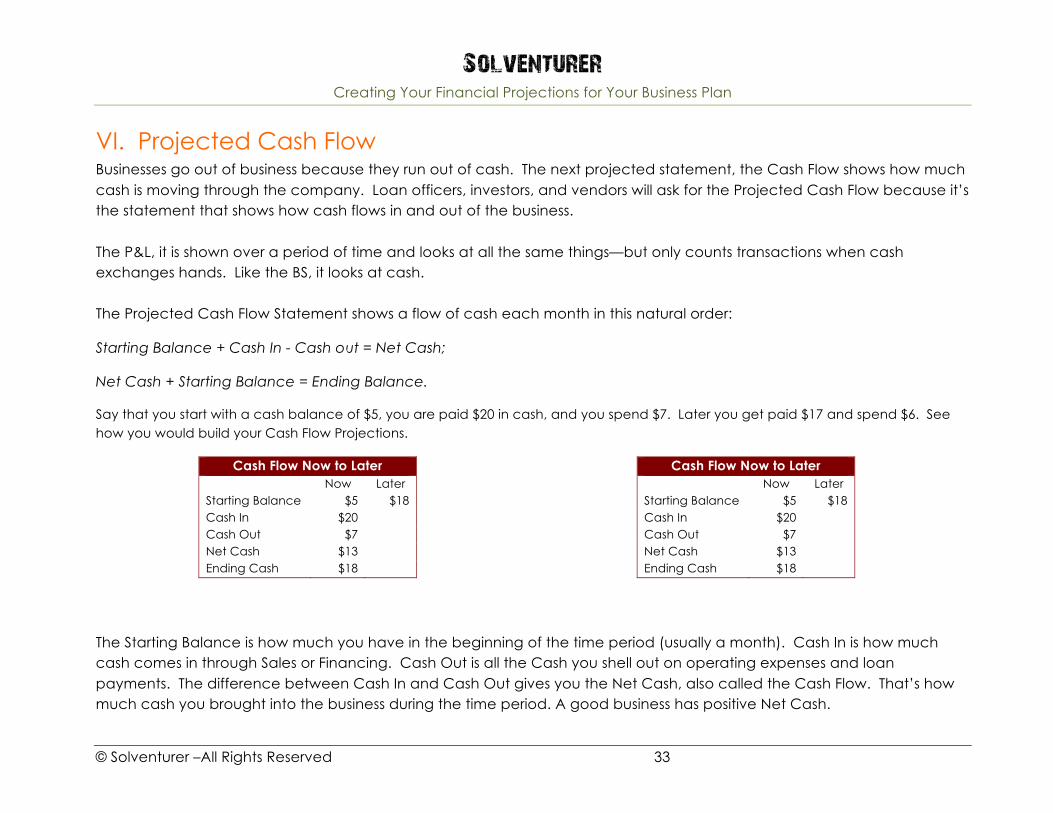
VI. Projected Cash Flow
Businesses go out of business because they run out of cash. The next projected statement, the Cash Flow shows how much cash is moving through the company. Loan officers, investors, and vendors will ask for the Projected Cash Flow because it’s the statement that shows how cash flows in and out of the business. The P&L, it is shown over a period of time and looks at all the same things—but only counts transactions when cash exchanges hands. Like the BS, it looks at cash. The Projected Cash Flow Statement shows a flow of cash each month in this natural order:
Starting Balance + Cash In - Cash out = Net Cash;
Net Cash + Starting Balance = Ending Balance.
Say that you start with a cash balance of $5, you are paid $20 in cash, and you spend $7. Later you get paid $17 and spend $6. See how you would build your Cash Flow Projections.
Cash Flow Now to Later Now Later Starting Balance $5 $18 Cash In $20 Cash Out $7 Net Cash $13 Ending Cash $18
Cash Flow Now to Later Now Later Starting Balance $5 $18 Cash In $20 Cash Out $7 Net Cash $13 Ending Cash $18
The Starting Balance is how much you have in the beginning of the time period (usually a month). Cash In is how much cash comes in through Sales or Financing. Cash Out is all the Cash you shell out on operating expenses and loan payments. The difference between Cash In and Cash Out gives you the Net Cash, also called the Cash Flow. That’s how much cash you brought into the business during the time period. A good business has positive Net Cash.
Solventurer Creating Your Financial Projections for Your Business Plan
© Solventurer –All Rights Reserved 34
Ending Cash is your cash position at the end of the month; you simply add the Net Cash to the Starting Balance. The last step is to carry the Ending Cash line item and use it for the Starting Balance of the next time period.
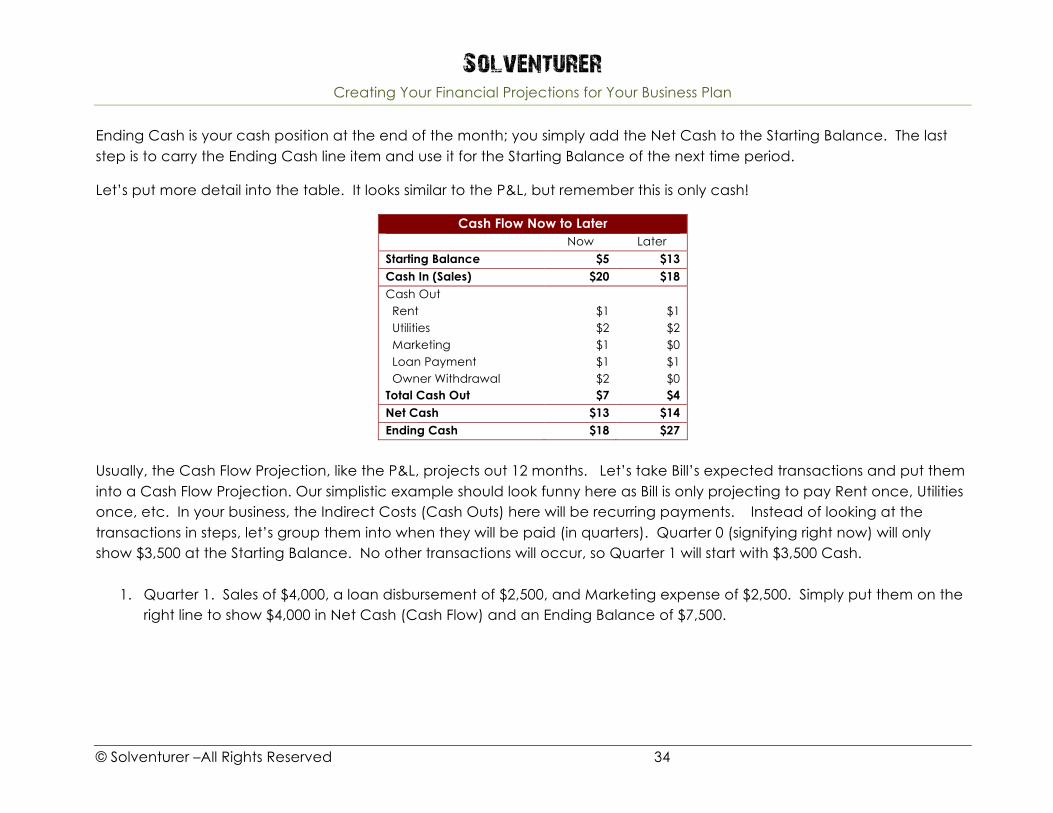
Let’s put more detail into the table. It looks similar to the P&L, but remember this is only cash!
Cash Flow Now to Later Now Later Starting Balance $5 $13 Cash In (Sales) $20 $18 Cash Out Rent $1 $1 Utilities $2 $2 Marketing $1 $0 Loan Payment $1 $1 Owner Withdrawal $2 $0 Total Cash Out $7 $4 Net Cash $13 $14 Ending Cash $18 $27
Usually, the Cash Flow Projection, like the P&L, projects out 12 months. Let’s take Bill’s expected transactions and put them into a Cash Flow Projection. Our simplistic example should look funny here as Bill is only projecting to pay Rent once, Utilities once, etc. In your business, the Indirect Costs (Cash Outs) here will be recurring payments. Instead of looking at the transactions in steps, let’s group them into when they will be paid (in quarters). Quarter 0 (signifying right now) will only show $3,500 at the Starting Balance. No other transactions will occur, so Quarter 1 will start with $3,500 Cash.
1. Quarter 1. Sales of $4,000, a loan disbursement of $2,500, and Marketing expense of $2,500. Simply put them on the
right line to show $4,000 in Net Cash (Cash Flow) and an Ending Balance of $7,500.

Solventurer Creating Your Financial Projections for Your Business Plan
© Solventurer –All Rights Reserved 35
Cash Flow for 12 Months Quarter 0 1 2 3 4 Total
Starting Balance $3,500 $3,500 $7,500 Cash In Sales $4,000 Receive Loan $2,500 Total Cash In $0 $6,500 Cash Out Rent Utilities Marketing $2,500 Loan Payment Owner Withdrawal
Total Cash Out $0 $2,500 Net Cash $0 $4,000 Ending Cash $3,500 $7,500
2. Quarter 2. Rent and Utilities each $1,000, a Loan Payment of $1,350, and an Owner Withdrawal of $3,000. Note the projected huge amount of cash leaving the business in the second quarter. The Ending Balance is low at $1,250.
Cash Flow for 12 Months Quarter 0 1 2 3 4 total
Starting Balance $3,500 $3,500 $7,500 $1,150 Cash In Sales $4,000 Receive Loan $2,500 Total Cash In $0 $6,500 $0 Cash Out Rent $1,000 Utilities $1,000 Marketing $2,500 Loan Payment $1,350 Owner Withdrawal $3,000

Solventurer Creating Your Financial Projections for Your Business Plan
© Solventurer –All Rights Reserved 36
Total Cash Out $0 $2,500 $6,350 Net Cash $0 $4,000 -$6,350 Ending Cash $3,500 $7,500 $1,150
3. Quarter 3. A marketing expense of $2,000 and Sales of $6,000 helps the cash position.
Cash Flow for 12 Months Quarter 0 1 2 3 4 total
Starting Balance $3,500 $3,500 $7,500 $1,150 $7,150 Cash In Sales $4,000 $8,000 Receive Loan $2,500 Total Cash In $0 $6,500 $0 $8,000 Cash Out Rent $1,000 Utilities $1,000 Marketing $2,500 $2,000 Loan Payment $1,350 Owner Withdrawal $3,000 Total Cash Out $0 $2,500 $6,350 $2,000 Net Cash $0 $4,000 -$6,350 $6,000 Ending Cash $3,500 $7,500 $1,150 $7,150
4. Quarter 4. Owner Withdrawal of $500 along with the completed Cash Flow Projection.

Solventurer Creating Your Financial Projections for Your Business Plan
© Solventurer –All Rights Reserved 37
Cash Flow for 12 Months Quarter 0 1 2 3 4 Total
Starting Balance $3,500 $3,500 $7,500 $1,150 $7,150 Cash In Sales $4,000 $8,000 $10,000 Receive Loan $2,500 $2,500 Total Cash In $0 $6,500 $0 $8,000 $0 $12,500 Cash Out Rent $1,000 $1,000 Utilities $1,000 $1,000 Marketing $2,500 $2,000 $4,500 Loan Payment $1,350 $1,350 Owner Withdrawal $3,000 $500 $3,500 Total Cash Out $0 $2,500 $6,350 $2,000 $500 $11,350 Net Cash $0 $4,000 -$6,350 $6,000 -$500 $3,150 Ending Cash $3,500 $7,500 $1,150 $7,150 $4,750
Observations: Bill’s business is expected to generate $3,250 over the first year, a meager amount for a business that had so much activity. While this example was created not to show a realistic business starting (paying rent only in a single quarter, the loan in a single quarter, sales in a single quarter, etc.), you would have to be alarmed if you saw this little cash generated! The other item I would look at is the Ending Cash balance of each quarter. Each quarter ends with a good amount of cash in the bank except for quarter 2.

Solventurer Creating Your Financial Projections for Your Business Plan
© Solventurer –All Rights Reserved 38
VII. Putting the Projections Together Before we move onto the other more complex transactions, let’s go over how all the statements balance.
P & L: Step A – Step J Income
Sales $12,000 Less Direct Costs $0
Gross Profit $12,000 Expenses
Rent $1,000 Utilities $1,000 Marketing $4,500 Owner Withdrawal $3,500 Interest Payable $150
Total Expenses $10,150
Net Income $1,850
Projected Balance Sheet (After Step J) Current In 1 year
Assets Cash $3,500 $6,650 Equipment $7,000 $7,000
Total Assets $10,500 $13,650 Liabilities
Current Notes $0 $0 Long Term Notes $0 $1,300
Total Liabilities $0 $1,300 Net Worth $10,500 $12,350 Liabilities + Net Worth $10,500 $13,650
Cash Flow to Step J
Quarter 0 1 2 3 4 Total Starting Balance $3,500 $3,500 $7,500 $1,150 $7,150 Cash In Sales $4,000 $8,000 $12,000 Receive Loan $2,500 $2,500 Total Cash In $0 $6,500 $0 $8,000 $0 $14,500 Cash Out Rent $1,000 $1,000 Utilities $1,000 $1,000 Marketing $2,500 $2,000 $4,500 Loan Payment $1,350 $1,350 Owner Withdrawal $3,000 $500 $3,500 Total Cash Out $0 $2,500 $6,350 $2,000 $500 $11,350 Net Cash $0 $4,000 -$6,350 $6,000 -$500 $3,150 Ending Cash $3,500 $7,500 $1,150 $7,150 $6,650

Solventurer Creating Your Financial Projections for Your Business Plan
© Solventurer –All Rights Reserved 39
The 3 ways that they work together: • Total Net Cash (Cash Flow), $3,150, equals the change in Bill’s Cash on the Balance Sheet: his Cash increases from
$3,500 to $6,650. • The Net Income (P&L) equals his change of Net Worth ($1,850). • The Cash position (BS) is the same as the Starting and Ending balance on the Cash Flow Projection. Check: Start =
$3,500, End = $6,650.

Solventurer Creating Your Financial Projections for Your Business Plan
© Solventurer –All Rights Reserved 40
VIII. Complex Transactions That You Will Use We just flew through some simple future transactions. This doesn’t give any detail, and our business—the consulting, professional services, and coaching professions—need to consider a few more transactions highly important for our business financials. These transactions are: Depreciation, Accounts Receivable and Payable, and Uncollectible Accounts.
As usual, let’s teach through building upon Bill’s example. Here are 4 more transactions he will want to incorporate into his accounts:
K. Sales of $4,000, half paid in cash and half later L. Subcontractor does work for Bill who will pay $1,000 later M. A line item showing 10% of Account Receivables that won’t be uncollected N. Bill will depreciate his equipment
Let’s start by defining Accounts Receivable and Payables so we can understand Step K.
To this point, we have assumed that all payments and sales income have been cash. In other words, when we show that there is Sales in the P&L, we have assumed that cash was received. Unfortunately, this is usually not the case for Client-Focused Solopreneurs. As consulting and service professionals, most of us will not be paid entire payments at once. A common example is when we are paid half now, and the other half at the end of the project. While we record the entire transaction as Sales Income (on the P&L) we are not receiving all the income in cash (or credit card, check, etc.). We have some separate accounts (line items) on the Balance Sheet to show this. On the Balance Sheet, an Account Receivable is considered an Asset. It is money owed to us! You can list it right under the Equipment line. An Accounts Payable is a Current Liability—money we owe to others within the year. You can list it right under the Current Notes Payable line. The P&L will never distinguish between cash or a promised payment in the future. This promise is called an Accounts Receivable. It indicates money that is owed to us for work that has been done. Accounts Payable shows money that we owe others for service rendered for us.
Solventurer Creating Your Financial Projections for Your Business Plan
© Solventurer –All Rights Reserved 41
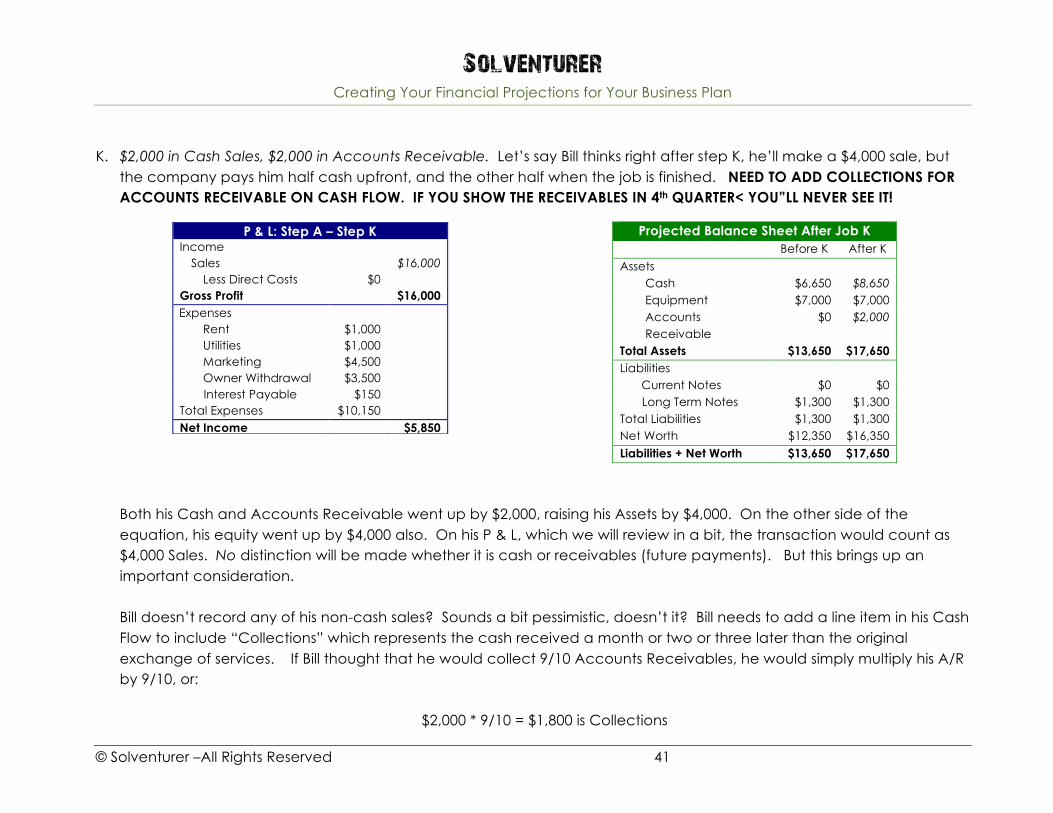
K. $2,000 in Cash Sales, $2,000 in Accounts Receivable. Let’s say Bill thinks right after step K, he’ll make a $4,000 sale, but
the company pays him half cash upfront, and the other half when the job is finished. NEED TO ADD COLLECTIONS FOR ACCOUNTS RECEIVABLE ON CASH FLOW. IF YOU SHOW THE RECEIVABLES IN 4th QUARTER< YOU”LL NEVER SEE IT!
P & L: Step A – Step K
Income Sales $16,000
Less Direct Costs $0 Gross Profit $16,000 Expenses
Rent $1,000 Utilities $1,000 Marketing $4,500 Owner Withdrawal $3,500 Interest Payable $150
Total Expenses $10,150 Net Income $5,850
Projected Balance Sheet After Job K Before K After K Assets
Cash $6,650 $8,650 Equipment $7,000 $7,000 Accounts Receivable
$0 $2,000
Total Assets $13,650 $17,650 Liabilities
Current Notes $0 $0 Long Term Notes $1,300 $1,300
Total Liabilities $1,300 $1,300 Net Worth $12,350 $16,350 Liabilities + Net Worth $13,650 $17,650
Both his Cash and Accounts Receivable went up by $2,000, raising his Assets by $4,000. On the other side of the equation, his equity went up by $4,000 also. On his P & L, which we will review in a bit, the transaction would count as $4,000 Sales. No distinction will be made whether it is cash or receivables (future payments). But this brings up an important consideration. Bill doesn’t record any of his non-cash sales? Sounds a bit pessimistic, doesn’t it? Bill needs to add a line item in his Cash Flow to include “Collections” which represents the cash received a month or two or three later than the original exchange of services. If Bill thought that he would collect 9/10 Accounts Receivables, he would simply multiply his A/R by 9/10, or:
$2,000 * 9/10 = $1,800 is Collections
Solventurer Creating Your Financial Projections for Your Business Plan
© Solventurer –All Rights Reserved 42
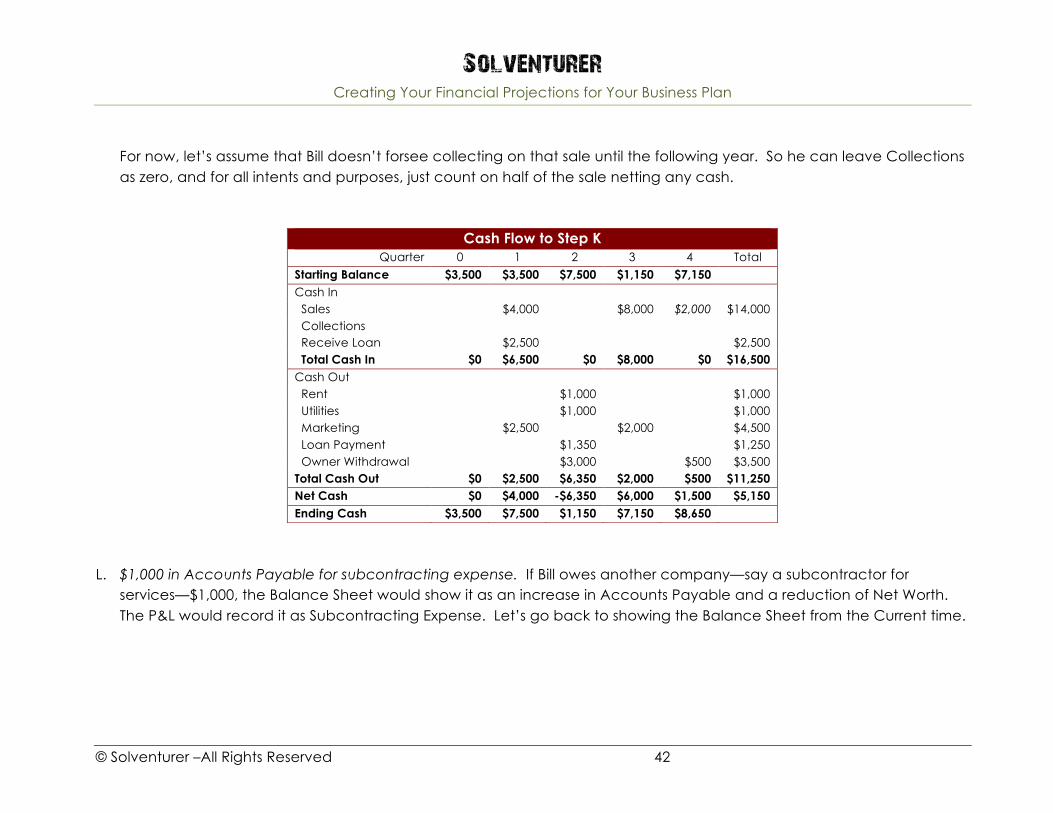
For now, let’s assume that Bill doesn’t forsee collecting on that sale until the following year. So he can leave Collections as zero, and for all intents and purposes, just count on half of the sale netting any cash.
Cash Flow to Step K Quarter 0 1 2 3 4 Total
Starting Balance $3,500 $3,500 $7,500 $1,150 $7,150 Cash In Sales $4,000 $8,000 $2,000 $14,000 Collections Receive Loan $2,500 $2,500 Total Cash In $0 $6,500 $0 $8,000 $0 $16,500 Cash Out Rent $1,000 $1,000 Utilities $1,000 $1,000 Marketing $2,500 $2,000 $4,500 Loan Payment $1,350 $1,250 Owner Withdrawal $3,000 $500 $3,500 Total Cash Out $0 $2,500 $6,350 $2,000 $500 $11,250 Net Cash $0 $4,000 -$6,350 $6,000 $1,500 $5,150 Ending Cash $3,500 $7,500 $1,150 $7,150 $8,650
L. $1,000 in Accounts Payable for subcontracting expense. If Bill owes another company—say a subcontractor for
services—$1,000, the Balance Sheet would show it as an increase in Accounts Payable and a reduction of Net Worth. The P&L would record it as Subcontracting Expense. Let’s go back to showing the Balance Sheet from the Current time.

Solventurer Creating Your Financial Projections for Your Business Plan
© Solventurer –All Rights Reserved 43
P & L: Step A – Step L
Income Sales $16,000
Less Direct Costs $0 Gross Profit $16,000 Expenses
Rent $1,000 Utilities $1,000 Marketing $4,500 Owner Withdrawal $3,500 Interest Payable $150 Subcontracting $1,000
Total Expenses $11,150 Net Income $4,850
Projected Balance Sheet after Step L Current After L
Assets Cash $3,500 $8,650 Equipment $7,000 $7,000 Accounts Receivable $0 $2,000
Total Assets $10,500 $17,650 Liabilities
Current Notes $0 $0 Accounts Payable $0 $1,000 Long Term Notes $0 $1,300
Total Liabilities $0 $2,300 Net Worth $10,500 $15,350 Liabilities + Net Worth $10,500 $17,650
Now let’s move to Uncollectible Accounts. This is a little more mechanical, but it isn’t difficult. With quick turnaround services like an auto mechanic, cash payments will be immediate. But if you’re in any kind of business where a service is performed before it is paid for, you need to assume some customers won’t pay you—either from dissatisfaction, financial distress, or personalities. Each business tends to have a good rule of thumb of what percentage of Sales they deem to be uncollectible and budget accordingly. This is important for your projections because if you’re assuming that you’ll pocket all your Sales and you lose a fifth of them because people don’t pay you, your projections are going to be as good as worthless.
M. 10% Uncollectible Accounts. Bill thinks of his Accounts Receivable, 10% will be uncollectible. He will have to show this
on both the Profit & Loss and Balance Sheet. For the P&L, he will create an expense called, Bad Debts. On the BS, you will create an item called Uncollectibles. They are the exact number on each statement that estimates how much of the Receivables that won’t ever be collected. Bill assumes that 10% of his Receivables won’t be collected so he does a quick calculation of:
10% * $2,000 = $200

Solventurer Creating Your Financial Projections for Your Business Plan
© Solventurer –All Rights Reserved 44
$200 is estimated to be uncollectible. Bills puts that number on each statement as shown below.
P & L: Step A – Step M Income
Sales $16,000 Less Direct Costs $0
Gross Profit $16,000 Expenses
Rent $1,000 Utilities $1,000 Marketing $4,500 Owner Withdrawal $3,500 Interest Payable $150 Subcontracting $1,000 Bad Debts $200
Total Expenses $11,350 Net Income $4,650
Projected Balance Sheet After Step M Current After M Assets
Cash $3,500 $8,650 Equipment $7,000 $7,000 Accounts Receivable $0 $2,000 Uncollectible @ 10% $0 -$200
Total Assets $10,500 $17,450 Liabilities
Current Notes $0 $0 Accounts Payable $0 $1,000 Long Term Notes $0 $1,300
Total Liabilities $0 $2,300 Net Worth $10,500 $15,150 Liabilities + Net Worth $10,500 $17,450
This process of adjusting entries is much more difficult for “real-time” or historical accounting, but for pro forma statements, it is really that easy. Finally, the secrets of Depreciation will be revealed.
N. Depreciate equipment over 5 years with no Salvage Value at the end. Over time, equipment ages and loses value
through wear & tear, technologically obsolescence, and breakage. Depreciation is an accounting method to account for this aging by “charging” the business a non-cash expense to equipment over a period of years until the equipment is worth a salvage value—or ending value. Because it’s a non-cash expense, you aren’t spending cash but simply documenting the asset’s value. As you know now, the Balance Sheet and Profit & Loss are joined at the hip so you can’t just reduce the value of the equipment on the Balance Sheet. First, you have to make an expense on the P&L. Depreciation affects your P&L (as an Expense) and Balance Sheet (your Equipment Asset will be getting smaller each month).

Solventurer Creating Your Financial Projections for Your Business Plan
© Solventurer –All Rights Reserved 45
To figure out depreciation, you need to create a few assumptions before you can get the Depreciation Expense number. First, decide the period in years that you will depreciate the equipment over. Next, determine the Salvage Value. This is the equipment’s worth at the end of the period. To arrive at your monthly Depreciation Expense, subtract the salvage value from the start value and then divide it by the number of years. You get the following equation:
Start Value - Salvage Value # Of Years
= Monthly Depreciation Expense
Bill decides his equipment will depreciate to zero value in five years. He considered how long his computer would actually have value, and he thinks that in five years, if he tried to sell it, he would get absolutely nothing for it because of the mileage he’ll put on it and how obsolete it will be. In five years, his equipment will be worth absolutely $0 on his Balance Sheet. So:
$7,000 - $0 5 years
= $1,400 /yr Depreciation Expense
In a narrative form, this is how his equipment will be depreciated over five years:
Time Starting Value
Depreciation Expense
Ending Value
Purchase $7,000 $0 $7,000 End of Year 1 $7,000 $1,400 $5,600 End of Year 2 $5,600 $1,400 $4,200 End of Year 3 $4,200 $1,400 $2,800 End of Year 4 $2,800 $1,400 $1,400 End of Year 5 $1,400 $1,400 $0

Solventurer Creating Your Financial Projections for Your Business Plan
© Solventurer –All Rights Reserved 46
Just because Bill is treating depreciation as an expense, he won’t be paying someone cash for the aging of his equipment. His assets are losing value; if he sells them a year from now, they will be worth much less than $7,000 because they have been depreciated.
On Bill’s P&L, the Depreciation Expense is actually going to be $1,400 and the Accumulated Depreciation will be also be $1,400 because it is only at the end of year 1. If it were the end of year 2, the expense would again be $1,400 but the Accumulated would be $2,800. Bill has prepares his projections quarterly and so should calculates his depreciation quarterly. To do that he would divide $1,400 by 4, or $350 per quarter. But he simplifies for all of our sakes and waits to show the depreciation until Quarter 4.
To make these projections, Bill creates a line item on the P&L called “Depreciation Expense”. Then he adds an “Accumulated Depreciation” line on the Balance Sheet that will show how much has accumulated over the lifetime of the asset. By subtracting that and the Equipment, Bill will get the purchase value. Remember, no cash changes in Depreciation!
P & L: Step A – Step O Income
Sales $16,000 Less Direct Costs $0
Gross Profit $16,000 Expenses
Rent $1,000 Utilities $1,000 Marketing $4,500 Owner Withdrawal (withdrawal)
$3,500 Interest Payable $150 Subcontracting $1,000 Bad Debts $200 Depreciation $1,400
Total Expenses $12,750 Net Income $3,250
Projected Balance Sheet After Step N Current After N Assets
Cash $3,500 $8,650 Equipment $7,000 $7,000
Accum. Depreciation $0 -$1,400 Accounts Receivable $0 $2,000 Uncollectible @ 10% $0 -$200
Total Assets $10,500 $16,050 Liabilities
Current Notes $0 $0 Accounts Payable $0 $1,000 Long Term Notes $0 $1,300
Total Liabilities $0 $2,300 Net Worth $10,500 $13,750 Liabilities + Net Worth $10,500 $16,050

Solventurer Creating Your Financial Projections for Your Business Plan
© Solventurer –All Rights Reserved 47
Let’s go over how the transactions will affect the Cash Flow now.
K. $2,000 cash and $2,000 Accounts Payable in Quarter 4. Bill will only show the $2,000 Cash here. The future payment isn’t placed on the CF!
K. Accounts Payable for $1,000. Nothing goes on the Cash Flow as it’s not cash.
L. 10% Uncollectible Account Receivables. This won’t go on it either, because it has to do with Accounts Receivables
(not cash!) M. Depreciation. As we mentioned, Depreciation is a non-cash expense with the sole purpose of bringing asset value
down to reflect its wear or technological irrelevance. It won’t be on the Cash Flow Projection. So after Step N, the Cash Flow remains unchanged.

Solventurer Creating Your Financial Projections for Your Business Plan
© Solventurer –All Rights Reserved 48
IX. Putting the Projections Together (V 2.0) Looking at the projections they do work together and tell a story. Final step is to see if everything checks out and they balance.
1. Does the Total Cash Flow equal the change of Bill’s Cash on his Balance Sheet? Yes. Net Cash is $5,150, the same as $8,650-$3,500.
2. The Change in Net Worth (BS) equal to Net Income? Yes. The change in Net Income (called Retained Earnings in finance) from now to the end of year one is predicted to be $3,250, the same as the Net Income.
3. The Cash Flow’s start and end balances are the same as those on the BS.
P & L: Step A – Step N Income
Sales $16,000 Less Direct Costs $0
Gross Profit $16,000 Expenses
Rent $1,000 Utilities $1,000 Marketing $4,500 Owner Withdrawal (withdrawal)
$3,500 Interest Payable $150 Subcontracting $1,000 Bad Debts $200 Depreciation $1,400
Total Expenses $12,750
Net Income $3,250
Projected Balance Sheet After Step N Current After N Assets
Cash $3,500 $8,650 Equipment $7,000 $7,000
Accum. Depreciation $0 -$1,400 Accounts Receivable $0 $2,000 Uncollectible @ 10% $0 -$200
Total Assets $10,500 $16,050 Liabilities
Current Notes $0 $0 Accounts Payable $0 $1,000 Long Term Notes $0 $1,300
Total Liabilities $0 $2,300 Net Worth $10,500 $13,750 Liabilities + Net Worth $10,500 $16,050

Solventurer Creating Your Financial Projections for Your Business Plan
© Solventurer –All Rights Reserved 49
Through Bill’s example, I explained the mechanics behind documenting future transactions on the Financial Projections. Obviously, you won’t be using the same process to construct yours—but you have to understand the concepts already presented.
Having understood how the transactions influence each of the “Big 3”, now let’s teach the correct process. The ideal process involves building projections through using trends, rather than isolated transactions.
Cash Flow to Step N Quarter 0 1 2 3 4 Total
Starting Balance $3,500 $3,500 $7,500 $1,150 $7,150 Cash In Sales $4,000 $8,000 $2,000 $14,000 Receive Loan $2,500 $2,500 Total Cash In $0 $6,500 $0 $8,000 $0 $16,500 Cash Out Rent $1,000 $1,000 Utilities $1,000 $1,000 Marketing $2,500 $2,000 $4,500 Loan Payment $1,350 $1,250 Owner Withdrawal $3,000 $500 $3,500 Total Cash Out $0 $2,500 $6,350 $2,000 $500 $11,250 Net Cash $0 $4,000 -$6,350 $6,000 $1,500 $5,150 Ending Cash $3,500 $7,500 $1,150 $7,150 $8,650

Solventurer Creating Your Financial Projections for Your Business Plan
© Solventurer –All Rights Reserved 50
X. Creating Your Financial Assumptions Up to this point, the course has been dedicated to showing you how future transactions are reflected on your projections. Now that we all know how these sheets are constructed, I’m going to show how to efficiently build the proformas. But you can’t just sit down and start putting numbers in the BS, P&L, and Cash Flow tables. You have to do a few more things to give you reliable projections.
I use a three-step process (the 3 C’s) in building financial projections, that begins with assumptions, then makes calculations, and finally takes the calculations and inserts them in the right statement. The steps are:
A. Crystal Ball. Write down what you think is going to happen. How many sales will you create, how much will marketing cost, how much do you need to borrow, etc. Rely on your business plan to say what is going to happen.
B. Calculate. Make the necessary calculations to create the numbers and decide how they’ll impact each statement. For instance, what will your loan payment be and how will that affect the BS, P&L, and Cash Flow?
C. Color. Fill in the three proforma statements with the numbers. Check to see if it balances.
The following order is how I create the assumptions:

Solventurer Creating Your Financial Projections for Your Business Plan
© Solventurer –All Rights Reserved 51
The 6 Steps To Do Before You Start Building Your Projections
The most critical number on your projections is also the hardest to gauge: your Sales. In addition to your Cash Sales projections, you will have to determine what part of your Sales will be on account (Account Receivables), and of these, what percentage of people do you think might not pay at all (your projected Bad Debt Expense).
Figuring out your marketing costs is also challenging. Unless you have been in this business for sometime before, your level of marketing expenditures will rise and fall with each campaign’s success throughout the year. In the beginning, you will be experimenting with your marketing to see what works and what doesn’t. Oftentimes, the marketing budget will be relatively high in our kind of business.
Most of the rest of the numbers are extremely easy to guess—that is, if you have to guess at all. If you know you will be paying $75 for Internet, there really isn’t that much guesswork.
1
2
3
4
5
6
Indirect Costs
Direct Costs
Sales
Mktg Costs
Startup Costs
Required Funding
Creating Your
Assumptions
Solventurer Creating Your Financial Projections for Your Business Plan
© Solventurer –All Rights Reserved 52
Your projections are based on experiences, research, interviews, and good old-fashioned educated guesses. Understand that you are not trying to get 100% accuracy here. That would be difficult because the market changes so quickly and your idea is always slightly changing. You simply want a certain level of confidence about your numbers before you go out and test them!
Most of your Indirect Costs (overhead) are extremely easy to forecast. These are your rent, utilities, insurance, etc. For the most part, these are only a phone call away to inquire about.
As for the process, you want to start by writing down your starting costs (Step 1), then look at where the money will come from (your financing, or Step 2). Marketing (Step 3) is next, followed by Sales (Step 4). As I mentioned, Sales is not straightforward because you’ll have to split up Cash Sales, Accounts Receivables, and your predicted Bad Debts/Uncollectibles. Then you’ll work through your Direct Costs—step 5—which shouldn’t be too high considering we are all client-focused service businesses. For Step 6, you will write down the final set of assumptions in Indirect Costs. They will include things like your typical overhead in addition to non-cash expenses like depreciation and loan payments. Once that process is finished, then you can begin taking these numbers and inserting them into the P&L, Cash Flow, and Balance Sheet.
Let’s look at Lilly’s Projections and work through this system. Lilly is starting a design business of some kind. I will leave out the details behind the numbers.

Solventurer Creating Your Financial Projections for Your Business Plan
© Solventurer –All Rights Reserved 53
XI. Crystal Ball I3 will start my business with the help of my $10,000 savings and a $15,000 bank loan (over 3 years at 7.25% interest). My startup costs are going to be $20,000 and I will invest heavily in marketing as ongoing cost. I will depreciate my equipment and pay off my loan as I expect to generate about $7,500 in Sales for each of the first few months while growing to $15,000 in Sales for the last few months of the year.
A. Required Funding
Sources of capital
Savings $10,000
Bank Loan $15,000
Total $20,000
B. Startup Costs
Startup costs
Equipment $5,000
Marketingt $5,000
Software $10,000
Total $20,000
3 The narrative is through the eyes of Lilly; when I am talking out of character, I’ll use parenthesis.

Solventurer Creating Your Financial Projections for Your Business Plan
© Solventurer –All Rights Reserved 54
t See Startup Marketing Cost breakdown in Step C.
C. Marketing Costs
I must break up Marketing into recurring costs and startup costs. Startup costs include things I will buy once, like business cards and website design. Recurring costs are marketing campaigns.
Marketing Costs Ongoing Cost per unit
Frequency Monthly Cost
Workshops $200 4Xmo $800
Levittown Small Biz Chronicle $500 4Xmo $2,000
Direct Mail $2000 In mo 1 & 6 n/a
Startup Marketing Costs
Business Cards $3,000
Blog Platform and Design $2,000
Total $5,000
D. Sales
Total Sales. My Sales Projections will start up with 5 jobs per month in the first quarter. They will grow to 8 for the next six months and then take another leap to 10 in the last quarter. The price per job will remain the same at $1,500 per job.

Solventurer Creating Your Financial Projections for Your Business Plan
© Solventurer –All Rights Reserved 55
Quarter Volume Price Total Sales
Quarter 1 5 jobs/month $1,500/job $7,500
Quarter 2 8 jobs/month $1,500/job $9,000
Quarter 3 8 jobs/month $1,500/job $12,000
Quarter 4 10 jobs/month $1,500/job $15,000
Cash Sales and Account Receivables. In terms of payment terms, I will ask for ¾ Cash upfront. The rest is recorded as an Accounts Receivable that is due in 30 days. I assume that 10% of all Receivables won’t be collected which needs to be calculated.
E. Direct Costs
Quarter Volume Cost Direct Costs
Quarter 1 5 jobs/month $200/job $1,000
Quarter 2 8 jobs/month $200/job $1,600
Quarter 3 8 jobs/month $200/job $1,600
Quarter 4 10 jobs/month $200/job $2,000
F. Indirect Costs
Solventurer Creating Your Financial Projections for Your Business Plan
© Solventurer –All Rights Reserved 56
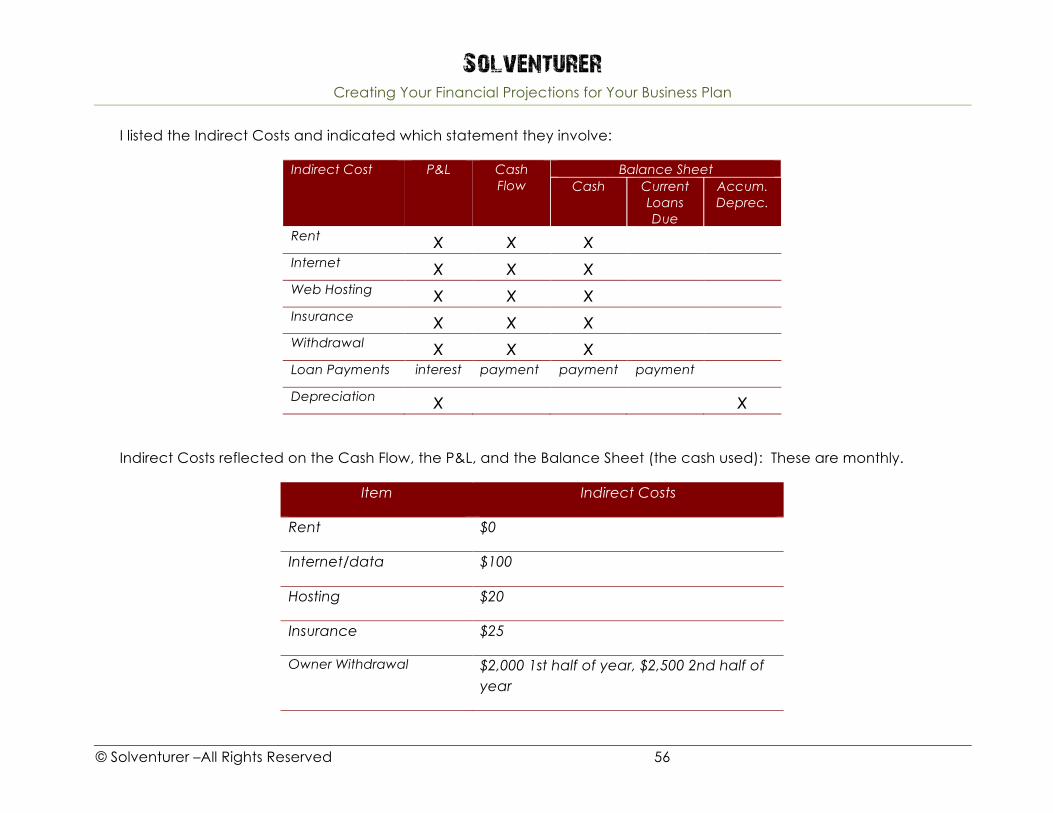
I listed the Indirect Costs and indicated which statement they involve:
Balance Sheet Indirect Cost P&L Cash Flow Cash Current
Loans Due
Accum. Deprec.
Rent x x x Internet x x x Web Hosting x x x Insurance x x x Withdrawal x x x Loan Payments interest payment payment payment Depreciation x x
Indirect Costs reflected on the Cash Flow, the P&L, and the Balance Sheet (the cash used): These are monthly.
Item Indirect Costs
Rent $0
Internet/data $100
Hosting $20
Insurance $25
Owner Withdrawal $2,000 1st half of year, $2,500 2nd half of year

Solventurer Creating Your Financial Projections for Your Business Plan
© Solventurer –All Rights Reserved 57
Loan Payment $15,000 @ 7.25% in 36 months =$465/month payment. I listed the amortization chart below.
Depreciation $15,000 equipment; Depreciated over 3 years w/ $3,000 Salvage Value gives $4,000 Depreciation Expense monthly and $4,000 Accumulated Depreciation for the year. See the table below to see explanation.
Loan Amortization for one year. (To see the entire three-year amortization, use the amortization calculator provided). Note how my Short Term Notes are $4,643, not simply 1/3 of $15,000, $5,000. This is because the “Notes Payable”, the amount in my Balance Sheet’s Liabilities, is only principle, not interest.
No. Due Date
Payment Due
Interest Principal Balance Short Term
Notes
Long Term
Notes
Interest Expense
Time
$15,000.00
1 3/2/14 464.87 90.63 374.24 14,625.76 4,643 10,357 n/a upon receipt of loan
2 4/2/14 464.87 88.36 376.51 14,249.25
3 5/2/14 464.87 86.09 378.78 13,870.47
4 6/2/14 464.87 83.80 381.07 13,489.40
5 7/2/14 464.87 81.50 383.37 13,106.03
6 8/2/14 464.87 79.18 385.69 12,720.34
7 9/2/14 464.87 76.85 388.02 12,332.32
8 10/2/14 464.87 74.51 390.36 11,941.96
9 11/2/14 464.87 72.15 392.72 11,549.24
10 12/2/14 464.87 69.78 395.09 11,154.15
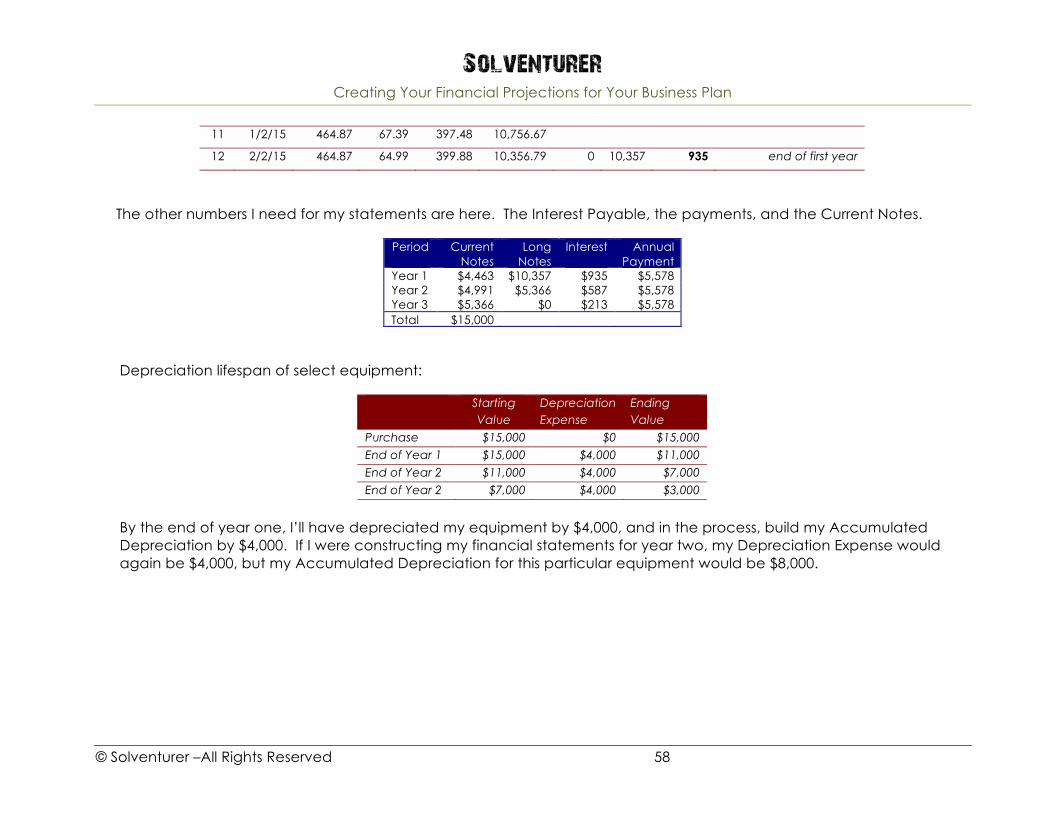
Solventurer Creating Your Financial Projections for Your Business Plan
© Solventurer –All Rights Reserved 58
11 1/2/15 464.87 67.39 397.48 10,756.67
12 2/2/15 464.87 64.99 399.88 10,356.79 0 10,357 935 end of first year
The other numbers I need for my statements are here. The Interest Payable, the payments, and the Current Notes.
Period Current Notes
Long Notes
Interest Annual Payment
Year 1 $4,463 $10,357 $935 $5,578 Year 2 $4,991 $5,366 $587 $5,578 Year 3 $5,366 $0 $213 $5,578 Total $15,000
Depreciation lifespan of select equipment:
Starting Value
Depreciation Expense
Ending Value
Purchase $15,000 $0 $15,000 End of Year 1 $15,000 $4,000 $11,000 End of Year 2 $11,000 $4,000 $7,000 End of Year 2 $7,000 $4,000 $3,000
By the end of year one, I’ll have depreciated my equipment by $4,000, and in the process, build my Accumulated Depreciation by $4,000. If I were constructing my financial statements for year two, my Depreciation Expense would again be $4,000, but my Accumulated Depreciation for this particular equipment would be $8,000.

Solventurer Creating Your Financial Projections for Your Business Plan
© Solventurer –All Rights Reserved 59
XII. Calculation A. Sources of Funding
I will use both savings and bank financing. For the $15,000 loan, I will be applying to local bank where interest rate is 7.25% and structured over 3 years. That will give me a monthly payment of $465, which will be discussed in Step F.
Balance Sheet
The loan amount of $15,000 will be on the Balance Sheet under Cash when disbursed. To balance the A=L+NW equation, the Liabilities will also be $15,000. Almost 1/3 of that ($4,643) will be Current Notes Payable (due this year), while the approximately 2/3 remaining ($10,357) will be listed as Long-Term Notes Payable. I obviously plan to pay the Current Notes, bringing the balance to $0. My $10,000 savings will contribute to the startup Cash also but will increase my Net Worth by $10,000.
P&L
My Savings invested in the company doesn’t change the P&L at all, which is used for operating income. The loan disbursement will be responsible for an Interest Expense of $935 over the year.
Cash Flow
My Cash Flow will be STARTED by the two lump sums of money—the loan and my savings. Every month, the Cash Flow will be affected by taking from that initial sum of money in addition to the $465 loan payment.
B. Startup Costs
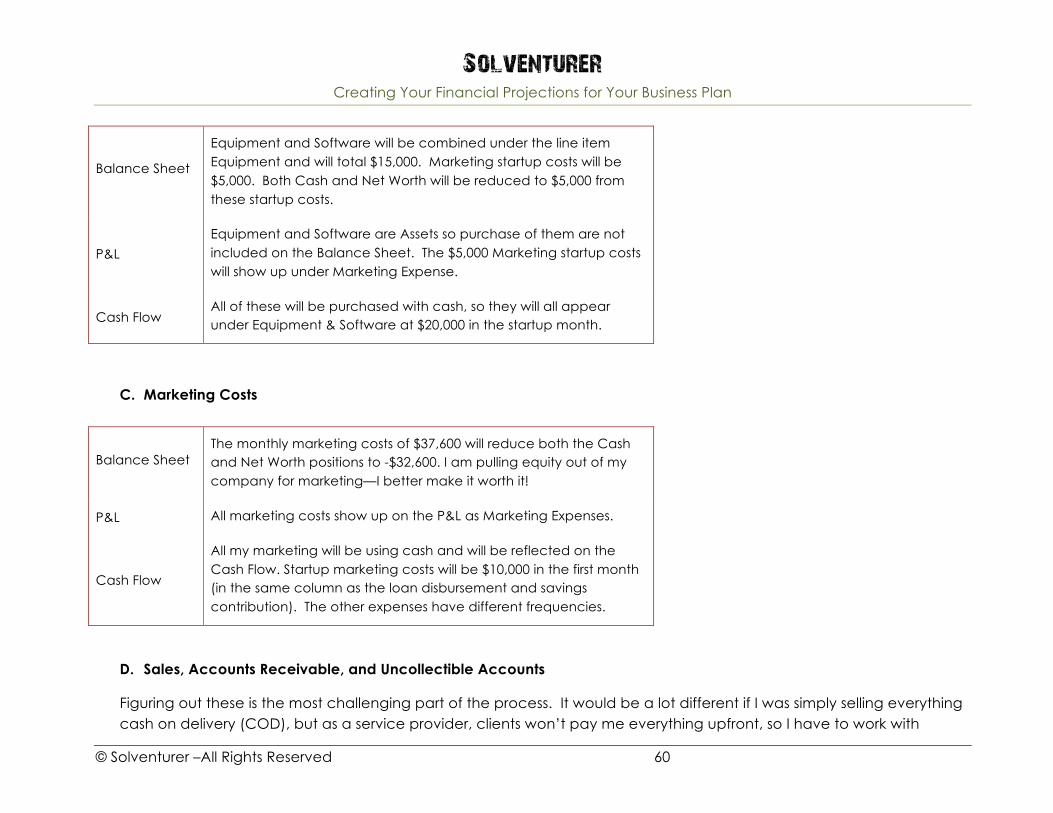
Solventurer Creating Your Financial Projections for Your Business Plan
© Solventurer –All Rights Reserved 60
Balance Sheet
Equipment and Software will be combined under the line item Equipment and will total $15,000. Marketing startup costs will be $5,000. Both Cash and Net Worth will be reduced to $5,000 from these startup costs.
P&L
Equipment and Software are Assets so purchase of them are not included on the Balance Sheet. The $5,000 Marketing startup costs will show up under Marketing Expense.
Cash Flow All of these will be purchased with cash, so they will all appear under Equipment & Software at $20,000 in the startup month.
C. Marketing Costs
Balance Sheet The monthly marketing costs of $37,600 will reduce both the Cash and Net Worth positions to -$32,600. I am pulling equity out of my company for marketing—I better make it worth it!
P&L All marketing costs show up on the P&L as Marketing Expenses.
Cash Flow
All my marketing will be using cash and will be reflected on the Cash Flow. Startup marketing costs will be $10,000 in the first month (in the same column as the loan disbursement and savings contribution). The other expenses have different frequencies.
D. Sales, Accounts Receivable, and Uncollectible Accounts
Figuring out these is the most challenging part of the process. It would be a lot different if I was simply selling everything cash on delivery (COD), but as a service provider, clients won’t pay me everything upfront, so I have to work with
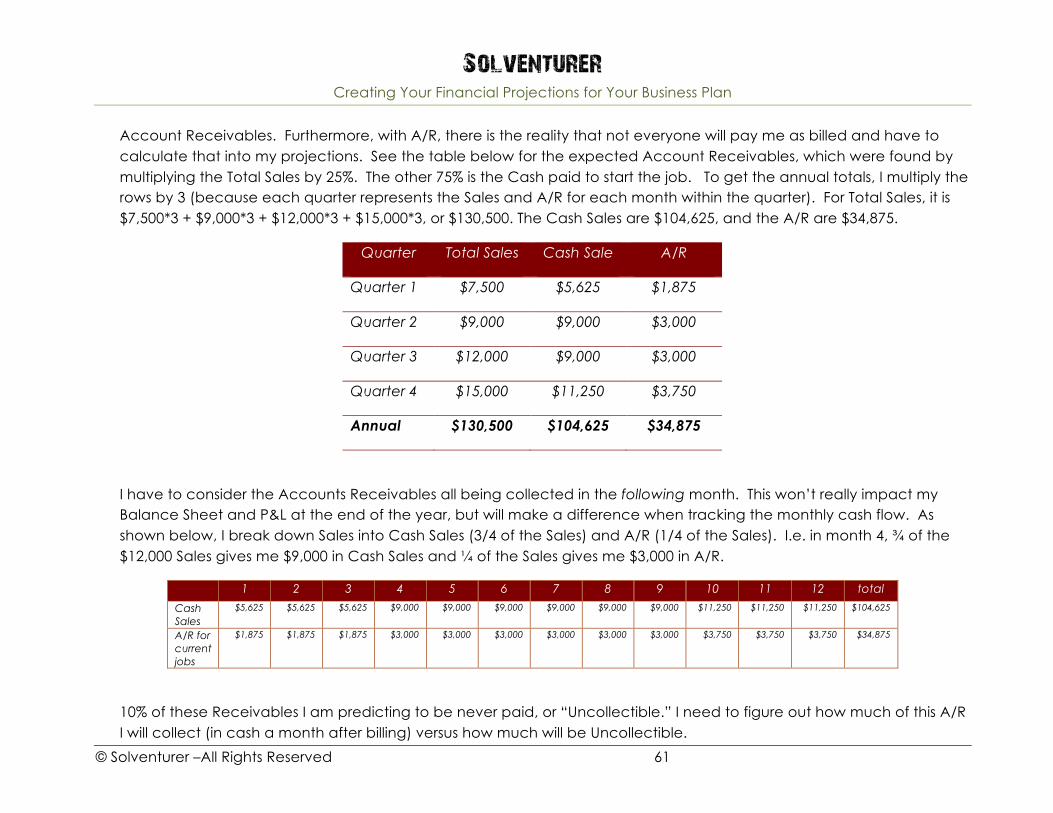
Solventurer Creating Your Financial Projections for Your Business Plan
© Solventurer –All Rights Reserved 61
Account Receivables. Furthermore, with A/R, there is the reality that not everyone will pay me as billed and have to calculate that into my projections. See the table below for the expected Account Receivables, which were found by multiplying the Total Sales by 25%. The other 75% is the Cash paid to start the job. To get the annual totals, I multiply the rows by 3 (because each quarter represents the Sales and A/R for each month within the quarter). For Total Sales, it is $7,500*3 + $9,000*3 + $12,000*3 + $15,000*3, or $130,500. The Cash Sales are $104,625, and the A/R are $34,875.
Quarter Total Sales Cash Sale A/R
Quarter 1 $7,500 $5,625 $1,875
Quarter 2 $9,000 $9,000 $3,000
Quarter 3 $12,000 $9,000 $3,000
Quarter 4 $15,000 $11,250 $3,750
Annual $130,500 $104,625 $34,875
I have to consider the Accounts Receivables all being collected in the following month. This won’t really impact my Balance Sheet and P&L at the end of the year, but will make a difference when tracking the monthly cash flow. As shown below, I break down Sales into Cash Sales (3/4 of the Sales) and A/R (1/4 of the Sales). I.e. in month 4, ¾ of the $12,000 Sales gives me $9,000 in Cash Sales and ¼ of the Sales gives me $3,000 in A/R.
1 2 3 4 5 6 7 8 9 10 11 12 total
Cash Sales
$5,625 $5,625 $5,625 $9,000 $9,000 $9,000 $9,000 $9,000 $9,000 $11,250 $11,250 $11,250 $104,625
A/R for current jobs
$1,875 $1,875 $1,875 $3,000 $3,000 $3,000 $3,000 $3,000 $3,000 $3,750 $3,750 $3,750 $34,875
10% of these Receivables I am predicting to be never paid, or “Uncollectible.” I need to figure out how much of this A/R I will collect (in cash a month after billing) versus how much will be Uncollectible.

Solventurer Creating Your Financial Projections for Your Business Plan
© Solventurer –All Rights Reserved 62
To see out how much cash I will eventually collect (and not collect), I need to create another line item of A/R Owed From Last Month, which is the money owed to me from work I finished last month. You can see it’s almost always the same as the current month Receivables except when the volume changes, i.e. month 3 to 4. This is the money that is owed to me and collected 30 days after I complete a job. Of that money, I will not collect 10%, so I multiply the aforementioned line by 10% to get the Uncollectible value. Finally, I subtract the difference to get the amount that I will actually collect in cash:
1 2 3 4 5 6 7 8 9 10 11 12 total
Cash Sales $5,625 $5,625 $5,625 $9,000 $9,000 $9,000 $9,000 $9,000 $9,000 $11,250 $11,250 $11,250 $104,625
A/R for current jobs $1,875 $1,875 $1,875 $3,000 $3,000 $3,000 $3,000 $3,000 $3,000 $3,750 $3,750 $3,750 $34,875
A/R owed from last Month
$1,875 $1,875 $1,875 $3,000 $3,000 $3,000 $3,000 $3,000 $3,000 $3,750 $3,750 $31,125
Uncollectibles $188 $188 $188 $300 $300 $300 $300 $300 $300 $375 $375 $3,113
Collections in Cash $1,688 $1,688 $1,688 $2,700 $2,700 $2,700 $2,700 $2,700 $2,700 $3,375 $3,375 $28,013

Solventurer Creating Your Financial Projections for Your Business Plan
© Solventurer –All Rights Reserved 63
Balance Sheet
The Balance Sheet is concerned with the cash involved in transactions, the Receivables, and the contra account, Uncollectibles. Because I am creating an annual projected BS, I am looking at totals here. I will bring cash into the business: the Cash Sales and Account Receivable Collections, or $104,625 + $28,013 = $132,168. The Accounts Receivables are the $34,875 and the Uncollectibles are $3,113. My Net Worth is going to rise considerably.
P&L
On the P&L, I need to show two numbers: total sales and the how much I won’t ever collect. Accounts Receivables are not shown here. So I will show all Sales at $130,500. I will also have a line item called Bad Debts Expense, the same as Uncollectibles. This will be $3,113.
Cash Flow
The Cash Flow will be monthly. The Sales on my Cash Flow will be different than those on my P&L, as I am limiting to the cash exchanging hands. I will have two line items on the Cash Flow—the Cash Sales ($104,625) and the Account Receivable Collections ($28,013).
E. Direct Costs
My Direct Costs will be paid for in cash, making these easy to categorize. I need to annualize these as I did with the Sales and A/R. The total Direct Costs for the year are $18,600, or $1,000*3 + $1,600*3+ $1,600*3 + $2,000*3.
Balance Sheet My Cash will be reduced by $18,600. To balance the BS, I will also decrease my Net Worth by $18,600.

Solventurer Creating Your Financial Projections for Your Business Plan
© Solventurer –All Rights Reserved 64
P&L My Direct Costs will be $18,600 also.
Cash Flow
My Cash Flow is monthly and will simply have Direct Costs of $1,000 for each of the first three months, $1,600 for each of the next three months, etc.
F. Indirect Costs
I took the table and used the numbers from it. I already did much of the math.
Rent=$0; Internet/data at $100*12 = $1,200; Hosting at $20*12=$240; Insurance at $25*12 = $300. All of this overhead is $0 + $1,200 + $240 + $300 = $1,740
Owner Withdrawal is $2,000*6 = $24,000 for the first six months and $2,500*6 = $15,000 for the remaining six months totaling $39,000 for the year.
Loan payments of $465 monthly. For the annual Balance Sheet, this adds to up to $5,460, which will do two things. First, it will reduce my Cash by $5,460. It will also reduce the Current Notes Payable to $0 in month 12. Please note all the different numbers with loan payments. $5,460 is the cash outflow of loan payments, which includes both interest and principle. The Current Notes Payable Liability, initially at $4,643, will be reduced to zero after 12 payments. And finally, your P&L will be affected by the interest payments (i.e. Interest Expense or Interest Payable), which adds up to $935 for the year. I have to remind myself that Interest Expense is an accounting concept—I won’t be writing a check to anyone for interest. I’ll be concerned with the loan payments!
Depreciation, a non-cash expense. This is $4,000 for the year, showing up on the P&L as Deprecation Expense. On the Balance Sheet, it will also show up as Accumulated Depreciation of $4,000. Remember it doesn’t affect my Cash position!
The cash taken out of the business—for the Cash Flow and reducing the Cash position on the Balance Sheet:
$1,740 (Overhead) + $39,000 (Withdrawal) + $5,460 (Loan Payments) = $46,200.

Solventurer Creating Your Financial Projections for Your Business Plan
© Solventurer –All Rights Reserved 65
Though the table a few pages ago clearly shows where each transaction will go, this shows a little more detail:
Balance Sheet
Indirect costs—overhead—sucks the cash out of my business. From these and paying off my Current Notes Payable, my cash position will be decreased by $46,200. Accumulated Depreciation will be $4,000.
P&L
The expenses are Rent=$0, Internet=$1,200, Hosting=$240, Owner Withdrawal=$39,000, Interest Expense=$935, and Depreciation=$4,000.
Cash Flow As shown above, the Cash Flow will be reduced by $46,200.
G. Totals
I’ll start with the Balance Sheet. In the Current Column, I’ll use my Startup Month (Steps A & B). This will include my startup cash, the loan, and the initial equipment and software purchases. For Year 1, I will add all the above steps into the worksheet below. As we did earlier in the ebook, each step shows the cumulative totals.
Step A shows me contributing my $10,000 in Cash and taking out a bank loan of $15,000.
Step B has a $15,000 investment in Software/Equipment, transferring the Asset from Cash to Software & Equipment. $5,000 is spent in marketing, which effects the Cash and Net Worth (Marketing is not an Asset!)
Step C shows monthly Marketing costs, reducing the Cash and Equity by $2,800 per month, or $37,600 total. I’m not worried about the negatives at this point because these steps are not chronological! So the Cash is reduced to $5,000 - $37,600, or $32,600.
Step D, the most involving step. Good thing I did most of the work already! Cash will be increased by $132,638, bringing Cash up to $100,038. Then I have to add in the Accounts Receivable which will be $34,875. Finally the Uncollectibles I

Solventurer Creating Your Financial Projections for Your Business Plan
© Solventurer –All Rights Reserved 66
calculated to be -$3,113. I readjusted my Net Worth simply by balancing the equation A=L+NE. I love the way Sales inflates my Net Worth!
Step E, the Direct Costs, is simply taking Cash out. I already figured the DC will be $18,600.
Step F for the Balance Sheet includes Accumulated Depreciation ($4,000), which shows my equipment/software becoming technological obsolete over the next year. It decreases the value of the Equipment and my Net Worth. I also need to include the overhead expenses, or the $46,200 in costs just to maintain my business. That will take my Cash down to $35,238, ($81,438-$46,200.) My Net Worth will drop from $113,200 to $67,643.
Giving me the following Projected Balance Sheet. Please not that Year 1 represents 12 AM on Dec 31st (or at a moment in time exactly 12 months after now).
A B C D E F
Cash $25,000 $5,000 ($32,600) $100,038 $81,438 $35,238
Software & Equipment $15,000 $15,000 $15,000 $15,000 $15,000
Less A.D. ($4,000)
A/R $34,875 $34,875 $34,875
Uncollectible ($3,113) ($3,113) ($3,113)
Total Assets $25,000 $20,000 ($17,600) $146,800 $128,200 $78,000
Current Note $4,643 $4,643 $4,643 $4,643 $4,643 $0
Long Term Note $10,357 $10,357 $10,357 $10,357 $10,357 $10,357
Liabilities $15,000 $15,000 $15,000 $15,000 $15,000 $10,357
Net Worth $10,000 $5,000 ($32,600) $131,800 $113,200 $67,643
Liabilities + NW $25,000 $20,000 ($17,600) $146,800 $128,200 $78,000

Solventurer Creating Your Financial Projections for Your Business Plan
© Solventurer –All Rights Reserved 67
Projected Balance Sheet Current Year 1 Assets
Cash $10,000 $35,238
Equipment $15,000 $15,000
Less Accumulated Depreciation $0 ($4,000)
Total Equipment $15,000 $11,000
Accounts Receivable $0 $34,875
Uncollectible @ 10% $0 ($3,113)
Total Assets $10,500 $78,000
Liabilities
Current Notes $4,643 $0
Long Term Notes $10,357 $10,357
Total Liabilities $15,000 $10,357
Net Worth $4,500 $67,643
Liabilities + Net Worth $10,500 $78,000
P&L for first 12 months Income Sales $130,500
Less Direct Costs $18,600 Gross Profit $111,900 Expenses
Rent $0 Internet/data $1,200 Hosting $240 Marketing $37,600 Insurance $300 Owner Withdrawal $27,000 Interest Payable $935 Bad Debts $3,113 Depreciation $1,200
Total Expenses $71,588 Net Income Before Tax
$40,312

Solventurer Creating Your Financial Projections for Your Business Plan
© Solventurer –All Rights Reserved 68
The Cash Flow Projection:
Month startup 1 2 3 4 5 6 Starting Balance $10,000 $20,000 $18,245 $20,178 $22,110 $27,418 $33,738 Cash In
Cash Sales $5,625 $5,625 $5,625 $9,000 $9,000 $9,000 Collections from
Credit accounts $1,688 $1,688 $1,688 $2,700 $2,700
Receive Loan $15,000 Total Cash In $15,000 $5,625 $7,313 $7,313 $10,688 $11,700 $11,700 Cash Out
Direct Costs (Transport, printing)
$1,000 $1,000 $1,000 $1,600 $1,600 $1,600
Equipment/Software $15,000 Rent $0 $0 $0 $0 $0 $0 Internet/data $100 $100 $100 $100 $100 $100 Marketing $5,000 $4,800 $2,800 $2,800 $2,800 $2,800 $4,800 Insurance $25 $25 $25 $25 $25 $25 Loan Payment $455 $455 $455 $455 $455 $455 Owner Withdrawal $2,000 $2,000 $2,000 $2,000 $2,000 $2,000
Total Cash Out $5,000 $7,380 $5,380 $5,380 $5,380 $5,380 $7,380 Net Cash $10,000 -$1,755 $1,933 $1,933 $5,308 $6,320 $4,320 Ending Cash $20,000 $18,245 $20,178 $22,110 $27,418 $33,738 $38,058

Solventurer Creating Your Financial Projections for Your Business Plan
© Solventurer –All Rights Reserved 69
Month 7 8 9 10 11 12 total Starting Balance $38,058 $43,878 $49,698 $55,518 $63,588 $72,333 Cash In
Sales $9,000 $9,000 $9,000 $11,250 $11,250 $11,250 $104,625 Collections from
Credit accounts $2,700 $2,700 $2,700 $2,700 $3,375 $3,375
$28,013 Receive Loan $15,000
Total Cash In $11,700 $11,700 $11,700 $13,950 $14,625 $14,625 $147,638 Cash Out
Direct Costs $1,600 $1,600 $1,600 $2,000 $2,000 $2,000 $18,600 Equipment/Software $15,000 Rent $0 $0 $0 $0 $0 $0 $0 Internet/data $100 $100 $100 $100 $100 $100 $1,200 Marketing $2,800 $2,800 $2,800 $2,800 $2,800 $2,800 $37,600 Insurance $25 $25 $25 $25 $25 $25 $300 Loan Payment $455 $455 $455 $455 $455 $455 $5,460 Owner Withdrawal $2,500 $2,500 $2,500 $2,500 $2,500 $2,500 $27,000
Total Cash Out $5,880 $5,880 $5,880 $5,880 $5,880 $5,880 $71,560 Net Cash $5,820 $5,820 $5,820 $8,070 $8,745 $8,745 $71,078 Ending Cash $43,878 $49,698 $55,518 $63,588 $72,333 $81,078