Creating QbD / PAT Management Awareness - ISPE … · Creating QbD / PAT Management Awareness ISPE...
67
Creating QbD / PAT Management Awareness ISPE PAT CoP D/A/CH Dated September 27, 2007, V1.0
Transcript of Creating QbD / PAT Management Awareness - ISPE … · Creating QbD / PAT Management Awareness ISPE...

Creating QbD / PAT Management Awareness
ISPE PAT CoP D/A/CH
Dated September 27, 2007, V1.0

Creating QbD / PAT , Dated September 27, 2007, V1.0 page 2 of 67 ISPE-PAT-CoP-DACH-Awareness-Doc-Final-V1.0
Contents 1 Management Summary.................................................................................................. 4
1.1 Objective ................................................................................................................. 4 1.2 Current situation in pharmaceutical industry ..................................................... 4 1.3 How to build Quality into Processes and Products? ......................................... 4 1.4 Strategic benefit of QbD / PAT-Projects .............................................................. 4
2 Why PAT - Drivers and Benefits ................................................................................... 6 2.1 FDA Drivers............................................................................................................. 6 2.2 FDA Benefits........................................................................................................... 6 2.3 Industry Drivers...................................................................................................... 6 2.4 Industry benefits .................................................................................................... 6
3 Implications of PAT - Organization and Process........................................................ 6 3.1 Organization ........................................................................................................... 6
3.1.1 Personnel........................................................................................................ 6 3.1.2 Management ................................................................................................... 6 3.1.3 QA Approach.................................................................................................. 6
3.2 Process ................................................................................................................... 6 3.2.1 Process Understanding................................................................................. 6 3.2.2 QA/QC ............................................................................................................. 6 3.2.3 Technology..................................................................................................... 6 3.2.4 IT ...................................................................................................................... 6
4 Project Approach and Case Studies ............................................................................ 6 4.1 Introduction ............................................................................................................ 6 4.2 Questionnaires ....................................................................................................... 6 4.3 Case study results ................................................................................................. 6
4.3.1 Quality ............................................................................................................. 6 4.3.2 Process ........................................................................................................... 6 4.3.3 Risk.................................................................................................................. 6 4.3.4 Cost ................................................................................................................. 6 4.3.5 Personnel........................................................................................................ 6 4.3.6 Tools................................................................................................................ 6 4.3.7 Time................................................................................................................. 6 4.3.8 Validation ........................................................................................................ 6 4.3.9 Organization ................................................................................................... 6 4.3.10 Regulatory .................................................................................................... 6
4.4 Summary................................................................................................................. 6 5 Appendix: Structured Catalogue of Standardised Questions with
Benchmarking ......................................................................................................... 6 5.1 Quality (category 1)................................................................................................ 6 5.2 Process (category 2).............................................................................................. 6 5.3 Risk (category 3) .................................................................................................... 6 5.4 Costs (category 4).................................................................................................. 6 5.5 Personnel (category 5) .......................................................................................... 6
Creating QbD / PAT , Dated September 27, 2007, V1.0 page 3 of 67 ISPE-PAT-CoP-DACH-Awareness-Doc-Final-V1.0
5.6 Tools (category 6) .................................................................................................. 6 5.7 Time (category 7) ................................................................................................... 6 5.8 Validation (category 8)........................................................................................... 6 5.9 Organization (category 9)...................................................................................... 6 5.10 Regulatory (category 10) ..................................................................................... 6
6 Appendix: Project Approach and Case Studies -- completed questionaires .......... 6 6.1 Case Studies 1 to 2 ................................................................................................ 6 6.2 Case Studies 3 to 6 ................................................................................................ 6 6.3 Case Studies 7 to 8 ................................................................................................ 6
7 Volunteers....................................................................................................................... 6 8 Glossary .......................................................................................................................... 6
Creating QbD / PAT , Dated September 27, 2007, V1.0 page 4 of 67 ISPE-PAT-CoP-DACH-Awareness-Doc-Final-V1.0
1 Management Summary
1.1 Objective The objective of this document is to create awareness about the FDAs QbD/PAT initiative and its benefits. It describes
• Drivers and Benefits
• How to benchmark QbD/PAT projects
• Case studies
1.2 Current situation in pharmaceutical industry Nowadays innovations in the pharmaceutical industry are limited due to regulatory aspects which inhibit the introduction of new and state of the art technologies in validated processes.
The processes are fixed during clinical trials. Process parameters and quality attributes are part of the registration file (licence). Most variations require change controls. Changes require a lot of effort like pre-approval, additional clinical trials and registration activities.
Validated processes are inflexible to process optimisation measures or changes in feedstock by suppliers. For example, bio-feed-stocks are difficult to handle under GMP conditions due to regional and seasonal variations. During the product life cycle, process innovations with the target to improve product quality continuously is related to high cost when changing the registration file with the authorities.
To reduce this effort in the different areas of the pharmaceutical industry the FDA recommends to build quality into processes and products. This is a paradigm change with respect to the earlier way of final product quality testing.
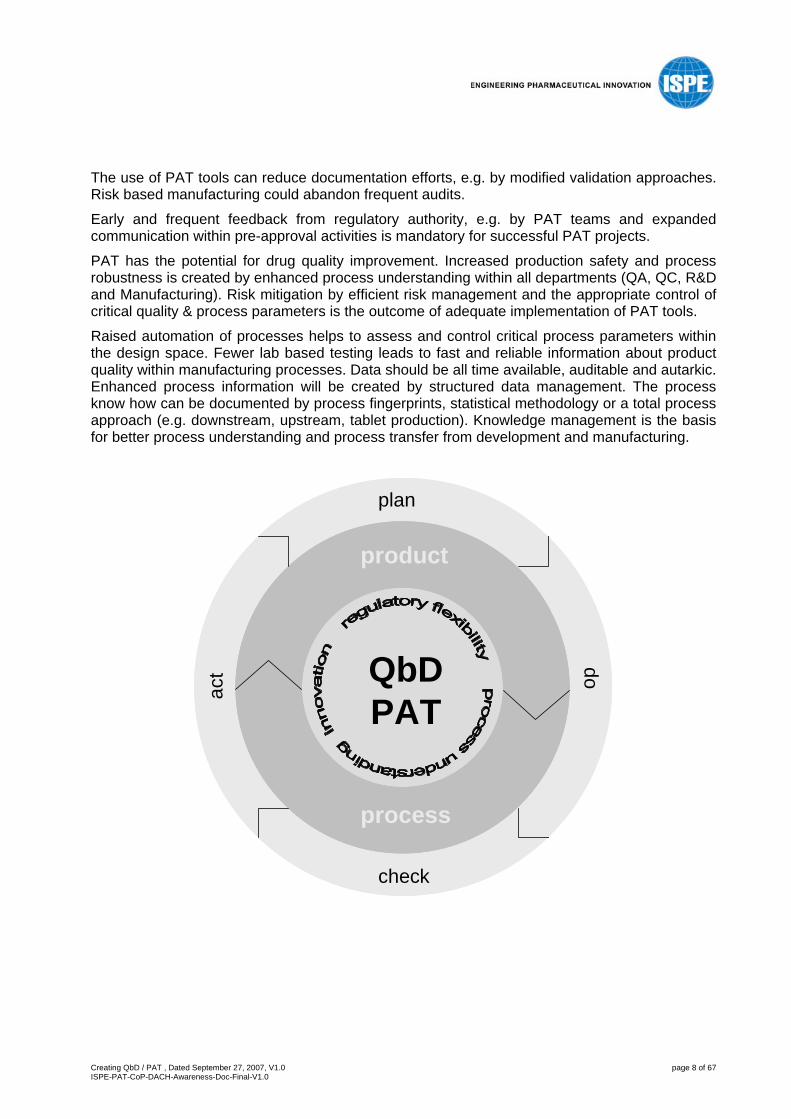
1.3 How to build Quality into Processes and Products? To build quality into processes and products the authorities recommend to use principles and tools as QbD/PAT. This is an innovative way of thinking in developing and manufacturing pharmaceuticals. Pharmaceutical manufacturers should implement innovative and state of the art technologies to improve the production systems and for a sustainable cost reduction. QbD/PAT ensures constant and high product quality on the basis of flexible manufacturing processes. Thorough process understanding in combination with a well defined Design Space allows much more flexible process control strategies even if input parameters will vary. Regulatory authorities do not consider variability of the operating conditions within predefined limits (Design Space) as changes.
1.4 Strategic benefit of QbD / PAT-Projects Being aware of the regulatory flexibility industry can actively redefine their strategies applying QbD/PAT principles. Better process understanding leads to higher product quality and process robustness at lower costs and thus improves competitiveness.

Creating QbD / PAT , Dated September 27, 2007, V1.0 page 5 of 67 ISPE-PAT-CoP-DACH-Awareness-Doc-Final-V1.0
Authority view Commercial Management view More pharmaceuticals • Time-to-market
• More Innovation with higher quality • Reduced documentation
• Optimized communication between authorities and industry
• Guaranteed quality level ("unit-to-unit") at lower cost • Decreasing cost of production by improved productivity Further on: Competitive advantage
Image improvement Existing data and resources can typically be used
Authorities view corresponds to Commercial Management view and the common goals can be reached by QbD / PAT as an innovative way of thinking in manufacturing pharmaceuticals.
Creating QbD / PAT , Dated September 27, 2007, V1.0 page 6 of 67 ISPE-PAT-CoP-DACH-Awareness-Doc-Final-V1.0
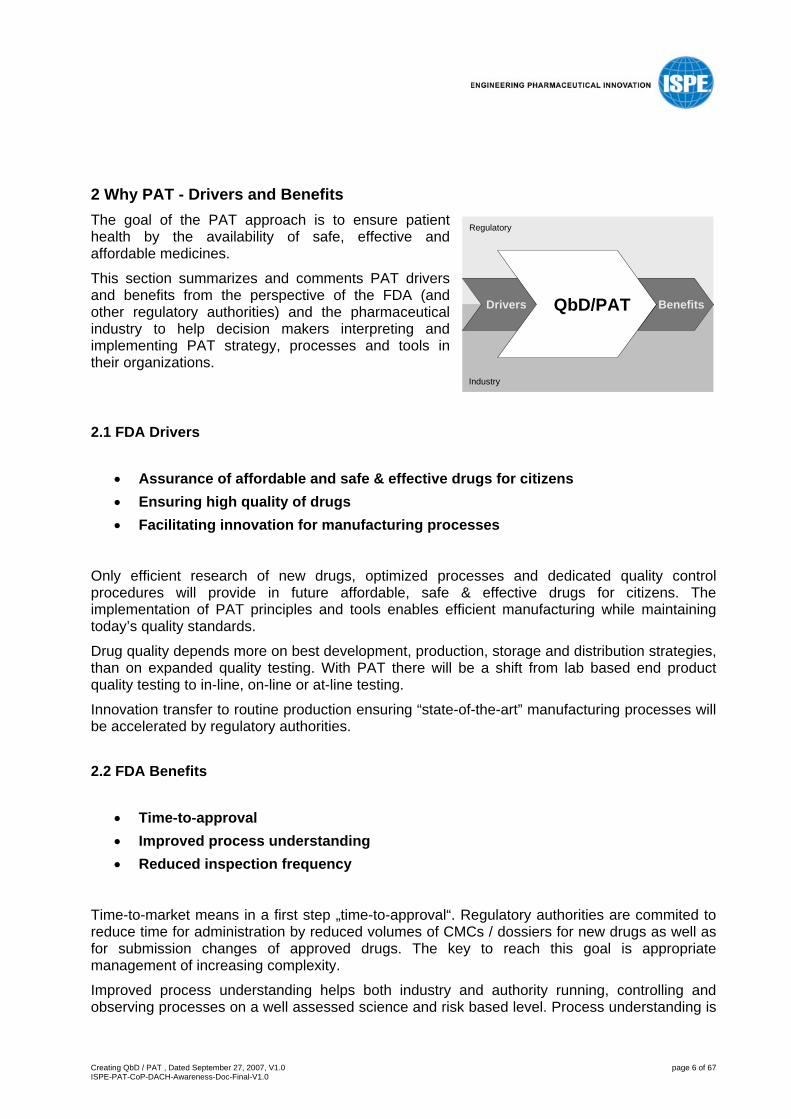
2 Why PAT - Drivers and Benefits The goal of the PAT approach is to ensure patient health by the availability of safe, effective and affordable medicines.
This section summarizes and comments PAT drivers and benefits from the perspective of the FDA (and other regulatory authorities) and the pharmaceutical industry to help decision makers interpreting and implementing PAT strategy, processes and tools in their organizations.
2.1 FDA Drivers
• Assurance of affordable and safe & effective drugs for citizens • Ensuring high quality of drugs • Facilitating innovation for manufacturing processes
Only efficient research of new drugs, optimized processes and dedicated quality control procedures will provide in future affordable, safe & effective drugs for citizens. The implementation of PAT principles and tools enables efficient manufacturing while maintaining today’s quality standards.
Drug quality depends more on best development, production, storage and distribution strategies, than on expanded quality testing. With PAT there will be a shift from lab based end product quality testing to in-line, on-line or at-line testing.
Innovation transfer to routine production ensuring “state-of-the-art” manufacturing processes will be accelerated by regulatory authorities.
2.2 FDA Benefits
• Time-to-approval • Improved process understanding • Reduced inspection frequency
Time-to-market means in a first step „time-to-approval“. Regulatory authorities are commited to reduce time for administration by reduced volumes of CMCs / dossiers for new drugs as well as for submission changes of approved drugs. The key to reach this goal is appropriate management of increasing complexity.
Improved process understanding helps both industry and authority running, controlling and observing processes on a well assessed science and risk based level. Process understanding is
Drivers BenefitsQbD/PAT
Industry
Regulatory
Drivers BenefitsQbD/PAT
Industry
Regulatory
Creating QbD / PAT , Dated September 27, 2007, V1.0 page 7 of 67 ISPE-PAT-CoP-DACH-Awareness-Doc-Final-V1.0
the basis for process control and assured end product quality. Finally, time and frequency for extended audits or inspections can be reduced.
2.3 Industry Drivers
• Reduced costs of manufacturing • More flexible manufacturing processes • Real-time-release
PAT efforts could generate competitive advantages, i.e. better corporate image, increased quality and efficient management of risks. Cost of manufacturing or QA could be decreased by increasing productivity and better availability of production equipment. Moreover PAT offers the opportunity for interdisciplinary communication (e.g. R&D, manufacturing, QA, QC, IT departments).
Manufacturing processes could become more safe and flexible under PAT. A defined design space (Quality by design) for production processes offers flexibility for the used raw material, APIs and even process controls. Process understanding leads to an appropriate management of variability and improved operational efficiency (e.g.“Lean Manufacturing”, “Right first time” strategy). Real time release could help reducing time in warehouses of raw materials, final & intermediate products or bulk (work in progress). PAT projects can start in single unit operations or could cover the whole production site. Incremental deployment is enabled.
Improved communication between industry and the regulatory authorities is provided by FDA´s PAT teams („pre-approval“ activities). By implementing PAT tools and principles industry is prepared in case PAT becomes mandatory. International harmonisation by ICH guidelines Q 8 to 10 defines many PAT elements as today’s GMP standards.
2.4 Industry benefits
• Using of „state-of-the-art“ technologies in manufacturing • Guaranteed and improved quality level ("unit-to-unit") • Reduced documentation • Risk mitigation • Real time data acquisition and integration • Knowledge management
Implementation of „state-of-the-art“ and innovative production & control technology is encouraged by regulatory authorities. Know how transfer from other industries (as IT, food, automotive, electronic) is reasonable and useful. Reduced transfer time from development to production by using PAT tools seems to be possible.
Reduced personnel placement, less OOS batches, reduced lead time, cleaning, set-up or maintenance time lead to increased ROI. At the end a higher quality level of products will be obtained and yield can be increased.
Creating QbD / PAT , Dated September 27, 2007, V1.0 page 8 of 67 ISPE-PAT-CoP-DACH-Awareness-Doc-Final-V1.0
The use of PAT tools can reduce documentation efforts, e.g. by modified validation approaches. Risk based manufacturing could abandon frequent audits.
Early and frequent feedback from regulatory authority, e.g. by PAT teams and expanded communication within pre-approval activities is mandatory for successful PAT projects.
PAT has the potential for drug quality improvement. Increased production safety and process robustness is created by enhanced process understanding within all departments (QA, QC, R&D and Manufacturing). Risk mitigation by efficient risk management and the appropriate control of critical quality & process parameters is the outcome of adequate implementation of PAT tools.
Raised automation of processes helps to assess and control critical process parameters within the design space. Fewer lab based testing leads to fast and reliable information about product quality within manufacturing processes. Data should be all time available, auditable and autarkic. Enhanced process information will be created by structured data management. The process know how can be documented by process fingerprints, statistical methodology or a total process approach (e.g. downstream, upstream, tablet production). Knowledge management is the basis for better process understanding and process transfer from development and manufacturing.
QbDPAT
plan
check
act do
process
product
QbDPAT
plan
check
act do
process
product

Creating QbD / PAT , Dated September 27, 2007, V1.0 page 9 of 67 ISPE-PAT-CoP-DACH-Awareness-Doc-Final-V1.0
3 Implications of PAT - Organization and Process
QbD/PATimplications
ProcessOrganisation
Personnel
ManagementUnderstanding
TechnologyIT
Quality
QbD/PATimplications
ProcessOrganisation
Personnel
ManagementUnderstanding
TechnologyIT
Quality
3.1 Organization
3.1.1 Personnel • Demand on qualification and/or skills of employees may change
PAT may have an impact on qualification profiles in respect to scientific data analysis, statistics, process control, etc. Similar to implementing Six Sigma, implementing a PAT program may require dedicated training on methods and tools, including project management and statistics. (Probably at all levels of the company comparable with the Six Sigma training structure - master black belts, black belts, green belts, white belts?).
• Structural change within organization
There may be a need for implementation of a new department or restructuring of departments to deal with the new demands.
Interaction and collaboration between departments and functions may need to be increased (e.g. quality, regulatory, development, commercial production, etc.).
Contact to regulatory authorities may need to be intensified.
The implementation of PAT within the organizational structure requires accountability, roles and responsibilities to be defined (Clearly defined process owners, project managers, subject matter experts and process analysts).
Depending on the structure of the company, employees working for a PAT project could stay members of different departments or be integrated in a separate PAT-team or department.
Creating QbD / PAT , Dated September 27, 2007, V1.0 page 10 of 67 ISPE-PAT-CoP-DACH-Awareness-Doc-Final-V1.0
Depending on the PAT approach (holistic or more specialized) an interdisciplinary project team maybe useful (QA, R&D, engineering, QC, IT, manufacturing, etc.).
3.1.2 Management • Commitment of management:
Management has to be committed to PAT to deal with the early phase of PAT, which could mean more investment.
In later phases, when processes are more flexible due to PAT elements, companies will be able to maintain quality at lower cost, and will be prepared for future demands from agencies and be on top of the trend.
• Define PAT and development strategy:
Define general approach.
Define team.
Define which processes or products should be subjected to PAT first.
Define goals and objectives and the expected benefits.
Plan and commit resources (personnel, program money, equipment).
PAT means a paradigm shift from black/grey box to white box processes.
The development strategy may need to be revised – therefore, the specific requirements concerning PAT need to be analyzed.
• Risk concerning company:
If PAT is ignored, there may be a risk of getting behind the industry (competitive disadvantage), a risk of image or business loss due to lower operational efficiency in sustaining reproducible product quality.
• Management objectives: Regular review of benchmarks helps to stay on top of the project.
• Outsourcing:
Outsourcing partners need to be chosen and reviewed very carefully. Points to consider are: - Their ability to perform projects according to PAT. - Knowledge transfer (content, interfaces, patent, etc.). - Define accountabilities, roles and responsibilities. - Communicational structure. There may be an increased need for secrecacy agreements and/or more detailed contracts.
• Communication
Communication between all kinds of different partners (e.g. departments departments, vendor company company, company agencies, etc.) may need to be intensified.

Creating QbD / PAT , Dated September 27, 2007, V1.0 page 11 of 67 ISPE-PAT-CoP-DACH-Awareness-Doc-Final-V1.0
3.1.3 QA Approach • There may be an impact on existing QA structure. • Change in regulatory processes
Communication between regulatory authorities may have to start earlier and may be more regular (and possibly more informal) with PAT.
• Audits
Regulatory scrutiny will challenge the scientific understanding of quality relevant factors and how quality relevant risks are mitigated. Developing departments will get increasingly more attention from regulatory authorities. Continuous improvement and a clear structure for documenting changes and deviations need to be demonstrated. Comparison between real design space and documented design space will be in focus of an audit.
• Validation
Validation will be demonstrated by continuous measurement of critical-to-quality parameters in real/near time instead of the traditional three batch validation.
• Documentation
Better knowledge of impact of raw material may change specifications.
Specifications for submissions probably need to include design space and control space.
3.2 Process The QbD/PAT approach links the four areas of Process Understanding, QA/QC, Technology and IT together. This is the core of the QbD/PAT paradigm shift, linking these areas together.
The process is controlled and fully understood and the right data for real time release enables continuous process verification and improvement via knowledge management.
3.2.1 Process Understanding • Development of process models:
The analysis of the process should define which parts have some flexibility (Design space) and which are very rigorous.
In order to define system/process boundaries, (re-)structuring of complex processes may be helpful.
• Situation analysis is the evaluation of historical data (out of specification results, corrective actions.
• Impact analysis is the identification and evaluation of process steps, sources of variation and the variables that are critical to quality.
• Identification of critical process parameters are needed to be determined using appropriate techniques (e.g. FMEA, statistical analysis, risk analysis, root cause analysis, etc.).
• Monitoring/controlling of the process through definition and implementation of relevant measurements. This is necessary to obtain data which can be reviewed for better process/product understanding and control.

Creating QbD / PAT , Dated September 27, 2007, V1.0 page 12 of 67 ISPE-PAT-CoP-DACH-Awareness-Doc-Final-V1.0
• Verification of the control cycle is necessary to understand the impact of process parameters on process/product quality.
3.2.2 QA/QC • Specifications
Quality control testing will evolve from testing against a discrete specification (pass/fail) to real-time comparison of process/product signatures against a reference.
• QC testing
Parametric release and inline control could have an impact on QC headcount and work. There may be a necessity for additional verification of parameters and definition of prerequisites for parametric release. In order not to miss a slow deviation from expected requirements (e.g. raw material, wear of material, etc.) additional controls may be needed.
• Continuous improvement
Under PAT, manufacturing processes are monitored and controlled online, leading to continuous process improvements as opposed to static process validation. Continuous improvement and control of design space will be increasingly important.
• Validate equipment including the control cycle
In contrast to the common validation approach, where testing the functionality of the immediate equipment was sufficient, with PAT the complete control cycle of the equipment has to be included.
3.2.3 Technology • Continuous production
New equipment may be needed to enhance data acquisition and process understanding. Better knowledge of the process could lead to continuous production and faster release. Due to design space, production equipment could be used more flexible.
• Availability of suitable sensors/methods
After identification of critical process parameters availability of suitable sensors and methods has to be verified.
• Interface systems engineering product engineering
Since all parameters of a process have to be well understood system engineers and product engineers will probably have to work together more closely.
Creating QbD / PAT , Dated September 27, 2007, V1.0 page 13 of 67 ISPE-PAT-CoP-DACH-Awareness-Doc-Final-V1.0
3.2.4 IT • New software/ tools
New equipment, tools (e.g. SOA, XML) or applications may be needed to enhance data acquisition and analysis.
Infrastructure, databases and software should enable easy data mining. • New methods
New methods (e.g. MVDA, DoE, process modeling) including maintanance of knowledge base must be implemented to enhance data and process analysis.
• Software validation
There will be increasing scrutiny on software validation at regulatory audits.
The requirement for complete validation of software may start even earlier during research.
Creating QbD / PAT , Dated September 27, 2007, V1.0 page 14 of 67 ISPE-PAT-CoP-DACH-Awareness-Doc-Final-V1.0
4 Project Approach and Case Studies
4.1 Introduction Identification and evaluation of benchmarking parameters concerning PAT applications is important for various aspects:
• to raise acceptance in the management • to proof the maturity of projects • for monitoring project progress
Following categories have been defined for this assessment already, and may be extended on the user’s discretion:
• Quality (cat. 1) • Process (cat. 2) • Risk (cat. 3) • Cost (cat. 4) • Personnel (cat. 5) • Tools (cat. 6) • Time (cat. 7) • Validation (cat. 8) • Organization (cat. 9) • Regulatory (cat. 10)
In order to allow a proper benchmarking, quantification is necessary which is independent from absolute values and instead uses a rating which makes it possible to compare several projects. Thus the answers should be rated with measures from 1 to 5, whereby 1 corresponds to total dissatisfaction or not achieved and 5 indicate full satisfaction and success.
It is helpful to comment the decision of a specific rating for future review and audit in the respective comment field.
4.2 Questionnaires You will find the blank and completed questionaires in the appendix.

Creating QbD / PAT , Dated September 27, 2007, V1.0 page 15 of 67 ISPE-PAT-CoP-DACH-Awareness-Doc-Final-V1.0
4.3 Case study results Overall 11 case studies were collected based on the questionnaire in section 4.2. The case studies origin is taken from manufacturing and development sites of big pharmaceutical companies. The answers of case studies 5 - 11 were assessed according to the 10 categories in section 4.1.
Ben
efits
Degree of QbD/PAT
Case A
Case B
Case C
Ben
efits
Degree of QbD/PAT
Case A
Case B
Case C
4.3.1 Quality Positive effects depend on the degree of the PAT implementation as following
• OOS reduction
• Better quality definition and analysis methods
• Reduction of complaints and recalls
4.3.2 Process In all investigated case studies the general process understanding has strongly increased, e.g. by optimized adjustment of known process parameters. In some case studies also new CPPs were identified and used for advanced process control.
In most cases the process cycle time was reduced significantly and the productivity was increased.
Introduction and implementation of new technologies for process automation (including sensors, analytical devices and process control technologies) isn’t a mandatory prerequisite for QbD/PAT. QbD can also be achieved by existing process and control equipment.
The benefits of implementing QbD/PAT in the process has been estimated very positive.
Creating QbD / PAT , Dated September 27, 2007, V1.0 page 16 of 67 ISPE-PAT-CoP-DACH-Awareness-Doc-Final-V1.0
4.3.3 Risk Risk assessment is a positive state of the art methodology for risk detection and minimization, but independent from PAT. Risk assessment will become a key integral methods within PAT.
4.3.4 Cost Most of the case studies can not answer to the question of ROI, only one case claims a ROI of less than one year. For all other cases it is too early for any calculation.
As far as there are experiences, less rejected batches, less deviations increased yield higher OOE, less consumables, less waste and reworks are reported.
4.3.5 Personnel Up to now there is no reduction in personnel: Production is less lab intensive due to a higher degree of automation, but the personnel has shifted its tasks to implement and improve PAT. The mind change encourages communication between different depertments. A better process understanding is obtained. There are hints to a slight increase in personnel security.
4.3.6 Tools A clear result of the investigation is that more process data is recorded, analyzed and stored. The data is additionally used within the batch documentation. In most cases the data is used for advanced process control and the prediction of process deviations.
Applied analytical methods: e.g. NIR, MIR, Raman, laser diffraction, mass spectroscopy, accelerated dissolution testing.
Applied statistical methods: e.g. MVDA, DMAIC, DoE.
4.3.7 Time Summarizing, faster processes are reported:
• Higher utilization of resources.
• Reduced lead time by reduced intermediate off-line testing.
• Faster decisions for on-line quality assessment, faster and earlier decisions on waste material.
• Due to automated data acquisition, shorter transition time from raw data to meaningful process information.
• Material variability is detected earlier.
4.3.8 Validation
In total a lower effort for validation is expected but more effort has to be spend for facility, equipment and software validation during PAT implementation.
Creating QbD / PAT , Dated September 27, 2007, V1.0 page 17 of 67 ISPE-PAT-CoP-DACH-Awareness-Doc-Final-V1.0
4.3.9 Organization QbD/PAT projects have an impact on the organization of pharmaceutical companies and increase the interdisciplinary communications between departments.
4.3.10 Regulatory Regulatory issues have a strong impact on:
• Frequency of contacts and communication (scientific based) with regulatory bodies.
• Earlier and more often contact before and during implementation phase.
• The kind of documentation will be changed (more precise and deeper science based, earlier documentation during design expected).
• Positive impact on change control is expected.
4.4 Summary The aspects of quality, risk, validation and regulatory can be summarized as positive experience when PAT is professionally implemented. Companies with lower implementation expertise have slightly positive expectations, but needs more experiences.
Process understanding has strongly increased as well as the interdisciplinary communication between departments.
Generally speaking, a lot more data are stored due to implementation of PAT technologies; and we notice that a broad variety of sensors is used.
Currently most of the ongoing PAT projects are not mature enough for any sophisticated calculation of cost benefits. Experiences report about better indirect costs, like less rejected batches, higher yields etc.
Regarding to costs, benefits are claimed more in terms of higher yield, reduced cycle times and less rejections/ reworks than in less personnel; there is a shift in tasks for the same staff.
Creating QbD / PAT , Dated September 27, 2007, V1.0 page 18 of 67 ISPE-PAT-CoP-DACH-Awareness-Doc-Final-V1.0
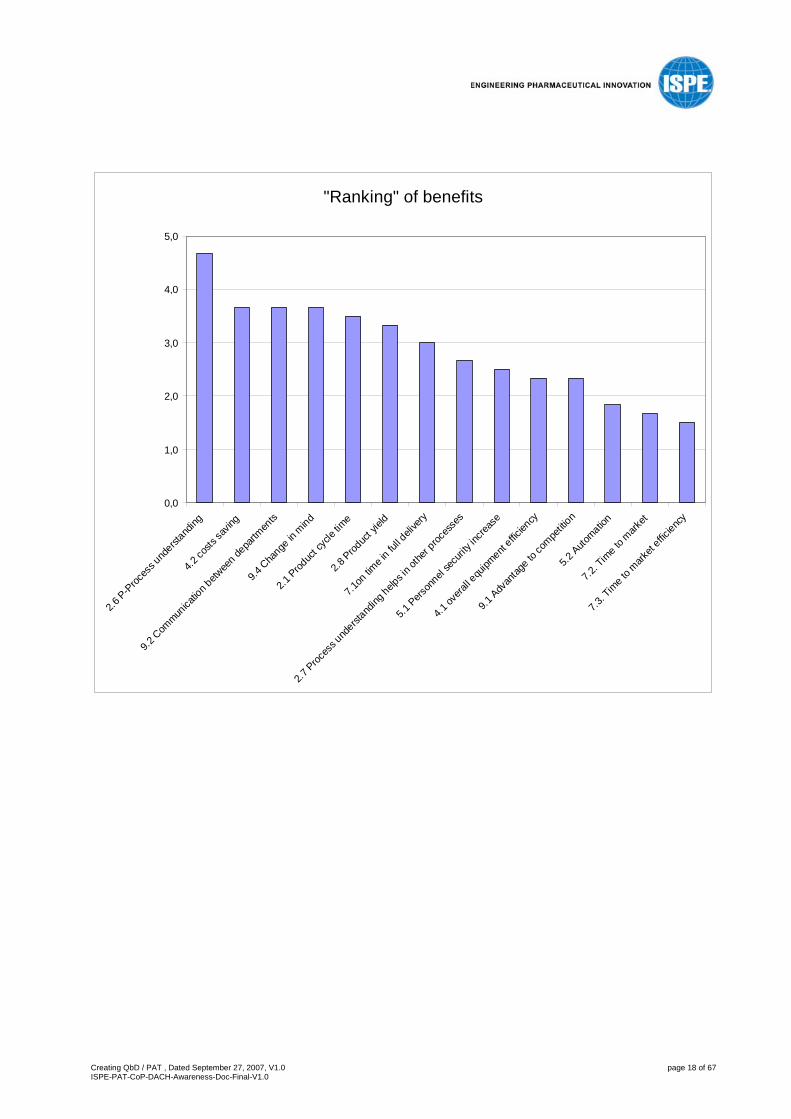
"Ranking" of benefits
0,0
1,0
2,0
3,0
4,0
5,0
2.6 P-P
roces
s und
erstand
ing
4.2 co
sts sa
ving
9.2 C
ommun
icatio
n betw
een de
partm
ents
9.4 C
hange
in m
ind
2.1 Prod
uct c
ycle
time
2.8 Prod
uct y
ield
7.1on
time i
n full d
elive
ry
2.7 Proc
ess u
nderst
anding
helps i
n othe
r proc
esse
s
5.1 Pers
onnel
secu
rity in
creas
e
4.1 ov
erall e
quipm
ent effic
iency
9.1 Adv
antag
e to co
mpetiti
on
5.2 Auto
mation
7.2. T
ime to
mark
et
7.3. T
ime to
mark
et effic
iency
Creating QbD / PAT , Dated September 27, 2007, V1.0 page 19 of 67 ISPE-PAT-CoP-DACH-Awareness-Doc-Final-V1.0
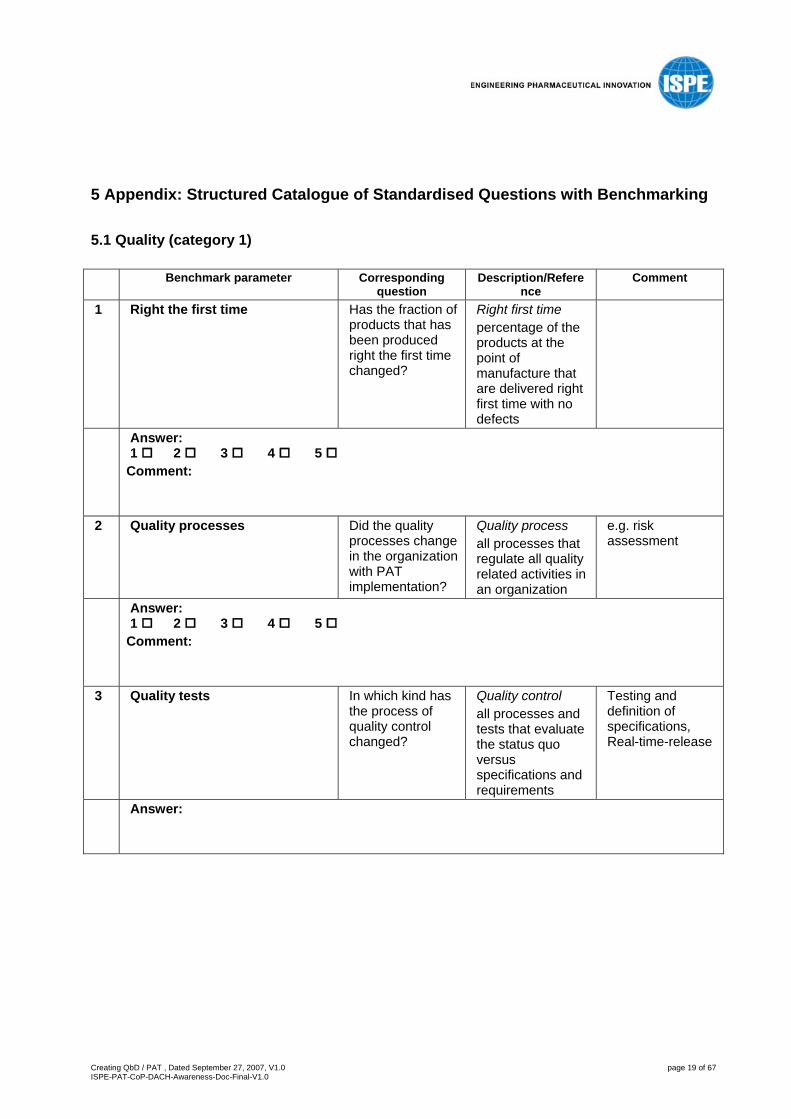
5 Appendix: Structured Catalogue of Standardised Questions with Benchmarking
5.1 Quality (category 1)
Benchmark parameter Corresponding question
Description/Reference
Comment
1 Right the first time Has the fraction of products that has been produced right the first time changed?
Right first time percentage of the products at the point of manufacture that are delivered right first time with no defects
Answer: 1 2 3 4 5
Comment:
2 Quality processes Did the quality processes change in the organization with PAT implementation?
Quality process all processes that regulate all quality related activities in an organization
e.g. risk assessment
Answer: 1 2 3 4 5
Comment:
3 Quality tests In which kind has the process of quality control changed?
Quality control all processes and tests that evaluate the status quo versus specifications and requirements
Testing and definition of specifications, Real-time-release
Answer:

Creating QbD / PAT , Dated September 27, 2007, V1.0 page 20 of 67 ISPE-PAT-CoP-DACH-Awareness-Doc-Final-V1.0
Benchmark parameter Corresponding question
Description/Reference
Comment
4 Complaints/recalls Did you see a change in the amount of complaints and recalls of products with RTR/PR (Real Time Release / Parametric Release)?
Answer: 1 2 3 4 5
Comment:
5 Product specification Is there an impact to the product specification?
Answer: 1 2 3 4 5
Comment:
6 Product specification Is the product specification more science based?
Answer: 1 2 3 4 5
Comment:
7 Product specification R&D Is the
development of product specification changed with PAT?
Answer: 1 2 3 4 5
Comment:
Creating QbD / PAT , Dated September 27, 2007, V1.0 page 21 of 67 ISPE-PAT-CoP-DACH-Awareness-Doc-Final-V1.0
Benchmark parameter Corresponding question
Description/Reference
Comment
8 OOS Did you see a change in the number of OOS incidences?
Answer: 1 2 3 4 5
Comment:
Creating QbD / PAT , Dated September 27, 2007, V1.0 page 22 of 67 ISPE-PAT-CoP-DACH-Awareness-Doc-Final-V1.0
5.2 Process (category 2)
Benchmark parameter Corresponding question
Description/Reference
Comment
1 Cycle time Has the cycle time changed?
Cycle time this is the total time from commencing manufacture to delivering products to the customer which in many cases is the factory warehouse
Answer: 1 2 3 4 5
Comment:
2 Productivity increase Did a better understanding of the variability of a measurement result in an earlier transition to the next unit operation?
Answer: 1 2 3 4 5
Comment:
3 Process parameters Were new important process parameters or correlations between process parameters identified?
Answer: 1 2 3 4 5
Comment:

Creating QbD / PAT , Dated September 27, 2007, V1.0 page 23 of 67 ISPE-PAT-CoP-DACH-Awareness-Doc-Final-V1.0
Benchmark parameter Corresponding question
Description/Reference
Comment
4 Process parameters
Were any known process parameters adjusted?
Acceptance criteria
Answer: 1 2 3 4 5
Comment:
5 Implementation of new technologies
Were new technologies in the process implemented?
Answer: 1 2 3 4 5
Comment:
6 Process understanding Was process understanding increased?
i.e. usage of structured data management, statistical methods
Answer: 1 2 3 4 5
Comment:
7 Process understanding Did better understanding of a process help in other processes?
Answer: 1 2 3 4 5
Comment:
8 Yield Is the yield higher after PAT than before?
Answer: 1 2 3 4 5
Comment:

Creating QbD / PAT , Dated September 27, 2007, V1.0 page 24 of 67 ISPE-PAT-CoP-DACH-Awareness-Doc-Final-V1.0
Benchmark parameter Corresponding question
Description/Reference
Comment
9 Process control Did you find additional possibilities to control the process?
Answer: 1 2 3 4 5
Comment:
Creating QbD / PAT , Dated September 27, 2007, V1.0 page 25 of 67 ISPE-PAT-CoP-DACH-Awareness-Doc-Final-V1.0
5.3 Risk (category 3)
Benchmark parameter Corresponding question
Description/ Reference
Comment
1 Risk assessment Was the PAT project a result of a risk assessment?
Answer: 1 2 3 4 5
Comment:
2 Risk assessment Did the PAT project initiate risk assessments?
Answer: 1 2 3 4 5
Comment:
3 Risk reduction Did the PAT project reduce risks?
Answer: 1 2 3 4 5
Comment:

Creating QbD / PAT , Dated September 27, 2007, V1.0 page 26 of 67 ISPE-PAT-CoP-DACH-Awareness-Doc-Final-V1.0
5.4 Costs (category 4)
Benchmark parameter Corresponding question
Description/ Reference
Comment
1 Overall equipment effectiveness (OEE)
Has the OEE changed?
Overall equipment effectiveness This measures how effectively the manufacturing equipment is used. It is a product of the product rate multiplied by the quality rate multiplied by the plant availability. A figure of 100% implies that the plant is running flat out every hour of the day making perfect products
Example entry
Answer: 1 2 3 4 5
Comment:
2 Cost savings Where did you reduce costs?
Personnel, equipment, QC, raw material etc.
Answer:
3 Return on Investment What is the period until break even of the PAT project?
Investment phase
Answer:
Creating QbD / PAT , Dated September 27, 2007, V1.0 page 27 of 67 ISPE-PAT-CoP-DACH-Awareness-Doc-Final-V1.0
5.5 Personnel (category 5)
Benchmark parameter Corresponding question
Description/ Reference
Comment
1 Personnel security Did you improve the operator or/and product safety?
Answer: 1 2 3 4 5
Comment:
2 Automation versus human interaction
Was number of personnel reduced?
None
Answer: 1 2 3 4 5
Comment:
Creating QbD / PAT , Dated September 27, 2007, V1.0 page 28 of 67 ISPE-PAT-CoP-DACH-Awareness-Doc-Final-V1.0
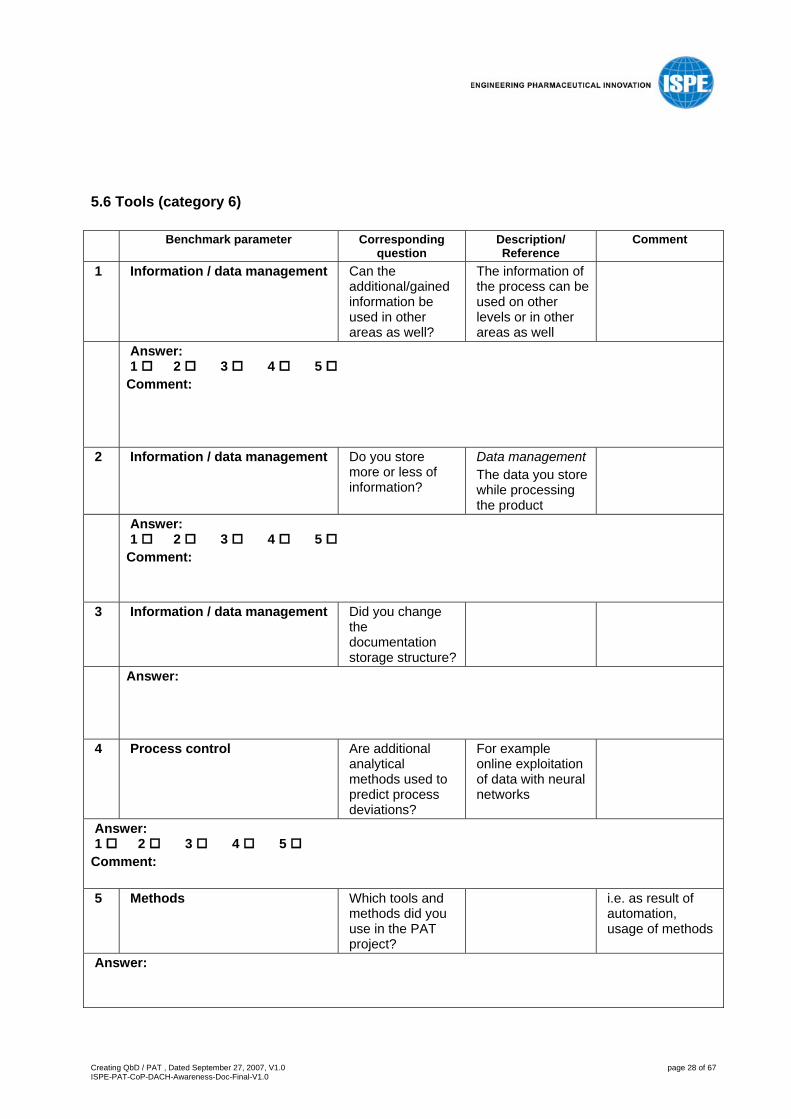
5.6 Tools (category 6)
Benchmark parameter Corresponding question
Description/ Reference
Comment
1 Information / data management Can the additional/gained information be used in other areas as well?
The information of the process can be used on other levels or in other areas as well
Answer: 1 2 3 4 5
Comment:
2 Information / data management Do you store more or less of information?
Data management The data you store while processing the product
Answer: 1 2 3 4 5
Comment:
3 Information / data management Did you change the documentation storage structure?
Answer:
4 Process control Are additional analytical methods used to predict process deviations?
For example online exploitation of data with neural networks
Answer: 1 2 3 4 5
Comment: 5 Methods Which tools and
methods did you use in the PAT project?
i.e. as result of automation, usage of methods
Answer:
Creating QbD / PAT , Dated September 27, 2007, V1.0 page 29 of 67 ISPE-PAT-CoP-DACH-Awareness-Doc-Final-V1.0
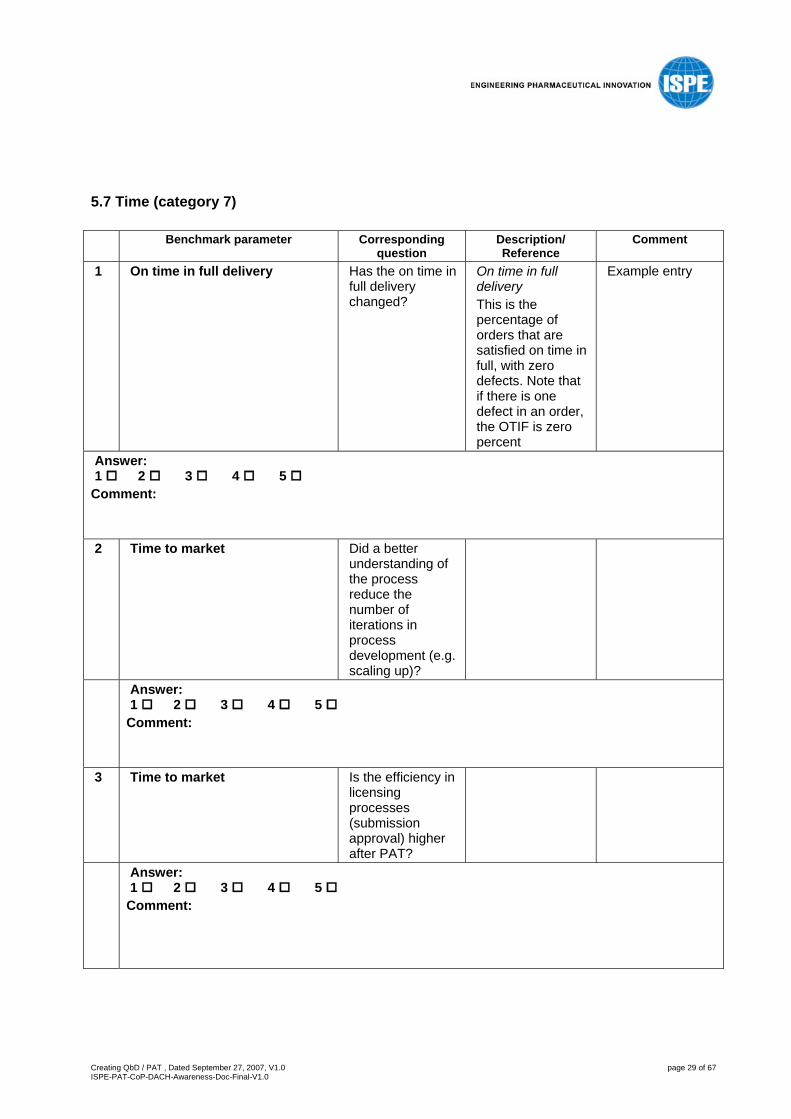
5.7 Time (category 7)
Benchmark parameter Corresponding question
Description/ Reference
Comment
1 On time in full delivery Has the on time in full delivery changed?
On time in full delivery This is the percentage of orders that are satisfied on time in full, with zero defects. Note that if there is one defect in an order, the OTIF is zero percent
Example entry
Answer: 1 2 3 4 5
Comment: 2 Time to market Did a better
understanding of the process reduce the number of iterations in process development (e.g. scaling up)?
Answer: 1 2 3 4 5
Comment:
3 Time to market Is the efficiency in licensing processes (submission approval) higher after PAT?
Answer: 1 2 3 4 5
Comment:

Creating QbD / PAT , Dated September 27, 2007, V1.0 page 30 of 67 ISPE-PAT-CoP-DACH-Awareness-Doc-Final-V1.0
5.8 Validation (category 8)
Benchmark parameter Corresponding question
Description/ Reference
Comment
1 Process/parameter changes What relief in validation efforts did you notice?
Answer: 1 2 3 4 5
Comment:
2 Process/parameter changes Did you change the validation approach?
e.g. switch of responsibilities in the organization
Answer: 1 2 3 4 5
Comment:
3 (Re)validation effort Did you reduce the effort for (re)validation (how much in percentage)?
Effort in (Re)validation (Re)validation is a regular requirement. The effort is the complete work you must do (manpower, paperwork, data generation etc.) to reinstate the validated status
Answer: 1 2 3 4 5
Comment:
4 Validation of software Has PAT changed your effort in validating your computer systems?
Answer: 1 2 3 4 5
Comment:

Creating QbD / PAT , Dated September 27, 2007, V1.0 page 31 of 67 ISPE-PAT-CoP-DACH-Awareness-Doc-Final-V1.0
5.9 Organization (category 9)
Benchmark parameter Corresponding question
Description/ Reference
Comment
1 Advantage to the competition Has the organization gained an advantage to the competition? If yes, is this advantage measurable?
Answer: 1 2 3 4 5
Comment:
2 Communication between departments
Is there a feedback from the changes in the commercial production to the development methodology applied in R&D?
Answer: 1 2 3 4 5
Comment:
3 Change in IT Department Did the switch to PAT have an impact on your IT department?
Answer: 1 2 3 4 5
Comment:
Creating QbD / PAT , Dated September 27, 2007, V1.0 page 32 of 67 ISPE-PAT-CoP-DACH-Awareness-Doc-Final-V1.0
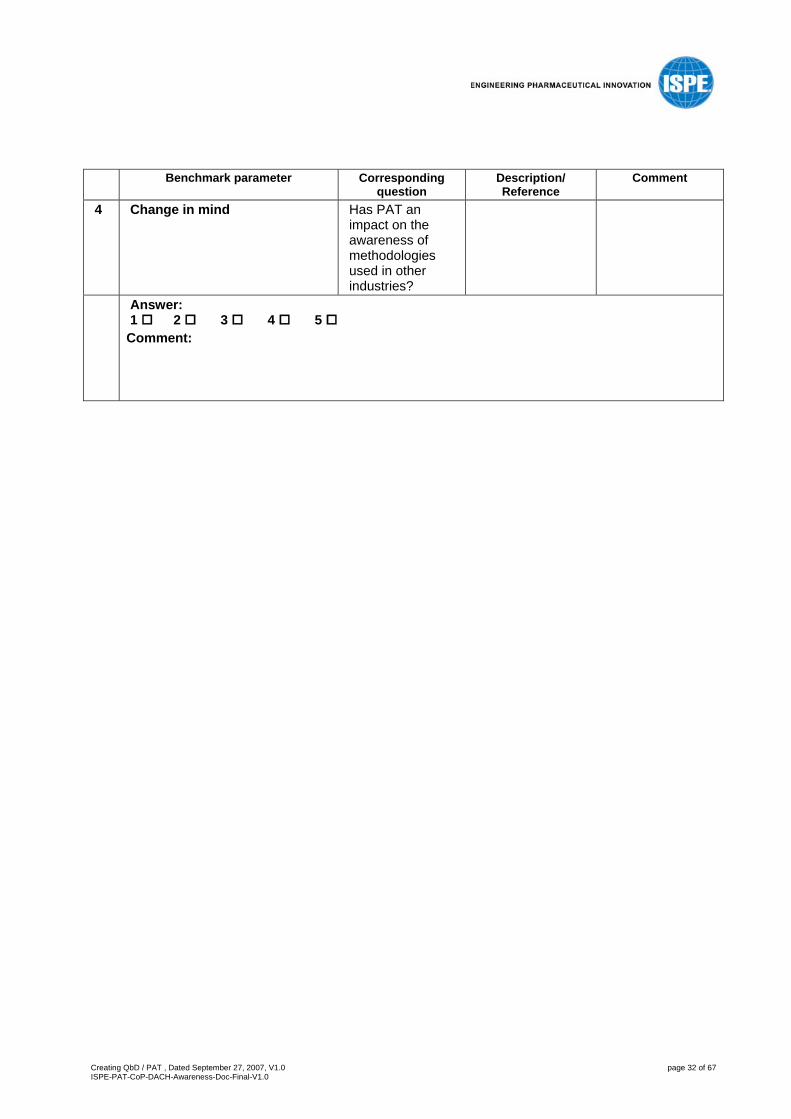
Benchmark parameter Corresponding question
Description/ Reference
Comment
4 Change in mind Has PAT an impact on the awareness of methodologies used in other industries?
Answer: 1 2 3 4 5
Comment:
Creating QbD / PAT , Dated September 27, 2007, V1.0 page 33 of 67 ISPE-PAT-CoP-DACH-Awareness-Doc-Final-V1.0
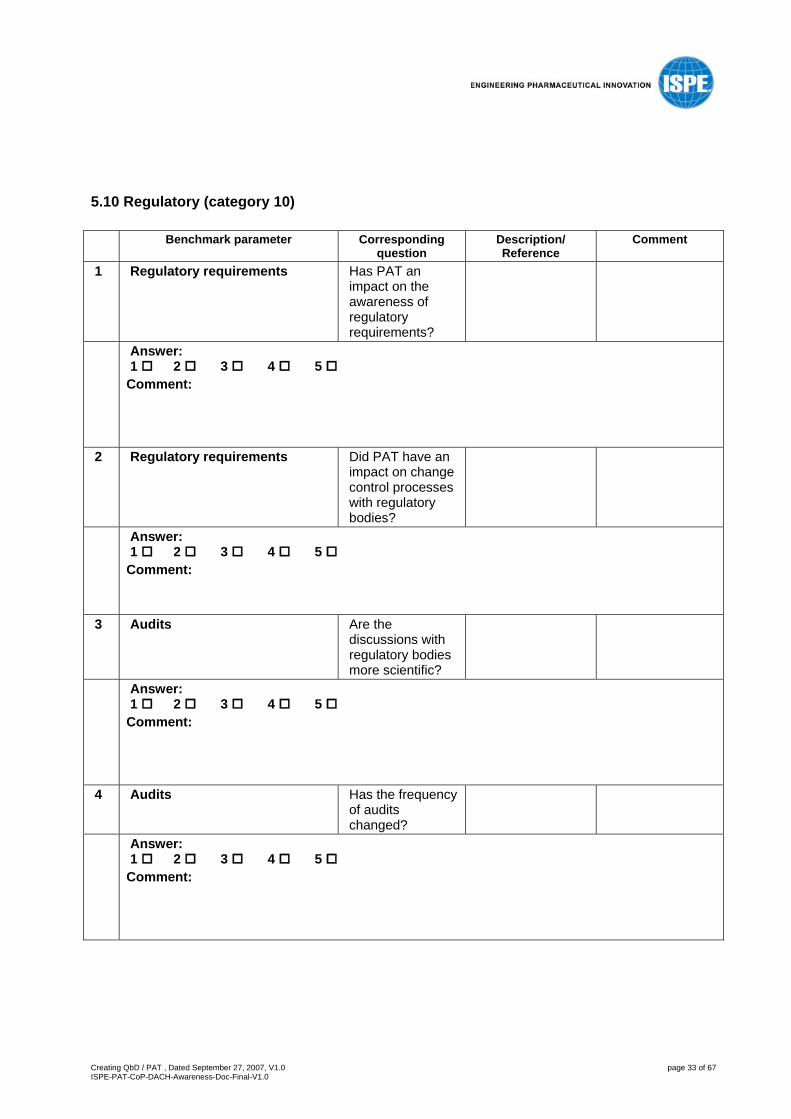
5.10 Regulatory (category 10)
Benchmark parameter Corresponding question
Description/ Reference
Comment
1 Regulatory requirements Has PAT an impact on the awareness of regulatory requirements?
Answer: 1 2 3 4 5
Comment:
2 Regulatory requirements Did PAT have an impact on change control processes with regulatory bodies?
Answer: 1 2 3 4 5
Comment:
3 Audits Are the discussions with regulatory bodies more scientific?
Answer: 1 2 3 4 5
Comment:
4 Audits Has the frequency of audits changed?
Answer: 1 2 3 4 5
Comment:

Creating QbD / PAT , Dated September 27, 2007, V1.0 page 34 of 67 ISPE-PAT-CoP-DACH-Awareness-Doc-Final-V1.0
Benchmark parameter Corresponding question
Description/ Reference
Comment
5 Documentation Has PAT an influence on the quality of documentation generated during development?
Answer: 1 2 3 4 5
Comment:
6 Documentation Has PAT changed your way of applying for registration?
Answer: 1 2 3 4 5
Comment:
7 Contact with regulatory bodies Did the time of first contact to regulatory bodies change?
Answer: 1 2 3 4 5
Comment:
8 Contact with regulatory bodies Did the regulatory body respond earlier than before?
Answer: 1 2 3 4 5
Comment:
Creating QbD / PAT , Dated September 27, 2007, V1.0 page 35 of 67 ISPE-PAT-CoP-DACH-Awareness-Doc-Final-V1.0
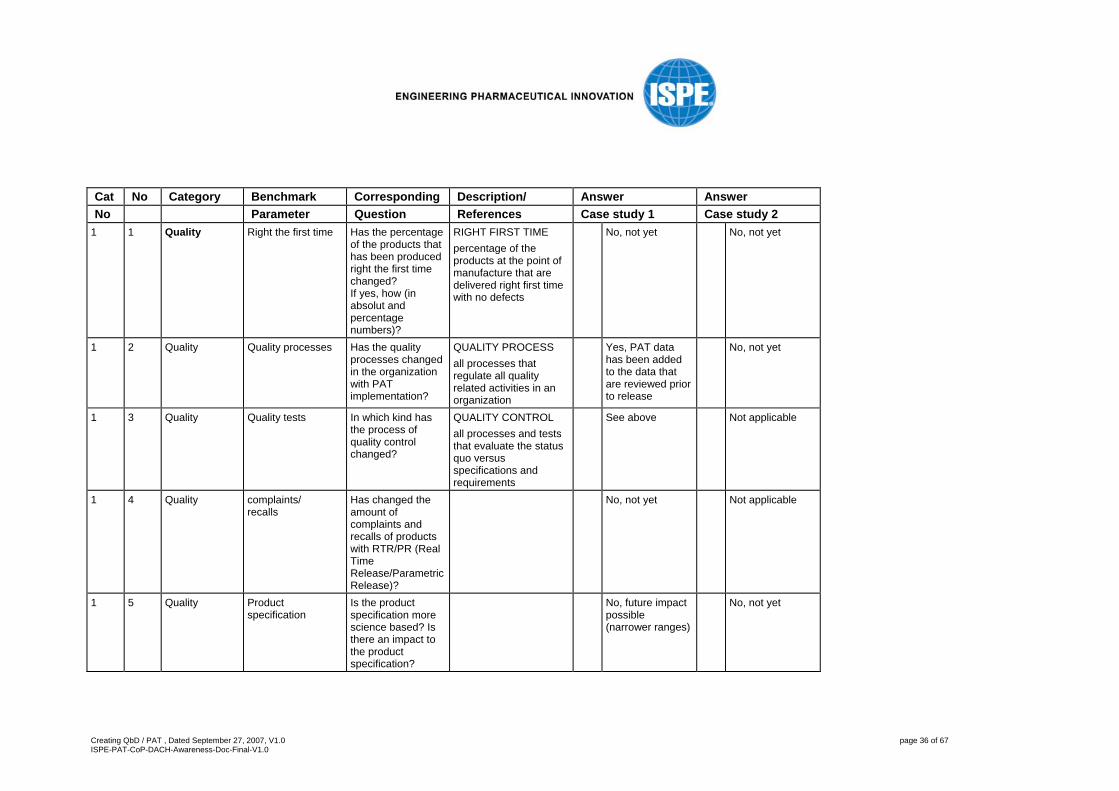
6 Appendix: Project Approach and Case Studies -- completed questionaires
6.1 Case Studies 1 to 2 Case study 1:
• PAT topic "Water Monitoring Freeze Drying" • Location / company Big Pharma, Switzerland • Interviewer Dr. Altermatt
Case study 2: • PAT topic “Blend Monitoring" • Location / company Big Pharma, Germany • Interviewer Dr. Christian Schmidt
Creating QbD / PAT , Dated September 27, 2007, V1.0 page 36 of 67 ISPE-PAT-CoP-DACH-Awareness-Doc-Final-V1.0
Cat No Category Benchmark Corresponding Description/ Answer Answer No Parameter Question References Case study 1 Case study 2
1 1 Quality Right the first time Has the percentage of the products that has been produced right the first time changed? If yes, how (in absolut and percentage numbers)?
RIGHT FIRST TIME percentage of the products at the point of manufacture that are delivered right first time with no defects
No, not yet No, not yet
1 2 Quality Quality processes Has the quality processes changed in the organization with PAT implementation?
QUALITY PROCESS all processes that regulate all quality related activities in an organization
Yes, PAT data has been added to the data that are reviewed prior to release
No, not yet
1 3 Quality Quality tests In which kind has the process of quality control changed?
QUALITY CONTROL all processes and tests that evaluate the status quo versus specifications and requirements
See above Not applicable
1 4 Quality complaints/ recalls
Has changed the amount of complaints and recalls of products with RTR/PR (Real Time Release/Parametric Release)?
No, not yet Not applicable
1 5 Quality Product specification
Is the product specification more science based? Is there an impact to the product specification?
No, future impact possible (narrower ranges)
No, not yet

Creating QbD / PAT , Dated September 27, 2007, V1.0 page 37 of 67 ISPE-PAT-CoP-DACH-Awareness-Doc-Final-V1.0
Cat No Category Benchmark Corresponding Description/ Answer Answer No Parameter Question References Case study 1 Case study 2
1 6 Quality Product specification R&D
Does the developing of the product specification change with PAT?
Not applicable Yes, if term specification is meant in a broader perspective of intermediate and end product specifications
2 1 Process Cycle Time Hour Has the cycle time changed? If yes, how (in absolut and percentage numbers)?
CYCLE TIME HOURS This is the total time from commencing manufacture to delivering products to the customer which in many cases is the factory warehouse.
Elonged time due to additional process step
Not applicable
2 2 Process Productivity Increase
Could a better understanding of the variability of a measurement lead to earlier transition to the next unit operation?
None Not applicable Theoretically yes, but times are in the order of minutes
2 3 Process Process Parameters
Has there be identified new important process parameters or correlations between process parameters?
None No No
2 4 Process Implementation of new technologies
Has there been implemented new technologies in the process?
Yes, the PAT tool
2 5 Process Process Parameters
Has there been any adjustments to known process parameters?
Yes
2 6 Process Process Understanding
Was it possible to increase process understanding?
Yes
Creating QbD / PAT , Dated September 27, 2007, V1.0 page 38 of 67 ISPE-PAT-CoP-DACH-Awareness-Doc-Final-V1.0
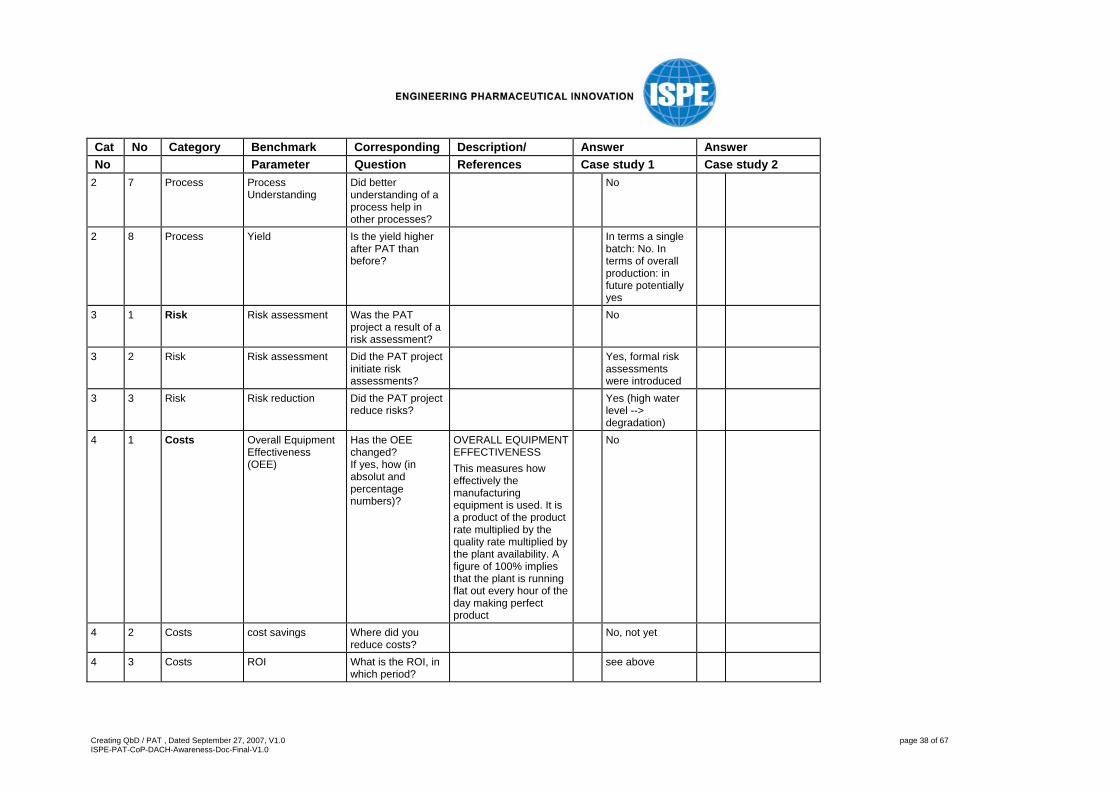
Cat No Category Benchmark Corresponding Description/ Answer Answer No Parameter Question References Case study 1 Case study 2
2 7 Process Process Understanding
Did better understanding of a process help in other processes?
No
2 8 Process Yield Is the yield higher after PAT than before?
In terms a single batch: No. In terms of overall production: in future potentially yes
3 1 Risk Risk assessment Was the PAT project a result of a risk assessment?
No
3 2 Risk Risk assessment Did the PAT project initiate risk assessments?
Yes, formal risk assessments were introduced
3 3 Risk Risk reduction Did the PAT project reduce risks?
Yes (high water level --> degradation)
4 1 Costs Overall Equipment Effectiveness (OEE)
Has the OEE changed? If yes, how (in absolut and percentage numbers)?
OVERALL EQUIPMENT EFFECTIVENESS This measures how effectively the manufacturing equipment is used. It is a product of the product rate multiplied by the quality rate multiplied by the plant availability. A figure of 100% implies that the plant is running flat out every hour of the day making perfect product
No
4 2 Costs cost savings Where did you reduce costs?
No, not yet
4 3 Costs ROI What is the ROI, in which period?
see above

Creating QbD / PAT , Dated September 27, 2007, V1.0 page 39 of 67 ISPE-PAT-CoP-DACH-Awareness-Doc-Final-V1.0
Cat No Category Benchmark Corresponding Description/ Answer Answer No Parameter Question References Case study 1 Case study 2
5 1 Personnel personnel security Could you improve the operator or/and product safety?
No change
5 2 Personnel Automation versus human interaction
Could number of personnel be reduced?
None No
6 1 Tools Information/ Data Management
Can the additional / gained information be used in other areas as well?
The information of the process can be used on other levels or in other areas as well.
Yes, for other freeze drying processes
6 2 Tools process control Where are analytical methods used to predict process deviations?
For example on-line exploitation of data with neural networks
No
6 3 Tools Information/ Data Management
Has changed the data management with the project? Do you store more or less of information? Did you change the documentation storage structure?
DATA MANAGEMENT The data you store while processing the product
Yes, more data is currently stored. Need for storing all data under discussion
6 5 Tools methods Which tools and methods did you use in the PAT project?
NIR, MVDA
7 1 Time On Time In Full delivery
Has the On Time in Full delivery changed? If yes, how (in absolut and percentage numbers)?
ON TIME IN FULL DELIVERY This is the percentage of orders that are satisfied On Time In Full, with zero defects. Note that if there is one defect in an order, the OTIF is zero percent
No

Creating QbD / PAT , Dated September 27, 2007, V1.0 page 40 of 67 ISPE-PAT-CoP-DACH-Awareness-Doc-Final-V1.0
Cat No Category Benchmark Corresponding Description/ Answer Answer No Parameter Question References Case study 1 Case study 2
7 2 Time Time to market Could a better understanding of the process reduce the number of iterations in process development (e.g. scaling up)?
None Yes
7 3 Time Time to market Is the efficiency in licencing processes (submission approval) higher after PAT?
Not applicable
8 1 Validation Process / Parameter Changes
Is a relief in validation efforts noticeable? If yes in which way?
None No
8 2 Validation Process / Parameter Changes
Did you change the validation approach (switch of responsibilities in the organization)? If yes, how did you change?
None No, not yet
8 3 Validation (Re)validation effort Did you reduce the effort for (re)validation (how much in percentage)?
EFFORT IN (RE)VALIDATION (Re)validation is a regular requirement. The effort is the complete work you must do (manpower, paperwork, data generation, etc.)
No
8 4 Validation Validation of Software
Has PAT changed your effort in validating your computer systems?
No

Creating QbD / PAT , Dated September 27, 2007, V1.0 page 41 of 67 ISPE-PAT-CoP-DACH-Awareness-Doc-Final-V1.0
Cat No Category Benchmark Corresponding Description/ Answer Answer No Parameter Question References Case study 1 Case study 2
9 1 Organization Advantage to the competition
Has the organization gained an advantage to the competition? If yes, is this advantage measurable?
None No
9 2 Organization Communication between departments
Is there a feedback from the changes in the commercial production to the development methodology applied in R&D ?
Yes, PAT philosophy introduced into R&D
9 3 Organization Change in IT department
Did changing to PAT have an impact on your IT department?
No
9 4 (not evaluated in case 1-4)
10 1 Regulatory regulatory requirements
Has PAT an impact on the awareness of regulatory requirements?
No
10 2 Regulatory regulatory requirements
Did PAT have an impact on change control processes with regulatory bodies?
No
10 3 Regulatory audits Is there a more scientific discussion with regulatory bodies possible?
Not applicable
10 4 Regulatory audits Has the frequency of audits changed?
No
10 5 Regulatory documentation Has PAT an influence on the quality of documentation during development?
Not applicable
Creating QbD / PAT , Dated September 27, 2007, V1.0 page 42 of 67 ISPE-PAT-CoP-DACH-Awareness-Doc-Final-V1.0
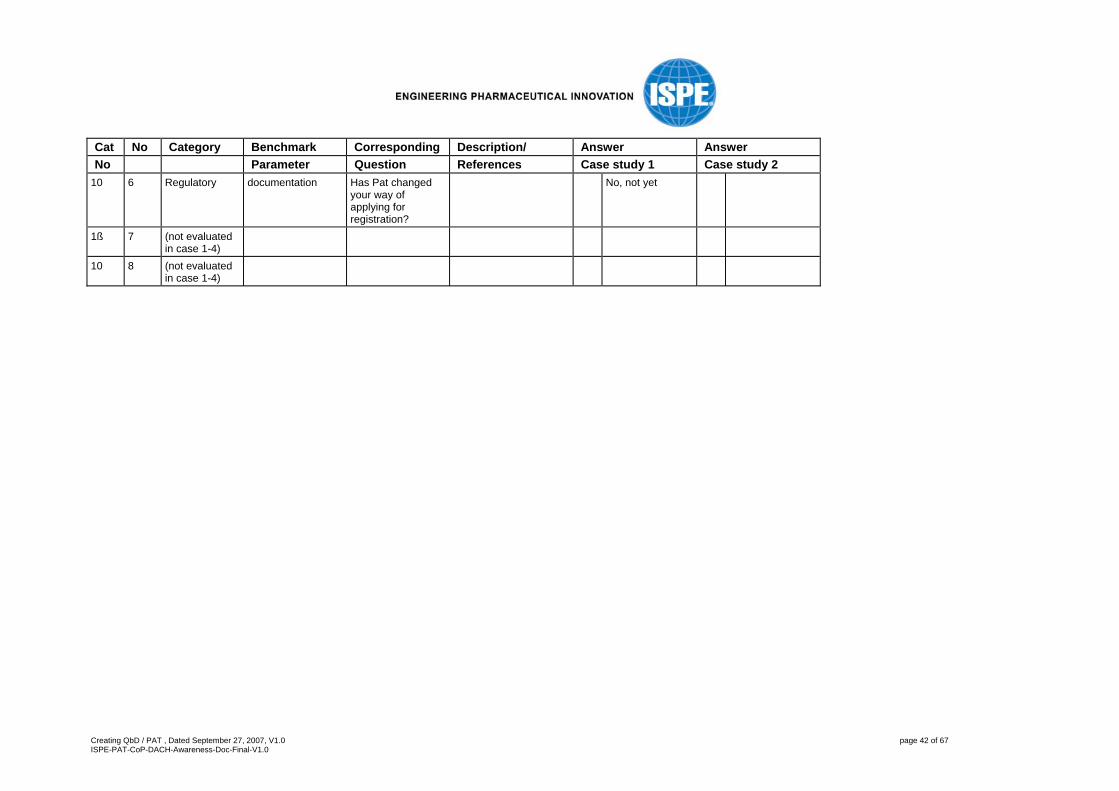
Cat No Category Benchmark Corresponding Description/ Answer Answer No Parameter Question References Case study 1 Case study 2
10 6 Regulatory documentation Has Pat changed your way of applying for registration?
No, not yet
1ß 7 (not evaluated in case 1-4)
10 8 (not evaluated in case 1-4)

Creating QbD / PAT , Dated September 27, 2007, V1.0 page 43 of 67 ISPE-PAT-CoP-DACH-Awareness-Doc-Final-V1.0
6.2 Case Studies 3 to 6 Case study 3:
• PAT topic “PAT in Capsule & Tablet Manufacturing” • Location / company Big Pharma, Europe • Interviewer Christian Woelbeling
Case study 4: • PAT topic PAT in Manufacturing • Location / company Big Pharma, Europe • Interviewer Disclosed
Case study 5: • PAT topic “PAT for secondary operations (formulation filling and freeze drying)” • Location / company Big Pharma, Belgium • Interviewer Disclosed
Case study 6: • PAT topic PAT for Research and Development • Location / company Big Pharma , Germany • Interviewer Disclosed

Creating QbD / PAT , Dated September 27, 2007, V1.0 page 44 of 67 ISPE-PAT-CoP-DACH-Awareness-Doc-Final-V1.0
Cat No Category Benchmark Corresponding Description/ Answer Answer Answer Answer No Parameter Question References Case Study 3 Case Study 4 Case Study 5 Case Study 6
0 1 Type of
Project What is the environment of the project?
Prod Final release drug product
R&D The project is in R&D at the moment, but will go right through to production.
R&D
0 2 Status of the project
What phase is the project in?
Ong Pending start-up inspection
Ong At the moment the first tests in industrial scale take place (looking for proof of concept). However there is already knowledge gained out of it.
other
Method successful established for scale up. No products for scale up at the moment. No benefit for usage of “old” products during routine production.
1 1 Right the first time
Has the fraction of the products that has been produced right the first time changed?
Right first time percentage of the products at the point of manufacture that are delivered right first time with no defects
4 Additional testing, during manufacturing, still end product testing, more knowledge. Improvement: No surprises during end product testing, only confirmation, Only 1 out of 500 out of spec batches.
- Not yet in commercial production mode, but this is expected, due to implementation of feedback control.
1 At the moment there is only monitoring of moisture inside the dryer. The expectation is that at the beginning there will be an increase of rejects, because the process is more closely watched. Then through CAPA, eventually the process will become more robust and “right the first time” will increase.
- No relevant products at the moment.
Creating QbD / PAT , Dated September 27, 2007, V1.0 page 45 of 67 ISPE-PAT-CoP-DACH-Awareness-Doc-Final-V1.0
Cat No Category Benchmark Corresponding Description/ Answer Answer Answer Answer No Parameter Question References Case Study 3 Case Study 4 Case Study 5 Case Study 6
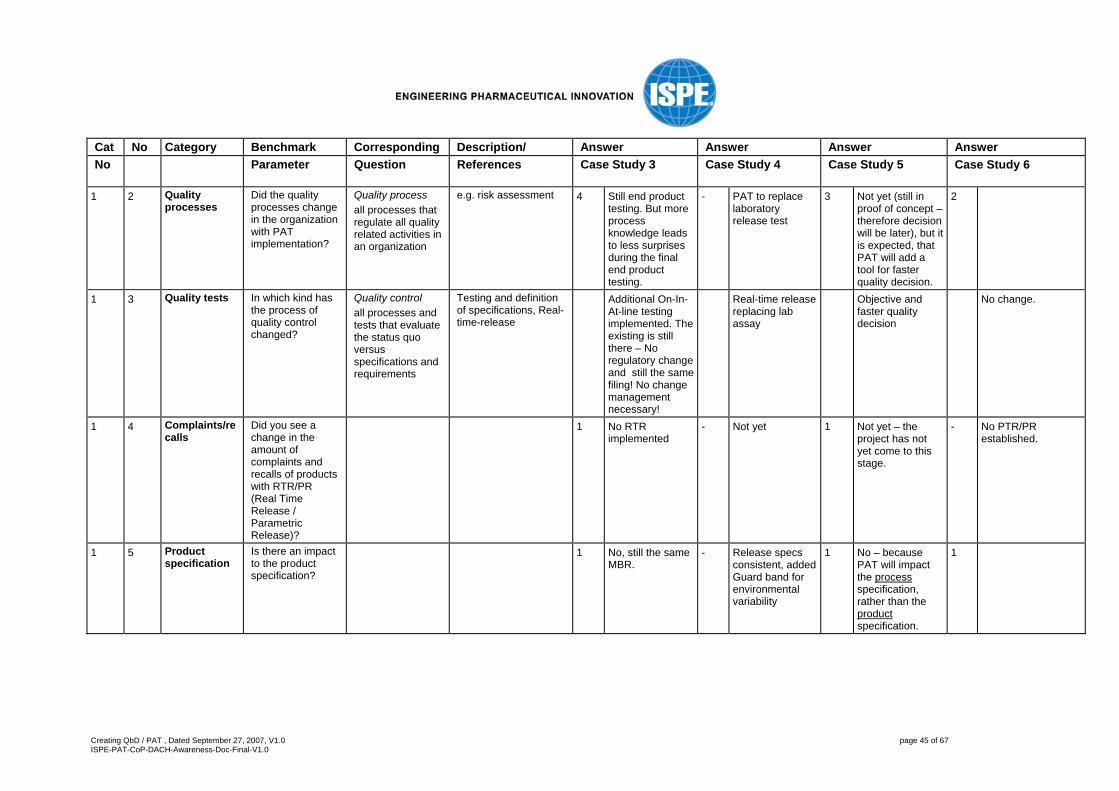
1 2 Quality
processes Did the quality processes change in the organization with PAT implementation?
Quality process all processes that regulate all quality related activities in an organization
e.g. risk assessment 4 Still end product testing. But more process knowledge leads to less surprises during the final end product testing.
- PAT to replace laboratory release test
3 Not yet (still in proof of concept – therefore decision will be later), but it is expected, that PAT will add a tool for faster quality decision.
2
1 3 Quality tests In which kind has the process of quality control changed?
Quality control all processes and tests that evaluate the status quo versus specifications and requirements
Testing and definition of specifications, Real-time-release
Additional On-In-At-line testing implemented. The existing is still there – No regulatory change and still the same filing! No change management necessary!
Real-time release replacing lab assay
Objective and faster quality decision
No change.
1 4 Complaints/recalls
Did you see a change in the amount of complaints and recalls of products with RTR/PR (Real Time Release / Parametric Release)?
1 No RTR implemented
- Not yet 1 Not yet – the project has not yet come to this stage.
- No PTR/PR established.
1 5 Product specification
Is there an impact to the product specification?
1 No, still the same MBR.
- Release specs consistent, added Guard band for environmental variability
1 No – because PAT will impact the process specification, rather than the product specification.
1

Creating QbD / PAT , Dated September 27, 2007, V1.0 page 46 of 67 ISPE-PAT-CoP-DACH-Awareness-Doc-Final-V1.0
Cat No Category Benchmark Corresponding Description/ Answer Answer Answer Answer No Parameter Question References Case Study 3 Case Study 4 Case Study 5 Case Study 6
1 6 Product
specification Is the product specification more science based?
1 The new analytical tests are more science based, but full science based approach is only for new products under development.
- Yes, the use of the PAT release test was integral to discussions about appropriate specifications.
1 The process specification is more science based (specific to vaccines, because of very diluted active ingredients)
- No change in product specification.
1 7 Product specification R&D
Is the development of product specification changed with PAT?
5 Change in the future with the new filings under new PAT FDA approach!
- PAT for real-time monitoring of quality
1 See above - No product in development at the moment.
1 8 OOS Did you see a change in the number of OOS incidences?
5 Dramatic reduction. The project brought OOS nearly to 0! Process improvement!
- Not yet 1 No – not far enough at the moment.
1
2 1 Cycle time Has the cycle time changed?
Cycle time this is the total time from commencing manufacture to delivering products to the customer which in many cases is the factory warehouse
5 Yes, streamlined the process, much shorter cycle times, proved by evaluations!
- Not anticipated to change significantly, but there will be some decrease arising from the elimination of intermediate off-line testing (particularly during start-up).
3 No feedback at the moment, but the aim is yes – lower (faster quality decision)
1
2 2 Productivity increase
Did a better understanding of the variability of a measurement result in an earlier transition to the next unit operation?
5 Key point/benefit, WIP is no longer in unknown status.
- Expected to provide better control and provide process understanding, but not increased productivity
3 YES - Not applicable
Creating QbD / PAT , Dated September 27, 2007, V1.0 page 47 of 67 ISPE-PAT-CoP-DACH-Awareness-Doc-Final-V1.0
Cat No Category Benchmark Corresponding Description/ Answer Answer Answer Answer No Parameter Question References Case Study 3 Case Study 4 Case Study 5 Case Study 6
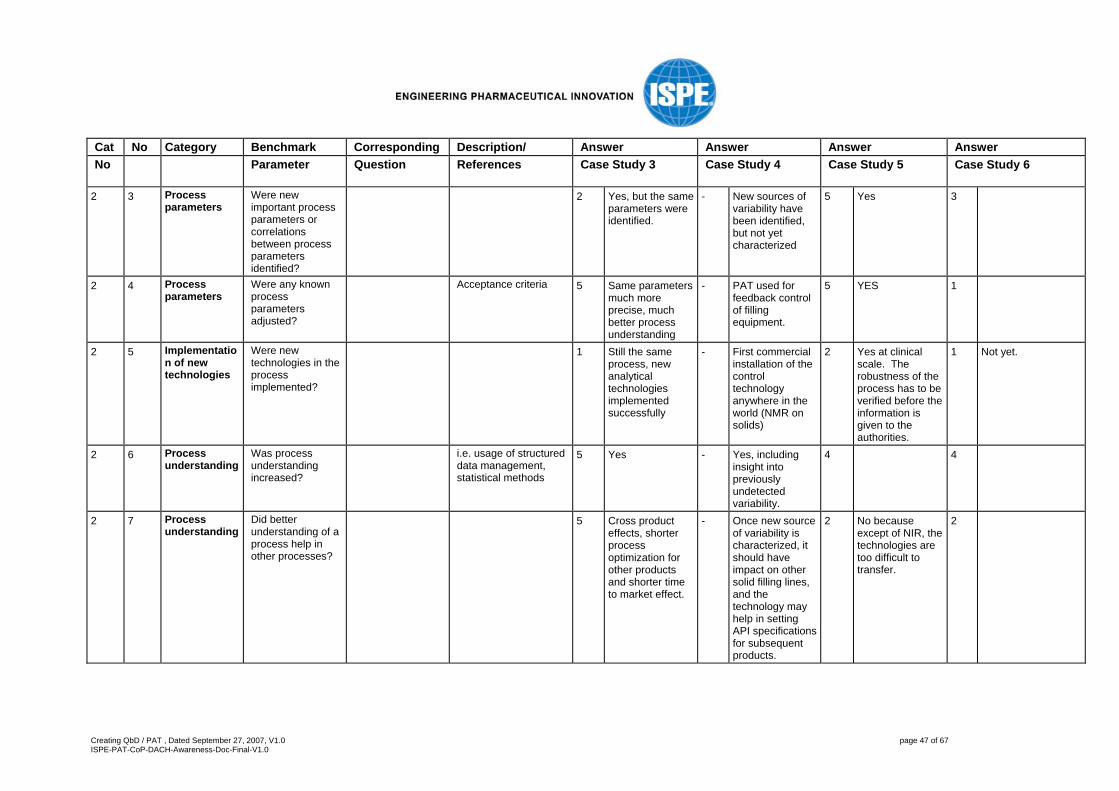
2 3 Process
parameters Were new important process parameters or correlations between process parameters identified?
2 Yes, but the same parameters were identified.
- New sources of variability have been identified, but not yet characterized
5 Yes 3
2 4 Process parameters
Were any known process parameters adjusted?
Acceptance criteria 5 Same parameters much more precise, much better process understanding
- PAT used for feedback control of filling equipment.
5 YES 1
2 5 Implementation of new technologies
Were new technologies in the process implemented?
1 Still the same process, new analytical technologies implemented successfully
- First commercial installation of the control technology anywhere in the world (NMR on solids)
2 Yes at clinical scale. The robustness of the process has to be verified before the information is given to the authorities.
1 Not yet.
2 6 Process understanding
Was process understanding increased?
i.e. usage of structured data management, statistical methods
5 Yes - Yes, including insight into previously undetected variability.
4 4
2 7 Process understanding
Did better understanding of a process help in other processes?
5 Cross product effects, shorter process optimization for other products and shorter time to market effect.
- Once new source of variability is characterized, it should have impact on other solid filling lines, and the technology may help in setting API specifications for subsequent products.
2 No because except of NIR, the technologies are too difficult to transfer.
2

Creating QbD / PAT , Dated September 27, 2007, V1.0 page 48 of 67 ISPE-PAT-CoP-DACH-Awareness-Doc-Final-V1.0
Cat No Category Benchmark Corresponding Description/ Answer Answer Answer Answer No Parameter Question References Case Study 3 Case Study 4 Case Study 5 Case Study 6
2 8 Yield Is the yield higher
after PAT than before?
- 3 for the process itself and 5 for no more lost batches!!
- No. 1 Would not sell Pat as a project that will increase yield. PAT is more a tool to increase compliance and quality, rather than yield.
1
2 9 Process control
Did you find additional possibilities to control the process?
1 No changes in the process control
- No 4 Yes 4 Part of the process could be controlled by NIR.
3 1 Risk assessment
Was the PAT project a result of a risk assessment?
5 Risk assessment made for market supply – Economic Risk assessment! But the Assessment was made already 15 years ago.
- No. A rigorous FMEA was developed as part of the PAT installation.
3 There was a good knowledge of the process – Risk Analysis was already done
3
3 2 Risk assessment
Did the PAT project initiate risk assessments?
1 No additional in this project. Other projects with Risk assessment already before the PAT initiative. Confirmation of the chosen approach.
- Yes. 1 No because it was already done for process validation
2
3 3 Risk reduction Did the PAT project reduce risks?
5 Yes, supply is with the new more robust and secured!!
- Anticipated this will be the case.
4 Yes 5

Creating QbD / PAT , Dated September 27, 2007, V1.0 page 49 of 67 ISPE-PAT-CoP-DACH-Awareness-Doc-Final-V1.0
Cat No Category Benchmark Corresponding Description/ Answer Answer Answer Answer No Parameter Question References Case Study 3 Case Study 4 Case Study 5 Case Study 6
4 1 Overall
equipment effectiveness (OEE)
Has the OEE changed?
Overall equipment effectiveness This measures how effectively the manufacturing equipment is used. It is a product of the product rate multiplied by the quality rate multiplied by the plant availability. A figure of 100% implies that the plant is running flat out every hour of the day making perfect products
Example entry 4 Streamlined the manufacturing
- Anticipated that this will be the case
1 Increase, return on investment is questionable. There is a question of what is more important: quality and compliance or costs.
1
4 2 Cost savings Where did you reduce costs?
Personnel, equipment, QC, raw material etc.
Minimized WIP/Work in Process Less rejected batches Early detection of variability of raw material. New detected / invented critical parameter resulted in a new parameter for the specification. - > Hugh saving by early detection Minimizing QC testing by moving it to the plant
Expected savings in recovery of partial lots and elimination (or at least decrease) in off-line testing.
Cost could be saved due to faster decision on good/bad product.
No reduction in costs till now.
Creating QbD / PAT , Dated September 27, 2007, V1.0 page 50 of 67 ISPE-PAT-CoP-DACH-Awareness-Doc-Final-V1.0
Cat No Category Benchmark Corresponding Description/ Answer Answer Answer Answer No Parameter Question References Case Study 3 Case Study 4 Case Study 5 Case Study 6
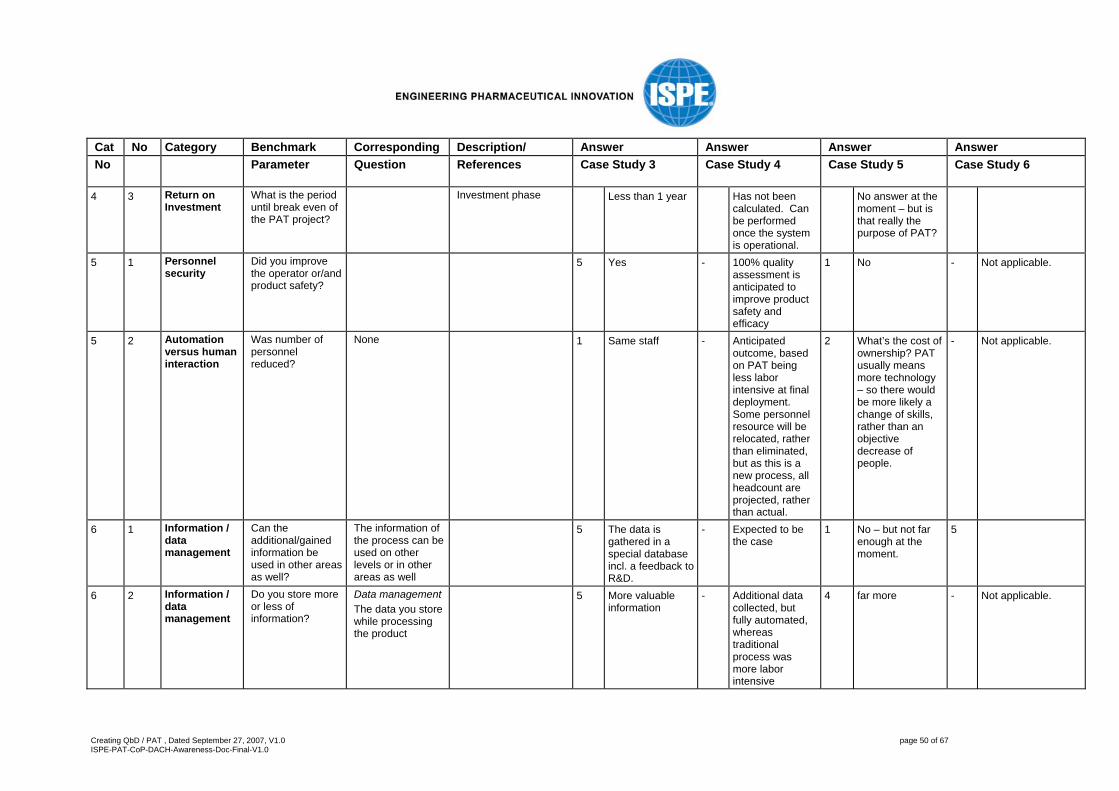
4 3 Return on
Investment What is the period until break even of the PAT project?
Investment phase Less than 1 year Has not been calculated. Can be performed once the system is operational.
No answer at the moment – but is that really the purpose of PAT?
5 1 Personnel security
Did you improve the operator or/and product safety?
5 Yes - 100% quality assessment is anticipated to improve product safety and efficacy
1 No - Not applicable.
5 2 Automation versus human interaction
Was number of personnel reduced?
None 1 Same staff - Anticipated outcome, based on PAT being less labor intensive at final deployment. Some personnel resource will be relocated, rather than eliminated, but as this is a new process, all headcount are projected, rather than actual.
2 What’s the cost of ownership? PAT usually means more technology – so there would be more likely a change of skills, rather than an objective decrease of people.
- Not applicable.
6 1 Information / data management
Can the additional/gained information be used in other areas as well?
The information of the process can be used on other levels or in other areas as well
5 The data is gathered in a special database incl. a feedback to R&D.
- Expected to be the case
1 No – but not far enough at the moment.
5
6 2 Information / data management
Do you store more or less of information?
Data management The data you store while processing the product
5 More valuable information
- Additional data collected, but fully automated, whereas traditional process was more labor intensive
4 far more - Not applicable.

Creating QbD / PAT , Dated September 27, 2007, V1.0 page 51 of 67 ISPE-PAT-CoP-DACH-Awareness-Doc-Final-V1.0
Cat No Category Benchmark Corresponding Description/ Answer Answer Answer Answer No Parameter Question References Case Study 3 Case Study 4 Case Study 5 Case Study 6
6 3 Information /
data management
Did you change the documentation storage structure?
PAT data in Batch Documentation added. PAT data is in a separate DB and printed out.
Incorporated directly into DCS
4 Yes – adapt some servers
Not applicable.
6 4 Process control
Are additional analytical methods used to predict process deviations?
For example online exploitation of data with neural networks
5 Yes new analytical methods were invented and used for the process control.
- Much higher data density, but no additional methods aside from PAT
4 Yes – more long term quality input - trend analysis
1
6 5 Methods Which tools and methods did you use in the PAT project?
i.e. as result of automation, usage of methods
Method: NIR – API content Method: Accelerated dissolution - film quality Method: Laser defraction - Particle size measurement
Not clear in the objective of this question.
Plasma system, NIR, two other technologies, but no further description because of Intellectual Property.
Mass spectrometry
7 1 On time in full delivery
Has the on time in full delivery changed?
On time in full delivery This is the percentage of orders that are satisfied on time in full, with zero defects. Note that if there is one defect in an order, the OTIF is zero percent
Example entry 4 - Likely to increase due to real-time quality assessment
3 No feedback at the moment – target is to increase
- Not applicable.

Creating QbD / PAT , Dated September 27, 2007, V1.0 page 52 of 67 ISPE-PAT-CoP-DACH-Awareness-Doc-Final-V1.0
Cat No Category Benchmark Corresponding Description/ Answer Answer Answer Answer No Parameter Question References Case Study 3 Case Study 4 Case Study 5 Case Study 6
7 2 Time to
market Did a better understanding of the process reduce the number of iterations in process development (e.g. scaling up)?
5 Yes, main project driver. Also cross product benefits realized.
- Will probably actually add resources initially to understand and characterize sensor response and process variability
1 PAT will not be a big driver to reduce time to market. It will make the process more robust, but this will not have a great impact on timing.
- Not applicable.
7 3 Time to market
Is the efficiency in licensing processes (submission approval) higher after PAT?
- Can not be answered yet, due to ongoing submissions under new FDA QbD PAT approach.
- Yet to be determined
4 Yes - Not applicable.
8 1 Process/parameter changes
What relief in validation efforts did you notice?
2 Still traditional validation. There is more confidence in the Validation approach, but no relief in the validation efforts.
- Not yet known 4 - Not applicable.
8 2 Process/parameter changes
Did you change the validation approach?
e.g. switch of responsibilities in the organization
1 No change. - Added PAT characterization to process validation
1 Not yet – but will be
- Not yet.
8 3 (Re)validation effort
Did you reduce the effort for (re)validation (how much in percentage)?
Effort in (Re)validation (Re)validation is a regular requirement. The effort is the complete work you must do (manpower, paperwork, data generation etc.) to reinstate the validated status
1 Still the same approach.
- Yet to be determined
- Not far enough – target, but no feedback.
1

Creating QbD / PAT , Dated September 27, 2007, V1.0 page 53 of 67 ISPE-PAT-CoP-DACH-Awareness-Doc-Final-V1.0
Cat No Category Benchmark Corresponding Description/ Answer Answer Answer Answer No Parameter Question References Case Study 3 Case Study 4 Case Study 5 Case Study 6
8 4 Validation of
software Has PAT changed your effort in validating your computer systems?
5 More analytical devices result in higher validation efforts.
- Imposed additional CSV testing for PAT system
1 No 1
9 1 Advantage to the competition
Has the organization gained an advantage to the competition? If yes, is this advantage measurable?
5 Main driver was the shorter Time To Market.
- Not a high priority for this installation.
4 1
9 2 Communication between departments
Is there a feedback from the changes in the commercial production to the development methodology applied in R&D?
4 Still room for improvement
- R&D “owned” process control strategy and partnered in PAT development.
4 5
9 3 Change in IT Department
Did the switch to PAT have an impact on your IT department?
5 Yes, additional SW to manage, higher data volume etc.
- Not particularly 1 1
9 4 Change in mind
Has PAT an impact on the awareness of methodologies used in other industries?
5 Yes, learning from others in the competence team.
- Installation has raised awareness and visibility of PAT, but not particularly from other industries.
3 It’s coming, but it takes time
4

Creating QbD / PAT , Dated September 27, 2007, V1.0 page 54 of 67 ISPE-PAT-CoP-DACH-Awareness-Doc-Final-V1.0
Cat No Category Benchmark Corresponding Description/ Answer Answer Answer Answer No Parameter Question References Case Study 3 Case Study 4 Case Study 5 Case Study 6
10 1 Regulatory
requirements Has PAT an impact on the awareness of regulatory requirements?
5 Following the new FDA Risk based and PAT oriented paradigm change.
- PAT installation is facilitating discussion with regulatory agencies regarding changing expectations for submissions, particularly with respect to risk management.
1 No, there is not much difference in filing a PAT application, because the description of the process is not so big. CMC section will be bigger
3
10 2 Regulatory requirements
Did PAT have an impact on change control processes with regulatory bodies?
5 Submission ongoing according to new PAT Guidance.
- Expected to be the case
- Not yet - Not applicable.
10 3 Audits Are the discussions with regulatory bodies more scientific?
5 Yes, lot of interactive discussions on a high scientific level.
- yes 3 It depends on authorities and inspector.
- Not applicable.
10 4 Audits Has the frequency of audits changed?
1 No change - Anticipated to decrease, but has not yet transpired.
1 No 1
10 5 Docu-mentation
Has PAT an influence on the quality of documentation generated during development?
5 More precise Documents in R&D, justification for docs and better process description, better validation of the CPP ranges, explanation of the process and the process understanding increased and is more extensive
- Documentation quality hasn’t changed, but additional development data was required.
3 Yes 3

Creating QbD / PAT , Dated September 27, 2007, V1.0 page 55 of 67 ISPE-PAT-CoP-DACH-Awareness-Doc-Final-V1.0
Cat No Category Benchmark Corresponding Description/ Answer Answer Answer Answer No Parameter Question References Case Study 3 Case Study 4 Case Study 5 Case Study 6
10 6 Docu-
mentation Has PAT changed your way of applying for registration?
5 Yes in New products!
- Lilly discussions with regulatory bodies were more forthcoming and technical than traditionally
3 Especially validation of methods will increase.
1
10 7 Contact with regulatory bodies
Did the time of first contact to regulatory bodies change?
5 Yes in very early stage, during filing/submission phase.
- PAT discussions were held separately (and earlier) from traditional regulatory conversations to ensure PAT did not become bottleneck to submission conversations.
1 No 1
10 8 Contact with regulatory bodies
Did the regulatory body respond earlier than before?
5 Yes very interested, educate the EU authorities with the chosen approach!
- Responded in mutually agreed timeframe.
- No feedback yet. 1

Creating QbD / PAT , Dated September 27, 2007, V1.0 page 56 of 67 ISPE-PAT-CoP-DACH-Awareness-Doc-Final-V1.0
6.3 Case Studies 7 to 8 Case study 7:
• PAT topic “PAT Case Study from prior company As of April, 2005, PAT Pilot” • Location / company Big Pharma, Global • Interviewer David Radspinner
Case study 8: • PAT topic PAT in R&D Environment • Location / company Big Pharma , Europe • Interviewer Disclosed
Cat No Category Benchmark Corresponding Description/ Answer Answer No Parameter Question References Case study 7 Case study 8
0 1 Type of Project
What is the environment of the project?
Prod Driven by Quality organization
Prod
0 2 Status of the project
What phase is the project in?
Ong As of April, 2005 Ong Study phase
1 1 Right the first time
Has the fraction of the products that has been produced right the first time changed?
Right first time percentage of the products at the point of manufacture that are delivered right first time with no defects
- Not disclosed Not yet implemented in routine production
1 2 Quality processes
Did the quality processes change in the organization with PAT implementation?
Quality process all processes that regulate all quality related activities in an organization
e.g. risk assessment 4 Systems remain the same, but adapted to reflect a risk-based approach
1
Creating QbD / PAT , Dated September 27, 2007, V1.0 page 57 of 67 ISPE-PAT-CoP-DACH-Awareness-Doc-Final-V1.0
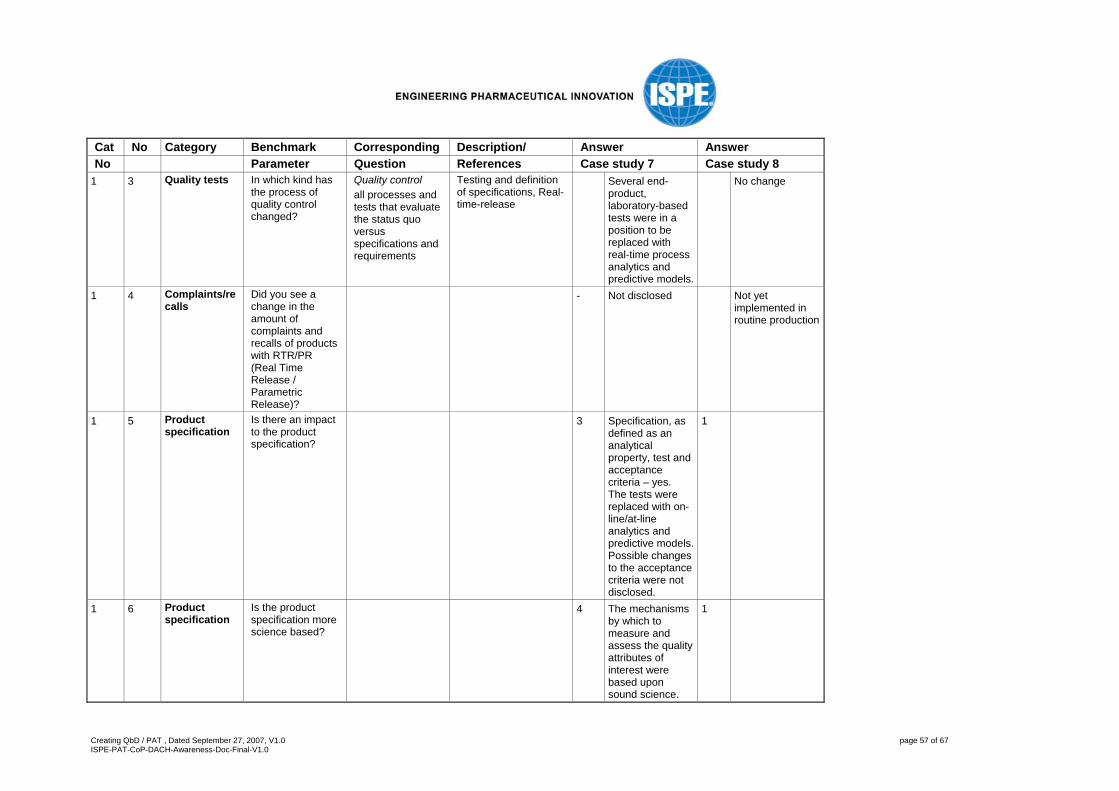
Cat No Category Benchmark Corresponding Description/ Answer Answer No Parameter Question References Case study 7 Case study 8
1 3 Quality tests In which kind has the process of quality control changed?
Quality control all processes and tests that evaluate the status quo versus specifications and requirements
Testing and definition of specifications, Real-time-release
Several end-product, laboratory-based tests were in a position to be replaced with real-time process analytics and predictive models.
No change
1 4 Complaints/recalls
Did you see a change in the amount of complaints and recalls of products with RTR/PR (Real Time Release / Parametric Release)?
- Not disclosed Not yet implemented in routine production
1 5 Product specification
Is there an impact to the product specification?
3 Specification, as defined as an analytical property, test and acceptance criteria – yes. The tests were replaced with on-line/at-line analytics and predictive models. Possible changes to the acceptance criteria were not disclosed.
1
1 6 Product specification
Is the product specification more science based?
4 The mechanisms by which to measure and assess the quality attributes of interest were based upon sound science.
1
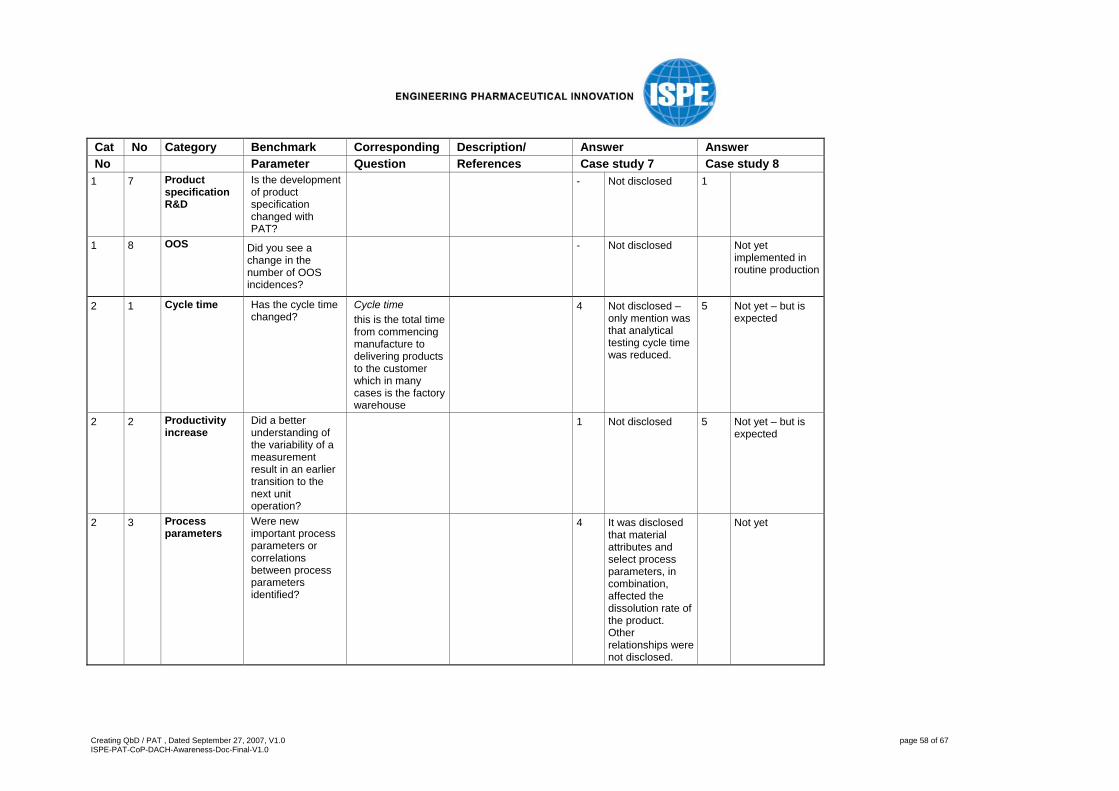
Creating QbD / PAT , Dated September 27, 2007, V1.0 page 58 of 67 ISPE-PAT-CoP-DACH-Awareness-Doc-Final-V1.0
Cat No Category Benchmark Corresponding Description/ Answer Answer No Parameter Question References Case study 7 Case study 8
1 7 Product specification R&D
Is the development of product specification changed with PAT?
- Not disclosed 1
1 8 OOS Did you see a change in the number of OOS incidences?
- Not disclosed Not yet implemented in routine production
2 1 Cycle time Has the cycle time changed?
Cycle time this is the total time from commencing manufacture to delivering products to the customer which in many cases is the factory warehouse
4 Not disclosed – only mention was that analytical testing cycle time was reduced.
5 Not yet – but is expected
2 2 Productivity increase
Did a better understanding of the variability of a measurement result in an earlier transition to the next unit operation?
1 Not disclosed 5 Not yet – but is expected
2 3 Process parameters
Were new important process parameters or correlations between process parameters identified?
4 It was disclosed that material attributes and select process parameters, in combination, affected the dissolution rate of the product. Other relationships were not disclosed.
Not yet

Creating QbD / PAT , Dated September 27, 2007, V1.0 page 59 of 67 ISPE-PAT-CoP-DACH-Awareness-Doc-Final-V1.0
Cat No Category Benchmark Corresponding Description/ Answer Answer No Parameter Question References Case study 7 Case study 8
2 4 Process parameters
Were any known process parameters adjusted?
Acceptance criteria - To be expected
2 5 Implementation of new technologies
Were new technologies in the process implemented?
5 New analytical technologies applied.
5
2 6 Process understanding
Was process understanding increased?
i.e. usage of structured data management, statistical methods
5 5
2 7 Process understanding
Did better understanding of a process help in other processes?
- Not disclosed 3
2 8 Yield Is the yield higher after PAT than before?
5 Disclosed that drying yield was higher (specific amount not disclosed).
5 To be expected
2 9 Process control
Did you find additional possibilities to control the process?
5 Yes, drying, blending.
5
3 1 Risk assessment
Was the PAT project a result of a risk assessment?
1 Project started prior to PAT guidance or the maturation of the risk-based approach.
1
3 2 Risk assessment
Did the PAT project initiate risk assessments?
5 Significant Risk assessments across many levels were executed and utilized.
5
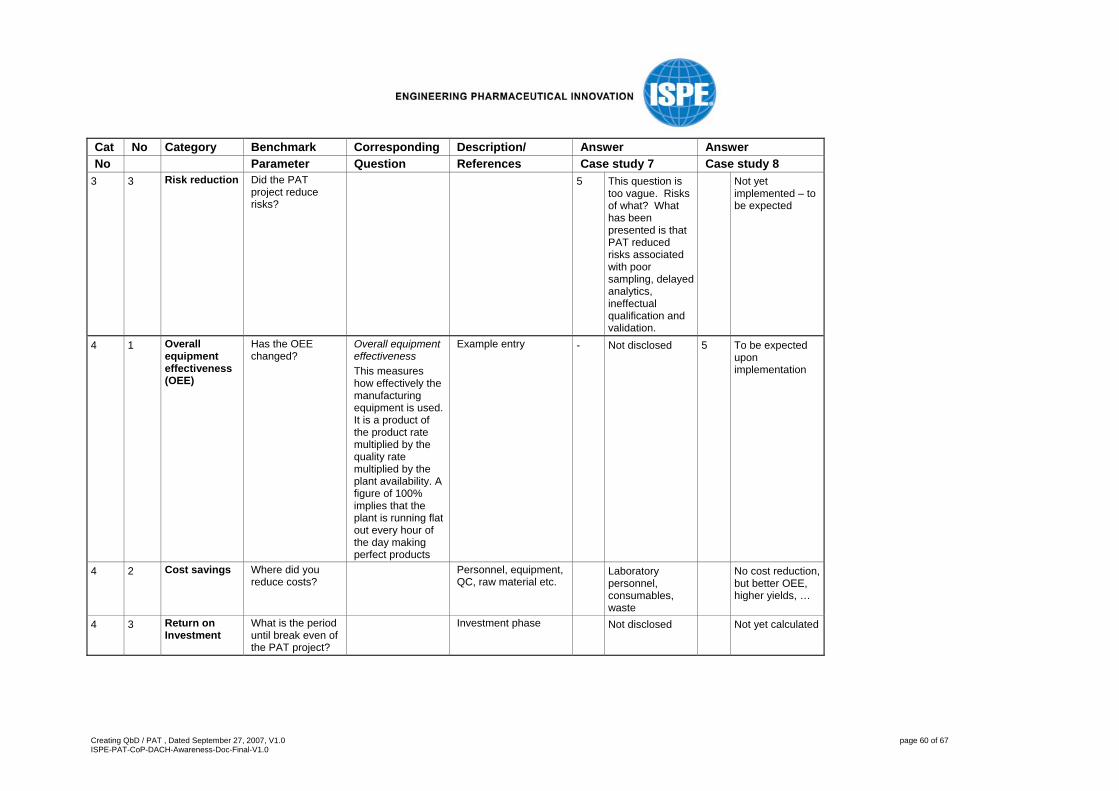
Creating QbD / PAT , Dated September 27, 2007, V1.0 page 60 of 67 ISPE-PAT-CoP-DACH-Awareness-Doc-Final-V1.0
Cat No Category Benchmark Corresponding Description/ Answer Answer No Parameter Question References Case study 7 Case study 8
3 3 Risk reduction Did the PAT project reduce risks?
5 This question is too vague. Risks of what? What has been presented is that PAT reduced risks associated with poor sampling, delayed analytics, ineffectual qualification and validation.
Not yet implemented – to be expected
4 1 Overall equipment effectiveness (OEE)
Has the OEE changed?
Overall equipment effectiveness This measures how effectively the manufacturing equipment is used. It is a product of the product rate multiplied by the quality rate multiplied by the plant availability. A figure of 100% implies that the plant is running flat out every hour of the day making perfect products
Example entry - Not disclosed 5 To be expected upon implementation
4 2 Cost savings Where did you reduce costs?
Personnel, equipment, QC, raw material etc.
Laboratory personnel, consumables, waste
No cost reduction, but better OEE, higher yields, …
4 3 Return on Investment
What is the period until break even of the PAT project?
Investment phase Not disclosed Not yet calculated
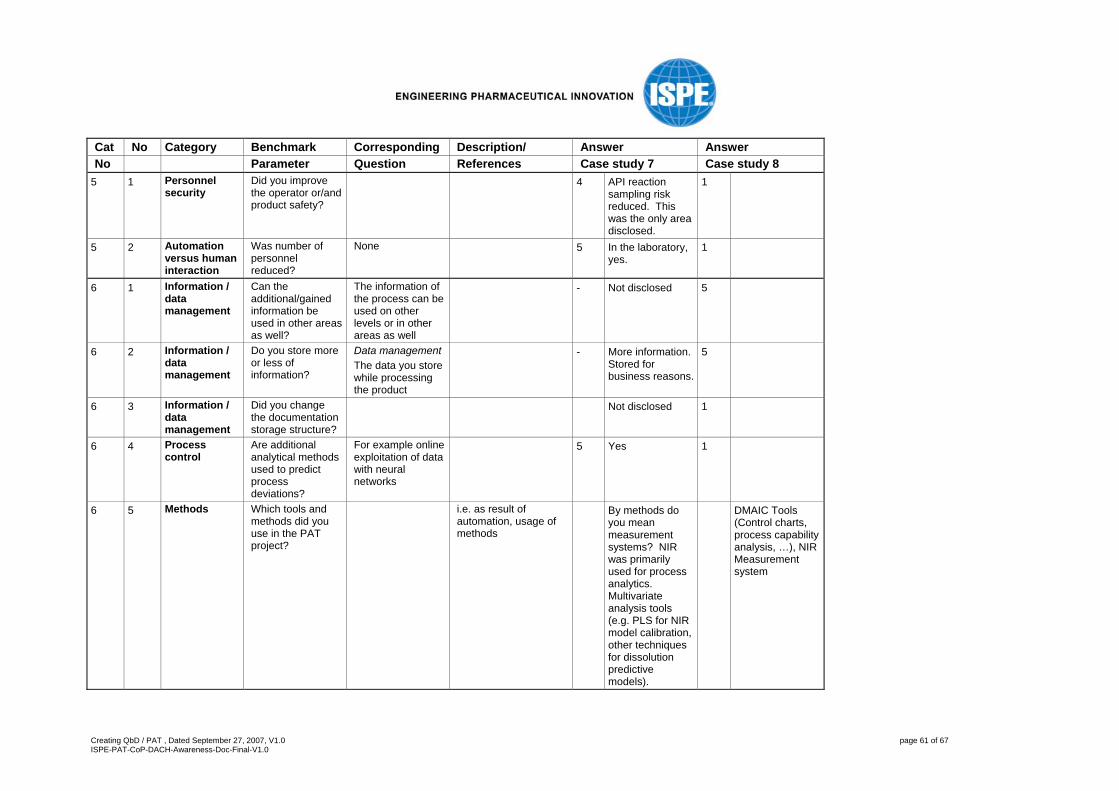
Creating QbD / PAT , Dated September 27, 2007, V1.0 page 61 of 67 ISPE-PAT-CoP-DACH-Awareness-Doc-Final-V1.0
Cat No Category Benchmark Corresponding Description/ Answer Answer No Parameter Question References Case study 7 Case study 8
5 1 Personnel security
Did you improve the operator or/and product safety?
4 API reaction sampling risk reduced. This was the only area disclosed.
1
5 2 Automation versus human interaction
Was number of personnel reduced?
None 5 In the laboratory, yes.
1
6 1 Information / data management
Can the additional/gained information be used in other areas as well?
The information of the process can be used on other levels or in other areas as well
- Not disclosed 5
6 2 Information / data management
Do you store more or less of information?
Data management The data you store while processing the product
- More information. Stored for business reasons.
5
6 3 Information / data management
Did you change the documentation storage structure?
Not disclosed 1
6 4 Process control
Are additional analytical methods used to predict process deviations?
For example online exploitation of data with neural networks
5 Yes 1
6 5 Methods Which tools and methods did you use in the PAT project?
i.e. as result of automation, usage of methods
By methods do you mean measurement systems? NIR was primarily used for process analytics. Multivariate analysis tools (e.g. PLS for NIR model calibration, other techniques for dissolution predictive models).
DMAIC Tools (Control charts, process capability analysis, …), NIR Measurement system

Creating QbD / PAT , Dated September 27, 2007, V1.0 page 62 of 67 ISPE-PAT-CoP-DACH-Awareness-Doc-Final-V1.0
Cat No Category Benchmark Corresponding Description/ Answer Answer No Parameter Question References Case study 7 Case study 8
7 1 On time in full delivery
Has the on time in full delivery changed?
On time in full delivery This is the percentage of orders that are satisfied on time in full, with zero defects. Note that if there is one defect in an order, the OTIF is zero percent
Example entry - Not disclosed 5 To be expected
7 2 Time to market
Did a better understanding of the process reduce the number of iterations in process development (e.g. scaling up)?
- Not applicable Not applicable
7 3 Time to market
Is the efficiency in licensing processes (submission approval) higher after PAT?
- Not disclosed for follow-on products. Regulatory efficiency for change of this product improved.
Submission not yet done
8 1 Process/parameter changes
What relief in validation efforts did you notice?
5 Significant relief using a risk-based approach with process understanding, monitoring and control.
1 No relief
8 2 Process/parameter changes
Did you change the validation approach?
e.g. switch of responsibilities in the organization
4 Only to use a risk-based iterative and incremental approach.
1
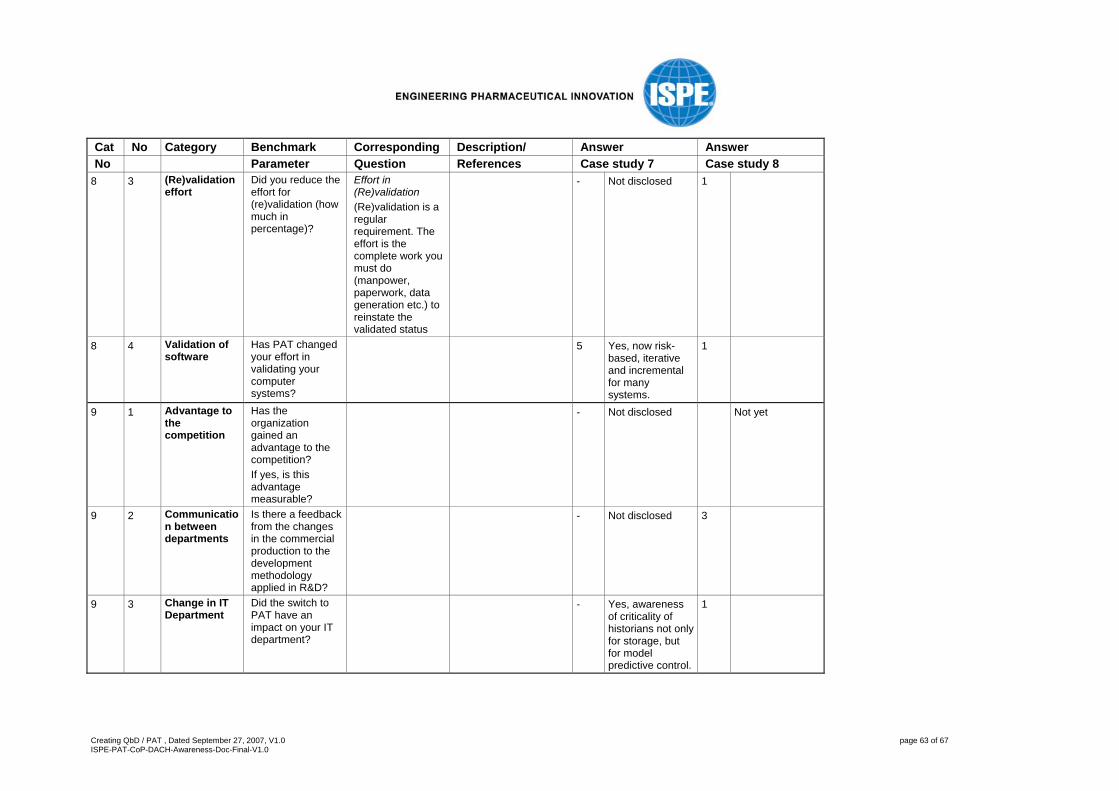
Creating QbD / PAT , Dated September 27, 2007, V1.0 page 63 of 67 ISPE-PAT-CoP-DACH-Awareness-Doc-Final-V1.0
Cat No Category Benchmark Corresponding Description/ Answer Answer No Parameter Question References Case study 7 Case study 8
8 3 (Re)validation effort
Did you reduce the effort for (re)validation (how much in percentage)?
Effort in (Re)validation (Re)validation is a regular requirement. The effort is the complete work you must do (manpower, paperwork, data generation etc.) to reinstate the validated status
- Not disclosed 1
8 4 Validation of software
Has PAT changed your effort in validating your computer systems?
5 Yes, now risk-based, iterative and incremental for many systems.
1
9 1 Advantage to the competition
Has the organization gained an advantage to the competition? If yes, is this advantage measurable?
- Not disclosed Not yet
9 2 Communication between departments
Is there a feedback from the changes in the commercial production to the development methodology applied in R&D?
- Not disclosed 3
9 3 Change in IT Department
Did the switch to PAT have an impact on your IT department?
- Yes, awareness of criticality of historians not only for storage, but for model predictive control.
1

Creating QbD / PAT , Dated September 27, 2007, V1.0 page 64 of 67 ISPE-PAT-CoP-DACH-Awareness-Doc-Final-V1.0
Cat No Category Benchmark Corresponding Description/ Answer Answer No Parameter Question References Case study 7 Case study 8
9 4 Change in mind
Has PAT an impact on the awareness of methodologies used in other industries?
2 Slow progress. 4
10 1 Regulatory requirements
Has PAT an impact on the awareness of regulatory requirements?
- 3
10 2 Regulatory requirements
Did PAT have an impact on change control processes with regulatory bodies?
5 Presented that regulatory relief was granted for changes to existing product.
Submission not yet done
10 3 Audits Are the discussions with regulatory bodies more scientific?
5 Absolutely. Not applicable (not yet implemented)
10 4 Audits Has the frequency of audits changed?
- Not disclosed Not applicable (not yet implemented)
10 5 Documentation
Has PAT an influence on the quality of documentation generated during development?
- Not disclosed 1
10 6 Documentation
Has PAT changed your way of applying for registration?
5 Only disclosed for this project. Yes, now science and risk-based.
Submission not yet done
10 7 Contact with regulatory bodies
Did the time of first contact to regulatory bodies change?
4 Yes. Engaged earlier than typical PAS.
Submission not yet done
10 8 Contact with regulatory bodies
Did the regulatory body respond earlier than before?
5 Yes. Submission not yet done
Creating QbD / PAT , Dated September 27, 2007, V1.0 page 65 of 67 ISPE-PAT-CoP-DACH-Awareness-Doc-Final-V1.0
7 Volunteers For each chapter a group of volunteers worked on the contents.
Thanks to all the participants spending the effort to make this document happen and to provide the creative input.
Christian Wölbeling (chairman)
Dr. Schmidt-Bader (coordinator)
Lydia Dolezel (coordinator)
Thomas Peither (coordinator)
Dr. Christian Schmidt (coordinator)
Dr. Rolf Altermatt
Dr. Rolf Bauer
Dr. Reinhard Baumfalk
Josef Braunschädel-Hilger
Dr. Jens Cardinal
Jeannette Ewen
Norbert Franz
Dr. Wolfgang Fischer
Georg Frinke
Dr. Jürgen Haas
Dr. Jörg Häußler
Steffen Himstedt
Dr. Thilo Jahr
Dr. Frauke Jordt
Prof. Dr. Rudolf Kessler
Dr. Wolfgang List
Joachim Mannhardt
Dr. Jochen Mohns
Karin Mühlfriedel
Thomas Peither
Volker Roeder
Dr. Marc Schiller
Dr. Ingo Symietz
Dr. Hans Tups
Michael Voß
Wolfgang Winter
Creating QbD / PAT , Dated September 27, 2007, V1.0 page 66 of 67 ISPE-PAT-CoP-DACH-Awareness-Doc-Final-V1.0
8 Glossary API Active Pharmaceutical Ingredient
CMC Chemistry, Manufacturing and Control
CoP Community of Practice
CPP Critical Process Parameter
CQA Critical Quality Attributes
CSV Computer System Validation
DB Data Base
DCS Distributed Control System
DMAIC Define Measure Analyze Implement and Control
DoE Design of Experiment
DSC Differential Scanning Calorimetry
EU European Union
FDA Food and Drug Administration
FMEA Failure Mode and Effects Analysis
GMP Good Manufacturing Practice
HPLC High Performance Liquid Chromatography
ICH International Conference on Harmonisation of Technical Requirements for Registration of Pharmaceuticals for Human Use
IT Information Technology
MIR Mid Infrared (Spectroscopy)
MVDA Multi Variate Data Analysis
NIR Near Infrared (Spectroscopy)
NMR Nuclear Magnetic Resonance (Spectroscopy)
OEE Overall Equipment Effectiveness
OOS Out of Specification
OTIF On Time in Full Delivery
PAS Parental Alienation Syndrome
PAT Process Analytical Technology
PLS Partial Least Squares
PR Parametric Release
QA Quality Assurance

Creating QbD / PAT , Dated September 27, 2007, V1.0 page 67 of 67 ISPE-PAT-CoP-DACH-Awareness-Doc-Final-V1.0
QbD Quality by Design
QC Quality Control
R&D Research and Development
ROI Return on Investment
RTR Real Time Release
SOA Service Oriented Architecture
SW Software
WIP Work in Progress
XML Extensible Markup Language