Process Analytical Technology (PAT) / Quality by …...2009/09/14 · Presentation: This...
63
Process Analytical Technology (PAT) / Quality by Design (QbD): Integrated Systems in the Future Pharma Business Landscape Glenn Restivo Industry Manager Life Sciences Siemens Center of Competence Sept 14, 2009
Transcript of Process Analytical Technology (PAT) / Quality by …...2009/09/14 · Presentation: This...

Process Analytical Technology (PAT) / Quality by Design (QbD):
Integrated Systems in the Future Pharma Business Landscape
Glenn RestivoIndustry Manager Life SciencesSiemens Center of Competence
Sept 14, 2009

Presentation:
This presentation describes several applications of PAT and QbD approaches in bioprocess development and manufacturing for (1) monitoring, (2) controlling, (3) real-time release and (4) optimization. Examples from various cases will be presented, including new process analytic concepts for bioprocess monitoring, design of experiments, and multivariate data analysis.
Participants will gain valuable insight and a useful roadmap for leading their organizations to make the necessary changes for PAT and QbD.

Presentation Topics: • PAT is more than just monitoring
• PAT benefits and regulatory approaches
• Measuring what and how? Some examples on new process analytic (PAT) concepts for bioprocess monitoring, design of experiments, multivariate data analysis
• Advanced Process Control and real-time product release
• PAT as part of the manufacturing and development architecture
• PAT as a continuous process understanding and improvement tool
• PAT and future manufacturing strategies

Prices of drugs are under pressure, costs and time for development are increasing, the capacity utilization level in manufacturing has to improve, cost of quality is high, …
How can we shorten development time, shorten production cycle time and at the same time increase operational efficiency
The actual challenge:

Technology changeTechnology change
Industrial ITIndustrial IT
Advanced Advanced controlcontrol
IntegratedIntegratedsolutionsolution
Changes and impacts on the pharmaceutical manufacturing marketplace
RegulationsRegulationsSocial changeSocial change
DemographicDemographic
Life styleLife style
PatientsPatients
Economical pressureEconomical pressure
Low pipe lineLow pipe line
ManufacturingManufacturing
Supply ChainSupply Chain
Market changeMarket change
New therapiesNew therapies
Delivery formDelivery form
PersonalizePersonalize
Pharmaceutical Pharmaceutical IndustryIndustry
driven by;Cost
Patient safety

How things will change and what will be supporting technologies for the future vision?
On short, medium and long term

• PAT/ Quality by Design• PLM• SPC
• Continuous Mftg. Concepts• Miniaturized manufacturing• PAT / real-time product release• Condition based maintenance
• Demand driven manufacturing• Modular plant design• Recipe driven manufacturing• Disposable manufacturing
• Clinical trial management• R&D Suite (WFM, Data portals)• E-licensing• PLM
Built-in Quality
Increase manufacturing performance & throughput
Flexible Manufacturing concepts
Speed-up development & closing the gap
New technologies and alternative strategies shaping future R&D & Manuf.

What will be future challenges? What is the strategic response?
Changes due to new production technologiesIncrease operating efficiencyReduce product costs / achieve competitive pricing (e.g. response to biogenerics)Produce individual products / address niche markets (Personalized Medicine)Accelerate time-to-market
Scenario 1: Modernize within existing facilityBut, essentially same approach & scale
Scenario 2: Continuous processing, RTPR, JIT production
Scenario 3 = Specialty Niche products: Small scale pilot centers, Integration of R&D and production: Small batches 24/7 running
Scenario 4 = Gross / mass market: Large-scale highly flexible plants, with high throughput
Move to personalized medicines
Clinical and patient feed-back loops
Continuous optimization and improvement
How will companies cope with the changing environment?
What will be the implications on the way we manufacture in future?
PAT / QbD will be a key enabling technology for future manufacturing scenarios.
5 year 10 year 15 year
Manufacturing strategic leaps to the medium and long term: Future Manufacturing Strategies

What will be future challenges? What is the strategic response?Increase operational efficiency (OEE)PAT (Process Analytical Technology) / QbDElectronic data acquisition and Data ManagementEBRMESPLMReal-time enterprise (data integration and management, dashboards / cockpits, facilitating real-time decision making)
Scenario 1: Modernize within existing facilityBut, essentially same approach & scale
What will be the implications on the way we manufacture in future?
5 year
Short term future (within 5 years)

New pharma regulations
•FDA’s new principles:
Process Analytical Technology (PAT) Process Analytical Technology (PAT) Understanding + controlling the manufacturing process
Quality by Design Quality by Design and Design space PAT principles for process development
Quality systems approach
Reflecting product & process understanding and knowledge
The US authority FDA started an initiative to:
improve manufacturing quality (reduce the risk of bad quality products) accelerate development lower the regulatory burden (inspections)
to allow process changes and optimizations throughout the product lifecycle
PAT / QbD definition
Process control trough new technologies focusing on manufacturing science
A system for designing (process development), analyzing and controlling manufacturing processes, based on timely measurements of critical Q & performance attributes of raw-materials, in-process materials and processes with the goal of ensuring final product Q.
Processes to assure acceptable end-product Q at the completion of the process (quality by design)
Focus on understanding
PAT / QbD is a key enabling technology for PAT / QbD is a key enabling technology for future development and manufacturingfuture development and manufacturing
The regulatory changes & PAT / QbD

New regulations PAT (Process
Analytical
Technology)
FDA’s new initiatives to:improve manufacturing qualityaccelerate developmentlower the regulatory burden
FDA’s new principles:risk based approachscientific approach, based on process understanding
•• PATPAT = Understanding + controlling the manufacturing process
• A process is well understood when:All critical sources of critical sources of variabilityvariability are identified and explainedVariability is managedVariability is managed by the processProduct quality attributes can be accurately and reliably predicted
•• Process Understanding is Process Understanding is inversely proportional to riskinversely proportional to risk
The regulatory landscape & PAT / QbD
New regulations Guidance
on Process
Validation
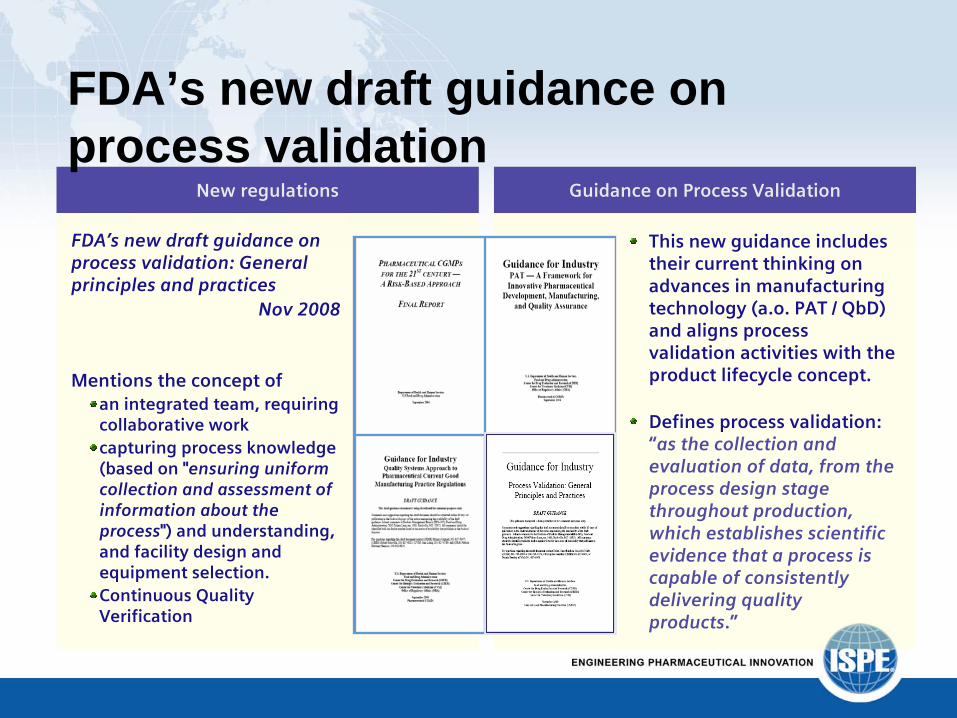
FDA’s new draft guidance on process validation: General principles and practices
Nov 2008
Mentions the concept of an integrated team, requiring collaborative workcapturing process knowledge (based on "ensuring uniform collection and assessment of information about the process") and understanding, and facility design and equipment selection.Continuous Quality Verification
This new guidance includes their current thinking on advances in manufacturing technology (a.o. PAT / QbD) and aligns process validation activities with the product lifecycle concept.
Defines process validation:
“as the collection and
evaluation of data, from the process design stage throughout production, which establishes scientific evidence that a process is capable of consistently delivering quality products.”
FDA’s new draft guidance on process validation

Business Drivers for PAT/QbD
PAT/QbD
CompanyCompany ImageImage
Reduced risk via technology platform, anti- counterfeitingImproved product trackingReverse poor imageImproved quality system through auditsReduced risk fo recall, warning letter,
consent decree
Site to site transferSite to site transfer
Accelerate transferReduce validation effortReduce project timeMitigate transfer riskMove manufacturing to
most effective site
New Product DevelopmentNew Product Development
Real Time Release (RTR)Fast time to marketFast scale-upClinical batchesProcess optimizationReduced cost of quality
Validation OptimizationValidation Optimization
Validation needs understandingIntegral part of projectBuild validation into process
End of LifeEnd of Life--cyclecycleTransferability of processScale down
Improve Existing ProcessImprove Existing Process
Gain new process understandingProcess optimizationReduced cost of qualityRaw material specificationsKnow product availability + yieldReal Time Release

ProcessAnalytics
Process techno-
logy
Data Portals/Knowledge
Mgt.MES
PLM
Process Automation
Field equipment
PAT / QbD the skill set and architecture fit
PAT Toolbox / Skill set Fit in development & manufacturing landscape
PATPAT
regulations regulations
ProcessAnalytics
Data Analysis & mining
DoE
Information management
tools
Data Collection storage &retrieval
Product & processdesign
PATPAT
(Advanced)ProcessControls

PAT and QbD
Quality by Design
Design Space
PAT
“Quality by Design is the overarching paradigm and Design Space and PAT are tools to achieve this end”

Forward Summary Section:
•DOE is the fastest route to a profitable, reliable, robust, validated process.•DOE’s requirement of a rigorous design methodology that passes peer review with the scientists most knowledgeable about the process ensures scientific soundness. •The depth of DOE’s statistical foundation enables measurement of multiple effects & interactions in a single set of experiments proves DOE’s statistical validity. •DOE is also a resource conservator, since it requires less time and provides data quicker than single factor at a time experiments. •The proven statistical validity of the DOE technique guarantees accurate analysis of the data and valuable information for management to turn data analysis and interpretation into action.
Ronald C. BranningGenentech, Inc.South San Francisco, California, U.S.A.

Operating limits ? Design space exploration
•Relationship between process parameters and end-product quality / performance ?
•Systematic approach to explore and document the design space:•Multi-factorial DoE
Golden batch trajectory Design space limits = Control limits
End-product Quality data LIMS
Qualitative Fingerprint
MVDA (PLS)
Process data
NIR spectral data
Temp., pH, pO2, pressure, …
MVDA (PCA)
MVDA (PCA)
Design space

Predicting end-product quality PAT as part of the process control environment
Based on real-time monitoring of NIR trajectories and process data, predict end product quality and performance
CTQ parameter: Continuously measured ORAperiodically measured ORReal time value Inferred from calibration model OREnd-point value inferred from calibration model ORScores of calibration model are CTQ parameters
End-product Quality data
Qualitative Fingerprint
MVDA (PLS)
Predictive Model
Process data
NIR spectral data
Temp., pH, pO2, pressure, …
MVDA (PCA)
MVDA (PCA)
Prediction
•Golden batch trajectory Control limits
•Actual batch progress
Early detection of process disturbances
Process advisory
Control correct bioreactor characteristics
And from design space to process control
PAT shifts monitoring and control from process data to product quality

Batch process visualization across different unit operations
Formulation Finishing PackagingRaw mats./ conditioning
Synthesis/ Downstream
-20
-10
0
10
20
-40 -30 -20 -10 0 10 20 30 40
t[2]
t[1]
-20.00
-10.00
0.00
10.00
20.00
520095_CO_A - batch level.M2 (PCA-X), FinalMonitort[Comp. 1]/t[Comp. 2]
Ellipse: Hotelling T2 (0.95)
98
99
100
101
98 99 100 101
YVar
(A11
10-L
20-O
105-
Assa
y_-_
Liqu
id)
YPred[8](A1110-L20-O105-Assay_-_Liquid)
98.00
99.00
100.00
101.00
520095_CO_A - batch level.M3 (PLS), AssayYPred[Comp. 8](YVar A1110-L20-O105-Assay_-_Liquid)/YVar(YVar A1110-L20-O105-Assay_-_Liquid)
RMSEE = 0.118192
y=1.001*x-0.127R2=0.9799
Release
-7
-6
-5
-4
-3
-2
-1
0
1
2
3
4
0 1 2 3 4 5 6 7 8 9 10 11
t[1]
Time ($Time)
-7.00
-6.00
-5.00
-4.00
-3.00
-2.00
-1.00
0.00
1.00
2.00
3.00
4.00
520095_GR_A.M4:5 - Scores [comp. 1] (Aligned) +3 Std.Devt[1] (Avg)-3 Std.Devt[1] (Aligned): 1000016_A
-4
-3
-2
-1
0
1
2
3
4
5
6
-1 0 1 2 3 4 5 6 7 8 9 10 11 12 13 14 15 16 17 18 19 20 21 22 23 24 25
t[1]
Time ($Time)
-4.00
-3.00
-2.00
-1.00
0.00
1.00
2.00
3.00
4.00
5.00
6.00
520095_DR_A.M1 - Scores [comp. 1] (Aligned) +3 Std.Devt[1] (Avg)-3 Std.Devt[1] (Aligned): 665002T_A
-7
-6
-5
-4
-3
-2
-1
0
1
2
3
4
5
-1 0 1 2 3 4 5 6 7 8 9 10 11 12 13 14 15 16 17 18 19 20 21 22 23
t[1]
Time ($Time)
-7.00
-6.00
-5.00
-4.00
-3.00
-2.00
-1.00
0.00
1.00
2.00
3.00
4.00
5.00
520095_CO_A.M1 - Scores [comp. 1] (Aligned) +3 Std.Devt[1] (Avg)-3 Std.Devt[1] (Aligned): 665001T_A
-5
0
5
10
0 100 200 300
tPS
[1]
Num
Offline Batch Monitoring Model 3-1-2004 - Predicted Scores [comp. 1]
LabF
erm
Pre
See
dFer
m
See
dFer
m
See
dFer
m H
old
and
Tran
s
Pro
dFer
m
SIMCA-P+ 10.5 - 5/10/2004 1:48:52 PM
PAT hi level PAT hi level systemsystem
PATPAT PATPAT PATPAT PATPAT PATPAT

The PAT/QbD system architecture - Integrating PAT with process automation and control systems - the wider perspective

An integrated Quality System, from shopfloor to boardroom to support:
6 sigma and continuous improvement
Regulatory process & review (continuous quality verification)
Management performance (time-to-market, progress in development process, optimisation of quality, manufacturing costs, manufacturing cycle times, etc.)
Demand driven manufacturing and supply
That reflects product & process understanding and knowledge
Just measuring the quality of the end product is not good enough anymore
PAT / QbD as part of the overall architecture

Manufacturing Architecture Quality Suite
MES
SCADA
Sensor/Field
Equipment
AutomationSystem
LocalOperation
ERP
Unit A Unit B Unit Y Unit Z
PAT
LIMS
SPC
Qua
lity
Suite
PAT
Qu
ality
An integrated Quality System, from shopfloor to boardroom to support:
6 sigma and continuous improvement
Regulatory process & review (continuous quality verification)
Management performance (time-to-market, progress in development process, optimisation of quality, manufacturing costs, manufacturing cycle times, etc.)
Demand driven manufacturing and supply
That reflects product & process understanding and knowledge
Time-based information Management

Quality SuiteManufacturing Architecture Quality Suite
MES
SCADA
Sensor/Field
Equipment
AutomationSystem
LocalOperation
ERP
Unit A Unit B Unit Y Unit Z
PAT
LIMS
SPC
Qua
lity
Suite
SPC
PLM
•Quality Suite, contains:
On shopfloor (in manufacturing):PATLIMSM-SPC/SQCBusiness intelligence suite (Quality cockpit)
On boardroom levelSPC Dashboards Central data warehouse + integration layer to R&D and manufacturingPLM and Knowledge Management
All integrated from shopfloor to boardroom
Qu
ality
PAT
OverallDashboard

What will be future challenges? What is the strategic response?
New manufacturing technologies: shift from batch to continuous manufacturing methodsReal-time product releaseJust in time manufacturingReal-time enterprise
Scenario 2: Continuous processing, RTPR, JIT production
Mid term future (in 5 to 10 years time)
What will be the implications on the way we manufacture in future?
5 year 10 year

Process feed
Ho
ld /
rele
ase
LabLab
Temp., pH, pO2, pressure, …
Closed loopClosed loopcontrolcontrol
Process output
LIMSLIMS
Sample
Classic controlClassic control
Process Analyzer
monitoringmonitoringprocessprocess datadata
monitoringmonitoringproduct product qualityquality
PATPAT
mathematicalmathematicaltranslationtranslation
RealReal--timetime releaserelease
Advanced Advanced ControlControl
Quality build in by design
Right first time
PAT shifts monitoring and control from process data to product quality
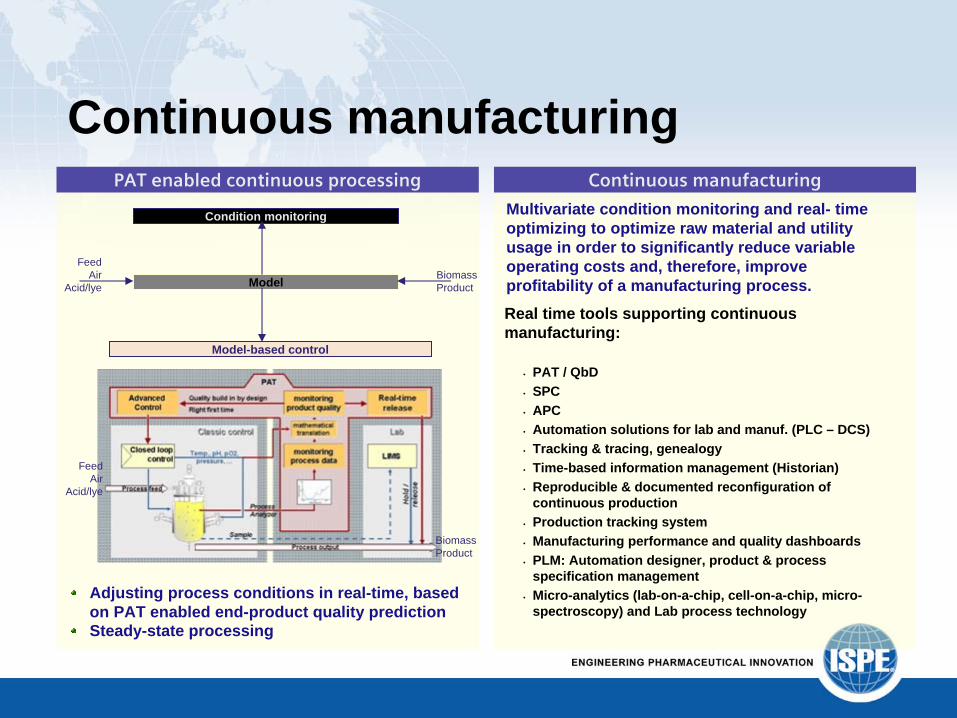
Continuous manufacturingPAT enabled continuous processing Continuous manufacturing
Multivariate condition monitoring and real- time optimizing to optimize raw material and utility usage in order to significantly reduce variable operating costs and, therefore, improve profitability of a manufacturing process.
Feed Air
Acid/lye
Biomass Product
Model-based control
Condition monitoring
Model
Feed Air
Acid/lyeBiomass Product
Real time tools supporting continuous manufacturing:
• PAT / QbD• SPC• APC• Automation solutions for lab and manuf. (PLC – DCS)• Tracking & tracing, genealogy • Time-based information management (Historian)• Reproducible & documented reconfiguration of
continuous production• Production tracking system• Manufacturing performance and quality dashboards• PLM: Automation designer, product & process
specification management• Micro-analytics (lab-on-a-chip, cell-on-a-chip, micro-
spectroscopy) and Lab process technologyAdjusting process conditions in real-time, based on PAT enabled end-product quality predictionSteady-state processing

Answer for data management in continuous manufacturing?
Sensor/Field
Equipment
AutomationSystem
LocalOperation
ERP
Wareh
ou
seM
anag
emen
t System
Bu
ildin
g
Man
agem
ent System
EBRFully integrated SCADA / local operation
Fully integrated MES
Standard SW structure (OMAC)
Central SCADA for integrated operation
PAT
In-line Process Testing
Life cycle management (PLM)
LIMS
Tracking and tracing
SCADA
MES
Man
ufactu
ring
Qu
ality KPI’s
Main
tenan
ce
Sup
ply C
hain
SPC
PAT hi level system
Q
M
S
Process line
Tracking & tracing
APC: on controller level and on process level

Long term vision:
R&D and Manufacturing integration “Closing the gap”

What will be future challenges? What is the strategic response?
Scenario 3 = Specialty Niche products: Small scale pilot centers, Integration of R&D and production: Small batches 24/7 running
Scenario 4 = Gross / mass market: Large-scale highly flexible plants, with high throughput
Move to personalized medicines
Clinical and patient feed-back loops
Continuous optimization and improvement
Long term future (in 10 to 15 years time)
Integration of R&D and manufacturingReal-time enterpriseHighly flexible plantsReal-time planning & schedulingContinuous learning and continuous quality verification
5 year 10 year 15 year
What will be the implications on the way we develop and manufacture in future?

Today Vision
New initiatives to:improve manufacturing qualityaccelerate developmentLower the regulatory burden
FDA new principles:Quality by design & design space Quality systems approachReflecting product & process understanding and knowledge
FDA’s future focus: Keynote address at IFPAC February 2007, by FDA's Chief Medical Officer, Dr. Janet Woodcock, on
Development & manufacturing should be integrated
Development of quality surrogates for clinical performance (link critical product attributes to clinical outcomes)
Rigorous, mechanistically based and statistically controlled processes
The Regulatory vision

page 31
ManufacturingERP
Process Automation
LIMSHistorian
Batch Execution
Dash
bo
ardin
g
MES
PAT/QbD in Manufacturing

Example architecture
The overall Architecture is based on a distributed approach with
a PAT/QbD
software solution per process area
Case: PAT/QbD in Manufacturing

page 33
R&D
Research Development
LIMS
MES
Lab automation
WorkflowManager
DoE Tools
R&D Suite
To support process development / Explore the design space Collects process knowledge on:
equipment/product interaction
equipment behavior
impact on final product quality
To support production of clinical batches
Allows to fasten process up- scaling and transfer (to manufacturing)
PAT / QbD in R&D

Example architecture
Case: PAT/QbD in Development

Knowledge is lost throughout the product lifecycle
R&D
Research Development
LIMS
MES
Lab automation
WorkflowManager
DoE Tools
R&D Suite
ManufacturingERP
Process Automation
LIMSHistorian
Batch Execution
Dash
bo
ardin
g
MES
Research, Development, Clinical and stability data etc
Process verification, Continuous Improvements, Data Trending, etc
Know
ledg
e G
ener
ated
Know
ledg
e G
ener
ated
Knowledge Transfer
Knowledge loss occurs throughout the products life cycle at each key stage
Knowledge Lost
Knowledge Lost
Need for a Repository of Knowledge

TeamCentreTeamCentre
Closing the gap: R&D and Manufacturing integration
Data Portal
Knowledge Management SystemTransform
Knowledge Generator
PLM Product & Process Lifecycle Management
R&D
Research Development
LIMS
MES
Lab automation
WorkflowManager
DoE Tools
R&D Suite
ManufacturingERP
Process Automation
LIMSHistorian
Batch Execution
Dash
bo
ardin
g
MES

NPI Manufacture
…To a situation where quality is ‘built in’
Manufacture Planning
Production Execution
Dispatch
To-Be business model where we have a continuous learning environment
Design Intent
Design Selection
Control D
efinition
Control Verification
Supporting processes
Performance Management
Knowledge Management
Equipment & Facilities Management
Performance Management
Knowledge Management
Equipment & Facilities Management
Quality by Design Process Analytical Technology
Quality Management

Closing the gap Development and manufacturing integration
•Integration of R&D and manufacturing: Same products and solution for development and for manufacturing, facilitating tech transfer and time to market.
PAT / QbD: a continuous process understanding and improvement tool to collect knowledge on: -
product performance (therapeutic / clinical)
-
process / product interaction
-
part of the knowledge hierarchyData portals and data integrationPLM (product and process)
Offering a consistent and accurate dataflow.Answers FDA’s future focus:
Development & manufacturing should be integrated
Development of quality surrogates for clinical performance
(link critical product attributes to clinical outcomes and critical process parameters)
Rigorous, mechanistically based and statistically controlled processes
Closing the gap: development and manufacturing integration

Case: PAT / QbD as part of overall system architecture
R&D
KnowledgeMgt
PLM
PAT / QbD
architecture for Process Development
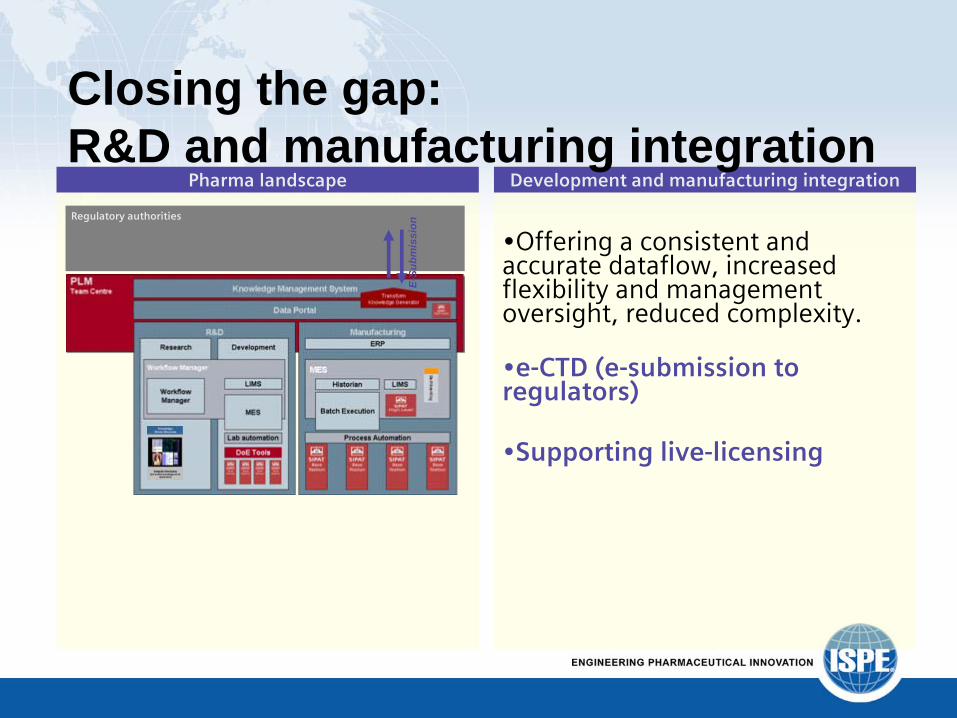
Pharma landscape Development and manufacturing integration
•Offering a consistent and accurate dataflow, increased flexibility and management oversight, reduced complexity.
•e-CTD (e-submission to regulators)
•Supporting live-licensing
Regulatory authorities
E-Su
bmis
sion
Closing the gap: R&D and manufacturing integration

Required
infrastructure Required
disciplines
ProcessAnalytics
Chemometrics/ MVDA
Process under-
standing
Process development
Modeling
MESregulatory
(Advanced)Controls
PAT
Requires a multidisciplinary approach to ensure success

Moving forward in manufacturing and R&D

Biotechnological Manufacturing
• high value, low yield • scaling / up-scaling• ‘scientific’ environment• critical CIP/SIP • Biowaste• use of disposable processes• new technologies • [demand for] Process Understanding
General TrendsGeneral Trends

Disposable Manufacturing

Trends
Development
of production companies move from the use of stand-alone disposable devices to fully-integrated multi-component assemblies.
The proliferation of disposable technologies will be applied on both upstream and downstream
operations.

Challenges
Although there are many advantages there arehowever a couple of issues related to thistechnology:
No basic process research or experience yetWaste production/ need of incineration of used disposable materials (cost!)Process monitoring: disposable sensors (in situ monitoring)?Applicable to the whole manufacturing process (upstream & downstream)Cost implicationsApplicable for chemical API production?Which steps should be done with disposables? -> Need for evaluation & strategyEase of use? Continuous manufacturing operations with disposable technologies?
Advantages Challenges
3rd Annual Report and Survey of Biopharmaceutical Manufacturing, Capacity, and Production (survey of 187 biopharmaceutical companies and CMO)

Workflow
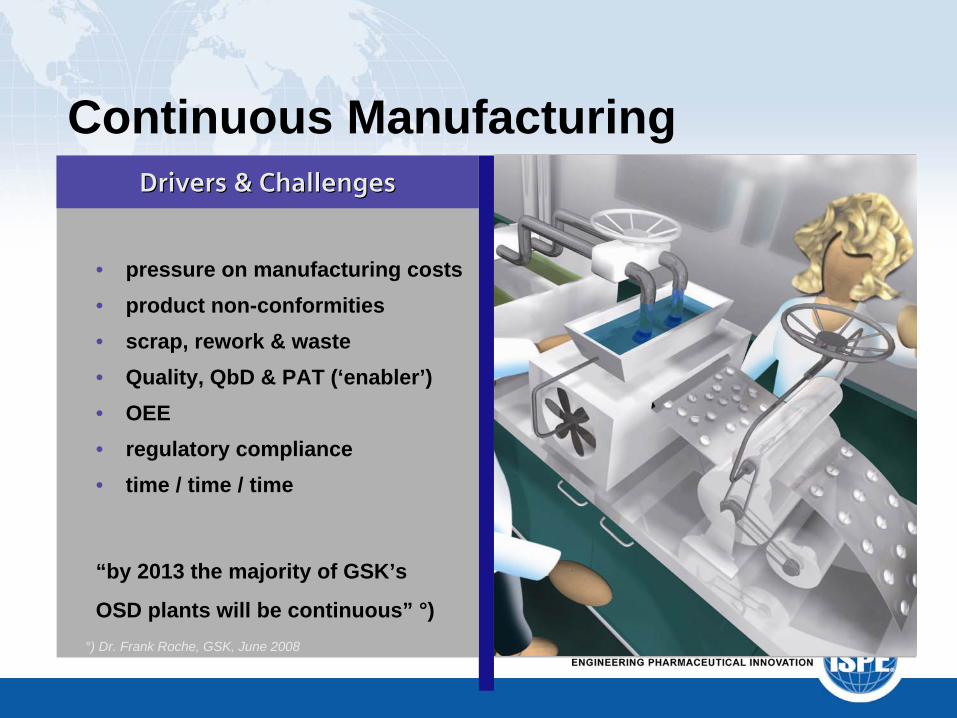
Drivers & ChallengesDrivers & Challenges
• pressure on manufacturing costs• product non-conformities• scrap, rework & waste • Quality, QbD & PAT (‘enabler’) • OEE• regulatory compliance • time / time / time
“by 2013 the majority of GSK’s
OSD plants will be continuous” °)°) Dr. Frank Roche, GSK, June 2008
Continuous Manufacturing

Batch processing vs. Continuous processing
Batch Processing
Continuous Processing
Tran
siti
on
•
Gradually
•
As “on pot”
manufacturing
•
As a hybrid implementation (batch and continuous parallel)
produced according to a single manufacturing order during the same cycle of manufacturing
New materials are added and products removed continuously at a rate that maintains the volume at specific level = “one in –
one out”
Fully Continuous: a nomically
steady state flowrate
from the inlet to the outlet
Quasi Continuous: flowrate
within the process may vary significantly

Continuous manufacturing, solidsRaw Material
Dryer
Granulator Tablet press
Blender
Qualitycheck
Manufacture
Test / WaitRelease
Mix Granulate Dry Press
PATPAT
ContinuousManufacturing
Buffer

New facility models which are:
-
smaller
-
more energy efficient
-
less wasteful
- more productive
-
significantly less costly to build and
operate (more then 55% less costly), no WIP
Improves quality consistency
(less variations, better homogeneity)
Decrease scale up issues and cycle time
Faster go-to-market of new products
Potential reduction of OEE
The manufacturing architecture implications
Benefits
Picture courtesy of GSK

Research & Development
Reduce Time to MarketReduce R&D costsStrengthen pipelineImprove efficiency R&D and clinical trialsRetain talented researchers (move to U.S. and Asia)
Needs:Technology innovationBiomarker development (imaging, diagnostics)Dashboards for R&D progress, based on WFM systemsProduct LifeCycle
Management (PLM)Data integration…
«« BetweenBetween 2010 and 2012 2010 and 2012 $90 billion US$90 billion US
out of patent out of patent productsproducts atattop 10top 10 »»
Drivers & ChallengesDrivers & Challenges

Drug development
More iteration/feedback loops & parallel work
In-life testing and live licensing
More transparency on clinical trial result
More exchange of data
Reduction
of patient population
Smaller batches
Shortening time to market
Bio markers
Bioinformatics
Changes in R&D (drug development)

Closing the gap between R&D and manufacturing
Sales Marketing
Expensive
salesinefficient supply
chain
Business
PricePrice
LabLab AutomationAutomation PilotPilot
DCS / PLC
MES
ERP
Knowledge Management
PLM
BMS
Batch
HistorianLIMSLIMS
PATPAT
Sensors
Integrated systemapproach
PAT system
R&D suite
PLM software

Pharmaceutical Technology July 2009 Online Exclusive Integration of PAT in Biopharmaceutical Research (A Case Study)

Netherlands Vaccine Institute (NVI) Description of Customer
Produces vaccines for all government vaccination programs in The Netherlands
Has R&D and Manufacturing activities
Cooperates with other vaccine producers

Netherlands Vaccine Institute (NVI) Description of Customer
• Application of PAT / QbD on an existing product
• Implementation of PAT for the development of a new production process for a whole cell vaccine against Pertussis or whooping cough disease
• In process development-Improved process understanding-Faster process development and upscaling
• In manufacturing:-Cycle time reduction-Waste reduction

Netherlands Vaccine Institute (NVI) Description of the Solution
Design and execution of a PAT strategy for process development PAT strategy / implementation procedure (roadmap):
Step 1 –
Appoint multidisciplinary team to apply and integrate the different disciplines needed for PAT method design and implementation
Step 2 –
Quality characterization
Step 3 –
Process assessment of Critical to Quality production steps
Step 4 –
Design of Experiment (DoE) and Multivariate data analysis of DoE
results. Identification of “golden batch trajectory”
and design envelop.
Step 5 –
Development of Control Strategy
Step 6 –
Development of a future release philosophy with quality built into the control system
Step 7 –
Optimization of the complete process

Netherlands Vaccine Institute (NVI) Key Benefits
• better process understanding• improvement of quality• reduction from 20% to 5 % waste• increase production yield by a factor 3• potentially eliminate animal testing • full integration of information flows during
processing and online comparison with historical data

Conclusion

Key Learning PointsDevelop the future vision for manufacturing and development
Select the PAT tools that are supporting the vision
Develop the PAT / QbD architecture that supports the vision
Develop the PAT / QbD implementation strategy (roadmap)

• Today, the pharma market is more then ever looking for solutions to bring development and manufacturing closer to each other (closing the gap), accelerate time- to-market and real-time decision making.
• New technologies transform development and manufacturing and merges these activities. Knowledge management tools will play a prominent role.
• The future is not a million miles away; much of it is here today!
Conclusion

Questions?
Glenn Restivo Industry Manager Life Science Siemens Center of Competence Phone: +1 215 646 7400 x3319 [email protected] www.siemens.com/pharm www.siemens.com/SIPAT