Creating a Sustainable Materials Management(SMM) Model …Management(SMM) Model for Consumer...
32
Creating a Sustainable Materials Management (SMM) Model for Consumer Technology A collaboration among: Golisano Institute for Sustainability at Rochester Institute of Technology Consumer Technology Association Staples Sustainable Innovation Lab Callie W. Babbbitt, Ph.D. - April 27, 2017 RIT Students and Collaborators: Shahana Althaf, Roger Chen, Barbara Kasulaitis, Jackson Haskell
Transcript of Creating a Sustainable Materials Management(SMM) Model …Management(SMM) Model for Consumer...

Creating a Sustainable Materials Management (SMM) Modelfor Consumer Technology
A collaboration among:Golisano Institute for Sustainability at Rochester Institute of Technology
Consumer Technology AssociationStaples Sustainable Innovation Lab
Callie W. Babbbitt, Ph.D. - April 27, 2017
RIT Students and Collaborators: Shahana Althaf, Roger Chen, Barbara Kasulaitis, Jackson Haskell

Golisano Institute for Sustainability
Academic Programs Sustainability Ph.D. Sustainable Systems M.S. M. Architecture
Research & development Industrial ecology and life cycle
assessment Sustainable mobility and energy systems Food waste valorization Critical materials and recycling Sustainable supply chains
Campus sustainability
Community and global engagement

Background: Consumer electronics have a complex life cycle
Manufacturing
Transport
Distribution
Use
Waste Management
Recycling
Resource Extraction

Traditional solution space

‘per product’ impact reduced
Traditional solution space

Intersection between these solutions and realistic patterns of consumption
‘per product’ impact reduced
Is the ‘net’ impact same, increased, or
decreased?

Parallel in ecological systems?A biological ecosystem:
Material Flows
Energy Flows
Biomass
EnvironmentalStress
Resource Limitations
Evolutionary Processes
- -
+

Consumer product ecosystem:
Technology Advances Product
EvolutionRegulations and
Voluntary Standards
Prices
Waste
Energy Flows
Material Flows
++
+ -+
- ++
-- -

Research aims
Create a SMM model that can quantify the net “material footprint” of the consumer technology ecosystem Resources consumed Products held in households E-waste flows
Apply data-driven analysis to establish a baseline for conventional technology products (“Phase 1”)
Understand key material trends over time
Adapt and apply SMM model for proactive analysis of emerging trends, future products, and other life cycle environmental metrics (“Phase 2” – future work)

Approach:

Approach:1) Characterize the technology product ecosystem
Product adoption and ownership rates
(CTA surveys)
Scope: “Average” U.S. Household, 21 most common products, 1990-2015
Inputs Outputs
‘Average’ U.S. Household

Product adoption and ownership rates
‘Average’ U.S. Household
Technology Ecosystem
Approach:2) Quantify unit inflows of new products
Inputs Outputs
Product inflows - unit sales and shipments
(CTA, IDC data)

Product inflows - unit sales and shipments
Product adoption and ownership rates
‘Average’ U.S. Household
Technology Ecosystem
Approach:3) Quantify units held in stock and unit outflows
Inputs Outputs
Household Stock Changes
Product unit outflows*
Calculation: ∆ Stock = Σ inflows – Σ outflows
*Outflows may be products for reuse or e-scrap

Approach:4) Quantify mass and material flows
x ~100 productsPhoto: Kelly Hofer
• Product disassembly and material characterization• Data from literature and technical or policy documentation (NCER)• Ongoing efforts to expand, analyze uncertainty, and catalog for public use

Product inflows - unit sales and shipments
Product adoption and ownership rates
‘Average’ U.S. Household
Technology Ecosystem
Approach:4) Quantify mass and material flows, cont.
Inputs Outputs
Household Stock Changes
Product unit outflows
Average product mass, bill of materials
Cumulative mass and material consumed, in stock, and in outflows

Key findings
1. Product consumption is growing, but net material footprint is beginning to slowConsumer demand Technological progress and product substitution

0
50,000,000
100,000,000
150,000,000
200,000,000
250,000,000
300,000,000
350,000,000
400,000,000
450,000,000
500,000,000
Ann
ual P
rodu
ct In
flow
s in
uni
ts fo
r all
U.S
. H
ouse
hold
s
Blu-rayDVDVCRMP3 playerDigital camcorderDigital cameraGaming consoleLED TVLCD TVPlasma TVCRT TVLED MonitorLCD monitorCRT monitorPrinterLaptopDesktopE-readerTabletSmart phoneBasic phone
Sales of new technologies into U.S. Households
Huge growth in mobile device consumption, with recent shifts toward device convergence

0
200,000
400,000
600,000
800,000
1,000,000
1,200,000
1,400,000
1,600,000
1,800,000
Ann
ual P
rodu
ct In
flow
s by
Mas
s (m
etric
tons
) fo
r all
U.S
. Hou
seho
lds
Blu-ray
DVD
VCR
MP3 player
Digital camcorder
Digital camera
Gaming console
LED TV
LCD TV
Plasma TV
CRT TV
LED Monitor
LCD monitor
CRT monitor
Printer
Laptop
Desktop
E-reader
Tablet
Smart phone
Basic phone
Net weight of products consumed
Transition from CRT to flat panel display

Key findings
1. Product consumption is growing, but net material footprint is decliningConsumer demand Technological progress and product substitution
2. Materials of concern have declined, although overall material profile fairly steady Technological progress and product substitution
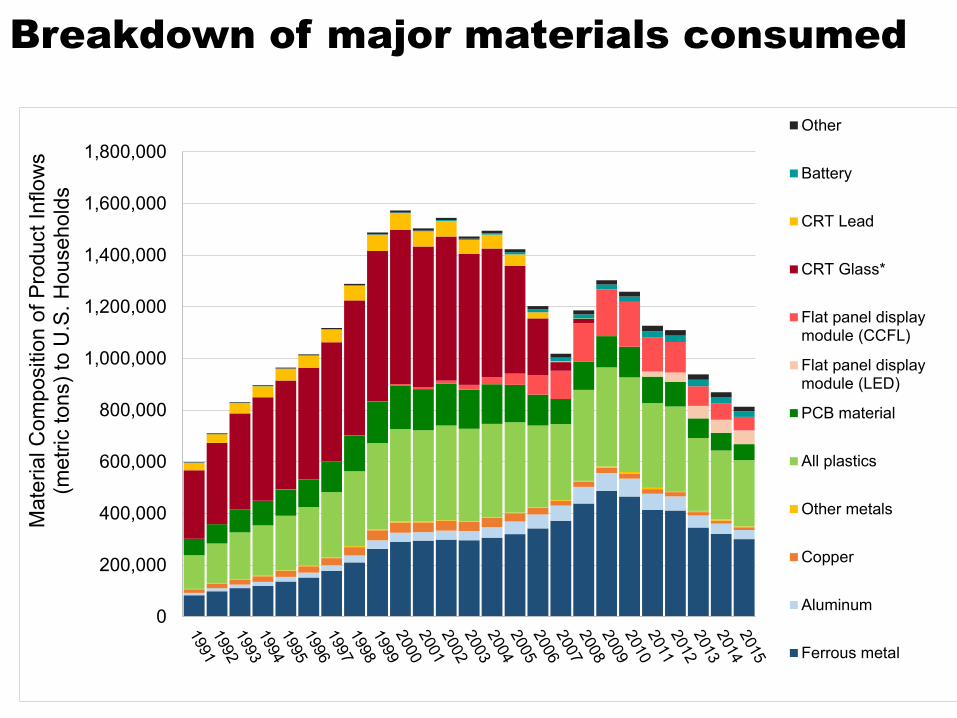
Breakdown of major materials consumed
0
200,000
400,000
600,000
800,000
1,000,000
1,200,000
1,400,000
1,600,000
1,800,000
Mat
eria
l Com
posi
tion
of P
rodu
ct In
flow
s (m
etric
tons
) to
U.S
. Hou
seho
lds
Other
Battery
CRT Lead
CRT Glass*
Flat panel displaymodule (CCFL)
Flat panel displaymodule (LED)
PCB material
All plastics
Other metals
Copper
Aluminum
Ferrous metal

0
200,000
400,000
600,000
800,000
1,000,000
1,200,000
1,400,000
1,600,000
1,800,000
2,000,000
2,200,000
2,400,000
Mat
eria
l Com
posi
tion
of P
rodu
ct O
utflo
ws
(met
ric to
ns) f
rom
U.S
. Hou
seho
lds
Other
Battery
CRT Lead
CRT Glass*
Flat panel displaymodule (CCFL)
Flat panel displaymodule (LED)
PCB material
All plastics
Other metals
Copper
Aluminum
Ferrous metal
Breakdown of materials entering the waste stream
Growth of “e-waste” stream has slowed.
Contribution of lead declining as consumers phase out residual CRT TVs

Decline in lead (in CRT and circuit boards)
0
100,000
200,000
300,000
400,000
500,000
600,000
700,000
800,000
Lead
Con
tain
ed in
U.S
. Con
sum
er
Tech
nolo
gy P
rodu
cts
(met
ric to
ns)
Lead Inflow Lead in Stock Lead Outflow

Decline in mercury (in CCFL LCD displays)
0
10
20
30
40
50
60
Mer
cury
Con
tain
ed in
U.S
. Con
sum
er
Tech
nolo
gy P
rodu
cts
(met
ric to
ns)
Mercury Inflow Mercury in Stock Mercury Outflow

Key findings
1. Product consumption is growing, but net material footprint is decliningConsumer demand Technological progress and product substitution
2. Materials of concern have declined, although overall material profile fairly steady Technological progress and product substitution
3. Opportunities for new innovations Scarce materials and the circular economy Emerging recycling issues

Material consumption in flat panel technology
0
10,000
20,000
30,000
40,000
50,000
60,000
70,000
80,000
90,000
Net
con
sum
ptio
n of
Fla
t Pan
el
Disp
lays
(met
ric to
ns)
LCD TV - CCFL
LCD monitor - CCFL
LCD TV - LED
LCD monitor - LED
Laptops
Tablet
Smart phone
Opportunities for closing the loop on critical materials (e.g., indium) and rare earth elements:

Emerging lithium-ion battery waste stream
0
2,000
4,000
6,000
8,000
10,000
12,000
2010 2011 2012 2013 2014 2015
Mas
s of L
ithiu
m-io
n Ba
tter
y O
utflo
ws
(met
ric to
ns)
Laptops
Tablet
Smartphone
E-reader
Batteries increasingly entering the waste stream in last 5 years, containing important materials like lithium, cobalt, and graphite
Next steps
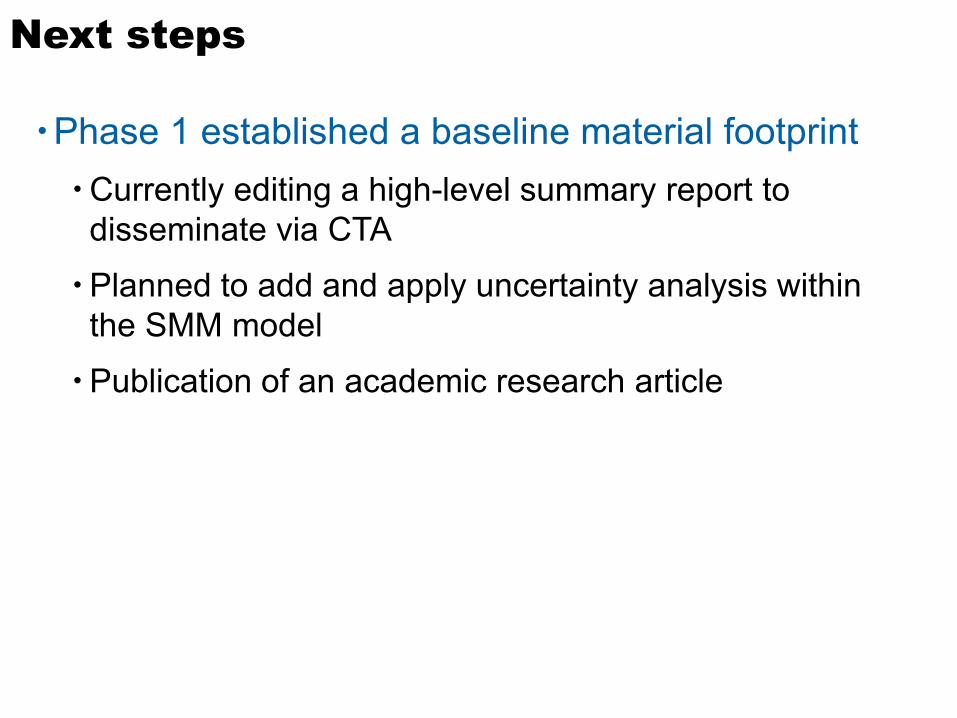
Phase 1 established a baseline material footprintCurrently editing a high-level summary report to disseminate via CTA
Planned to add and apply uncertainty analysis within the SMM model
Publication of an academic research article

Phase 2 will expand the SMM model with a forward-looking perspectiveFocused on model development
Validation using case studies of emerging technologies and scenario analysis
Environmental metrics that based on life cycle thinking
Dissemination of modeling tools (Excel, Matlab)
Next steps

Case studies in consideration
Discrete consumer technology products -traditional and new
Next steps

Case studies in consideration
Discrete consumer technology products -traditional and new
Products using electricity that are now "smart"
Next steps

Case studies in consideration
Discrete consumer technology products -traditional and new
Products using electricity that are now "smart"
Products with no historical technology function but electronics are added for smart functionality
Next steps