Creating a DEM From a Topographic Map_RCEstoque
21
Creating a Digital Elevation Model (DEM): A GIS lecture tutorial Prof. Yuji MURAYAMA, PhD. Mr. Ronald C. ESTOQUE, MSc. 2011 1
-
Upload
pramod702487 -
Category
Documents
-
view
219 -
download
0
Transcript of Creating a DEM From a Topographic Map_RCEstoque

8/10/2019 Creating a DEM From a Topographic Map_RCEstoque
http://slidepdf.com/reader/full/creating-a-dem-from-a-topographic-maprcestoque 1/21
Creating a Digital
Elevation Model (DEM): A GIS lecture tutorial
Prof. Yuji MURAYAMA, PhD.Mr. Ronald C. ESTOQUE, MSc.
2011
1

8/10/2019 Creating a DEM From a Topographic Map_RCEstoque
http://slidepdf.com/reader/full/creating-a-dem-from-a-topographic-maprcestoque 2/21
Contents, Data & Software Used
Contents
1. Introduction
2. Basic concepts & definitions
3. A flow diagram in creating a DEM3.1. Scanning
3.2. Georeferencing3.3. Digitizing3.4. Interpolation
4. Remarks
Data & Software1. Paper-based topographic map
2. ArcGIS software
2

8/10/2019 Creating a DEM From a Topographic Map_RCEstoque
http://slidepdf.com/reader/full/creating-a-dem-from-a-topographic-maprcestoque 3/21
1. Introduction
Background! A digital elevation model (DEM) is a digital file consisting of terrain elevations
for ground positions at regularly spaced horizontal intervals (USGS, 2001).
! Its uses range from scientific, commercial, industrial, operational to militaryapplications.
!
In the academe or a research institution, DEM is used primarily as an input or as a data
source itself in studies along the fields of climate impact studies, water & wildlife
management, geological & hydrological modeling, geographic information technology,
geomorphology & landscape analysis, mapping purposes, & educational programs.
Source: Sulebak (2000)
! However, sometimes DEM is not available.
Objective!
Thus, the aim of this lecture tutorial is to outline & explain the method in creating a DEM from
a paper-based topographic map in a GIS platform.
3

8/10/2019 Creating a DEM From a Topographic Map_RCEstoque
http://slidepdf.com/reader/full/creating-a-dem-from-a-topographic-maprcestoque 4/21
2. Basic concepts & definitions
Topographic mapo is a type of map characterized by large-scale detail and quantitative
representation of relief, usually using contour lines in modern mapping.
o is a detailed & accurate graphic representation of cultural & natural featureson the ground (Center for Topographic Information, 2007).
Contour lineo A contour line connects a series of points of equal elevation & is used to
illustrate relief on a map. For example, numerous contour lines that are closeto one another show hilly or mountainous terrain; when far apart, they
indicate a gentler slope. Source: Center for Topographic Information ( 2007).
Scanning
o is a process of converting any paper-based material (in this case, paper-
based topographic map) into a digital format, which is usually integratedinto the GIS database (Lwin & Estoque, In press).
4

8/10/2019 Creating a DEM From a Topographic Map_RCEstoque
http://slidepdf.com/reader/full/creating-a-dem-from-a-topographic-maprcestoque 5/21
2. Basic concepts & definitions
Georeferencingo refers to the process of assigning map coordinates to an image data (Leica
Geosystems, 2005).
o Data that are already georeferenced can be used as reference ingeoreferencing.
Digitizingo is a process of converting spatial features (point, line & polygon) from a
paper-based source into a digital form by tracing. This can be done using adigitizing tablet or by on-screen digitizing.
Interpolationo is a process of assigning values to unknown points by using values from
usually scattered set of known points.
o is a procedure used to predict cell values for locations that lack sampledpoints (Childs, 2004).
5

8/10/2019 Creating a DEM From a Topographic Map_RCEstoque
http://slidepdf.com/reader/full/creating-a-dem-from-a-topographic-maprcestoque 6/21
3. A flow diagram in creating a DEM6
DigitalElevationModel
Scanning
Georeferencing
Digitizing
Interpolation
Topographic map(paper)
- Input
- Process
- Output
- Pointingtowards the next
step/output
Lines
Points
contour lines
sample elevation sites
Ground survey(GPS data)
Legend:

8/10/2019 Creating a DEM From a Topographic Map_RCEstoque
http://slidepdf.com/reader/full/creating-a-dem-from-a-topographic-maprcestoque 7/21
3.1. Scanning 7
Scanned topographic map (.jpg)
• Prior to on-screen digitizing, paper maps
have to be integrated into the GIS database by converting them into digital format. The
process of such conversion is known asscanning.
• Through scanning, map features including
texts and symbols are automatically
captured as individual cells or pixels and anautomated image is produced.• These features in raster format are then
“vectorized” through tracing or on-screen
digitizing.• Generally, in order to have a good source
image in the digitizing process, a scannerneeds to have a good resolution and,
depending on the underlying purpose, large
enough to accommodate the whole mapsheet being scanned.
Source: Lwin & Estoque (In press)

8/10/2019 Creating a DEM From a Topographic Map_RCEstoque
http://slidepdf.com/reader/full/creating-a-dem-from-a-topographic-maprcestoque 8/21
3.2. Georeferencing
8
Road map (.shp)
Scanned topo map (.jpg) Road map overlaid on the georeferenced topo map
GEO
R
EFER
ENCIN
G
•
In this presentation, georeferencing was done in ArcGISsoftware. (See Cassity, 2006; ESRI, 2008a)
•
The road map, which is in shape file format & alreadygeorefenced was used as a reference feature. (Other featurescan also be used).
• Forty five (45) ground control points were collected. (Collectas much points as possible to have a better accuracy).

8/10/2019 Creating a DEM From a Topographic Map_RCEstoque
http://slidepdf.com/reader/full/creating-a-dem-from-a-topographic-maprcestoque 9/21
3.3. Digitizing
9•
In this presentation, only a portion of the georeferenced topographic map wasselected & digitized.• The selected area is called “area of interest” or “aoi”.
Area of interest Road map overlaid on the georeferenced topo map

8/10/2019 Creating a DEM From a Topographic Map_RCEstoque
http://slidepdf.com/reader/full/creating-a-dem-from-a-topographic-maprcestoque 10/21
3.3.a. Digitizing (Lines)
On-screen digitizing
Digitized contour lines Attribute table (Elevation – m asl)
•
In order to have a more detailed DEM output,digitizing the contours at 20m interval is a good option.Lower contour interval denotes a more detailedtopographic map or DEM.• However, in this presentation, a contour interval of100m was used. Thus, only the contour lines at 100minterval (i.e. 900, 1000, 1100, etc.) were digitized.•
Digitizing was done using ArcGIS software (on-screendigitizing).
10
8/10/2019 Creating a DEM From a Topographic Map_RCEstoque
http://slidepdf.com/reader/full/creating-a-dem-from-a-topographic-maprcestoque 11/21
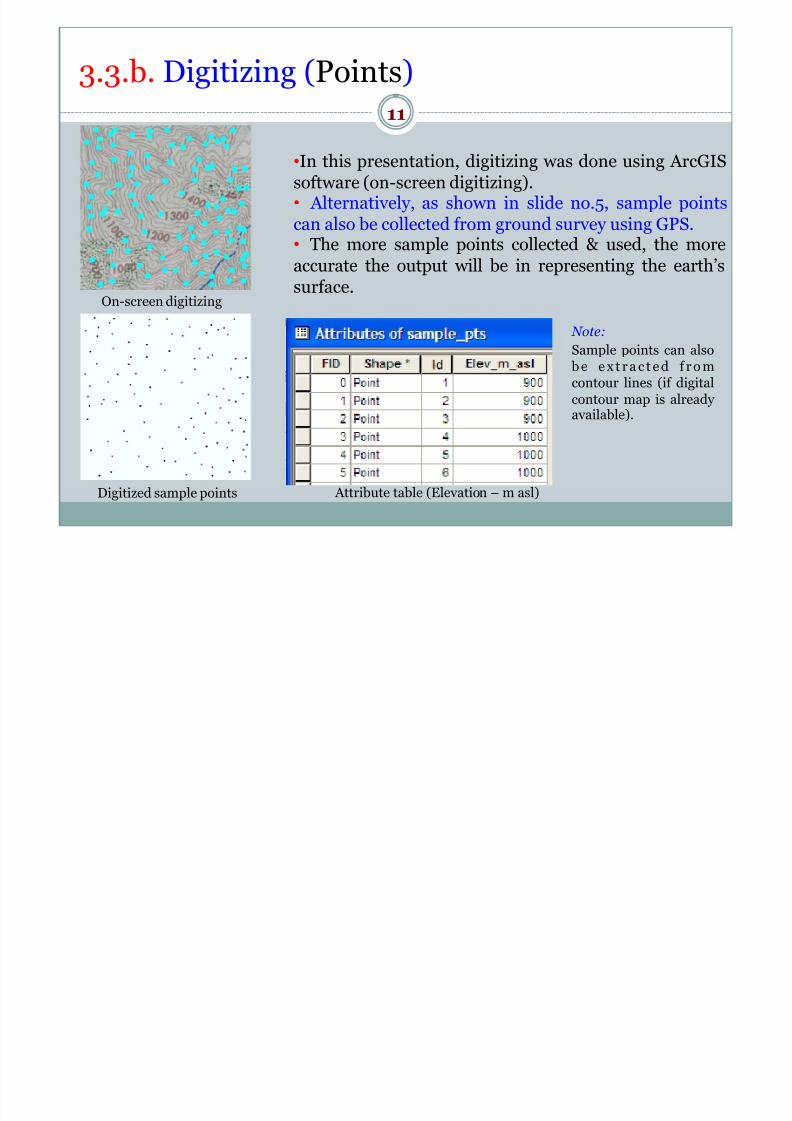
3.3.b. Digitizing (Points)
On-screen digitizing
Digitized sample points Attribute table (Elevation – m asl)
• In this presentation, digitizing was done using ArcGISsoftware (on-screen digitizing).• Alternatively, as shown in slide no.5, sample pointscan also be collected from ground survey using GPS.• The more sample points collected & used, the moreaccurate the output will be in representing the earth’ssurface.
Note:
Sample points can also b e e x t r a c t e d f r o mcontour lines (if digital
contour map is already
available).
11

8/10/2019 Creating a DEM From a Topographic Map_RCEstoque
http://slidepdf.com/reader/full/creating-a-dem-from-a-topographic-maprcestoque 12/21
3.4.a. Interpolation (using contour lines)
12
Screen shot of the “Topo to Raster” interpolation method
• The “Topo to Raster” interpolation method can be accessed from the “Spatial Analyst Tools”
of ArcGIS under “Interpolation”. The digitized contour lines in section 3.3.a were used asinput.
• This method allows theu s e r o r a n a l y s t t ointerpolate the digitized
contour lines directly togenerate a surface map orDEM.
• In the “Topo to Raster”
window, one can specify the“field” containing the valuest o b e u s e d i n t h e
interpolation process.
• The output cell size canalso be defined.
Method:

8/10/2019 Creating a DEM From a Topographic Map_RCEstoque
http://slidepdf.com/reader/full/creating-a-dem-from-a-topographic-maprcestoque 13/21
Digital Elevation Model (output of the “Topo to Raster” method)
• The DEM of the aoi generated using the “Topo toRaster” interpolation method is presented below.
- A spatial resolution of 5m was assigned during theinterpolation process.
• The “Topo to Raster” methodimposes constraints that ensure ahydrologically correct digital
elevation model that:• contains a connected drainage
structure; &• correctly represents ridges &
streams from input contour data.
• It uses an iterative finite differenceinterpolation technique thatoptimizes the computationalefficiency of local interpolation
without losing the surface continuityof global interpolation.
• It was specifically designed to workintelligently with contour inputs.
Source: Childs (2004)
Output:
3.4.a. Interpolation (using contour lines)
13

8/10/2019 Creating a DEM From a Topographic Map_RCEstoque
http://slidepdf.com/reader/full/creating-a-dem-from-a-topographic-maprcestoque 14/21
3.4.b. Interpolation (using sample points)
! Some of the most common interpolation methods include Inverse Distance Weighted (IDW) interpolation, Spline, & Kriging. These are all available in ArcGIS software.
14
Methods:
IDW (Sources: Childs (2004); ESRI (2008b))
!
This method should be used when the set ofpoints is dense enough to capture the extentof local surface variation needed foranalysis.
! It estimates cell values by averaging the values of sample data points in the
neighborhood of each processing cell.
!
The closer a point is to the center of the cell being estimated, the more influence or weight it has in the averaging process.
!
The greater the distance, the less influence thecell has on the output value. Source: Childs (2004)

8/10/2019 Creating a DEM From a Topographic Map_RCEstoque
http://slidepdf.com/reader/full/creating-a-dem-from-a-topographic-maprcestoque 15/21
3.4.b. Interpolation (using sample points)
Spline (Sources: Childs (2004); ESRI (2008c))
! This is an interpolation method thatestimates values using a mathematicalfunction that minimizes overall surfacecurvature, resulting in a smooth surfacethat passes exactly through the input points.
! Conceptually, it is like bending a sheet ofrubber so that it passes through the points while minimizing the total curvature of thesurface.
! It can predict ridges & valleys in the data &
is the best method for representing thesmoothly varying surfaces of phenomenasuch as temperature.
15
Methods:
Source: Childs (2004)

8/10/2019 Creating a DEM From a Topographic Map_RCEstoque
http://slidepdf.com/reader/full/creating-a-dem-from-a-topographic-maprcestoque 16/21
3.4.b. Interpolation (using sample points)
Kriging (Sources: Childs (2004); ESRI (2008d))
! This is an advanced geostatistical procedurethat generates an estimated surface from a
scattered set of points with z-values (orelevations).
! It involves an interactive investigation of thespatial behavior of the phenomenon
represented by the z-values before you selectthe best estimation method for generating theoutput surface.
!
It is most appropriate when a spatiallycorrelated distance or directional bias in thedata is known & is often used for applications
in soil science & geology.
16
Methods:
Source: Childs (2004)
8/10/2019 Creating a DEM From a Topographic Map_RCEstoque
http://slidepdf.com/reader/full/creating-a-dem-from-a-topographic-maprcestoque 17/21
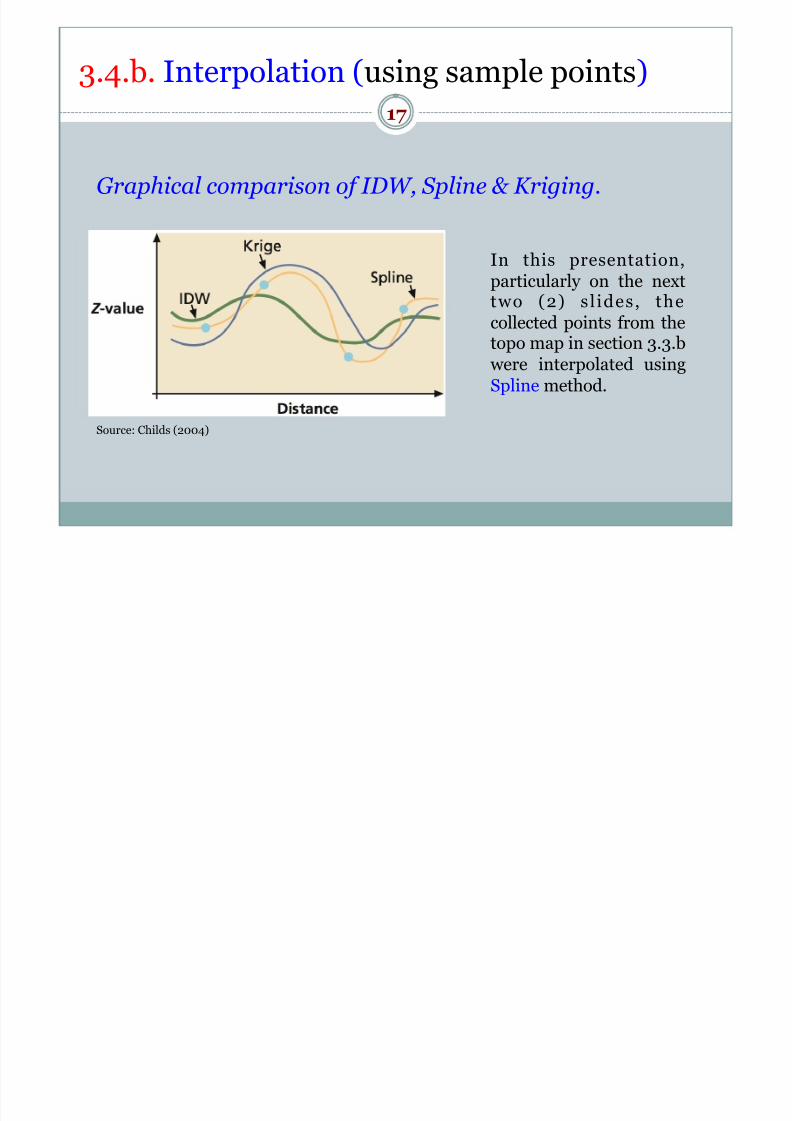
3.4.b. Interpolation (using sample points)
17
Graphical comparison of IDW, Spline & Kriging.
Source: Childs (2004)
In this presentation,
particularly on the nexttwo (2) sl ides, thecollected points from thetopo map in section 3.3.b were interpolated usingSpline method.
8/10/2019 Creating a DEM From a Topographic Map_RCEstoque
http://slidepdf.com/reader/full/creating-a-dem-from-a-topographic-maprcestoque 18/21
3.4.b. Interpolation (using sample points)
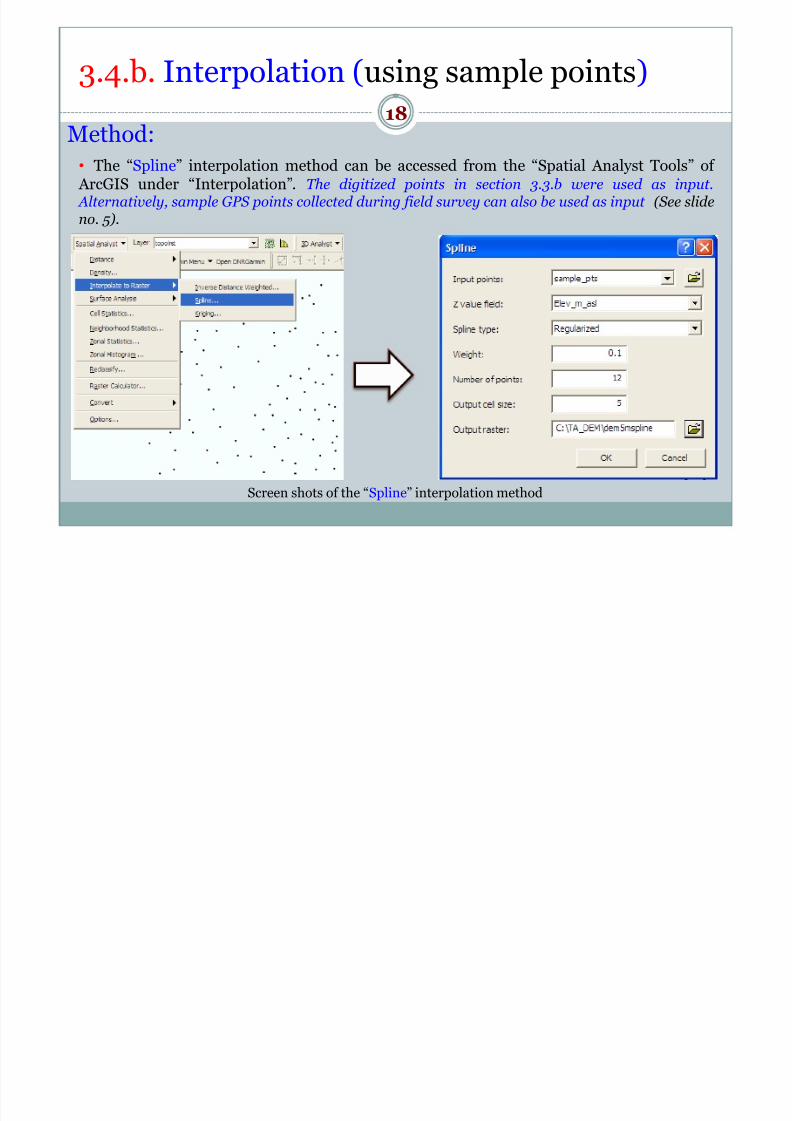
18
• The “Spline” interpolation method can be accessed from the “Spatial Analyst Tools” of
ArcGIS under “Interpolation”. The digitized points in section 3.3.b were used as input. Alternatively, sample GPS points collected during field survey can also be used as input (See slideno. 5).
Method:
Screen shots of the “Spline” interpolation method

8/10/2019 Creating a DEM From a Topographic Map_RCEstoque
http://slidepdf.com/reader/full/creating-a-dem-from-a-topographic-maprcestoque 19/21
3.4.b. Interpolation (using sample points)
19
• Like the output of the “Topo to
Raster” method, the DEM generated by using the “Spline” method can
now be used for spatial analysis.
• Several topographic features like
slope and aspect can also be derivedfrom the DEM.
• DEM can be displayed using the“classified” or “stretched” optionsunder “symbology” or by usingdifferent classification methods like
natural break, equal interval, etc.
• In this presentation, the DEM is
displayed using the “stretched”option under “symbology”.
• The generated DEM of the aoi generated by usingthe Spline interpolation method is presented below.
- A spatial resolution of 5m was assigned during the
interpolation process.
Digital Elevation Model (output of the “Spline” method)
Output:
8/10/2019 Creating a DEM From a Topographic Map_RCEstoque
http://slidepdf.com/reader/full/creating-a-dem-from-a-topographic-maprcestoque 20/21
Remarks
!
In this presentation, the methods in creating a DEM usingcontour lines and sample points digitized from a paper- based topographic map were illustrated and explained.
!
There are a number of interpolation methods, thus, oneshould carefully select which method is more appropriate based on the distribution of sample data and the underlyingpurpose and phenomenon .
20

8/10/2019 Creating a DEM From a Topographic Map_RCEstoque
http://slidepdf.com/reader/full/creating-a-dem-from-a-topographic-maprcestoque 21/21
References & Suggested Readings
!
Cassity, K. 2006. Georeferencing an image in ArcGIS. http://www.teachmegis.com Accessed 10 June 2011.
!
Center for Topographic Information. 2007. Mapping Information: Topo Maps: Frequently Asked Questions.Natural Resources Canada. http://maps.nrcan.gc.ca/topo101/faq_e.php Accessed 11 June 2011.
! Childs, C. 2004. Interpolating surfaces. ESRI Education Services. www.esri.com/news/arcuser/0704/files/
interpolating.pdf Accessed 14 June 2011.
!
ESRI. 2008a. Georeferencing a raster dataset. http://webhelp.esri.com/arcgisdesktop/9.2/index.cfm?TopicName=Georeferencing_a_raster_dataset Accessed 10 June 2011.
!
ESRI. 2008b. How IDW works. http://webhelp.esri.com/arcgisdesktop/9.2/index.cfm?TopicName=How %20IDW%20works Accessed 12 June 2011.
! ESRI. 2008c. How Spline works. http://webhelp.esri.com/arcgisdesktop/9.2/index.cfm?TopicName=How
%20Spline%20works Accessed 12 June 2011.
!
ESRI. 2008d. How Kriging works. http://webhelp.esri.com/arcgisdesktop/9.2/index.cfm?TopicName=How %20Kriging%20works Accessed 12 June 2011.
!
Lwin, K. & Estoque (In press). Geospatial data collection, processing and applications in GIS. In Murayama, Y.(Ed), Progress in geospatial analysis. Dordrecht: Springer Science +Business Media B.V., isbn:
978-4-431-53999-5 (Due: January 18, 2012).
!
Sulebak, J. R. 2000. Applications of digital elevation models. DYNAMAP “White Paper”. SINTEF. www.math.sintef.no/git/downloads/DEMapplications.pdf Accessed 10 June 2011.
! USGS. 2001. Digital Elevation Models: USGS Digital Elevation Model Information. Rocky Mountain mappingCenter. http://rmmcweb.cr.usgs.gov/elevation/dpi_dem.html Accessed 14 June 2011.
! www.esri.com/geostatisticalanalyst
21


![nisngr.net · embankments, etc., require information from DEM/3D modelling [ESRI, 2009]. The derivation of topographic attributes relies on digital elevation data sets that may be](https://static.fdocuments.in/doc/165x107/5d32dc6288c993d91a8bb4af/-embankments-etc-require-information-from-dem3d-modelling-esri-2009-the.jpg)