Creating stunning data analytics dashboard using php and flex

Copyr ight © SAS Inst i tute Inc. Al l r ights reserved.Copyr ight © SAS Inst i tute Inc. Al l r ights reserved.
S T R E A M I
DATA ARCHITECTURE
Design of the data architecture is a strategic decision, reflecting an understanding of what matters for the performance of the revenue function.
Lecture #4
21 September 2021
This module will discuss how a professional data analytics function is introduced into a tax administration and the steps required to make it effective. Central to the organizational change is 1. developing a strategy for infusing data analysts and high-end skills of data science into taxation by:
Creating a data analytics function
2. deciding where to place the function
3. deciding on centralized versus decentralized data science capacity
4. establishing effective collaboration between data analysts, data science and tax specialists
6. providing space for experimentation, learning, and mistakes
5. educating tax professionals about data science and data scientists about taxation
Presented by: Inland Revenue Authority of Singapore and SAS Institute

Copyr ight © SAS Inst i tute Inc. Al l r ights reserved.
What is the objective?
The objective of this stream is to equip
participants with a practical and
theoretical understanding of the critical
success factors in establishing a data
architecture by providing the appropriate
tools and the vocabulary needed to
establish or improve the tax
administration’s data architecture.
Our Objective

Copyr ight © SAS Inst i tute Inc. Al l r ights reserved.
Even though tax agencies are awash in data, they can struggle to turn raw data into actionable intelligence.
How can you apply the right analytics to produce intelligent decisions?

Copyr ight © SAS Inst i tute Inc. Al l r ights reserved.
Using Analytics to Move Towards “Trusted Decisions”

Copyr ight © SAS Inst i tute Inc. Al l r ights reserved.
Developing a data strategy1Where to locate the data analytics function2Centralized vs de-centralized
Capabilities and education
45
3
Stakeholder collaboration
6 Experimentation & learning
Creating a Data Analytics FunctionOverview

Copyr ight © SAS Inst i tute Inc. Al l r ights reserved.
Leveraging Analytics
Increase voluntary compliance, minimize
loss and administer tax policy fairly and
efficiently

Copyr ight © SAS Inst i tute Inc. Al l r ights reserved.Copyr ight © SAS Inst i tute Inc. Al l r ights reserved.
Developing a data strategy1Where to locate the data analytics function2Centralized vs de-centralized
Capabilities and education
45
3
Stakeholder collaboration
6 Experimentation & learning
Creating a Data Analytics Function

Copyr ight © SAS Inst i tute Inc. Al l r ights reserved.
“I want to explore, experiment, and try new things by myself to spark new ideas and approaches for innovation.”
“We didn’t hire data scientists to prepare data all day ”
“I can’t wait days or even weeks for ITto have my data ready for me”
“Dated data = dated insights”
Common Issues – Sound Familiar?

Copyr ight © SAS Inst i tute Inc. Al l r ights reserved.Copyr ight © SAS Inst i tute Inc. Al l r ights reserved.
CASE STUDY: Problem: Every project at the tax agency addressed data issues as one-off, built-from scratch activities. The agencies IT team had 17 projects underway (new applications, application enhancements, new reports, etc.).
Each project required access to customer data, and each had overlapping tasks and resources.
➢ Every project included a source data inventory and analysis activity because there was no way to know where specific data resided.
➢ New data extracts (subsets of data copied for use by other systems) had to be built because IT had no way of determining if the data was already available.
➢ No teams shared their source extract data. Each had their own copies to support their integration and database build activities (which tied up storage for this transient content).
➢ Each team’s integration logic was custom built and individually maintained, because the logic and rules weren’t identified or documented to be shared.

Copyr ight © SAS Inst i tute Inc. Al l r ights reserved.
Audit had to continually update its campaign system to adjust to frequent (and uncommunicated) changes occurring to the layouts of the extracts it received.
Managers always had questions about KPI reports because titles and labels varied across reports (even though they contained common data).
Business unit users often built their own reports instead of using the standard reports from finance, because there was no way to determine the origin of standard report data.
Departments and divisions do not have a common method for collecting and integrating raw data, cleansing it to ensure data quality, and preparing it for analytics.

Copyr ight © SAS Inst i tute Inc. Al l r ights reserved.
Common questions about the data did not have a common version of the “truth” so non-compliance detection and reporting was usually ad-hoc.
The data warehousing team lacked
a Data Strategy Framework and had to continually chase data problems because data issues weren’t managed like other business support activities.
Master Data Management
Data Storage & Archiving
Technology Architecture
Data Quality
Data Insights Strategy
Data Control Environment
Data Standardization
Data Dictionary
Data Management
Strategy
Data Strategy Framework
Data Architecture
Data Sourcing & Maintenance
Data Governance & Stewardship
Data Enablement &
Access
Business Strategy
Adherence
Cultural Change Strategy

Copyr ight © SAS Inst i tute Inc. Al l r ights reserved.
Where does my data strategy fit?
• Aligned with Corporate Vision
• Depends on Corporate Strategy
• Define DataOPs/ModelOPsImplementation
• Data Strategy:
– Processes and practices aligned with all necessary stakeholders
– Assets (re)usage, from request to usage to retirement
– Measures to assess Data Source Trustability
Governance…

Copyright © SAS Inst itute Inc. A l l r ights reserved.
A data strategy with analytics in mind is a plan designed to improve all the ways you acquire, store, manage, share and use data to go from QUESTIONS to DECISIONS
Can we predict non-compliance based on prior audit outcomes?
How can we collect the greatest number of
receivables, given our limited resources? How can we improve
the view of cross-authority customers
(individuals, companies)?
Where is that trending?
What are the new threats?
How are we prioritizing investigations for non-compliant behavior?
How collectible is a debt?QUESTION DECISIONWhat if the tax law
changes in this way?

“Our accounts receivable balance is growing. How can we get better at prioritizing which cases are most/least collectable?”
“I have a lot of data on past cases that we have collected. How can I use historical data to determine collectability?”
“What characteristics make a case collectable? How does time impact collectability?”
“How do I explain the results of my model to a business user?”
“Cases with characteristics A, B, and C are 85% likely to resolve without us taking any action.”
“Cases with characteristics X, Y. and Z have less than 5% chance of collection.”

Copyright © SAS Inst itute Inc. A l l r ights reserved.
“Our accounts receivable balance is growing:1. Which cases are most/least collectable?2. What’s the best action to take?”3. How can I maximize revenue with my
limited people and budget?’
“I have a lot of data on past cases that we have collected and actions we took. How can I use historical data to optimize collections, given the resource constraints?”
“Collections is a process, not an isolated action. How do I create a customized action plan for each debtor?”
“What algorithms best support the idea of ‘collections is a process’? What are the most important constraints that prevent us from collecting more?”
“Here is a customized collection plan for each debtor. I can update it daily, based on new data received.”
“X is your biggest bottleneck in the collections process. If you increase X by 25%, you can increase revenues by $7.9 million in 6 months.”

Copyr ight © SAS Inst i tute Inc. Al l r ights reserved.
Ref: “Hidden Technical Debt in Machine Learning Systems”, Google Inc.
Only a small fraction of real-world Machine Learning systems is composed of the Machine Learning code, as shown by the small black box in the middle. The required surrounding infrastructure is vast and complex.

Copyr ight © SAS Inst i tute Inc. Al l r ights reserved.
Ref: “Hidden Technical Debt in Machine Learning Systems”, Google Inc.
Developing a Data Strategy
Can we predict non-compliance based on prior audit outcomes?
How can we collect the greatest number of
receivables, given our limited resources? How can we improve
the view of cross-authority customers
(individuals, companies)?
Where is that trending?
What are the new threats?
How are we prioritizing investigations for non-compliant behavior?
How collectible is a debt?QUESTION DECISION
Design with the end in mind

Copyr ight © SAS Inst i tute Inc. Al l r ights reserved.
Maturity of Analytic Capabilities
Val
ue
to B
usi
nes
s
Sop
his
tica
tio
n
Reporting Drilldown
VisualizationSelf Service BI
Statistical Modeling
Forecasting
Optimization
What happened?
Why has it happened?
Predict future outcomes
Automate the best action
Where is the problem?
Natural Language Processing/Computer
Vision/Robotic Process Automation/AI
Machine/Deep Learning
Extract insights from unstructured/ visual content
Automatically find hidden insights
The Analytic Continuum

Copyr ight © SAS Inst i tute Inc. Al l r ights reserved.
QUESTION DECISION
Introducing: The “Analytics Life Cycle”

Copyr ight © SAS Inst i tute Inc. Al l r ights reserved.
The Analytics Life CycleBorrowing from agile software development practices,
DataOPs provides an agile approach to data access,
quality, preparation, and governance. It enables greater reliability, adaptability, speed and collaboration in your efforts to operationalize data and analytic workflows.
AccessAccess data, regardless of size or complexity
PrepareTransform raw data, including AI powered suggestions
VisualizeView important relationships in data and share insights
GovernBuild trust in data, understand lineage and gain transparency

Copyr ight © SAS Inst i tute Inc. Al l r ights reserved.
DataOPs – “Operationalizing Analytics”The How and the What … From the Source to the Consumer
Metadata Management
Data Integration
Data Discovery
Data Transformation
Data Preparation
Data DeliveryD
ata
Sou
rces
Data Quality Assurance
Business (Governance) Rules
Data Authoring
/ SSM
Data Governance, Usage Management, Monitoring
Data C
on
sum
ers

Copyr ight © SAS Inst i tute Inc. Al l r ights reserved.Copyr ight © SAS Inst i tute Inc. Al l r ights reserved.Copyr ight © SAS Inst i tute Inc. Al l r ights reserved.
80% 20%
Access Explore Cleanse Transform Analysis
Data PreparationThe Need to “Flip the Script”

Copyr ight © SAS Inst i tute Inc. Al l r ights reserved.Copyr ight © SAS Inst i tute Inc. Al l r ights reserved.Copyr ight © SAS Inst i tute Inc. Al l r ights reserved.

Copyr ight © SAS Inst i tute Inc. Al l r ights reserved.Copyr ight © SAS Inst i tute Inc. Al l r ights reserved.Copyr ight © SAS Inst i tute Inc. Al l r ights reserved.
Self-service Wrangling Blending
Data Preparation Ad
-ho
c data, very
flexibleBusiness Analyst
Citizen Data Scientist
LineageGlossary AuditingExtract, Transform,
Load
MonitoredManaged
Data Integration & Quality Data Governance
Data Steward
ETL Developer
IT Users
High
ly man
aged d
ata an
d o
ptim
ized
Dat
aD
isco
very

Copyr ight © SAS Inst i tute Inc. Al l r ights reserved.
Master Data Management
Data Storage & Archiving
Technology Architecture
Data Quality
Data Insights Strategy
Data Control Environment
Data Standardization
Data Dictionary
Data Management
Strategy
Data Strategy Framework
Data Architecture
Data Sourcing & Maintenance
Data Governance & Stewardship
Data Enablement &
Access
Business Strategy
Adherence
Cultural Change Strategy
https://www.sas.com/content/dam/SAS/en_au/doc/whitepaper1/five-essential-components-data-strategy.pdf
A data strategy is a plan designed to improve all the ways you acquire, store, manage, share and use data

Copyr ight © SAS Inst i tute Inc. Al l r ights reserved.Copyr ight © SAS Inst i tute Inc. Al l r ights reserved.
AI Adoption in the Enterprise 2021https://www.oreilly.com/radar/ai-adoption-in-the-enterprise-2021/
• In the past, company culture has been the most significant barrier to AI adoption.
While it’s still an issue, culture has dropped to fourth place.
• The biggest problems in this year’s survey are lack of skilled people and difficulty in hiring
(19%) and data quality (18%). It’s no surprise that the demand for AI expertise has exceeded
the supply, but it’s important to realize that it’s now become the biggest bar to wider
adoption. The biggest skills gaps were ML modelers and data scientists (52%), understanding
business use cases (49%), and data engineering (42%). The need for people managing and
maintaining computing infrastructure was comparatively low (24%), hinting that companies
are solving their infrastructure requirements in the cloud.

Copyr ight © SAS Inst i tute Inc. Al l r ights reserved.Copyr ight © SAS Inst i tute Inc. Al l r ights reserved.
O’REILLY Learninghttps://learning.oreilly.com/topics/enterprise-data-strategy/

Copyright © SAS Inst itute Inc. A l l r ights reserved.
https://www.sas.com/en/whitepapers/top-trends-tax-administrators-111564.html

Copyr ight © SAS Inst i tute Inc. Al l r ights reserved.Copyr ight © SAS Inst i tute Inc. Al l r ights reserved.
https://www.sas.com/content/dam/SAS/support/en/sas-global-forum-proceedings/2020/4617-2020.pdf

Copyr ight © SAS Inst i tute Inc. Al l r ights reserved.Copyr ight © SAS Inst i tute Inc. Al l r ights reserved.
Developing a data strategy1Where to locate the data analytics function2Centralized vs de-centralized
Capabilities and education
45
3
Stakeholder collaboration
6 Experimentation & learning
Creating a Data Analytics Function

Copyr ight © SAS Inst i tute Inc. Al l r ights reserved.Copyr ight © SAS Inst i tute Inc. Al l r ights reserved.
Making it easier for everyone to use analytics
to ask and answer the questions that drive
business forward

Copyr ight © SAS Inst i tute Inc. Al l r ights reserved.Copyr ight © SAS Inst i tute Inc. Al l r ights reserved.
“Fit for Purpose” means considering your business objectives and technical requirements alongside model accuracy.
Model deployment (or serving) is operationalization of the model and where it starts to generate value.
Where to Locate…Fit for PurposeWhy are we building a model?
• How does that model start generating value? • What are your business requirements?
• What are your metrics for success?
• The statistically best model might be the model you should deploy, but what about:• How fast does it execute?
• What data does it use?
• Is it reflecting your business goals?

Copyr ight © SAS Inst i tute Inc. Al l r ights reserved.Copyr ight © SAS Inst i tute Inc. Al l r ights reserved.
Where to Locate…Fit for PurposeWhat makes a model fit for its purpose?
Fit For Purpose
Model
Business
Data
Performance
Define all requirements before embarking on an analytical model building
project.
This means it is a collaborative process to
define the requirements of the project, involving
businesses, analytics and IT.

Copyr ight © SAS Inst i tute Inc. Al l r ights reserved.Copyr ight © SAS Inst i tute Inc. Al l r ights reserved.
Where to Locate…Fit for PurposeWhat makes a model fit for its purpose?
The Machine Learning Canvas helps to identify business, data, model, execution challenges before the start of the project (i.e., fail fast principle).

Copyr ight © SAS Inst i tute Inc. Al l r ights reserved.Copyr ight © SAS Inst i tute Inc. Al l r ights reserved.Copyr ight © SAS Inst i tute Inc. Al l r ights reserved.
REGISTER Provide oversight and governed
analytics.
DEPLOYEmbed and execute models,
leverage different engine based on the business need
MONITORGain visibility into analytic outcomes and approach.
RETRAINModels using pre-defined workflow
To execute training jobs
MODEL REPOSITORY
INTERACTIVE DASHBOARDS
WORKFLOW
Fit for Purpose Environment

Copyr ight © SAS Inst i tute Inc. Al l r ights reserved.Copyr ight © SAS Inst i tute Inc. Al l r ights reserved.
ModelOPs (MLOps) White Paper
https://learning.oreilly.com/library/view/practical-mlops/9781098103002/
https://learning.oreilly.com/library/view/introducing-mlops/9781492083283/

Copyr ight © SAS Inst i tute Inc. Al l r ights reserved.Copyr ight © SAS Inst i tute Inc. Al l r ights reserved.
ModelOPs White PaperSAS Global Forum: https://www.sas.com/content/dam/SAS/support/en/sas-global-forum-proceedings/2019/3368-
2019.pdf

Copyr ight © SAS Inst i tute Inc. Al l r ights reserved.Copyr ight © SAS Inst i tute Inc. Al l r ights reserved.
SAS Global Forum: https://www.sas.com/content/dam/SAS/support/en/sas-global-forum-proceedings/2020/4402-2020.pdf
ModelOPs White Paper

Copyr ight © SAS Inst i tute Inc. Al l r ights reserved.Copyr ight © SAS Inst i tute Inc. Al l r ights reserved.
Developing a data strategy1Where to locate the data analytics function2Centralized vs de-centralized
Capabilities and education
45
3
Stakeholder collaboration
6 Experimentation & learning
Creating a Data Analytics FunctionOverview

Copyright © SAS Inst itute Inc. A l l r ights reserved.
The deployment method is driven by the consuming application
Batch
Traditional CAS Container In-DB
On Demand
MAS Container
SAS code ASTORE Python R

Copyr ight © SAS Inst i tute Inc. Al l r ights reserved.Copyr ight © SAS Inst i tute Inc. Al l r ights reserved.
CASE STUDY: Problem: Every project at the tax agency addressed data issues as one-off, built-from scratch activities. The agencies IT team had 17 projects underway (new applications, application enhancements, new reports, etc.).
How does an integrated “centralized” analytics platform help?
➢ A single, integrated analytics platform incorporates data management techniques to ingest disparate data sets from internal sources (tax data) and external sources (other agencies, third parties, corporate data, etc.) – then the data is blended and cleansed before it’s used with analytics.
➢ All tax agents use the same data-based foundation for making decisions – with key information displayed visually in a way that’s easy to configure, search and consume
➢ Behavioral analytics identifies key types of fraud entities such as “shell company” – as well as patterns in behavior – to uncover connections among entities

Copyr ight © SAS Inst i tute Inc. Al l r ights reserved.Copyr ight © SAS Inst i tute Inc. Al l r ights reserved.
CASE STUDY: Problem: Every project at the tax agency addressed data issues as one-off, built-from scratch activities. The agencies IT team had 17 projects underway (new applications, application enhancements, new reports, etc.).
➢ Alert generation, scoring and risk analysis target the most appropriate cases for tax agents to investigate.
➢ Hybrid analytics approach blends social network analysis, anomaly detection and other analytical techniques to deliver the best possible results

Copyr ight © SAS Inst i tute Inc. Al l r ights reserved.Copyr ight © SAS Inst i tute Inc. Al l r ights reserved.
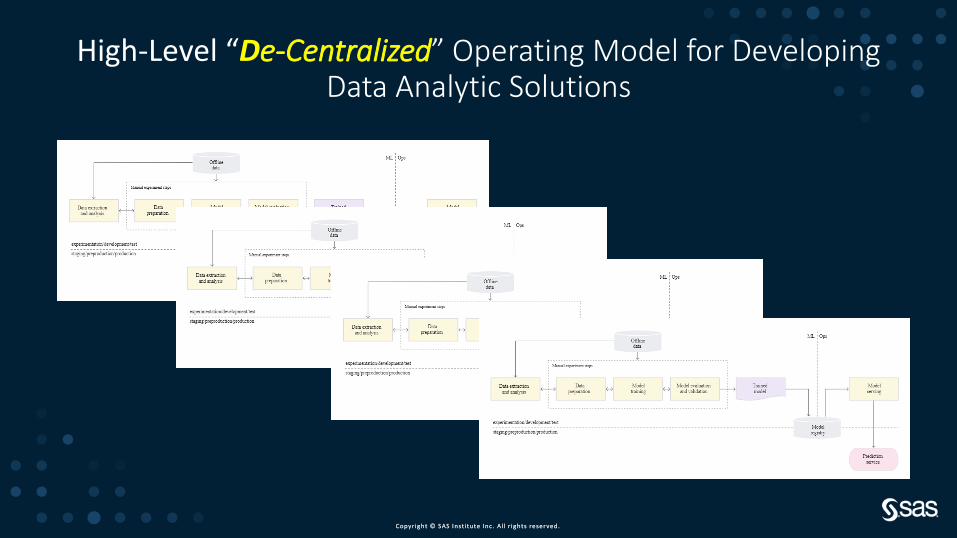
High-Level “De-Centralized” Operating Model for Developing Data Analytic Solutions
Copyr ight © SAS Inst i tute Inc. Al l r ights reserved.Copyr ight © SAS Inst i tute Inc. Al l r ights reserved.
High-Level “De-Centralized” Operating Model for Developing Data Analytic Solutions

Copyr ight © SAS Inst i tute Inc. Al l r ights reserved.Copyr ight © SAS Inst i tute Inc. Al l r ights reserved.
Automated Pipelines
High-Level “Centralized” Operating Model for Developing Data Analytic Solutions

Copyr ight © SAS Inst i tute Inc. Al l r ights reserved.
Operationalizing AnalyticsAn Integrated “Centralized” Analytics Platform
Performance Results
Fact Data
Publishing Services
OPERATIONAL
Data Lake/Warehouse
DISCOVERY
Visual Frontends
MODEL/DECISION PRODUCERS
MODEL/DECISION CONSUMERS
Streaming
Real Time
BatchIn databaseIn Hadoop
Cloud AnalyticsServices (CAS)
Kubernetes
MASR Python
BatchCAS Stream
{REST}
Internal Application
ExternalApplication
Decisions
GOVERNANCEMODEL/DECISION GOVERNORS
Central Repository
Models
BusinessRules D
E C
I S
I O
N S
Repository

Copyr ight © SAS Inst i tute Inc. Al l r ights reserved.
Data
Files & Objects
Database
Hadoop
IoT/StreamAPIs
REST
Python
Java
User Interfaces
R Studio
SAS Studio
Jupyter Notebook
SAS Visuals
Collaborative Workspaces
Data ManagementBatch Processing
Data ScienceModel Management
MANUAL SCALE
Individual WorkspacesRuntime Engines
Data ScienceBatch On-Demand
Analytic ApplicationsFunctions-as-a-Service
SCALE / INSTANTIATION
CollaborativeWorkspaces
Data ScienceData VisualizationBig Data Analytics
DYNAMIC SCALE
Virtual Machines
Single Containers
Private Cloud (Internal or Hosted) Public Cloud
IaaS
Multi-Container
Visual & Programming UIs Visual & Programming UIsProgramming UIs only
Docker + Kubernetes
Using Cloud / Containers to Centralize
Cloud Services
Logging / Monitoring
CI/CD
Authentication
…

Copyr ight © SAS Inst i tute Inc. Al l r ights reserved.
“Centralized” Analytics Platform…Needs Governance

Copyright © SAS Inst itute Inc. A l l r ights reserved.
Analytical Model GovernanceCentrally Manage ALL Analytic Models
Interoperability with third-party modeling tools to form a model management hub
• Monitor ALL models in production to maximize business value
• Govern ALL analytic models
• Share & collaborate
• Trace & prove with workflow and versioning
CENTRALLY MANAGE
GOVERN

Copyright © SAS Inst itute Inc. A l l r ights reserved.
Centralized can “push” and “pull” with REST API integration
Executing steps in different backends wherever it makes the most sense
• Execute business logic or rules
• Communicate with other processes using web services or Job Execution tasks
• Integrate the process with third-party applications
REST API Call

Copyright © SAS Inst itute Inc. A l l r ights reserved.
DASHBOARD: Continuous view of the model repository to the stakeholders

Copyr ight © SAS Inst i tute Inc. Al l r ights reserved.Copyr ight © SAS Inst i tute Inc. Al l r ights reserved.
Analytic / Data Architecture GovernanceO'REILLY : https://learninghttps://learning.oreilly.com/home/.oreilly.com/home/
Click to add text

Copyr ight © SAS Inst i tute Inc. Al l r ights reserved.Copyr ight © SAS Inst i tute Inc. Al l r ights reserved.
Capabilities and education
45
Stakeholder collaboration
6 Experimentation & learning
Creating a Data Analytics Function10-minute break

Copyr ight © SAS Inst i tute Inc. Al l r ights reserved.Copyr ight © SAS Inst i tute Inc. Al l r ights reserved.
Developing a data strategy1Where to locate the data analytics function2Centralized vs de-centralized
Capabilities and education
45
3
Stakeholder collaboration
6 Experimentation & learning
Creating a Data Analytics FunctionOverview

Copyr ight © SAS Inst i tute Inc. Al l r ights reserved.
Sandbox
• Create Decision Flow• Diagram Test
Validation
• Decision Logic Test• Decision Performance Test
Live
• Production Execution
Deploying decision logic

Copyr ight © SAS Inst i tute Inc. Al l r ights reserved.
Data Science Workbench
viya4 namespace prod namespace
dev namespacedomino namespace
Client
Kubernetes
External Databases
Data Lake Git Container Registry
Model Development Platform(Data Science Workbench)
SAS Viya Decisioning Platform(w/ Model Manager)
R
PySAS
...
R
PySAS
...
MS Azure
Example
•Cloud deployment (MS Azure)
oAll components deployed on managed Kubernetes cluster (AKS)
oConnect to cloud data sources as needed
•Data Science Workbench provides Python, SAS, … environments as Docker containers on demand
oScheduled to run in “dev” area
•From here, models are registered to Decisioning Platform and deployed to “prod” area using SAS Model Manager
Remote service
User

Copyr ight © SAS Inst i tute Inc. Al l r ights reserved.Copyr ight © SAS Inst i tute Inc. Al l r ights reserved.

Copyright © SAS Inst itute Inc. A l l r ights reserved.
Operationalizing AnalyticsThe Next Frontier
Data Discovery Deployment
Time
Value of Analytics
Prepare Data
Explore
Build Models
Deploy Model Manually
Rewrite toDeploy Model
No governance Model DecayModel Shift
Poor Insights
Manual Model Retrain/Retune
Quicker Data Discovery
Access more Data, Intelligent Data Preparation
Build better models faster
Automated Model Deployment
Monitor & Manager Model
Automated Decisioning & Model Governance
Improved insights
Greater Business Impact
Less or No Business Impact
ROI – value of making the right decisions quicker
Business Decisions