Crack Width Evaluation of RC Members Reinforced with ...kanakubo/kakumas2017.pdf · Crack Width...
52
Crack Width Evaluation of RC Members Reinforced with Braided AFRP Bars Shuai Hao (Master’s Program in Engineering Mechanics and Energy) Advised by Toshiyuki Kanakubo Submitted to the Graduate School of Systems and Information Engineering in Partial Fulfillment of the Requirements for the Degree of Master of Engineering at the University of Tsukuba March 2017
Transcript of Crack Width Evaluation of RC Members Reinforced with ...kanakubo/kakumas2017.pdf · Crack Width...

Crack Width Evaluation of RC Members
Reinforced with Braided AFRP Bars
Shuai Hao
(Master’s Program in Engineering Mechanics and Energy)
Advised by Toshiyuki Kanakubo
Submitted to the Graduate School of Systems and Information
Engineering in Partial Fulfillment of the Requirements for the
Degree of Master of Engineering
at the
University of Tsukuba
March 2017

i
ABSTRACT
The use of AFRP (Aramid Fiber-Reinforced Polymer) bars as an alternative to the steel reinforcements
is a feasible scheme to prevent the corrosion of rebar. However, AFRP bars with low elastic modulus
and bond stiffness could cause a larger crack width in comparison to steel rebar. It is a critical issue to
control cracks of concrete reinforced with AFRP bars. On the other hand, a second differential equation
on bond problem which considering bond force equilibrium and slip compatibility condition has been
solved as an equation given by relationship between the strain of reinforcement and loaded end slip
which is considered as the half of crack width.
This study aims to propose theoretical calculation formulas to predict crack width of RC members
reinforced with AFRP bars. Braided AFRP bars with two types of surface treatment, non-coated type
and sand-coated one, are focused on in this study. A pullout bond test was conducted for obtaining the
bond constitutive law which is considered as the key to propose the formulas. A tensile bond test which
can be used to confirm the adaptability of proposed calculation formula was carried out as well.
Two types of tri-linear models for bond constitutive law are proposed based on the experimental results
of pullout bond test both for non-coated and sand-coated type AFRP bars. Under the regression analysis
of the pullout bond test results, each of the bond stiffness and characteristic value is estimated as a
function which is mainly related to concrete strength and bar diameter. The crack width prediction
formulas are proposed by using the estimated bond constitutive law. The proposed crack width
prediction formulas show good agreements with the experimental crack widths observed in tensile bond
test.

ii
CONTENTS
CHAPTER 1 Introduction ························································································ 1
CHAPTER 2 Experiment Program ·············································································· 3
2.1 Tested Reinforcement and Concrete ······································································ 3
2.2 Pullout Bond Test ··························································································· 4
2.2.1 Outline of pullout bond test ·········································································· 4
2.2.2 Test results of pullout bond test ······································································ 6
2.3 Tensile Bond Test ························································································· 15
2.3.1 Outline of tensile bond test ········································································· 15
2.3.2 Test results of tensile bond test ···································································· 18
CHAPTER 3 Tri-linear Model for Bond Constitutive Law ················································· 22
3.1 Definition of Tri-Linear Model ········································································· 22
3.1.1 Tri-linear model for non-coated type AFRP bar ················································· 22
3.1.2 Tri-linear model for sand-coated type AFRP bar ················································ 23
3.2 Theoretical Calculation Formulas ······································································ 24
CHAPTER 4 Parameter Estimation for Theoretical Formulas ············································· 27
4.1 Parameter Estimation for Non-coated Type Specimen ··············································· 27
4.2 Parameter Estimation for Sand-Coated Type Specimen ············································· 32
4.3 Expression of Tri-Linear Model ········································································ 34
CHAPTER 5 Adaptability of Proposed Crack Width Prediction Formulas······························· 36
5.1 Bond Stiffness ····························································································· 36
5.2 Crack Width Prediction Formula ······································································· 38
5.2.1 Crack width prediction formula for non-coated type ············································ 38
5.2.2 Crack width prediction formula for sand-coated type ··········································· 40
5.3 Calculated Tri-Linear Model ············································································ 40
5.4 Adaptability of Calculated Prediction Formulas ······················································ 42
CHAPTER 6 Conclusions ······················································································ 45
ACKNOWLEDGEMENTS ···················································································· 46
REFERENCES ··································································································· 47

iii
LIST OF FIGURES
Fig. 2.1 Two types of AFRP bar ...................................................................................................... 3
Fig. 2.2 Details of specimens and loading method of pullout bond test .......................................... 6
Fig. 2.3 Photo of pullout bond test specimen .................................................................................. 6
Fig. 2.4 Example of bond stress – slip relationship of sand-coated type bar .................................. 7
Fig. 2.5 (a) Bond stress – slip relationship (RA7 series) ................................................................11
Fig. 2.5 (b) Bond stress – slip relationship (RA7 series, until 8mm) .............................................11
Fig. 2.5 (c) Bond stress – slip relationship (RA13 series) ............................................................. 12
Fig. 2.5 (d) Bond stress – slip relationship (RA13 series, until 8mm) .......................................... 12
Fig. 2.5 (e) Bond stress – slip relationship (RA7S series) ............................................................. 12
Fig. 2.5 (f) Bond stress – slip relationship (RA7S series, until 3mm) ........................................... 12
Fig. 2.5 (g) Bond stress – slip relationship (RA13S series) .......................................................... 13
Fig. 2.5 (h) Bond stress – slip relationship (RA13S series, until 3mm) ........................................ 13
Fig. 2.5 (i) Bond stress – slip relationship (RA9 series)................................................................ 13
Fig. 2.5 (j) Bond stress – slip relationship (RA9 series, until 8mm) ............................................. 13
Fig. 2.5 (k) Bond stress – slip relationship (RA11 series) ............................................................. 14
Fig. 2.5 (l) Bond stress – slip relationship (RA11 series, until 8mm) ........................................... 14
Fig. 2.5 (m) Bond stress – slip relationship (RA9S series) ........................................................... 14
Fig. 2.5 (n) Bond stress – slip relationship (RA9S series, until 3mm) .......................................... 14
Fig. 2.5 (o) Bond stress – slip relationship (RA11S series) ........................................................... 15
Fig. 2.5 (p) Bond stress – slip relationship (RA11S series, until 3mm) ........................................ 15
Fig. 2.6 Details and loading method of tensile bond test .............................................................. 16
Fig. 2.7 Details for tensile bond specimen of RA7&RA7S series ................................................ 16
Fig. 2.8 Photo of one prepared specimen for tensile bond test ...................................................... 16
Fig. 2.9 (a) Tensile load-total deformation relation for first series ................................................ 20
Fig. 2.9 (b) Tensile load - total deformation relation for second series ......................................... 21
Fig. 3.1 Definition of tri-linear model for non-coated type bar ..................................................... 22
Fig. 3.2 Definition of tri-linear model for sand-coated type bar ................................................... 23
Fig. 4.1 Max. bond stress – concrete strength relation .................................................................. 27
Fig. 4.2 Relationship between the max. bond stress of two types ................................................. 28
Fig. 4.3 τmax – fc relation................................................................................................................. 28
Fig. 4.4 Normalized τmax – db relation ............................................................................................ 28
Fig. 4.5 τ1 - fc relation (Non-coated type) ...................................................................................... 29
Fig. 4.6 τ1 - db relation (Non-coated type) ..................................................................................... 29
Fig. 4.7 s1 - db relation (Non-coated type) ..................................................................................... 29
Fig. 4.8 s1 – fc relation (Non-coated type) ..................................................................................... 29
Fig. 4.9 k2 - fc relation (Non-coated type, spenimen failed by pullout) ......................................... 30
Fig. 4.10 k2 - fc relation (Non-coated type) .................................................................................... 30
Fig. 4.11 k3 - fc relation (Non-coated type) .................................................................................... 30
Fig. 4.12 k3 - fc relation (Non-coated type, spenimen failed by pullout) ....................................... 30

iv
Fig. 4.13 k3 – smax relation (Non-coated type)................................................................................ 31
Fig. 4.14 smax - db relation (Non-coated type) ................................................................................ 31
Fig. 4.15 normalized smax - fc relation (Non-coated type) .............................................................. 31
Fig. 4.16 k1 - db relation (Sand-coated type) .................................................................................. 32
Fig. 4.17 k1 – fc relation (Sand-coated type) .................................................................................. 32
Fig. 4.18 τ1 / τmax - fc relation (Sand-coated type) .......................................................................... 33
Fig. 4.19 τu / τmax - fc relation (Sand-coated type) .......................................................................... 33
Fig. 4.20 smax - fc relation (Sand-coated type) ................................................................................ 33
Fig. 4.21 smax – db relation (Sand-coated type) .............................................................................. 33
Fig. 4.22 su - fc relation (Sand-coated type) ................................................................................... 34
Fig. 4.23 su – db relation (Sand-coated type) ................................................................................. 34
Fig. 5.1 (a) Calculated tri-liner model for non-coated type bar specimen ..................................... 41
Fig. 5.2 (b) Calculated tri-liner model for sand-coated type bar specimen ................................... 42
Fig. 5.3 (a) Crack width – reinforcement strain relationship (Non-coated type bar spenimen) .... 43
Fig. 5.4 (b) Crack width – reinforcement strain relationship (Sand-coated type bar specimen) ... 44

1
CHAPTER 1 Introduction
It is well known that concrete reinforced with steel rebar has long been used as a building construction
for its good durability and low cost. However, steel rebar has its own weakness: susceptibility to
corrosion. It has seriously impacted the performance of existing buildings safety and cause economic
loss due to corrosion-related maintenance. And also, steels are likely to conduct electrical and magnetic
fields, those are not desirable in some special building such as power-generation and medical use.
The use of AFRP (Aramid Fiber-Reinforced Polymer) bars as an alternative to the steel reinforcements
is a feasible scheme to prevent the corrosion of rebar. It can supplier for concrete applications where the
environments prohibit the use of steel owing to its noncorrosive nature and broad resistance to other
chemicals1-1. Moreover, AFRP bars also have an advantage of lightweight and high strength in
comparison to steel.
However, FRP (Fiber-Reinforced Polymer) reinforcements are manufactured from different fibers
(carbon, aramid, glass, etc.) with various resins and surface treatments which are different from
conventional steel rebar. Due to the lack of well-established standards and variation in their effective
parameters, it is difficult to propose a plenary model to predict the bond performance between concrete
and each FRP reinforcement. This study only focuses on braided AFRP bars with two types of surface
treatment which are non-coated and sand-coated treatment.
AFRP bars with low elastic modulus and bond stiffness may cause a lager crack width of concrete. It is
a critical issue to control cracks of concrete reinforced with AFRP bars. The numbers of studies have
been conducted regarding the crack width of reinforced concrete members. On those conclusions that
bond behavior between reinforcement and concrete controls the crack characteristics of the reinforced
concrete members and the bond behavior itself is determined by bond stress and slip relationship
(hereinafter, bond constitutive law). Meanwhile, a second differential equation on bond problem which
considering bond force equilibrium and slip compatibility condition has been introduced1-2. It is
expected to be solved as a form given by relationship between the strain of reinforcement and loaded
end slip which is consider as the half of crack width1-3 (Eq. (1)). If the function of bond stress and slip
is determined, the crack width prediction formula can be obtained by integral calculus of the Eq. (1).
Therefore, a theoretical and general calculation formula to predict crack width of reinforced concrete
members has been proposed by using the bi-linear model for bond constitutive law to solve the bond
problem equation1-3.

2
εbl =ϕb
σct·Ac∫ τbsl
0· ds + (
1+n·p
2)σct·Ac
Eb·Ab Eq. (1)
where,
εbl ∶ strain of reinforcement at loaded end
ϕb
∶ perimeter of bar, σct ∶ tensile strength of concrete
Ac ∶ sectional area of concrete, Ab ∶ sectional area of reinforcement
Eb ∶ elastic modulus of reinforcement, sl ∶ slip at loaded end
Ec ∶ elastic modulus of concrete, τb ∶ bond stress
n ∶ elastic modulus ratio = Eb/Ec
p ∶ reinforcement ratio=Ab/Ac
The above equation also includes the elastic modulus which has an influence on the crack width. It is
expected to solve the equation by giving the information of bond constitutive law of AFRP bars to obtain
a reliable crack width prediction formula for AFRP bar.
This study aims to propose theoretical calculation formulas to predict crack width of RC members
reinforced with AFRP bars. In contrast to traditional steel bars, the bond constitutive law should be
described by tri-linear model, considering the bond behavior between the AFRP bars and concrete.
Chapter two introduces the outline of experiment and the test results. It includes the method to obtain
the bond constitutive law by conducting pullout bond test and the experiment program about tensile
bond test which can be used to confirm the adaptability of proposed calculation formulas.
Chapter three introduces the tri-linear model for bond constitutive law based on the test results and the
solution result of Eq. (1) by using the proposed constitutive law to give the theoretical calculation
formulas.
Chapter four focuses on estimating the parameters of theoretical calculation formulas to make a general
prediction formula for braided AFRP bars where the formulas are expected to be given by a function of
bar dimeter, compressive strength of concrete and some other constants.
Chapter five presents the general calculation formula for braided AFRP bars based on the parameter
estimation in chapter 4 and discusses the adaptability of calculation formula.
Chapter six summarizes this study and presents the conclusions.

3
CHAPTER 2 Experiment Program
The bond constitutive law is the key component to propose calculation formulas. It should be obtained
directly by conducting pullout bond test. And the tensile bond test is also performed to obtain measured
crack width in order to compare the experimental results and the calculated ones, which can be used to
confirm the adaptability of the proposed calculation formulas. Both two tests are conducted at the same
time using same reinforcement and concrete under an assumption that local bond constitutive law in
pullout bond test has not changed in the condition of tensile bond test.
2.1 Tested Reinforcement and Concrete
Fig. 2.1 shows the tested reinforcements with two types of surface. One is non-coated type and another
one is the sand-coated type. Each type of them includes four different diameters. As shown in Table 2.1,
regarding to the mechanical properties of two types of tested reinforcement, there is no difference
between the two types if the diameters are same. In addition, the elastic modulus among those four
different diameter of bars do not change too much.
There are two series of experiment has been conducted. The first series is for reinforcement with
diameter of 8.10mm and 13.51mm. Those concrete target compressive strength was set as 36MPa. The
second series of experiment was performed with the specimen reinforced with bar diameter of 9.73mm
and 10.95mm.Those concrete target compressive strength was set as 24MPa, 36MPa and 48MPa.
Table 2.2 shows the mechanical properties of concrete. For each series of experiment, same batch of
concrete are used for both pullout bond test and tensile bond test.
Non-coated type Sand-coated type
(named “RA”) (named “RAS”)
Fig. 2.1 Two types of AFRP bar

4
Table 2.1 List of reinforcement
Reinforcement Diameter
(mm)
Max. tensile strength
(kN)
Elastic modulus
(kN/mm2)
RA7&RA7S 8.10 69 63.7
RA9&RA9S 9.73 100 66.2
RA11&RA11S 10.95 124 66.3
RA13&RA13S 13.51 186 71.2
Table 2.2 Mechanical properties of concrete
Series Concrete target strength
(N/mm2)
Compressive strength
(N/mm2)
Tensile strength
(N/mm2)
Elastic modulus
(kN/mm2)
1st 36 37.2 2.67 26.9
2nd 24 28.5 2.63 23.8
2nd 36 37.6 3.32 26.3
2nd 48 48.5 3.76 29.5
2.2 Pullout Bond Test
2.2.1 Outline of pullout bond test
Pullout bond test was conducted for obtaining the bond constitutive law between AFRP bar and concrete
directly.
Table 2.3 shows the list of specimens. Three same specimens for each parameter were tested.
Fig. 2.2 shows the detail of test specimens. It is a rectangular concrete block with height of 100mm. The
sectional size of the concrete block in first series are varying as 80x80mm, 100x100mm and 120x120mm.
The sectional size of the concrete in second series was set as 100x100mm.
One AFRP bar is arranged in the central position of the concrete block. Unbonded region is set at the
both loaded and free end with length of 4 times bar diameter, db. Teflon sheet was placed between
specimen and steel plate to avoid the restriction of lateral displacement of concrete block. One LVDT
was set at the free end of concrete block to measure slip at free end. The loaded end slip is calculated as
the elongation of reinforcement added to the free end slip under the assumption that bond stress
distributes uniformly among the bonded region. Fig .2.3 shows a photo of specimen.
Each specimen was subjected to the monotonic pullout load until the slippage of reinforcement reached
to 20 mm or concrete failed by splitting.

5
Table 2.3 (a) List of specimens of first series
Specimen ID Reinforcement
Concrete
sectional size
(mm x mm)
Bonded region
(mm)
Number of
specimens
P80RA7
RA7
80x80
32
3
P100RA7 100x100 3
P120RA7 120x120 3
P80RA7S
RA7S
80x80 3
P100RA7S 100x100 3
P120RA7S 120x120 3
P80RA13
RA13
80x80
52
3
P100RA13 100x100 3
P120RA13 120x120 3
P80RA13S
RA13S
80x80 3
P100RA13S 100x100 3
P120RA13S 120x120 3
Table 2.3 (b) List of specimens of second series
Specimen ID Reinforcement
Concrete
target strength
(N/mm2)
Bonded region
(mm)
Number of
specimens
C24RA9 RA9
24
36 3
C24RA11 RA11 44 3
C24RA9S RA9S 36 3
C24RA11S RA11S 44 3
C36RA9 RA9
36
36 3
C36RA11 RA11 44 3
C36RA9S RA9S 36 3
C36RA11S RA11S 44 3
C48RA9 RA9
48
36 3
C48RA11 RA11 44 3
C48RA9S RA9S 36 3
C48RA11S RA11S 44 2*
*: One of the specimen was not cast appropriately (the free end of AFRP bar was
not outside of concrete block, LVDT cannot measure the slippage of bar)

6
Fig. 2.2 Details of specimens and loading method of pullout bond test
Fig. 2.3 Photo of pullout bond test specimen
2.2.2 Test results of pullout bond test
Table 2.4 shows the test results of pullout bond test for specimen of both two types. The sectional size
of concrete does not have a large influence to the max. bond stress and its corresponding slippage. For
those specimens reinforced with sand-coated type bar, the stiff resistance is provided by bearing between
sand and concrete. When this resistance fails, the bar starts slipping with a sudden fall of bond stress.
The bond stress at where the bar starts slipping is defined as “slipping bond stress” in this study. Fig.
2.4 shows the example of bond stress-slip relationship of sand-coated type bar and the definition of
slipping bond stress.
Unbond region
Bond r
egio
n
10
0
80(100,120)
80
(10
0,1
20
)AFRP Rod
80(100,120)
Coupler
4d
b
LVDT
Teflon sheet
Reaction plate
Loading direction
Steel plate
Coupler

7
Fig. 2.4 Example of bond stress – slip relationship of sand-coated type bar
Basically, as the bar diameter increasing, concrete is more likely failed by splitting. Regarding to the
specimen reinforced with non-coated type bar, the max. bond stress of those splitting specimens were
not obtained. On the other hand, although several specimens reinforced with sand-coated type bar failed
by concrete splitting, the slipping bond stress was obtained because the splitting failure occurred during
the second or third increase branch of bond stress and it is far away from the slip at the slipping bond
stress.
Fig. 2.5 shows the bond stress and slip relationship for each specimen. It can be found that the surface
treatment of AFRP braided bar determines the characteristic of bond constitutive law. Sand coated type
shows higher bond stiffness than that of non-coated. However, regardless of the surface treatment of
those two types, the max. bond stress are similar. For both two types, after reaching the first peak of
bond stress there is a decrease branch. At the end of decrease branch, the bond stress will increase again.
This is considered that the lugs as the surface shape of braided bars move toward to loaded end will
cause a new mechanical occlusion between the reinforcement and concrete.
In addition, for predicting the crack width, the whole bond constitutive law from 0 to 20mm is not
necessary. Fig. 2.5 also shows a relative small range of the bond constitutive law which is set as 8mm
for non-coated type and 3mm for sand-coated type, respectively.
0 0.5 1 1.50
5
10
15
Loaded end slip (mm)B
ond s
tress
(N
/mm
2)
Slipping bond stress

8
Table 2.4 (a) Test results of pullout bond test (non-coated type, first series)
Specimen ID Sectional size
(mm x mm)
Max. bond stress
(N/mm2)
Slip at max.
bond stress
(mm)
Failure mode
P80RA7-1
80x80
11.22 4.90
Pullout P80RA7-2 11.77 5.02
P80RA7-3 10.73 5.20
P80RA13-1 9.71 1.97
Concrete splitting P80RA13-2 8.75 3.63
P80RA13-3 8.52 2.86
P100RA7-1
100x100
10.83 4.37
Pullout P100RA7-2 12.37 3.84
P100RA7-3 13.31 4.13
P100RA13-1 11.00 2.56
Concrete splitting P100RA13-2 11.47 3.68
P100RA13-3 9.27 2.53
P120RA7-1
120x120
13.19 4.80
Pullout P120RA7-2 13.34 4.63
P120RA7-3 14.22 3.10
P120RA13-1 9.86 3.53
Concrete splitting P120RA13-2 12.10 4.35
P120RA13-3 11.10 3.01

9
Table 2.4 (b) Test results of pullout bond test (sand-coated type, first series)
Specimen ID Sectional size
(mm x mm)
Slipping bond stress
(N/mm2)
Slip at slipping
bond stress
(mm)
Failure mode
P80RA7S-1
80x80
11.50 0.12 Pullout
P80RA7S-2 12.26 0.12
P80RA7S-3 13.45 0.23 Concrete splitting
P80RA13S-1 10.23 0.15
Pullout
P80RA13S-2 10.05 0.16
P80RA13S-3 10.84 0.16
P100RA7S-1
100x100
10.76 0.12
P100RA7S-2 10.39 0.14
P100RA7S-3 10.12 0.19
P100RA13S-1 8.73 0.18
P100RA13S-2 9.77 0.24
P100RA13S-3 7.94 0.14
P120RA7S-1
120x120
11.50 0.33
P120RA7S-2 11.29 0.18
P120RA7S-3 9.22 0.17
P120RA13S-1 11.32 0.21
P120RA13S-2 10.97 0.17
P120RA13S-3 9.43 0.20

10
Table 2.4 (c) Test results of pullout bond test (non-coated type, second series)
Specimen ID
Concrete
strength
(N/mm2)
Max. bond stress
(N/mm2)
Slip at max.
bond stress
(mm)
Failure mode
C24RA9-1
28.5
11.48 4.83
Pullout C24RA9-2 11.81 4.66
C24RA9-3 13.31 5.43
C24RA11-1 14.63 4.85
Concrete splitting C24RA11-2 14.70 3.34
C24RA11-3 12.38 2.75
C36RA9-1
37.6
14.02 4.74
Pullout C36RA9-2 11.95 4.47
C36RA9-3 11.13 4.10
C36RA11-1 12.56 4.59 Concrete splitting
C36RA11-2 13.26 5.65
C36RA11-3 11.20 5.96 Pullout
C48RA9-1
48.5
10.81 5.68
Pullout C48RA9-2 15.58 5.23
C48RA9-3 14.40 6.95
C48RA11-1 17.02 2.14
Concrete splitting C48RA11-2 16.48 2.46
C48RA11-3 17.70 2.89

11
Table 2.4 (d) Test results of pullout bond test (sand-coated type, second series)
Specimen ID
Concrete
strength
(N/mm2)
Slipping bond stress
(N/mm2)
Slip at slipping
bond stress
(mm)
Failure mode
C24RA9S-1
28.5
10.23 0.17 Concrete splitting
C24RA9S-2 12.10 0.15
C24RA9S-3 12.09 0.17 pullout
C24RA11S-1 12.19 0.22
Concrete splitting C24RA11S-2 12.98 0.20
C24RA11S-3 12.25 0.25
C36RA9S-1
37.6
13.89 0.18 Pullout
C36RA9S-2 14.53 0.19 Concrete splitting
C36RA9S-3 11.41 0.12 Pullout
C36RA11S-1 11.26 0.17 Concrete splitting
C36RA11S-2 10.80 0.17
C36RA11S-3 11.39 0.18 Pullout
C48RA9S-1
48.5
15.22 0.20 Concrete splitting
C48RA9S-2 14.53 0.20 Pullout
C48RA9S-3 16.16 0.16
Concrete splitting C48RA11S-1 14.76 0.21
C48RA11S-2 14.00 0.20
Fig. 2.5 (a) Bond stress – slip relationship (RA7 series)
Fig. 2.5 (b) Bond stress – slip relationship (RA7 series, until 8mm)
0 5 10 15 200
5
10
15
20
Loaded end slip (mm)
Bo
nd
str
ess
(N
/mm
2) 80x80mm
RA7
P80RA7-1 P80RA7-2 P80RA7-3
0 5 10 15 200
5
10
15
20
Loaded end slip (mm)
Bo
nd
str
ess
(N
/mm
2) 100x100mm
RA7
P100RA7-1 P100RA7-2 P100RA7-3
0 5 10 15 200
5
10
15
20
Loaded end slip (mm)
Bo
nd
str
ess
(N
/mm
2) 120x120mm
RA7
P120RA7-1 P120RA7-2 P120RA7-3
0 2 4 6 80
5
10
15
20
Loaded end slip (mm)
Bond s
tress
(N
/mm
2) 80x80mm
RA7
P80RA7-1 P80RA7-2 P80RA7-3
0 2 4 6 80
5
10
15
20
Loaded end slip (mm)
Bo
nd
str
ess
(N
/mm
2) 100x100mm
RA7
P100RA7-1 P100RA7-2 P100RA7-3
0 2 4 6 80
5
10
15
20
Loaded end slip (mm)
Bo
nd
str
ess
(N
/mm
2) 120x120mm
RA7
P120RA7-1 P120RA7-2 P120RA7-3

12
Fig. 2.5 (c) Bond stress – slip relationship (RA13 series)
Fig. 2.5 (d) Bond stress – slip relationship (RA13 series, until 8mm)
Fig. 2.5 (e) Bond stress – slip relationship (RA7S series)
Fig. 2.5 (f) Bond stress – slip relationship (RA7S series, until 3mm)
0 10 200
5
10
15
20
Loaded end slip (mm)
Bo
nd
str
ess
(N
/mm
2) 80x80mm
RA13
P80RA13-1 P80RA13-2 P80RA13-3
0 5 10 15 200
5
10
15
20
Loaded end slip (mm)
Bo
nd
str
ess
(N
/mm
2) 100x100mm
RA13
P100RA13-1 P100RA13-2 P100RA13-3
0 5 10 15 200
5
10
15
20
Loaded end slip (mm)
Bo
nd
str
ess
(N
/mm
2) 120x120mm
RA13
P120RA13-1 P120RA13-2 P120RA13-3
0 2 4 6 80
5
10
15
20
Loaded end slip (mm)
Bo
nd s
tress
(N
/mm
2) 80x80mm
RA13
P80RA13-1 P80RA13-2 P80RA13-3
0 2 4 6 80
5
10
15
20
Loaded end slip (mm)
Bo
nd s
tress
(N
/mm
2) 100x100mm
RA13
P100RA13-1 P100RA13-2 P100RA13-3
0 2 4 6 80
5
10
15
20
Loaded end slip (mm)
Bo
nd s
tress
(N
/mm
2) 120x120mm
RA13
P120RA13-1 P120RA13-2 P120RA13-3
0 5 10 15 200
5
10
15
20
Loaded end slip (mm)
Bo
nd
str
ess
(N
/mm
2)
80x80mmRA7S
P80RA7S-1 P80RA7S-2 P80RA7S-3
0 5 10 15 200
5
10
15
20
Loaded end slip (mm)
Bo
nd
str
ess
(N
/mm
2) 100x100mm
RA7S
P100RA7S-1 P100RA7S-2 P100RA7S-3
0 5 10 15 200
5
10
15
20
Loaded end slip (mm)
Bo
nd
str
ess
(N
/mm
2) 120x120mm
RA7S
P120RA7S-1 P120RA7S-2 P120RA7S-3
0 1 2 30
5
10
15
20
Loaded end slip (mm)
Bo
nd s
tress
(N
/mm
2)
80x80mmRA7S
P80RA7S-1 P80RA7S-2 P80RA7S-3
0 1 2 30
5
10
15
20
Loaded end slip (mm)
Bo
nd s
tress
(N
/mm
2) 100x100mm
RA7S
P100RA7S-1 P100RA7S-2 P100RA7S-3
0 1 2 30
5
10
15
20
Loaded end slip (mm)
Bo
nd s
tress
(N
/mm
2) 120x120mm
RA7S
P120RA7S-1 P120RA7S-2 P120RA7S-3

13
Fig. 2.5 (g) Bond stress – slip relationship (RA13S series)
Fig. 2.5 (h) Bond stress – slip relationship (RA13S series, until 3mm)
Fig. 2.5 (i) Bond stress – slip relationship (RA9 series)
Fig. 2.5 (j) Bond stress – slip relationship (RA9 series, until 8mm)
0 5 10 15 200
5
10
15
20
Loaded end slip (mm)
Bo
nd
str
ess
(N
/mm
2)
80x80mmRA13S
P80RA13S-1 P80RA13S-2 P80RA13S-3
0 5 10 15 200
5
10
15
20
Loaded end slip (mm)
Bo
nd
str
ess
(N
/mm
2) 100x100mm
RA13S
P100RA13S-1 P100RA13S-2 P100RA13S-3
0 5 10 15 200
5
10
15
20
Loaded end slip (mm)
Bo
nd
str
ess
(N
/mm
2) 120x120mm
RA13S
P120RA13S-1 P120RA13S-2 P120RA13S-3
0 1 2 30
5
10
15
20
Loaded end slip (mm)
Bo
nd s
tress
(N
/mm
2)
80x80mmRA13S
P80RA13S-1 P80RA13S-2 P80RA13S-3
0 1 2 30
5
10
15
20
Loaded end slip (mm)
Bo
nd s
tress
(N
/mm
2) 100x100mm
RA13S
P100RA13S-1 P100RA13S-2 P100RA13S-3
0 1 2 30
5
10
15
20
Loaded end slip (mm)
Bo
nd s
tress
(N
/mm
2) 120x120mm
RA13S
P120RA13S-1 P120RA13S-2 P120RA13S-3
0 5 10 15 200
5
10
15
20
Loaded end slip (mm)
Bo
nd
str
ess
(N
/mm
2) C24RA9
C24RA9-1 C24RA9-2 C24RA9-3
0 5 10 15 200
5
10
15
20
Loaded end slip (mm)
Bo
nd
str
ess
(N
/mm
2) C36RA9
C36RA9-1 C36RA9-2 C36RA9-3
0 5 10 15 200
5
10
15
20
Loaded end slip (mm)
Bo
nd
str
ess
(N
/mm
2) C48RA9
C48RA9-1 C48RA9-2 C48RA9-3
0 2 4 6 80
5
10
15
20
Loaded end slip (mm)
Bo
nd s
tress
(N
/mm
2) C24RA9
C24RA9-1 C24RA9-2 C24RA9-3
0 2 4 6 80
5
10
15
20
Loaded end slip (mm)
Bo
nd s
tress
(N
/mm
2) C36RA9
C36RA9-1 C36RA9-2 C36RA9-3
0 2 4 6 80
5
10
15
20
Loaded end slip (mm)
Bo
nd s
tress
(N
/mm
2) C48RA9
C48RA9-1 C48RA9-2 C48RA9-3

14
Fig. 2.5 (k) Bond stress – slip relationship (RA11 series)
Fig. 2.5 (l) Bond stress – slip relationship (RA11 series, until 8mm)
Fig. 2.5 (m) Bond stress – slip relationship (RA9S series)
Fig. 2.5 (n) Bond stress – slip relationship (RA9S series, until 3mm)
0 5 10 15 200
5
10
15
20
Loaded end slip (mm)
Bo
nd
str
ess
(N
/mm
2) C24RA11
C24RA11-1 C24RA11-2 C24RA11-3
0 5 10 15 200
5
10
15
20
Loaded end slip (mm)
Bo
nd
str
ess
(N
/mm
2) C36RA11
C36RA11-1 C36RA11-2 C36RA11-3
0 5 10 15 200
5
10
15
20
Loaded end slip (mm)
Bo
nd
str
ess
(N
/mm
2) C48RA11
C48RA11-1 C48RA11-2 C48RA11-3
0 2 4 6 80
5
10
15
20
Loaded end slip (mm)
Bo
nd s
tress
(N
/mm
2) C24RA11
C24RA11-1 C24RA11-2 C24RA11-3
0 2 4 6 80
5
10
15
20
Loaded end slip (mm)
Bo
nd s
tress
(N
/mm
2) C36RA11
C36RA11-1 C36RA11-2 C36RA11-3
0 2 4 6 80
5
10
15
20
Loaded end slip (mm)
Bo
nd s
tress
(N
/mm
2) C48RA11
C48RA11-1 C48RA11-2 C48RA11-3
0 10 200
5
10
15
20
25
Loaded end slip (mm)
Bo
nd
str
ess
(N
/mm
2) C24RA9S
C24RA9S-1 C24RA9S-2 C24RA9S-3
0 5 10 15 200
5
10
15
20
25
Loaded end slip (mm)
Bo
nd
str
ess
(N
/mm
2) C36RA9S
C36RA9S-1 C36RA9S-2 C36RA9S-3
0 5 10 15 200
5
10
15
20
25
Loaded end slip (mm)
Bo
nd
str
ess
(N
/mm
2) C48RA9S
C48RA9S-1 C48RA9S-2 C48RA9S-3
0 1 2 30
5
10
15
20
25
Loaded end slip (mm)
Bo
nd s
tress
(N
/mm
2) C24RA9S
C24RA9S-1 C24RA9S-2 C24RA9S-3
0 1 2 30
5
10
15
20
25
Loaded end slip (mm)
Bo
nd s
tress
(N
/mm
2) C36RA9S
C36RA9S-1 C36RA9S-2 C36RA9S-3
0 1 2 30
5
10
15
20
25
Loaded end slip (mm)
Bo
nd s
tress
(N
/mm
2) C48RA9S
C48RA9S-1 C48RA9S-2 C48RA9S-3

15
Fig. 2.5 (o) Bond stress – slip relationship (RA11S series)
Fig. 2.5 (p) Bond stress – slip relationship (RA11S series, until 3mm)
2.3 Tensile Bond Test
2.3.1 Outline of tensile bond test
The purpose of tensile bond test is to obtain measured crack width to compare with calculated value by
the proposing formulas.
Specimen for tensile bond test is shown in Fig. 2.6. The specimen is a concrete prism with length of
1680mm using same reinforcement and same batch of concrete with pullout bond. There are also two
series of tensile bond test. The first series with the sectional size of concrete prism varies as 80mm x
80mm, 100mm x100mm and 120mm x120mm. While the second series with the same sectional size of
concrete which is 100mm x 100mm but the concrete strength varies as 24MPa, 36MPa and 48MPa. The
combination of each parameter is just same as pullout bond test.
Fourteen Pi-gauges which along the axial direction were set on the two sides of concrete surface to
measure crack width. The interval of those Pi-gauges is also shown in Fig. 2.6. The experimental crack
width is measured by the deformation in one section where corresponding to a couple of LVDTs on
symmetrical side of concrete prism. The one crack width is measured for the section until the second
crack occurs in same section. Two LVDTs were set beside the specimen to measure the total deformation.
Each Specimen are subjected to tensile load until it reaches to a particular value in order to ensure the
crack will take place and not to break the AFRP bar. To make sure crack appears before AFRP bar
broken, three slits were conducted in two specimens (120mm x 120mm, reinforced with RA7and RA7S)
0 5 10 15 200
5
10
15
20
25
Loaded end slip (mm)
Bo
nd
str
ess
(N
/mm
2) C24RA11S
C24RA11S-1 C24RA11S-2 C24RA11S-3
0 5 10 15 200
5
10
15
20
25
Loaded end slip (mm)
Bo
nd
str
ess
(N
/mm
2) C36RA11S
C36RA11S-1 C36RA11S-2 C36RA11S-3
0 5 10 15 200
5
10
15
20
25
Loaded end slip (mm)
Bo
nd
str
ess
(N
/mm
2) C48RA11S
C48RA11S-1 C48RA11S-2
0 1 2 30
5
10
15
20
25
Loaded end slip (mm)
Bo
nd s
tress
(N
/mm
2) C24RA11S
C24RA11S-1 C24RA11S-2 C24RA11S-3
0 1 2 30
5
10
15
20
25
Loaded end slip (mm)
Bo
nd s
tress
(N
/mm
2) C36RA11S
C36RA11S-1 C36RA11S-2 C36RA11S-3
0 1 2 30
5
10
15
20
25
Loaded end slip (mm)
Bo
nd s
tress
(N
/mm
2) C48RA11S
C48RA11S-1 C48RA11S-2
16
before loading as shown in Fig.2.7. The section area at slit is as same as 80mm x 80mm. Fig. 2.8 gives
the photo of one prepared specimen for tensile bond test.
Fig. 2.6 Details and loading method of tensile bond test
Fig. 2.7 Details for tensile bond specimen of RA7&RA7S series
Fig. 2.8 Photo of one prepared specimen for tensile bond test
1680
40250250200250 20020025040
LVDT
Pi-gauge
Unit: mm
54
Slit
Specimen with 120mm x 120mm,
reinforced with RA7 and RA7S
420 420 420 420
Unit: mm
12
0
33 33

17
Table 2.5 shows the list of specimens for tensile bond test. As mentioned before, the upper limit load
was set for safety.
Table 2.5 (a) List of tensile bond test specimen (first series)
Specimen ID Sectional size
(mm x mm) Reinforcement
Upper limit load
(kN)
T-80RA7 80x80
RA7
50
T-100RA7 100x100 35
T-120RA7 120x120 30
T-80RA7S 80x80
RA7S
50*
T-100RA7S 100x100 35
T-120RA7S 120x120 30
T-80RA13 80x80
RA13
100
T-100RA13 100x100 100
T-120RA13 120x120 100
T-80RA13 80x80
RA13S
100
T-100RA13 100x100 100
T-120RA13 120x120 100
*: AFRP bar was broken at 40.2 kN
Table 2.5 (b) List of tensile bond test specimen (second series)
Specimen ID
Concrete
strength
(N/mm2)
Reinforcement Upper limit load
(kN)
T-C24RA9
28.5
(C24)
RA9 60
T-C24RA9S RA9S 60
T-C24RA7 RA11 70
T-C24RA7S RA11S 70
T-C36RA7S
37.6
(C36)
RA9 60
T-C36RA7S RA9S 60
T-C36RA13 RA11 70
T-C36RA13 RA11S 70
T-C48RA13
48.5
(C48)
RA9 60
T-C48RA13 RA9S 60
T-C48RA13 RA11 70
T-C48RA13 RA11S 70

18
2.3.2 Test results of tensile bond test
Final crack patterns after loading are shown in Table 2.6. The perpendicular dashed line shows the
location of the fixed points of Pi-gauges. It is obviously that there is a huge difference between the two
specimens reinforced with two types of AFRP bar. A good bond performance which means the higher
bond stiffness (sand-coated series) can lead larger numbers of cracks. Meanwhile, the first series test
results indicate that the crack spacing increases as the sectional size becomes larger. The number of
cracks will increasing when the reinforcement ratio decreased. However, the concrete strength does not
have a large influence on the crack patterns.
Table 2.6 (a) Crack patterns for specimen reinforced with RA7&RA7S
RA7 RA7S
80mm
x
80mm
100mm
x
100mm
120mm
x
120mm
3 slits
3 slits
Table 2.6 (b) Crack patterns for specimen reinforced with RA13&RA13S
RA13 RA13S
80mm
x
80mm
100mm
x
100mm
120mm
x
120mm

19
Table 2.6 (c) Crack patterns for specimen reinforced with RA9&RA9S
RA9 RA9S
C24
C36
C48
Table 2.6 (d) Crack patterns for specimen reinforced with RA11&RA11S
RA11 RA11S
C24
C36
C48

20
Tensile load versus total deformation curves are shown in Fig. 2.9. The straight lines from the origin
indicate the relationship for bare reinforcement. Tension stiffening effect can be found in all the
specimens. With the sectional size of concrete increasing, the effect will become higher. However, the
increasing of concrete strength does not provide a much higher tension stiffening effect. The curves
show several drops of tensile load at which a new crack takes place.
Fig. 2.9 (a) Tensile load-total deformation relation for first series
10 20 30
10
20
30
40
50
0
Total deformation (mm)
Ten
sile
lo
ad (
kN
)
80x80mm 100x100mm 120x120mm
(with slit) Bare bar
RA7
10 20 30
10
20
30
40
50
0
Total deformation (mm)
Tensi
le l
oad
(kN
)
80x80mm 100x100mm 120x120mm
(with slit) Bare bar
RA7S
10 20 30
20
40
60
80
100
0
Total deformation (mm)
Ten
sile
lo
ad
(k
N)
80x80mm 100x100mm 120x120mm Bare bar
RA13
10 20 30
20
40
60
80
100
0
Total deformation (mm)
Ten
sile
lo
ad
(k
N)
80x80mm 100x100mm 120x120mm Bare bar
RA13S

21
Fig. 2.9 (b) Tensile load - total deformation relation for second series
10 20
20
40
60
0
C24 C36 C48 Bare bar
RA9
Total deformation (mm)
Ten
sile
lo
ad
(k
N)
10 20
20
40
60
0
C24 C36 C48 Bare bar
RA9S
Total deformation (mm)
Ten
sile
lo
ad
(k
N)
10 20
20
40
60
0
C24 C36 C48 Bare bar
RA11
Total deformation (mm)
Tensi
le l
oad (
kN
)
10 20
20
40
60
0
C24 C36 C48 Bare bar
RA11S
Total deformation (mm)
Ten
sile
lo
ad
(k
N)

22
CHAPTER 3
Tri-Linear Model for Bond Constitutive Law
3.1 Definition of Tri-Linear Model
As there is a large difference between the bond behaviors of two types of AFRP bar, two types of tri-
linear model are introduced. One is for the non-coated type and the other is for sand-coated type.
3.1.1 Tri-linear model for non-coated type AFRP bar
Fig. 3.1 shows the tri-linear model for non-coated type AFRP bar.
Extended image for the part of k1 and k2
Fig. 3.1 Definition of tri-linear model for non-coated type bar
The tri-linear model for non-coated type only consider the increase branch of the bond stress because
the smax is large enough that can provide a widely range crack width prediction formulas. The definition
and mathematical expressions are given as follows.
max maximum bond stress
maxs slip at max
max23
2
2s slip at 2
111 sk
max21
max22
123
26
sk
sGs
f
slip
1
2
max
k1
k2
k3
s1 s2
Bo
nd
str
ess
smax
Test result Tri-linear model
slip
1
2
k1
k2
s1
Bo
nd
str
ess
s2
Test result Tri-linear model

23
2fG = fracture energy during bond stress from 0 to 2
From the Fig. 3.1, the two straight line of k1 and k2 cut the curve of test result into two enclosed parts.
The s1 can be calculated by leading those two parts with same area. The τmax, smax, s2, Gf2 and k1 can be
directly obtained from pullout bond test.
Therefore, the bond stiffness of each part can be described as:
1k initial stiffness,2max
2max3
12
122 ,
s
ssk
sk
3.1.2 Tri-linear model for sand-coated type AFRP bar
Fig. 3.2 shows the tri-linear model for sand-coated type AFRP bar.
Extended image for the part of k1 and k2
Fig. 3.2 Definition of tri-linear model for sand-coated type bar
Unlike the non-coated type, those sand-coated types bar provide a much higher initial stiffness. A high
bond stress with too little slippage from the experiments cannot give enough information for modeling
bond constitutive law. Meanwhile, bond stress of all the sand-coated types specimens show a remarkable
drop after reaching the slipping bond stress. In addition, after the bond reduction, the bond stress soon
increases again. Therefore, τu which means the minimum value after slipping bond stress is considered
as a characteristic value.
The definition and mathematical expressions are given as follows.
0
k1
k2
k3
s1 smax
1
max
u
Slip
Bon
d s
tres
s
Test result Tri-linear model
su0
k1
k2
s1
1
m
ax
Slip
Bond s
tres
s
Test result Tri-linear model
smax
24
u minimum bond stress after slipping bond stress
us slip at u
max slipping bond stress
maxs slip at max
111 sk
maxmax1
maxmax2
1
2
sk
sGs
f
2fG = fracture energy during bond stress from 0 to 2
The calculation method of s1 is same as the non-coated type.
The bond stiffness can be presented as:
1k initial stiffness, max
max3
1max
1max2 ,
s ssk
sk
u
u
3.2 Theoretical Calculation Formulas
Based on each bond stiffness which presented in chapter 3.1.1 and 3.1.2, a simple form linear function
of bond constitutive law can be obtained. They are:
In fact, there is no difference between the mathematical calculation processes of two types of tri-linear
model except the symbols. Therefore, Eq. (3.1) ~ Eq. (3.4) can be used for both type. However, when
calculating the k3, it requires for s2 and τ2 which is corresponding to the τmax and smax in sand-coated type,
replacing s2 and τ2 by τmax and smax in Eq. (3.5) ~ Eq. (3.7) can obtain the calculation formulas for sand-
coated type which presented by Eq. (3.8) ~ Eq. (3.10).
The Eq. (1) can be solved by using the linear function of τ and s. And with an assumption that the slip
at loaded end gives a half of crack width, theoretical calculation formulas for crack width Eq. (3.1) ~
Eq. (3.10) can be obtained.
Non-coated type
11 sk )( 1ss
)( 1122 ssk )( 21 sss
223max )( ssk )( 2ss
Sand-coated type
11 sk )( 1ss
)( 112max ssk )( 21 sss
maxmax3 )( ssku )( maxss

25
Eq. (3.1) presents the calculation by k1 which means the initial stiffness.
1
1
2 2
122 sw
AE
Anp
k
Aw cr
bb
cctl
b
cctcr
Eq. (3.2) ~ Eq. (3.4) are calculated by k2. After reaching to τ1, the bond stress moves to second branch
till the τ2. The k2 can vary positive, negative or just equal to zero. So the formulas are divide into 3
conditions depended on the valve of k2.
212
2
2
2112
1
2
1
2
1
22 ,0
)(
2
12)1(2
swsk
k
kkks
AE
Anp
k
As
k
kw
cr
bb
cctl
b
cctcr
(3.2)
212
2
2
2112
1
2
1
2
1
22 ,0
)(
2
12)1(2
swsk
k
kkks
AE
Anp
k
As
k
kw
cr
bb
cctl
b
cctcr
(3.3)
212
11
1
22 ,0
2
1
2
12
swsk
AE
Anp
sk
Asw
cr
bb
cctl
b
cctcr
(3.4)
Eq. (3.5) ~ Eq. (3.10) are calculated by k3. Similar with the k2, the formulas calculated by k3 are also
have 3 conditions.
max23
3
1222211
2
3
2
2
33
22
22 ,0
2
122
swsk
k
ssssk
kAE
Anp
k
A
ksw
cr
bb
cctl
b
cctcr
(3.5)
max23
3
12222112
3
2
2
33
22
22 ,0
2
122
swsk
k
ssssk
kAE
Anp
k
A
ksw
cr
bb
cctl
b
cctcr
max23
2
2
2
211
22 ,0
2
1
2
11
2
12
swsk
AE
AnpAs
sksw
cr
bb
cctl
b
cctcr
(3.1)
(3.6)
(3.7)

26
ucr
bb
cctl
b
cctcr
swsk
k
ssssk
kAE
Anp
k
A
ksw
22 ,0
2
122
max3
3
1maxmaxmaxmax11
2
3
2
max
33
maxmax
(3.8)
ucr
bb
cctl
b
cctcr
swsk
k
ssssk
kAE
Anp
k
A
ksw
22 ,0
2
122
max3
3
1maxmaxmaxmax112
3
2
max
33
maxmax
(3.9)
ucr
bb
cctl
b
cctcr
swsk
AE
AnpAs
sksw
22 ,0
2
1
2
11
2
12
max3
max
max
max
max11
(3.10)

27
CHAPTER 4
Parameter Estimation for Theoretical Formulas
The characteristic values of theoretical formulas in Section 3.2 are totally based on the test results of
pullout bond test. Thus cannot be widely use of practical application. The bond stiffness is considered
as the key to the formulas. An estimation of the bond stiffness should be conducted. On the other hand,
bond stiffness is determined by bond stress and slip which can easily considered that the concrete
compressive strength (fc) and bar diameter (db) are the main effective factors.
The estimation is based on all the test results of pullout bond test which includes two series experiment
with different bar diameter and concrete strength. However, regarding to the first series experiment, it
is only considered the results of specimens with sectional size of 100x100mm, considering the sectional
size of concrete does not have a large influence on the bond behavior.
4.1 Parameter Estimation for Non-Coated Type Specimen
This chapter aims to directly figure out the main effective parameters which influence the bond stiffness
(k1, k2 and k3) and some other characteristic values such as τmax and smax by the regression analysis of the
test results of pullout bond test.
The max. bond stress plays an important role in determining the proposed tri-linear model. Fig. 4.1
shows the relationship between max. bond stress (slipping bond stress for sand-coated type) and concrete
strength for both two types including the specimens failure by concrete splitting. It can be found that
regardless of the surface treatment, the max. bond stress of both two types show the similar value and
tendency. Moreover, Fig. 4.2 shows the relationship between the max. bond stress of two types which
also includes the specimens failed by concrete splitting. It is feasible to estimate the max. bond stress
for both types at same time because they are almost the same if under the same combination of bar
diameter and concrete strength.
Fig. 4.1 Max. bond stress – concrete strength relation
10 20 30 40 50 60
5
10
15
20
0
Concrete strength (MPa)
τm
ax (
MP
a)
RA7
RA9
RA11
RA13
10 20 30 40 50 60
5
10
15
20
0
Concrete strength (MPa)
τm
ax (
MP
a)
RA7S
RA9S
RA11S
RA13S
28
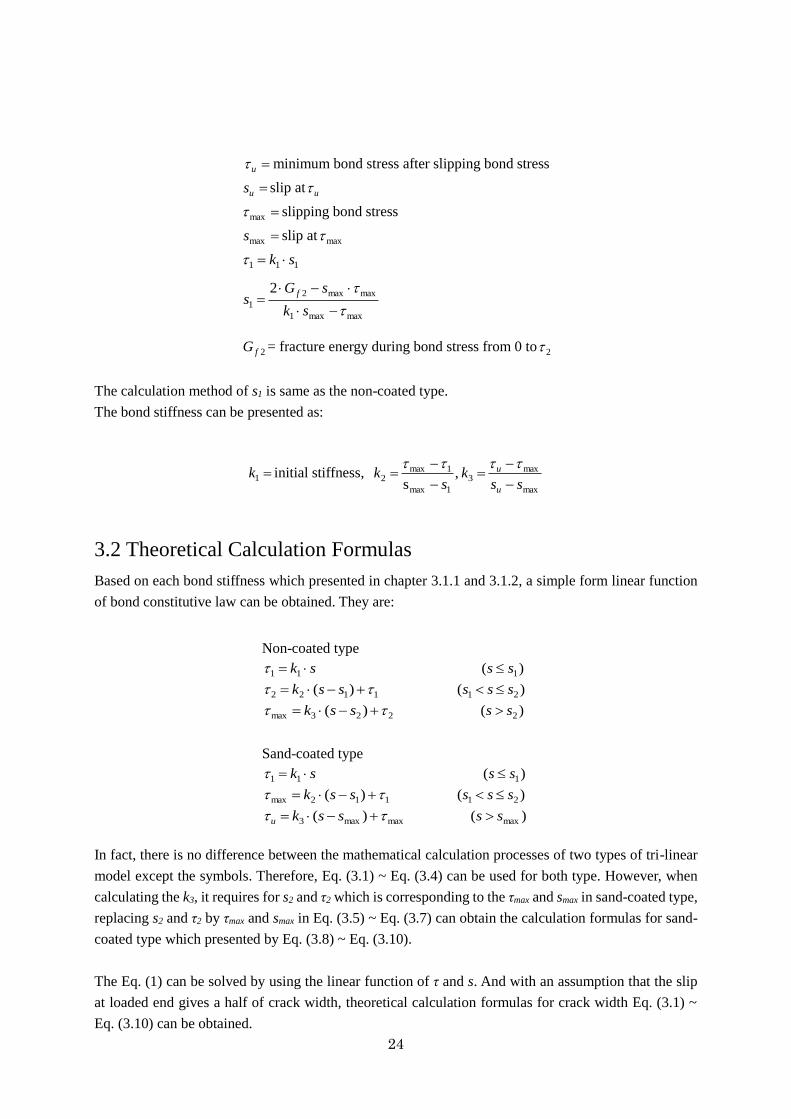
Fig. 4.2 Relationship between the max. bond stress of two types
Fig. 4.3 shows the relationship between concrete strength and max. bond stress including both types.
The fitting line is considered as a function of3/1
cf . In addition, to investigate the influence of bar
diameter on the max. bond stress, Fig. 4.4 shows the relationship between bar diameter and normalized
max. bond stress. There is no clear relationship between max. bond stress and bar diameter. Therefore,
the max. bond stress is only expressed by a function of concrete strength.
3/1
max 77.3 cf (4.1)
To determine the value of k1, τ1 and s1 are discussed. Fig. 4.5 shows the relationship between τ1 and
concrete strength. It can be found that concrete strength does not influence the τ1. There is a tendency,
as shown in Fig. 4.6, that is the τ1 is in inverse proportion to the bar diameter. Fig. 4.7 and Fig. 4.8 show
the relationships between s1 and bar diameter and concrete strength, respectively. There is no definite
relationship between them, therefore it is considered as a constant value (0.035mm) which is equal to
the average value from the experiment.
5 10 15 20
5
10
15
20
0
max (MPa)
Sand coated type
No
n-c
oate
d t
yp
e
max
(M
Pa)
y=1.04x
10 20 30 40 50 60
5
10
15
20
0
Concrete strength (MPa)
max (
MP
a)
RA7 & RA7S
RA9 & RA9S
RA11 & RA11S
RA13 & RA13S
y=3.77x1/3
Fig. 4.3 τmax – fc relation Fig. 4.4 Normalized τmax – db relation
5 10 15 20
2
4
6
0
Bar diameter (mm)
max
/ f
c1/3
C24
C36
C48

29
(Non-coated type) (Non-coated type)
bd
9.441 (4.2)
(Non-coated type) (Non-coated type)
mm035.01 s (4.3)
bdsk
3
1
11
1028.1
(4.4)
Fig. 4.9 shows the relationship between concrete strength and k2 including all the specimens. Basically,
as s1 is considered as a constant value and τ1 does not change too much, the τ2 (determined by τmax) and
its corresponding slip s2 dominate the value of k2. However, those specimens failed by concrete splitting
do not give the true value of τmax, that cause the k2 unreal for those specimens. The relationship between
concrete strength and k2 for the specimens only failed by pullout is shown in Fig. 4.10. Although it
shows some variations, the concrete strength is slightly effect the value of k2. Therefore, k2 is proposed
as the function of3/1
cf .
10 20 30 40 50 60
2
4
6
8
0
Concrete strength (MPa)
1 (
MP
a)
RA7
RA9
RA11
RA13
5 10 15 20
2
4
6
8
0
Bar diameter (mm)
1 (
kN
/mm
2)
C24
C36
C48
y=44.9/x
5 10 15 20
0.02
0.04
0.06
0.08
0.1
0
Bar diameter (mm)
s 1 (
mm
)
C24
C36
C48
10 20 30 40 50 60
0.02
0.04
0.06
0.08
0.1
0
Concrete strength (MPa)
s 1 (
mm
)
RA7
RA9
RA11
RA13
s1=0.035mm
Fig. 4.5 τ1 - fc relation Fig. 4.6 τ1 - db relation
Fig. 4.7 s1 - db relation Fig. 4.8 s1 – fc relation

30
3/1
2 38.1 cfk (4.5)
Regarding to the k3, it is similar to the situation of k2. As shown in Fig. 4.11, specimen failed by concrete
splitting usually give a high bond stress while little slippage that may lead a much higher k3. The
relationship between concrete strength and k3 for those specimens failed by pullout is shown in Fig. 4.12.
On the other hand, the k3 is determined by τmax, τ2, smax and s2 where the most important parameter is smax.
It is attribute to that when the bond stress is near the τmax the curve becomes moderate with a slightly
increasing of bond stress but a relatively large slip. Fig. 4.13 shows the relationship between smax and k3.
As expected, the k3 is in inverse proportion to the smax.
10 20 30 40 50 60
5
10
15
0
RA7
RA9
RA11
RA13
k2 (
N/m
m3)
Concrete strength (MPa)
10 20 30 40 50 60
5
10
0
RA7
RA9
RA11
k2 (
N/m
m3)
Concrete strength (MPa)
y=1.38x1/3
10 20 30 40 50 60
1
2
3
4
0
RA7
RA9
RA11
RA13
k3 (
N/m
m3)
Concrete strength (MPa)
10 20 30 40 50 60
0.5
1
1.5
2
0
RA7
RA9
RA11
k3 (
N/m
m3)
Concrete strength (MPa)
Fig. 4.9 k2 - fc relation Fig. 4.10 k2 - fc relation
(Non-coated type) (Non-coated type, specimen failed by pullout)
Fig. 4.11 k3 - fc relation Fig. 4.12 k3 - fc relation
(Non-coated type) (Non-coated type, specimen failed by pullout)
31
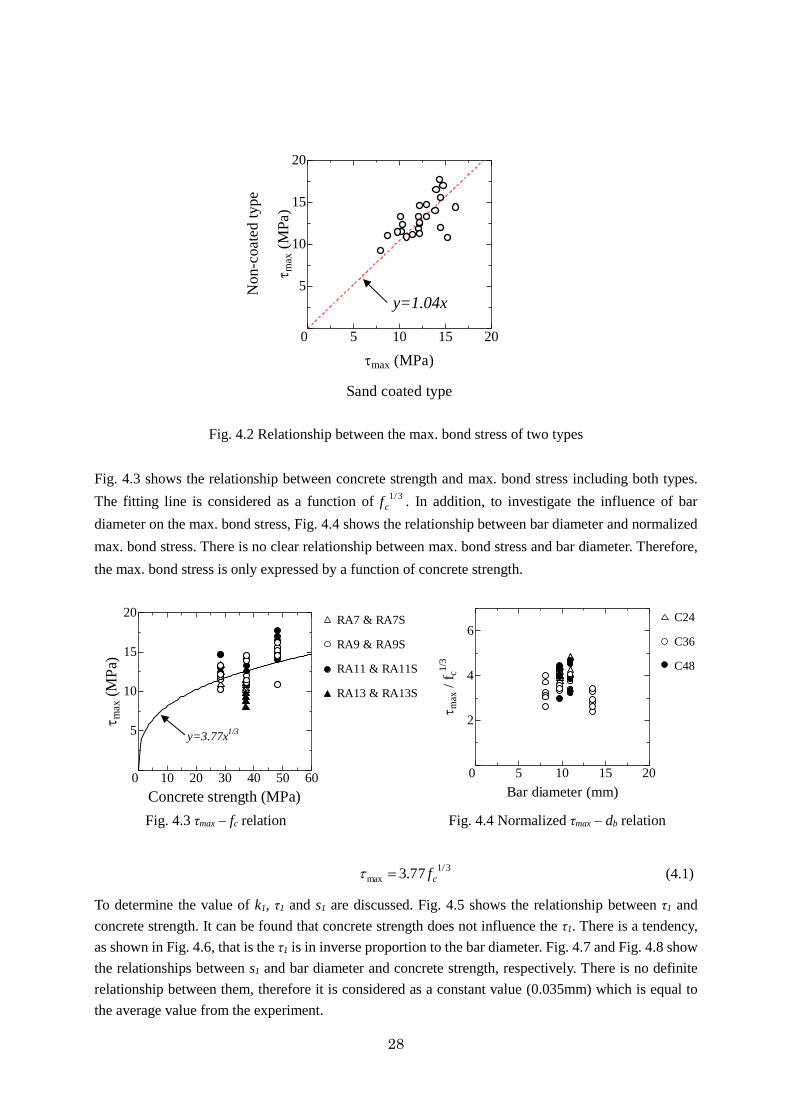
Fig. 4.13 k3 – smax relation
(Non-coated type)
max
3
04.5
sk (4.6)
Fig. 4.14 shows the relationship between bar diameter and smax. As the bar diameter increasing, the smax
also increases. The relationship between concrete strength and the normalized smax by divide bar
diameter is shown in Fig. 4.15.
bc dfs3/1
max 17.0 (4.7)
3/1max
3
6.2904.5
cb fdsk (4.8)
2 4 6 8 10
0.5
1
1.5
0
smax (mm)
k3 (
N/m
m3)
y=5.04/x
5 10 15
2
4
6
8
10
0
Bar diameter (mm)
s max
(m
m)
C24
C36
C48
10 20 30 40 50 60
0.5
1
0
s max
/db
Concrete strength (MPa)
y=0.17x1/3
Fig. 4.14 smax - db relation Fig. 4.15 normalized smax - fc relation
(Non-coated type) (Non-coated type)

32
4.2 Parameter Estimation for Sand-Coated Type Specimen
Under the definition of tri-linear model for sand-coated type, the max. bond stress (defined as slipping
bond stress in pullout bond test) has more effective in influencing the bond stiffness than the non-coated
type ones.
Unlike the non-coated type specimens, the sand-coated surface can lead a large initial stiffness and it is
mainly influenced by the bar diameter. Fig. 4.16 shows a clear relationship which the initial stiffness is
in inverse proportion to the bar diameter. The large influence of concrete strength cannot be recognized
from Fig. 4.17.
bd
k3
1
1096.1 (4.9)
Fig. 4.18 shows the relationship between the concrete strength and the ratio of τ1 to τmax. Regardless of
the concrete strength the ratio shows an ideal result which is that τ1 is 0.83 times τmax. Moreover, Fig.
4.19 also indicates that the τu which is the minimum value after max. bond stress (slipping bond stress)
is 0.82 times τmax..The bond stiffness can be calculated when the value of slip is determined.
5 10 15 20
100
200
300
0
C24
C36
C48
Bar diameter (mm)
k1 (
N/m
m3)
y=1961/x
10 20 30 40 50 60
100
200
300
0
RA7S
RA9S
RA11S
RA13S
Concrete strength (MPa)
k1 (
N/m
m3)
Fig. 4.16 k1 - db relation Fig. 4.17 k1 – fc relation
(Sand-coated type) (Sand-coated type)

33
bc dfkk
s3/1
1
max
1
11 0016.0
83.0
(4.10)
Regarding to the smax, as showing in Fig. 4.20 and Fig. 4.21, no significant influence of the concrete
strength or bar diameter on smax is found. The smax is considered as a constant value which is equal to the
average value from test results.
mm187.0max s (4.11)
bc
c
df
f
ssk
3/1
3/1
1max
1max2
0016.0187.0
64.0
Relationship between concrete strength and su is shown in Fig. 4.22. As concrete strength increases, the
su becomes smaller. The RA13S specimens show a relatively large drop comparing with other diameter
10 20 30 40 50 60
0.5
1
1.5
0
Concrete strength (MPa)
1/
max
RA7S
RA9S
RA11S
RA13S
1=0.83max
10 20 30 40 50 60
0.5
1
1.5
0
Concrete strength (MPa)
u/
max
RA7S
RA9S
RA11S
RA13S
u=0.82max
10 20 30 40 50 60
0.1
0.2
0.3
0.4
0
Concrete strength (MPa)
s max
(m
m)
RA7S
RA9S
RA11S
RA13S
smax=0.187mm
5 10 15 20
0.1
0.2
0.3
0.4
0
Bar diameter (mm)
s max
(m
m)
C24
C36
C48
Fig. 4.18 τ1 / τmax - fc relation Fig. 4.19 τu / τmax - fc relation
(Sand-coated type) (Sand-coated type)
Fig. 4.20 smax - fc relation Fig. 4.21 smax – db relation
(Sand-coated type) (Sand-coated type)
(4.12)
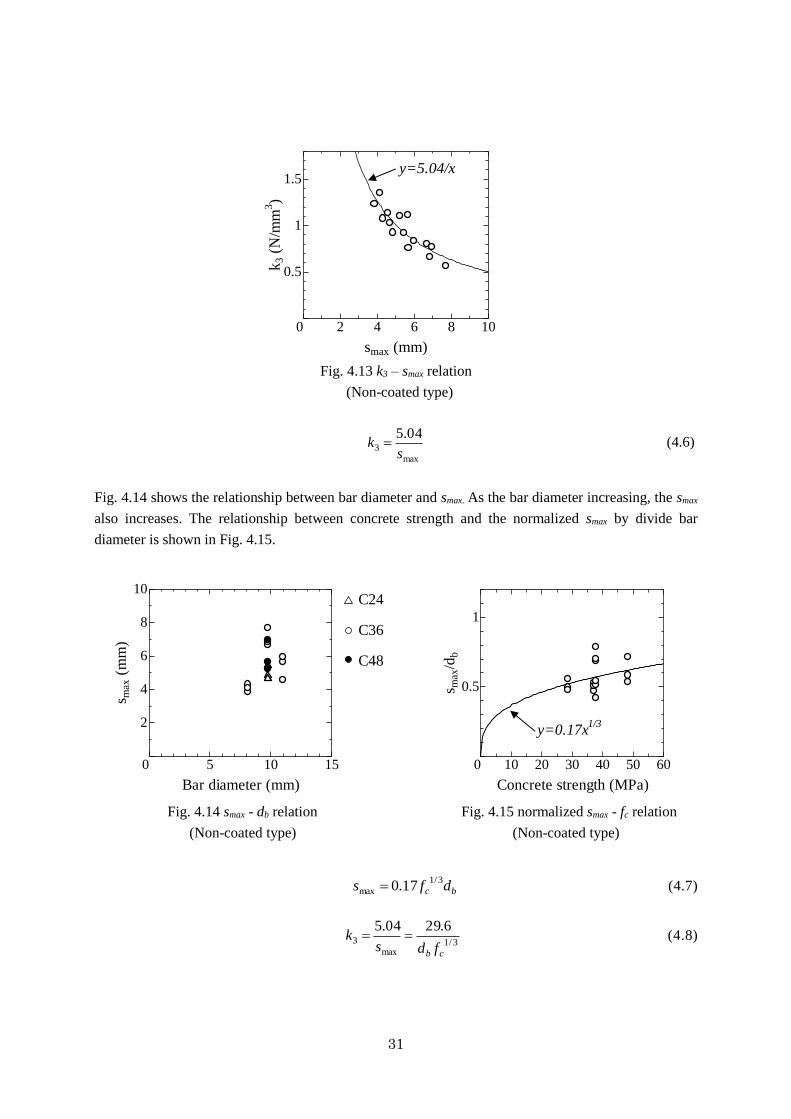
34
ones. However the bar diameter can hardly influence on the su as shown in Fig. 4.23.
c
uf
s8.38
(4.13)
187.08.38
68.01
3/1
max
max3
c
c
u
u
f
f
ssk
(4.14)
4.3 Expression of Tri-Linear Model
Summarizing the estimated parameters in last two sections, the tri-linear model can be expressed and
the expression is shown in Table 4.1.
10 20 30 40 50 60
0.5
1
1.5
2
0
Concrete strength (MPa)
s u (
mm
)
RA7S
RA9S
RA11S
RA13S
y=38.8/x
5 10 15 20
0.5
1
1.5
2
0
Bar diameter (mm)
s u (
mm
)
C24
C36
C48
Fig. 4.22 su - fc relation Fig. 4.23 su – db relation
(Sand-coated type) (Sand-coated type)

35
Table. 4.1 Expression of tri-linear model
Non-coated type Sand-coated type
Parameter Expression Parameter Expression
τ1
cf
9.44 τ1
3/113.3 cf
s1 0.035mm s1 bc df3/1
0016.0
τ2 3/1
51.2 cf τmax 3/1
77.3 cf
s2
bc df3/1
5.3286.1 smax 0.187mm
τmax 3/1
77.3 cf τu 3/1
1.3 cf
smax bc df3/1
17.0 su
c
uf
s8.38
k1
bd
31028.1 k1
bdk
3
1
1096.1
k2 3/1
38.1 cf k2 bc
c
df
f3/1
3/1
0016.0187.0
64.0
k3 3/1
6.29
cb fd k3
187.08.38
68.01
3/1
c
c
f
f

36
CHAPTER 5
Adaptability of Proposed Crack Width Prediction
Formulas
Last chapter estimated the value of each bond stiffness and characteristic points for both types of tri-
linear model. Consequently, the tri-liner model can be draw by using the parameter of concrete strength
(fc) and bar diameter (db). The proposed crack width prediction formulas in chapter 3 can be calculated
by those parameters as well.
This chapter presents the calculated crack width prediction formulas. The adaptability of calculated bond
stiffness, tri-model and the calculated crack width comparing with test results are also discussed.
5.1 Bond Stiffness
Table 5.1 shows the comparison of calculated bond stiffness with the experiment ones for the non-coated
type AFRP bar specimens. In general, the calculated k shows a good agreement with the experiment
ones. Regarding to the specimen reinforced with the non-coated type bar, the max. bond stress of those
splitting specimens are considered as the value of splitting bond stress. It can be said that the max. bond
stress does not have a large influence on the initial bond stiffness. However, they influence the k2 and k3
as show in Table 5.1 (b) and Table 5.1 (c), respectively. For those sand-coated type bar reinforced
specimen, the variation of τmax influences both k2 and k3.
Table 5.1 (a) Comparison of the calculated k with the experiment ones
(Non-coated type, k1)
Specimen Cal. k1
(N/mm3)
Exp. k1
(N/mm3) Cal. k1 / Exp. k1 Failure mode
C24RA9 131.7 151.0 0.87 Pullout
C36RA9 131.7 167.5 0.79 Pullout
C48RA9 131.7 154.0 0.86 Pullout
C24RA11 117.0 100.8 1.16 Concrete splitting
C36RA11 117.0 110.1 1.06 Pullout
C48RA11 117.0 140.6 0.83 Concrete splitting
C36RA7 158.1 128.7 1.23 Pullout
C36RA13 94.8 112.2 0.84 Concrete splitting

37
Table 5.1 (b) Comparison of the calculated k with the experiment ones
(Non-coated type, k2)
Specimen Cal. k2
(N/mm3)
Exp. k2
(N/mm3) Cal. k2 / Exp. k2 Failure mode
C24RA9 4.21 5.16 0.82 Pullout
C36RA9 4.62 4.08 1.13 Pullout
C48RA9 5.02 5.38 0.93 Pullout
C24RA11 4.21 7.23 0.58 Concrete splitting
C36RA11 4.62 3.31 1.40 Pullout
C48RA11 5.02 12.25 0.41 Concrete splitting
C36RA7 4.60 5.27 0.87 Pullout
C36RA13 4.60 3.99 1.15 Concrete splitting
Table 5.1 (c) Comparison of the calculated k with the experiment ones
(Non-coated type, k3)
Specimen Cal. k3
(N/mm3)
Exp. k3
(N/mm3) Cal. k3 / Exp. k3 Failure mode
C24RA9 1.00 0.96 1.04 Pullout
C36RA9 0.91 0.68 1.34 Pullout
C48RA9 0.84 0.88 0.95 Pullout
C24RA11 0.89 1.65 0.54 Concrete splitting
C36RA11 0.81 1.03 0.79 Pullout
C48RA11 0.74 3.06 0.24 Concrete splitting
C36RA7 1.10 1.22 0.90 Pullout
C36RA13 0.67 2.07 0.32 Concrete splitting
Table 5.1 (d) Comparison of the calculated k with the experiment ones
(Sand-coated type, k1)
Specimen Cal. k1
(N/mm3)
Exp. k1
(N/mm3) Cal. k1 / Exp. k1
C24RA9S 201.5 235.3 0.86
C36RA9S 201.5 228.0 0.88
C48RA9S 201.5 217.0 0.93
C24RA11S 179.1 177.3 1.01
C36RA11S 179.1 140.6 1.27
C48RA11S 179.1 152.0 1.18
C36RA7S 242.1 222.3 1.09
C36RA13S 145.2 145.6 1.00

38
Table 5.1 (e) Comparison of the calculated k with the experiment ones
(Sand-coated type, k2)
Specimen Cal. k2
(N/mm3)
Exp. k2
(N/mm3) Cal. k2 / Exp. k2
C24RA9S 14.87 14.64 1.05
C36RA9S 16.87 17.23 0.98
C48RA9S 18.95 25.76 0.74
C24RA11S 15.54 12.86 1.21
C36RA11S 17.72 10.35 1.71
C48RA11S 20.04 14.71 1.36
C36RA7S 15.77 16.06 0.98
C36RA13S 19.72 11.31 1.74
Table 5.1 (f) Comparison of the calculated k with the experiment ones
(Sand-coated type, k3)
Specimen Cal. k3
(N/mm3)
Exp. k3
(N/mm3) Cal. k3 / Exp. k3
C24RA9S 1.77 2.15 0.82
C36RA9S 2.69 2.50 1.08
C48RA9S 4.00 2.32 1.73
C24RA11S 1.77 1.50 1.18
C36RA11S 2.69 2.91 0.93
C48RA11S 4.00 3.10 1.29
C36RA7S 2.65 2.97 0.89
C36RA13S 2.65 1.34 1.84
5.2 Crack Width Prediction Formula
Using the estimated parameters in Chapter 4, the crack width prediction formula can be calculated.
Based on the definition of tri-linear model, the positive or negative of k is automatically determined.
Therefore, only need to calculate Eq. (3.1), Eq. (3.2), Eq. (3.5) and Eq. (3.9).
5.2.1 Crack width prediction formula for non-coated type
The crack width prediction formula for non-coated type is given as:
mm07.0 2
1
6412
cr
bb
cctl
cctcr w
AE
AnpAw
(5.1)

39
On the other hand, one of the part of formula can be simplified as:
0
2
2
1
2
1
22
1
2
1
c
ct
b
ct
bb
cct
c
ct
bb
cct
bb
cct
EpEAE
A
EAE
A
AE
Anp (5.2)
The simplified calculated formulas can be presented as:
mm07.0 21001.2
23
cr
b
ctl
cctcr w
pE
Aw
(5.3)
14.11006.1
2
45.15.32035.02
2
3
pE
Aw
b
ctl
cctcr (5.4)
5.3272.3mm07.0 crw
155.02.49062.0
007.026.46
085.05.32
86.12
3/223/1
3/1
cbbc
b
cctc
ccr
fddf
pE
ctl
Af
fw
34.0
5.3272.3 crw
Where,
Coefficient bc df3/1
(5.5)

40
5.2.2 Crack width prediction formula for sand-coated type
The crack width prediction formula for sand-coated type is given as follows.
bccr
b
ctl
cctcr dfw
pE
Aw
3/1
30032.0
21008.32
(5.6)
00781.09.232
13.3914.000942.02 2
pE
Aw
b
ctl
cctcr (5.7)
mm374.00032.03/1
crbc wdf
721.00016.0324.03721062.4
2
)11455.0(
85.0215
2
3/22
4
c
b
ccb
ctl
c
cctc
c
cr
f
d
ffpEf
Af
fw
c
crf
w77.6
mm374.0
Where,
Coefficient bc df3/1
Coefficient bc df3/1
0016.0187.0
5.3 Calculated Tri-Linear Model
The comparison of calculated tri-linear model with the bond – stress relationship from test result are
shown in Fig. 5.1.
The calculated tri-linear model matches the curve well except two series of specimen reinforced with
non-coated type of AFRP bar which failed by concrete splitting. As discussed in Chapter 4, the concrete
strength does not have a large influence on the τmax. However, C24RA11, C48RA11 and C36RA13S
series show a large variation of bond stress.
(5.8)

41
Fig. 5.1 (a) Calculated tri-liner model for non-coated type bar specimen
2 4 6 8
5
10
15
20
0
Test results Calculated model
Loaded end slip (mm)
Bo
nd
str
ess
(N
/mm
2) C24RA9
1 2 3 4 5 6
5
10
15
20
0
Test results Calculated model
Loaded end slip (mm)B
on
d s
tress
(N
/mm
2) C24RA11
1 2 3 4 5 6
5
10
15
20
0
Test results Calculated model
Loaded end slip (mm)
Bond s
tress
(N
/mm
2) C36RA7
2 4 6 8
5
10
15
20
0
Test results Calculated model
Loaded end slip (mm)
Bond s
tress
(N
/mm
2) C36RA9
2 4 6 8
5
10
15
20
0
Test results Calculated model
Loaded end slip (mm)
Bond s
tress
(N
/mm
2) C36RA11
1 2 3 4 5
5
10
15
20
0
Test results Calculated model
Loaded end slip (mm)B
ond s
tress
(N
/mm
2) C36RA13
2 4 6 8
5
10
15
20
0
Test results Calculated model
Loaded end slip (mm)
Bond s
tress
(N
/mm
2) C48RA9
1 2 3 4 5
5
10
15
20
0
Test results Calculated model
Loaded end slip (mm)
Bond s
tress
(N
/mm
2)
C48RA11

42
Fig. 5.2 (b) Calculated tri-liner model for sand-coated type bar specimen
5.4 Adaptability of Calculated Prediction Formulas
The comparison of the predicted crack width with that observed in tensile bond test are shown in Fig.
5.2. It also shows the range of the curve calculated by k1, k2 or k3. The experimental reinforcement strain
is obtained by the tensile load divided by the sectional area and elastic modulus of tested AFRP bar.
In general, the prediction formulas work well with the non-coated type series. However, some of the
sand-coated type series show a deviation from the experimental curves. It is considered that
perpendicular cracks in tensile bond test affect the experimental measured crack width in those
specimens.
Regarding to the calculated prediction curve, the range calculated by k1 is too small because at the first
increase branch the bond performance is very well which means a high bond stress with a little slippage.
0.5 1 1.5
5
10
15
20
0
Test results Calculated model
Loaded end slip (mm)
Bo
nd
str
ess
(N
/mm
2) C24RA9S
0.5 1 1.5
5
10
15
20
0
Test results Calculated model
Loaded end slip (mm)B
on
d s
tress
(N
/mm
2) C24RA11S
0.5 1 1.5
5
10
15
20
0
Test results Calculated model
Loaded end slip (mm)
Bo
nd
str
ess
(N
/mm
2) C36RA7S
0.5 1 1.5
5
10
15
20
0
Test results Calculated model
Loaded end slip (mm)
Bo
nd
str
ess
(N
/mm
2) C36RA9S
0.5 1 1.5
5
10
15
20
0
Test results Calculated model
Loaded end slip (mm)
Bo
nd
str
ess
(N
/mm
2) C36RA11S
0.5 1 1.5
5
10
15
20
0
Test results Calculated model
Loaded end slip (mm)B
on
d s
tress
(N
/mm
2) C36RA13S
0.5 1 1.5
5
10
15
20
0
Test results Calculated model
Loaded end slip (mm)
Bo
nd
str
ess
(N
/mm
2) C48RA9S
0.5 1 1.5
5
10
15
20
0
Test results Calculated model
Loaded end slip (mm)
Bo
nd
str
ess
(N
/mm
2) C48RA11S

43
For both types of specimens, the crack width is mainly depended on k2 and k3. On the other hand, some
of the sand-coated type series specimens with the small su cannot provide a relatively enough calculation
range.
Comparing with the tri-linear model and the prediction crack width, it can be said that a good bond
performance leads less crack width at the same level of reinforcement strain.
Fig. 5.3 (a) Crack width – reinforcement strain relationship
(Non-coated type bar specimen)
1 2 3 4
0.5
1
1.5
2
0
Crack width (mm)
Rein
f. s
train
(%
)
Test result Calculated
C24RA9
k1 k2
1 2 3 4
0.5
1
1.5
2
0
Crack width (mm)
Rein
f. s
train
(%
)
Test result Calculated
C24RA11
k1 k2
1 2 3 4
0.5
1
1.5
2
0
Crack width (mm)
Rein
f. s
train
(%
)
Test result Calculated
C36RA7
k1 k2
1 2 3 4
0.5
1
1.5
2
0
Crack width (mm)
Rein
f. s
train
(%
)
Test result Calculated
C36RA9
k1 k2
1 2 3 4
0.5
1
1.5
2
0
Crack width (mm)
Rein
f. s
train
(%
)
Test result Calculated
C36RA11
k1 k2
1 2 3 4
0.5
1
1.5
2
0
Crack width (mm)
Rein
f. s
train
(%
)
Test result Calculated
C36RA13
k1 k2
1 2 3 4
0.5
1
1.5
2
0
Crack width (mm)
Rein
f. s
train
(%
)
Test result Calculated
C48RA9
k1 k2
1 2 3 4
0.5
1
1.5
2
0
Crack width (mm)
Rein
f. s
train
(%
)
Test result Calculated
C48RA11
k1 k2

44
Fig. 5.4 (b) Crack width – reinforcement strain relationship
(Sand-coated type bar specimen)
1 2 3
0.5
1
1.5
2
0
Crack width (mm)
Rein
f. s
train
(%
)
Test result Calculated
C24RA9S
k1 k2 k3
1 2 3
0.5
1
1.5
2
0
Crack width (mm)
Rein
f. s
train
(%
)
Test result Calculated
C24RA11S
k1 k2 k3
1 2 3
0.5
1
1.5
2
0
Crack width (mm)
Rein
f. s
train
(%
)
Test result Calculated
C36RA7S
k1 k2 k3
1 2 3
0.5
1
1.5
2
0
Crack width (mm)
Rein
f. s
train
(%
)
Test result Calculated
C36RA9S
k1 k2 k3
1 2 3
0.5
1
1.5
2
0
Crack width (mm)
Rein
f. s
train
(%
)
Test result Calculated
C36RA11S
k1 k2 k3
1 2 3
0.5
1
1.5
2
0
Crack width (mm)R
ein
f. s
train
(%
)
Test result Simplified
C36RA13S
k1 k2 k3
1 2 3
0.5
1
1.5
2
0
Crack width (mm)
Rein
f. s
train
(%
)
Test result Claculated
C48RA9S
k1 k2 k3
1 2 3
0.5
1
1.5
2
0
Crack width (mm)
Rein
f. s
train
(%
)
Test result Calculated
C48RA11S
k1 k2 k3

45
CHAPTER 6 Conclusions
In this study, two types of tri-linear models for bond constitutive law are proposed based on the
experimental results of pullout bond test both for non-coated type and sand-coated type AFRP bars.
Under the regression analysis of the pullout bond test results, each of the bond stiffness and characteristic
value is estimated as a function which is mainly related to concrete strength and bar diameter.
The crack width prediction formulas, that are given by the relationship between the reinforcement strain
and loaded end slip which is equal to half of the crack width, has been proposed by using the estimated
bond constitutive law. The proposed crack width prediction formulas show good agreements with the
experimental crack widths.
In addition, the followings are found during the pullout bond test.
1. Surface treatment of the braided AFRP bars largely affects the bond constitutive law. However,
surface treatment has little influence to the max. bond stress as the max. bond stress of both types are
similar in case of same conditions.
2. Concrete strength does not have a large influence on the max. bond stress or slipping bond stress and
slippage at those stresses for both types of AFRP bar.

46
ACKNOWLEDGEMENTS
I would like to express my deepest appreciation to my supervisor, Professor Toshiyuki Kanakubo for his
insightful comments and suggestions, kindly communication and carefully proofreading the manuscript
during the research project over years.
I would also like to thank my co-research advisors, Associate Prof. Gaku Shoji and Associate Prof.
Akira Yasojima for their valuable suggestions and constructive comments on my study.
I would also like to acknowledge the technical staff member, Mr. Kojima. Without his support for the
experiment this thesis could not have been completed.
I also thank all the members of F115 laboratory to give me the best environment to do the research,
especially Ms. Okazaki HITOMI who help me carrying out the experiment a lot and Mr. Yu MU who
give me many advises for living abroad as foreign student.
Special thanks to Fibex Co., Ltd for providing the experiment materials.

47
REFERENCES
1-1) Nanni A., De Luca A., Zadeh HJ. Reinforced Concrete with FRP Bars: Mechanics and Design,
CRC Press, 2014.
1-2) Rehm, G., Über die Grundlagen des Verbundes zwischen Stahl und Beton, Deutscher Ausshcuss
für Stahlbeton, H. 138, 1961.
1-3) Kanakubo T., Yamato N., Crack Width Prediction Method for Steel and FRP Reinforcement Based
on Bond Theory, Journal of Advanced Concrete Technology, Vol. 12, No. 9, pp. 310-319, 2014.