CQI (TQM) Tools and Time Management. CQI or TQM?? u CQI – Continuous Quality Improvement or u TQM...
33
CQI (TQM) Tools and Time Management
-
Upload
daniela-watkins -
Category
Documents
-
view
259 -
download
7
Transcript of CQI (TQM) Tools and Time Management. CQI or TQM?? u CQI – Continuous Quality Improvement or u TQM...
CQI (TQM) Tools and Time Management
CQI or TQM??
CQI – Continuous Quality Improvement or
TQM – Total Quality Management
Technically, there are some differences in these two terms but for all practical purposes they can be combined for this class.
What is CQI?
A systematic, organization-wide approach for continually improving all processes that deliver quality products and processes.
Four CQI Principles
Develop a strong customer focus Continually improve all processes Involve employees Use CQI tools to improve decision
making
CQI and Time Management
It has been said that committees (and meetings) keep minutes…
but waste hours.
This is why CQI tools have been developed
- to aid in decision making!

Selected CQI Tools
Affinity Diagram Interrelationship Diagraph Matrix Diagram Nominal Group Technique
Affinity Diagram
Used to gather and group ideas Encourages creativity Breaks down communication
barriers Encourages “ownership” of ideas Overcomes “team paralysis”
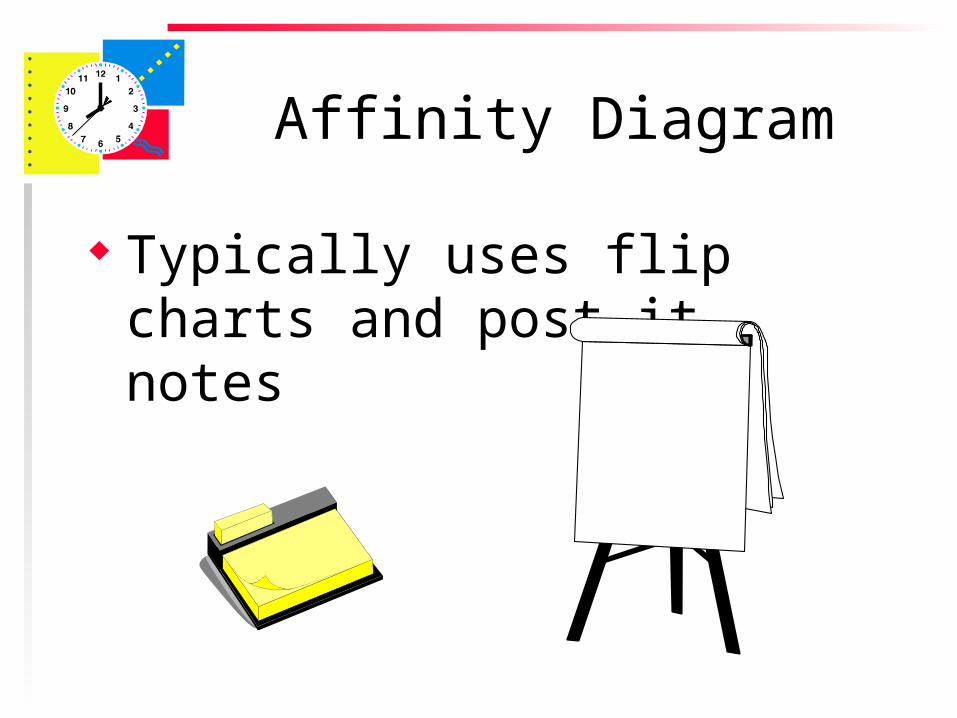
Affinity Diagram
Typically uses flip charts and post-it notes
Affinity Diagram
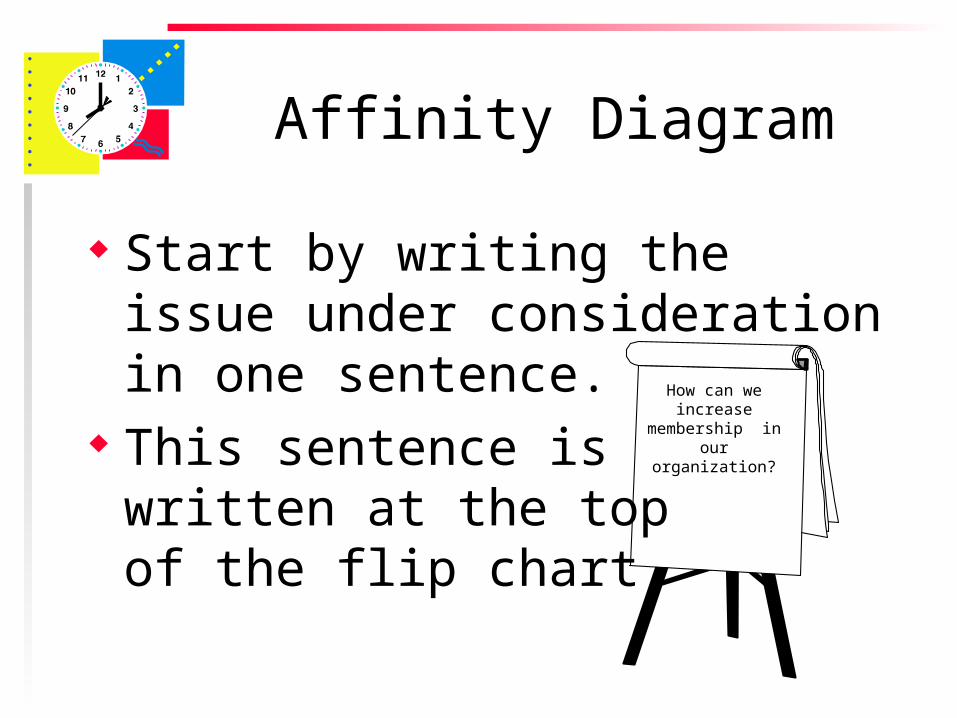
Start by writing the issue under consideration in one sentence.
This sentence is written at the top of the flip chart.
How can we increase
membership in our organization?
Affinity Diagram
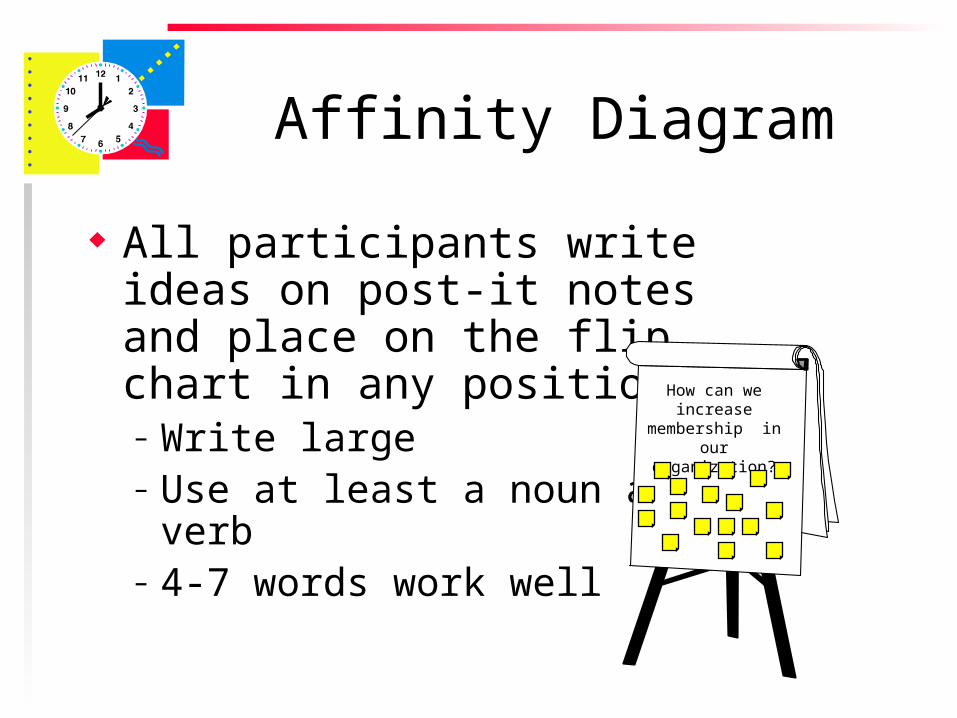
All participants write ideas on post-it notes and place on the flip chart in any position– Write large– Use at least a noun and
verb– 4-7 words work well
How can we increase
membership in our organization?
Affinity Diagram
No talking or commenting on ideas
Be creative, brainstorm
Affinity Diagram
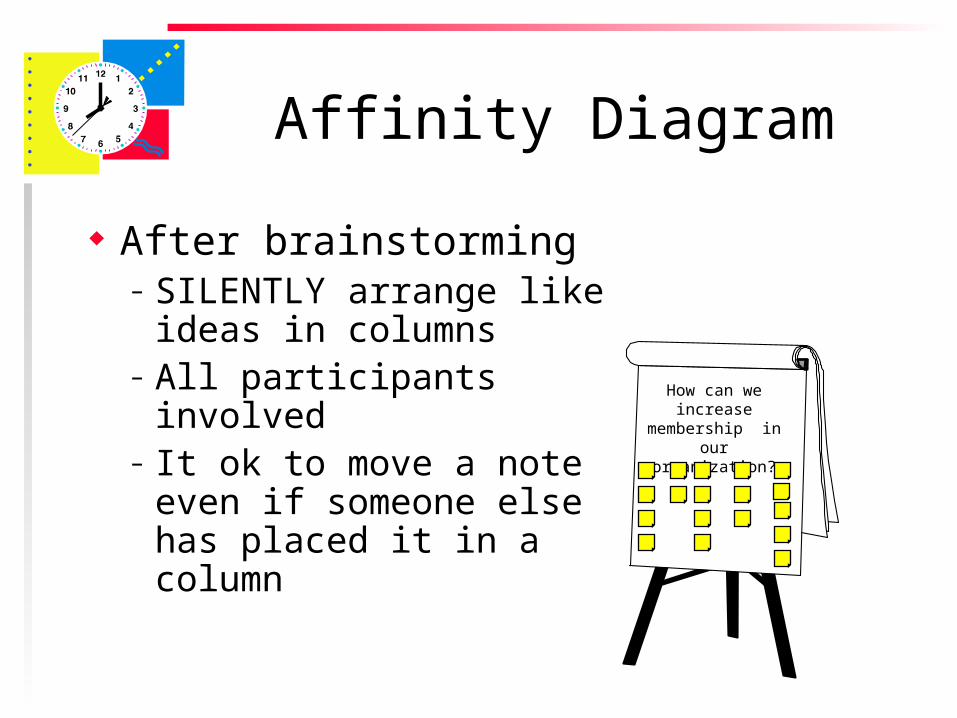
After brainstorming– SILENTLY arrange like
ideas in columns– All participants involved– It ok to move a note
even if someone else has placed it in a column
How can we increase
membership in our organization?
Affinity Diagram
For each column, develop a phrase that summarizes the column
Place the phrase on a post-it note at the top of each column. This is called the header.
Interrelationship Diagraph (ID)
Used to systematically identify, analyze and classify the cause and effect relationships that exist among items
Helps focus on a possible solution
Interrelationship Diagraph (ID)
Encourages thinking in multiple directions
Finds cause and effect relationships
Allows key issues to emerge naturally
Helps identify root causes
Interrelationship Diagraph (ID)
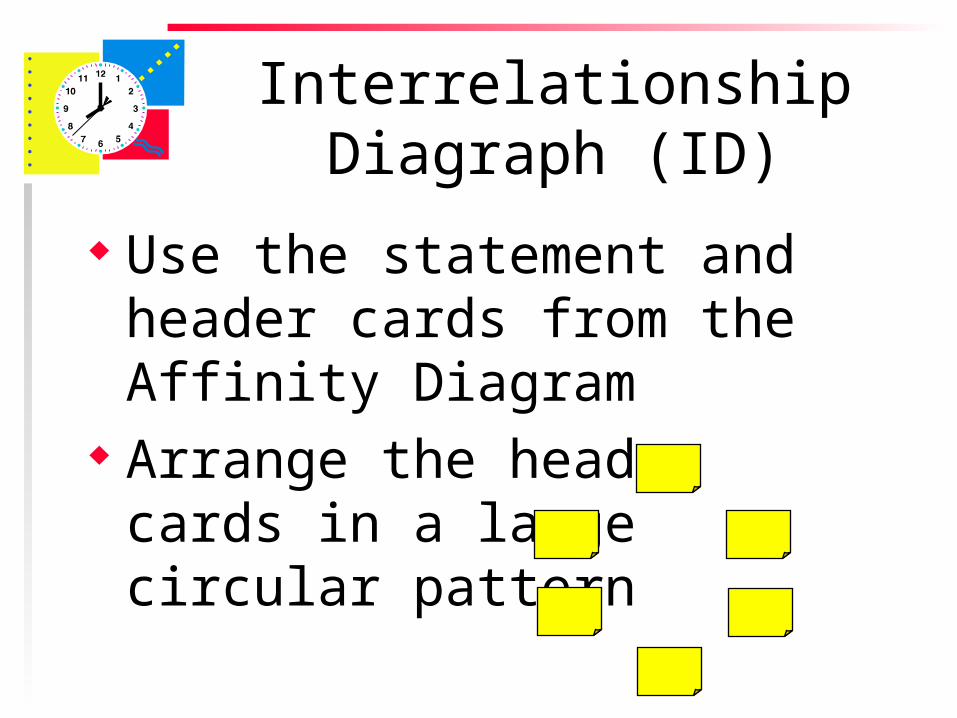
Use the statement and header cards from the Affinity Diagram
Arrange the header cards in a large circular pattern
Interrelationship Diagraph (ID)
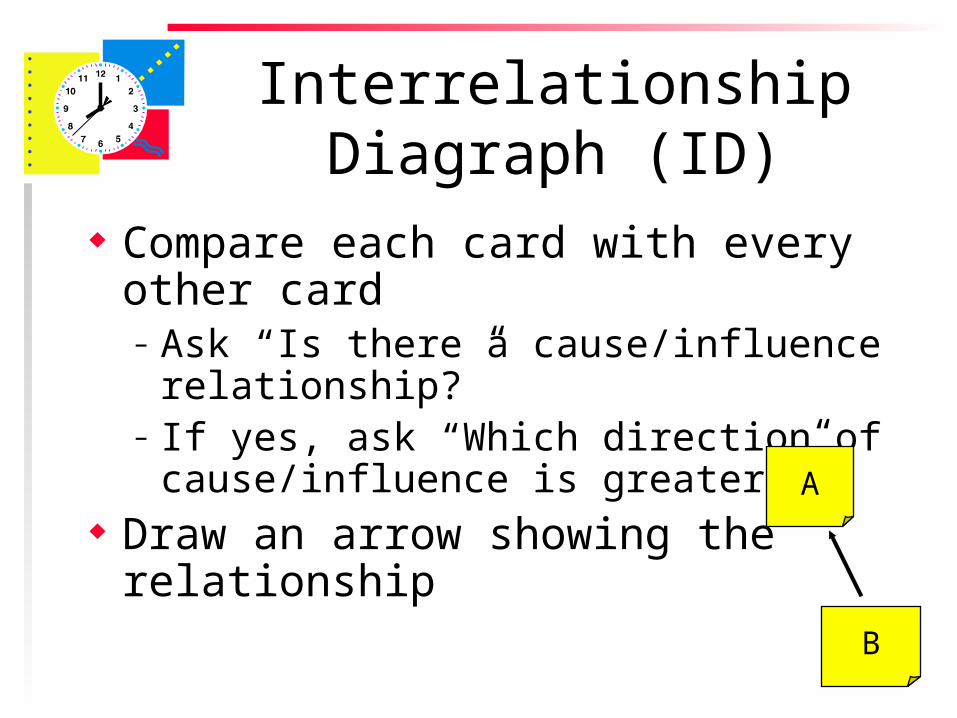
Compare each card with every other card– Ask “Is there a cause/influence
relationship?”– If yes, ask “Which direction of
cause/influence is greater?” Draw an arrow showing the
relationship
A
B
Interrelationship Diagraph (ID)
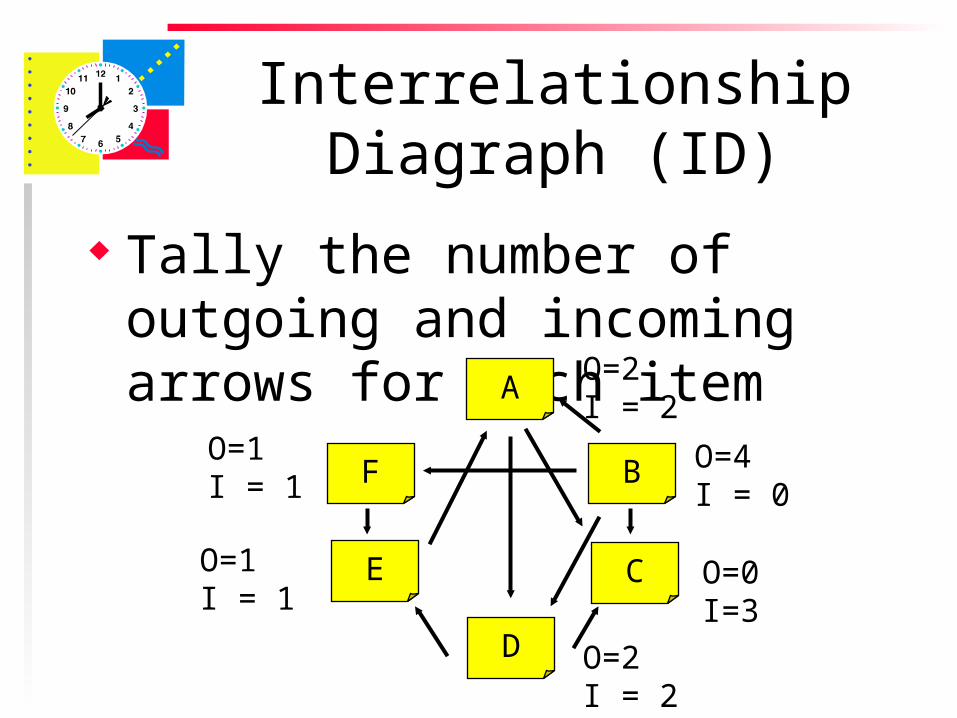
Tally the number of outgoing and incoming arrows for each item
E
F
A
D
C
B O=4I = 0
O=0I=3
O=2I = 2
O=2I = 2
O=1I = 1
O=1I = 1
Interrelationship Diagraph (ID)
The item with the largest number of outgoing items is the root cause or driver – this is generally the item to focus on
The item with the most incoming arrows indicates a key outcome
Matrix Diagram
Sometimes, things don’t get done after meetings because people are not clear as to who is supposed to do what
The Matrix diagram is one tool that helps overcome this problem
Matrix Diagram
Makes patterns of responsibility clear
Insures an appropriate distribution of tasks
Helps teams to reach concensus
Matrix Diagram
Select the key factors (tasks, jobs) that need to be done (might be derived from the ID or affinity diagram)
Assemble the group or team who will be responsible for doing the tasks.
Matrix Diagram
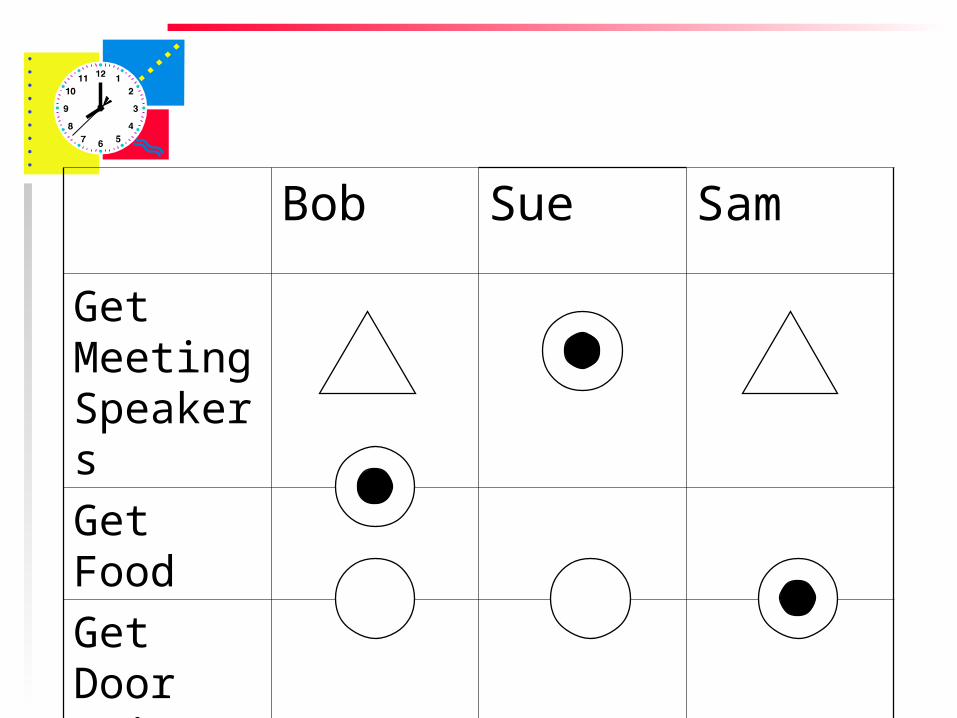
Prepare a grid List tasks to be done down the
left side of the grid List individuals or teams along
the top of the grid
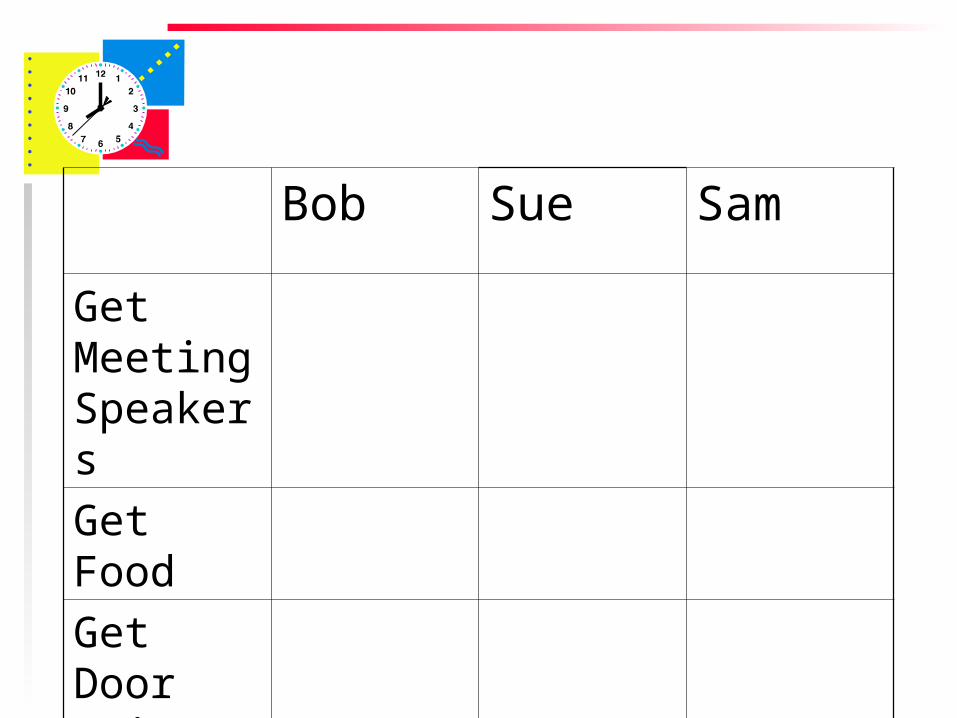
Bob Sue Sam
Get Meeting Speakers
Get Food
Get Door prizes
Matrix Diagram
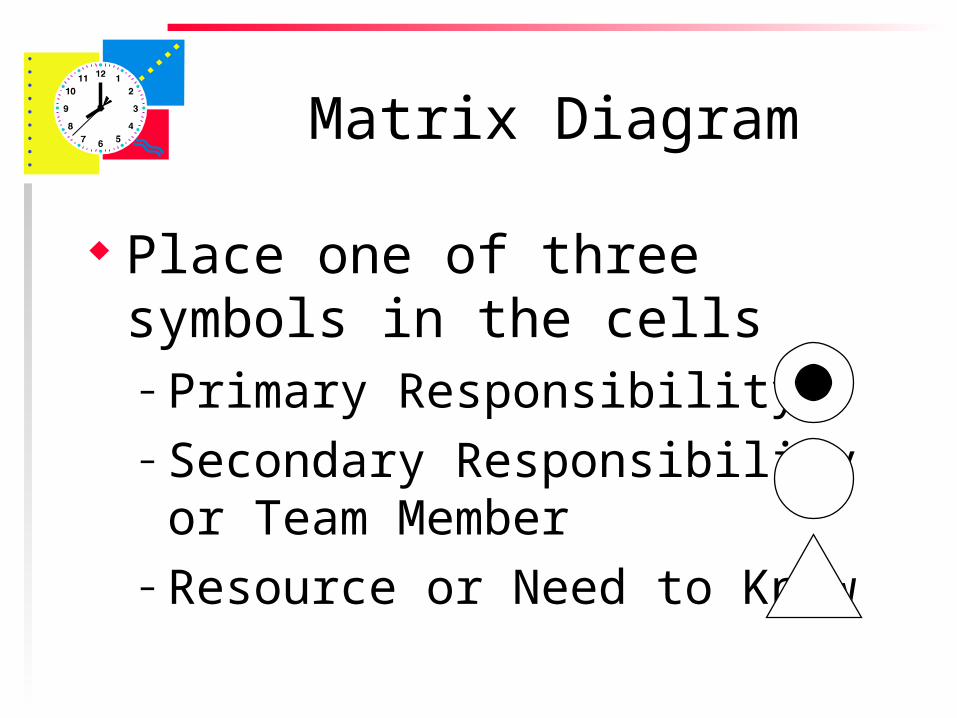
Place one of three symbols in the cells– Primary Responsibility– Secondary Responsibility or
Team Member– Resource or Need to Know
Bob Sue Sam
Get Meeting Speakers
Get Food
Get Door prizes
Nominal Group Technique (NGT)
Helps a group to quickly achieve consensus
There is equal participation Makes consensus (or lack
thereof) visible
Nominal Group Technique (NGT)
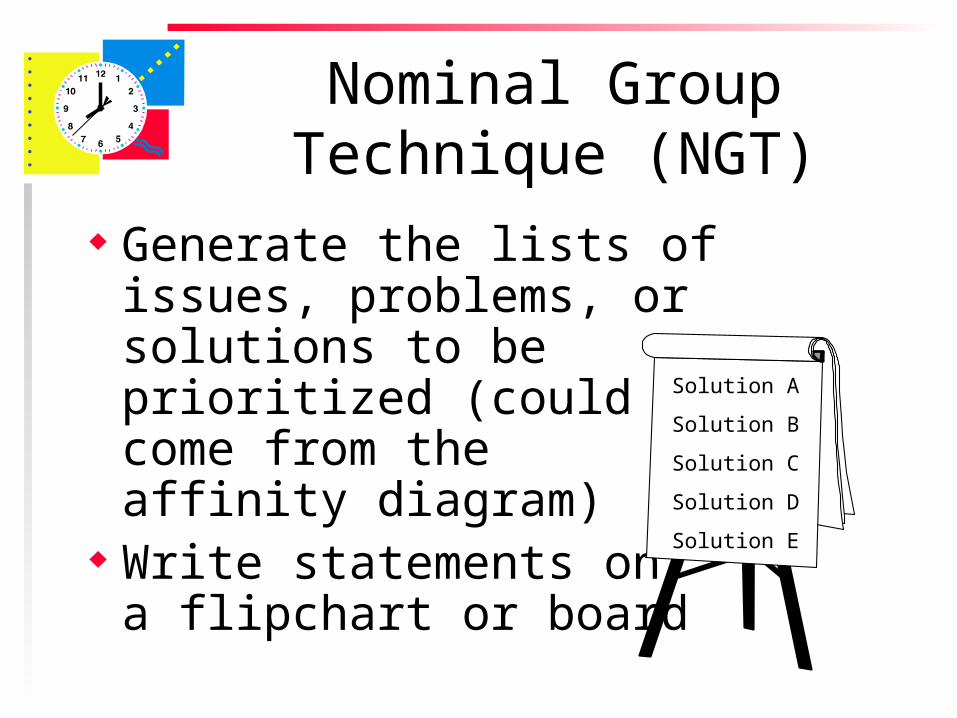
Generate the lists of issues, problems, or solutions to be prioritized (could come from the affinity diagram)
Write statements on a flipchart or board
Solution A
Solution B
Solution C
Solution D
Solution E
Nominal Group Technique (NGT)
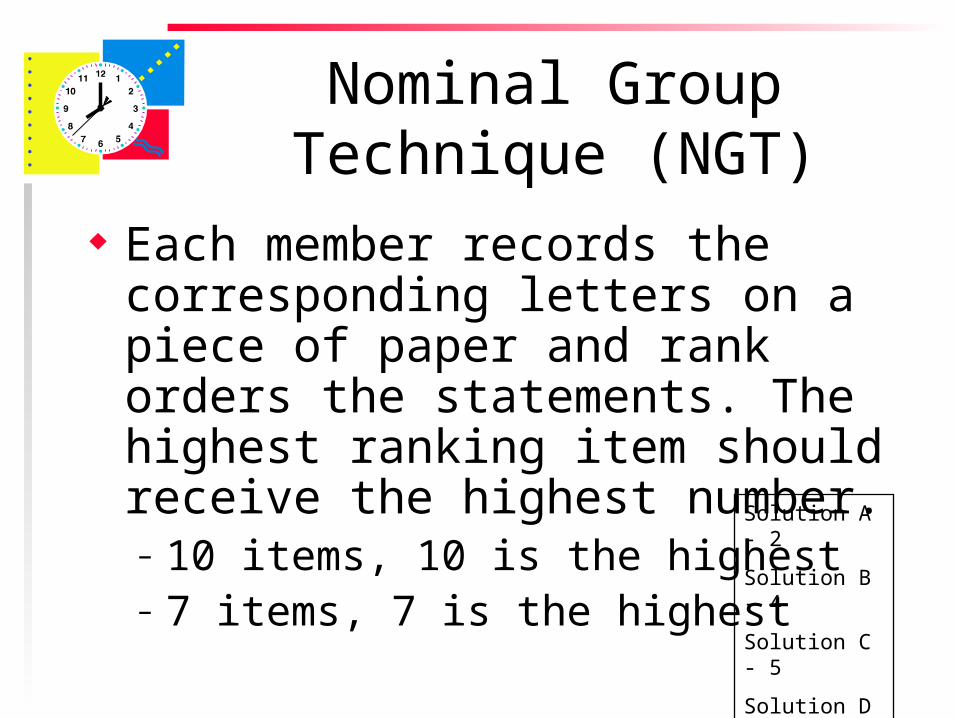
Each member records the corresponding letters on a piece of paper and rank orders the statements. The highest ranking item should receive the highest number.– 10 items, 10 is the highest– 7 items, 7 is the highest
Solution A - 2
Solution B - 4
Solution C - 5
Solution D - 1
Solution E - 3
Nominal Group Technique (NGT)
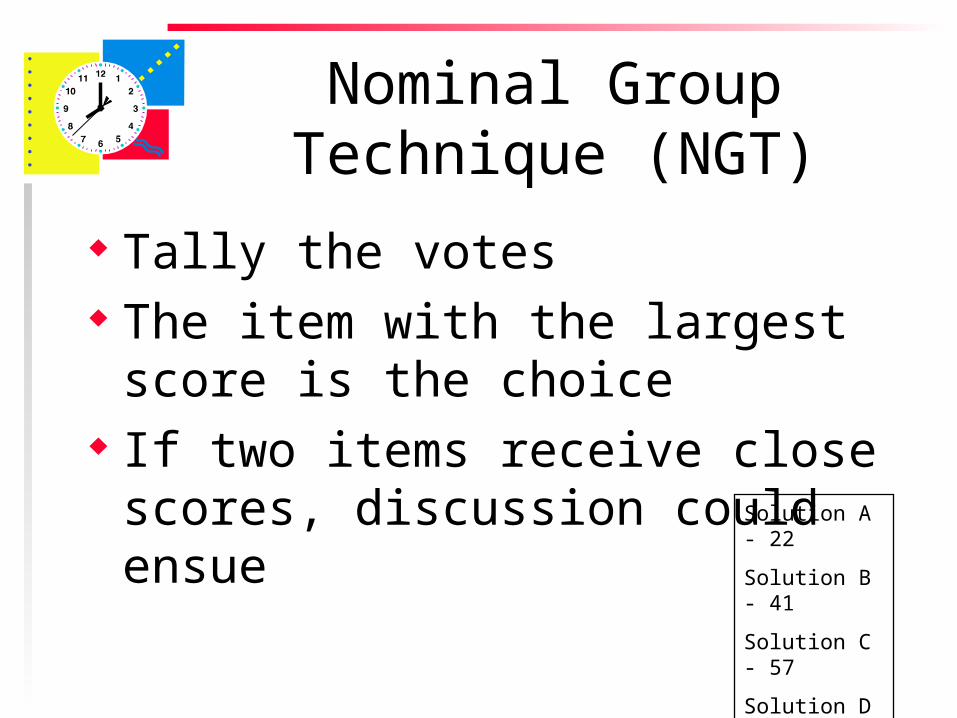
Tally the votes The item with the largest score
is the choice If two items receive close
scores, discussion could ensue
Solution A - 22
Solution B - 41
Solution C - 57
Solution D - 10
Solution E - 34
Nominal Group Technique (NGT)
Voting variations– For long lists, give team
members “one half plus one” votes
• 20 items on the list = use 11 votes
Nominal Group Technique (NGT)
Voting variations (multivoting)– If folks feel strongly about certain
options let them take the number of possible votes and divide the votes between options
• Option A – 3 votes• Option B – 0 votes• Option C – 1 votes• Option D – 0 votes
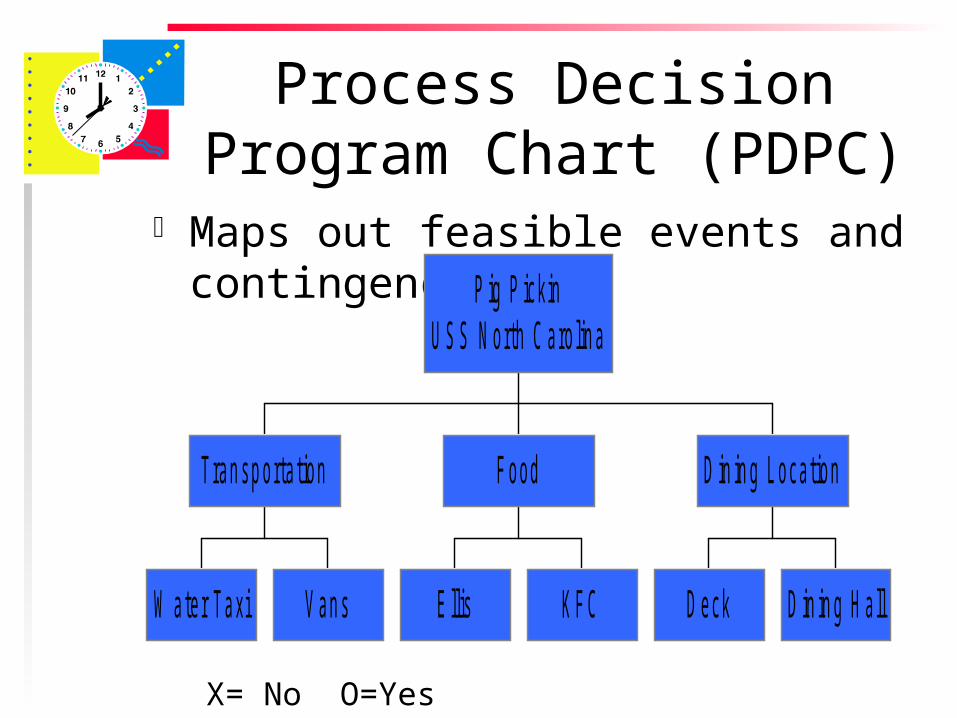
Maps out feasible events and contingencies
X= No O=Yes
Process Decision Program Chart (PDPC)
W ater Taxi V an s
Tran sp orta tion
E llis K F C
F ood
D eck D in in g H a ll
D in in g L oca tion
P ig P ick inU S S N orth C aro lin a