Cpsp competitive analysis
41
Creating and Presenting Strategic Plans Competitive Analysis and Strategies (B.2.4.)
-
Upload
prof-patrick-mcnamee -
Category
Business
-
view
248 -
download
0
Transcript of Cpsp competitive analysis

Creating and Presenting Strategic Plans
Competitive Analysis and Strategies (B.2.4.)

Competition at 3 Levels
B.2.3. Competitive Analysis
B.2.3.1.Industry Forces
B.2.3.2.Firm Position
B.2.3.3. Actual Competitors

Profit Levels for Pharmaceutical Manufacturers in 2014 Fortune 500 List
Company Codes: JNJ: Johnson and Johnson, PFE: Pfizer, MRK: Merch, LLY: Eli Lilly and Company, ABBV: AbbVie,
AMBN: Amgen, BMY: Bristonl-Myers Squibb Company, GILD: Gilead Sciences, BIIB: Biogen Idec, MYL: Mylan,
CELG: Celgene, AGN: Allergen
Source: http://www.drugchannels.net/2014/06/profits-in-2014-fortune-500.html
0
30
60
90
120
JNJPFE
MRKLLY ABBV
AMGNBMY GILD
BIIB MYL CELGAGN
92.7
5
0.8
18.8
6.8
11.4
26.3 22.5
5.9
31.2
11.634.6
26.326.9
7.3 5.0
34.8
68.5
104.5
91.0
58.1
115.3
21.3
Annualized Return To Investors (2003 - 2013) (%) Total Return to Investors 2013 (%)
(%)

Coincidence?
Luck?
Supply and demand?
No
Underlying structure
Not just competitors, other forces
Degree of Competition in Any Industry

Porter’s 5 Competitive Forces Model
Power of BuyersPower of Suppliers
Threat of New Entrants
Threat of Substitutes
Degree
of
Rivalry
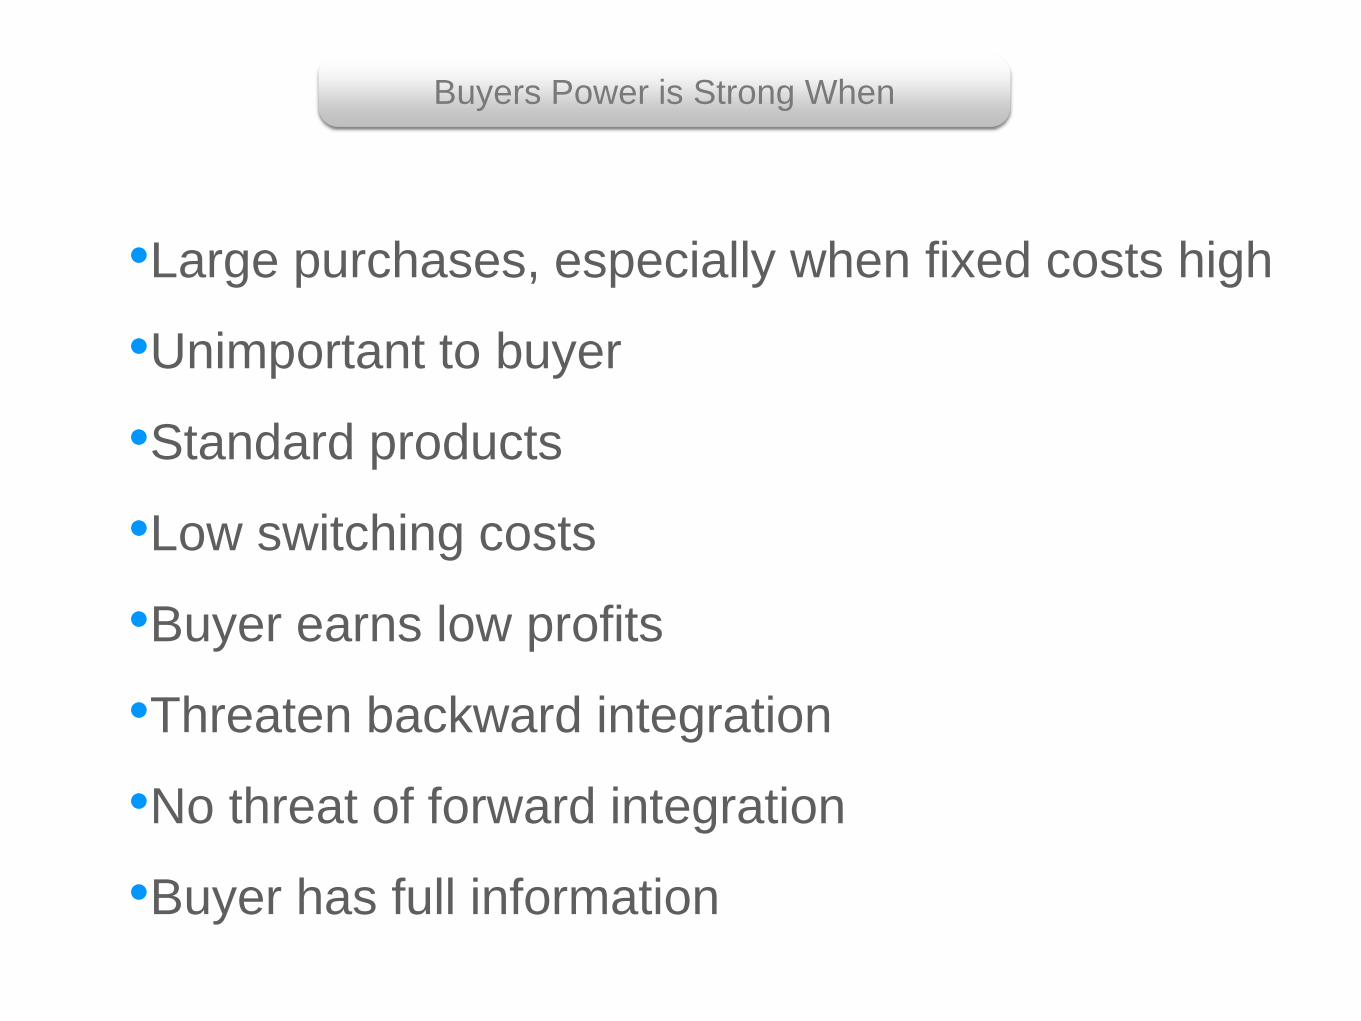
•Large purchases, especially when fixed costs high
•Unimportant to buyer
•Standard products
•Low switching costs
•Buyer earns low profits
•Threaten backward integration
•No threat of forward integration
•Buyer has full information
Buyers Power is Strong When
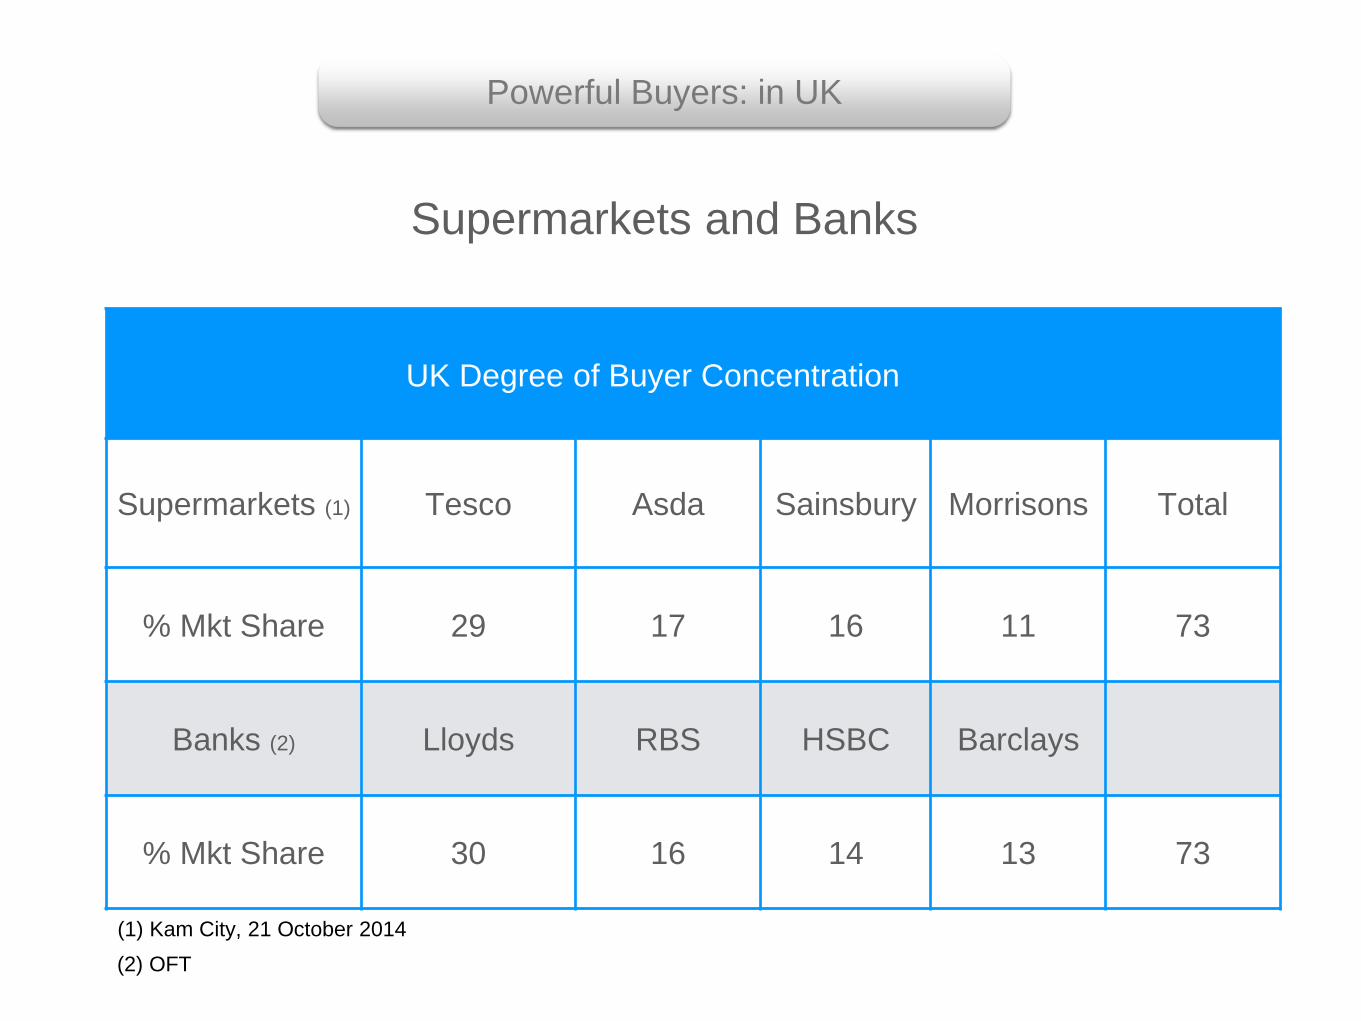
Powerful Buyers: in UK
UK Degree of Buyer Concentration
Supermarkets (1) Tesco Asda Sainsbury Morrisons Total
% Mkt Share 29 17 16 11 73
Banks (2) Lloyds RBS HSBC Barclays
% Mkt Share 30 16 14 13 73
(1) Kam City, 21 October 2014
(2) OFT
Supermarkets and Banks

•Suppliers highly concentrated
•Government is a supplier
•No substitutes
•Buyer has high switching costs
•Threatens forward integration
•Not an important customer of supplier
•Supplier product important
•Supplier’s products differentiated
Supplier Power (Mirror of Buyer) is Strong
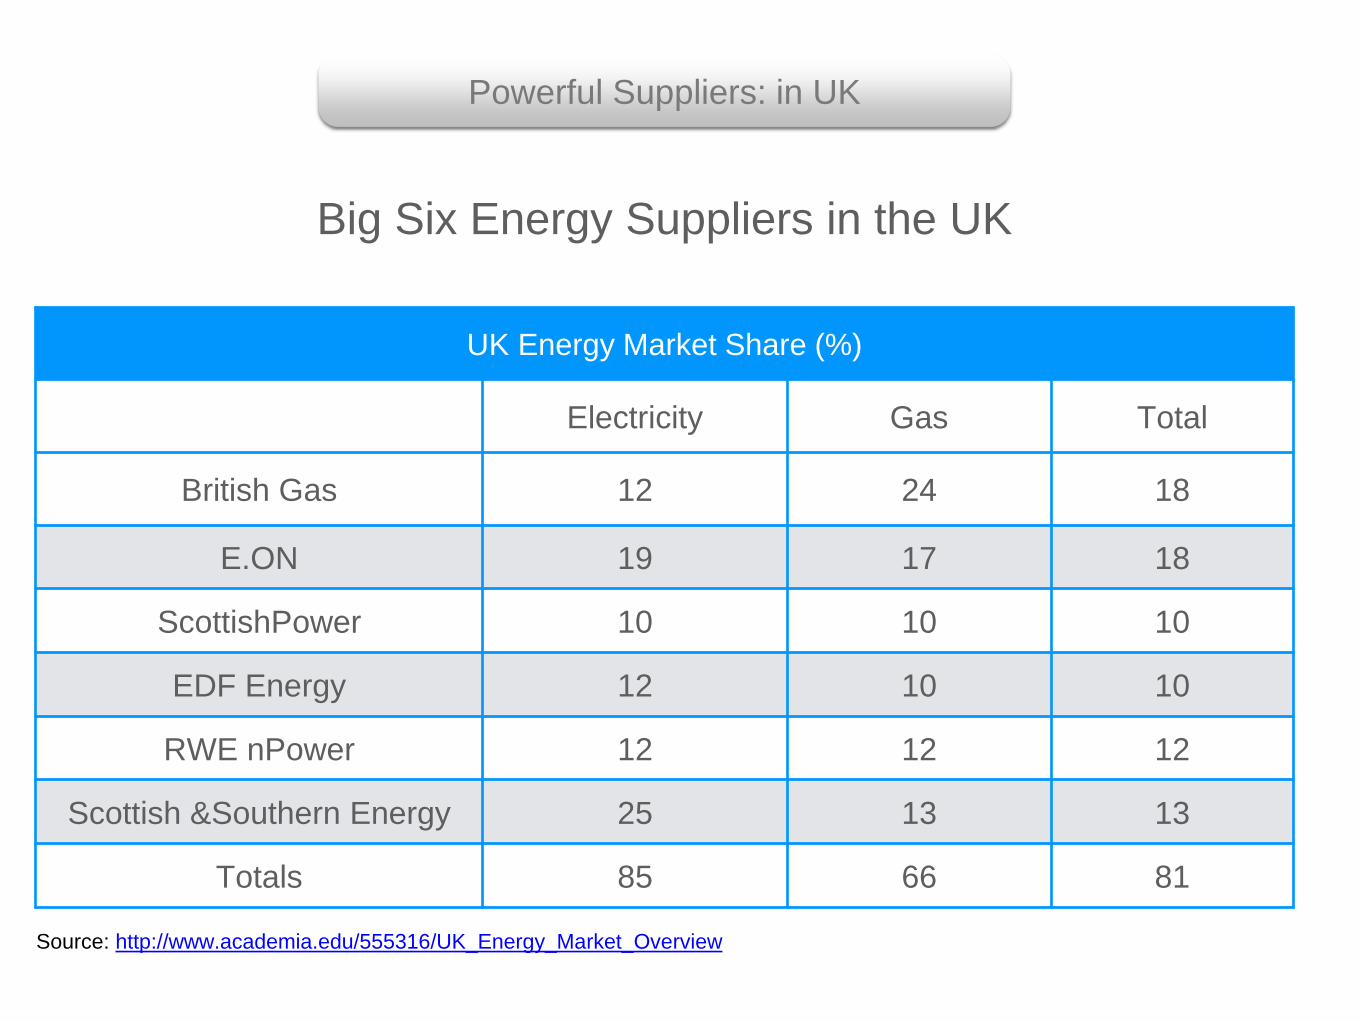
Powerful Suppliers: in UK
UK Energy Market Share (%)
Electricity Gas Total
British Gas 12 24 18
E.ON 19 17 18
ScottishPower 10 10 10
EDF Energy 12 10 10
RWE nPower 12 12 12
Scottish &Southern Energy 25 13 13
Totals 85 66 81
Source: http://www.academia.edu/555316/UK_Energy_Market_Overview
Big Six Energy Suppliers in the UK
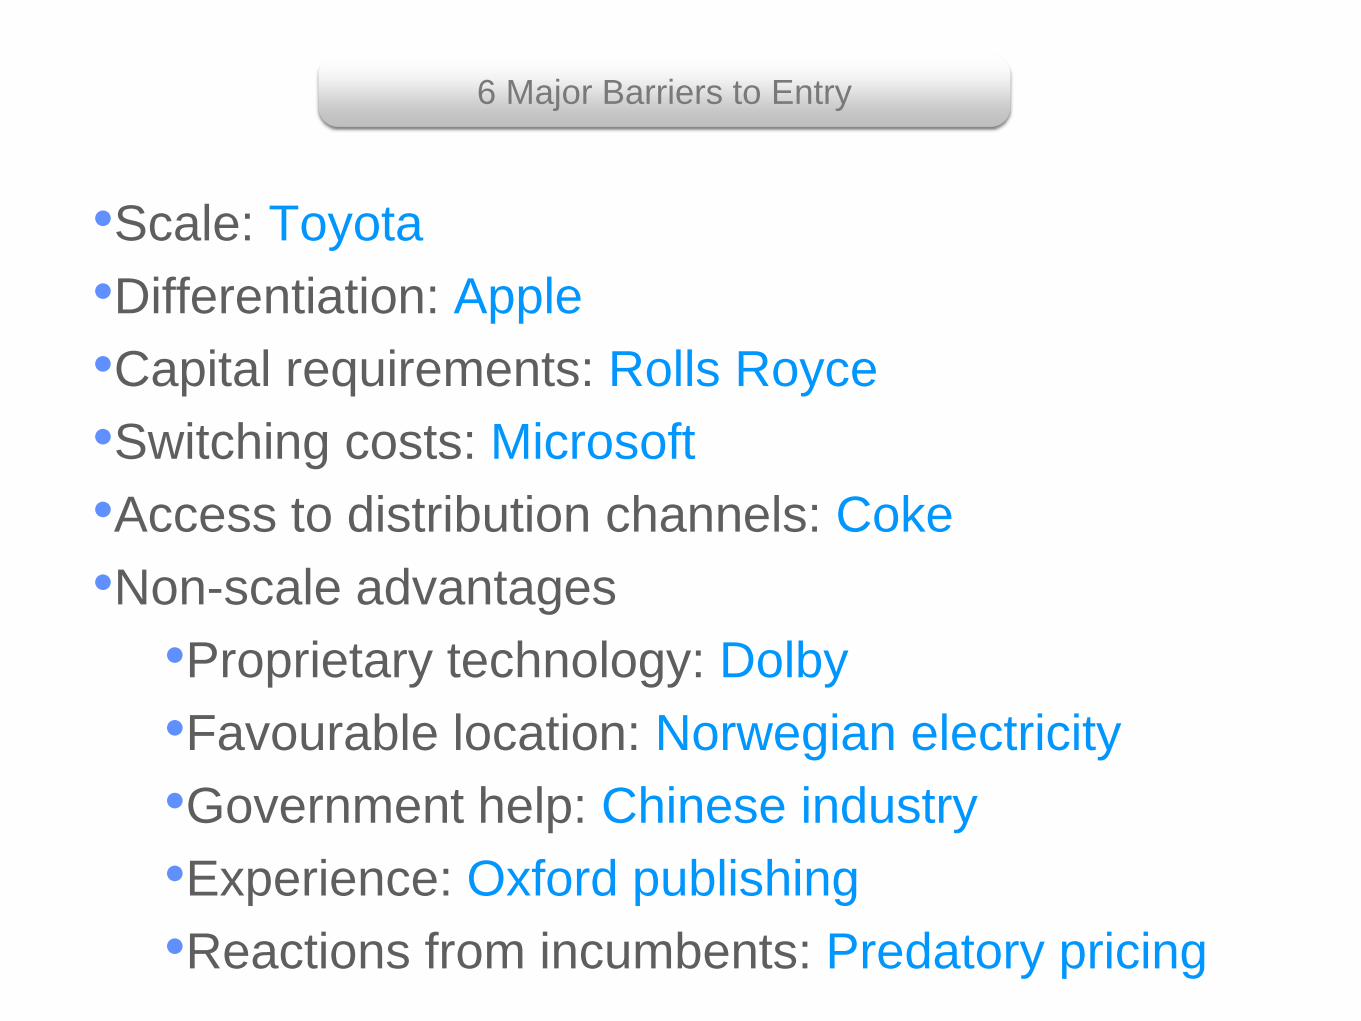
•Scale: Toyota
•Differentiation: Apple
•Capital requirements: Rolls Royce
•Switching costs: Microsoft
•Access to distribution channels: Coke
•Non-scale advantages
•Proprietary technology: Dolby
•Favourable location: Norwegian electricity
•Government help: Chinese industry
•Experience: Oxford publishing
•Reactions from incumbents: Predatory pricing
6 Major Barriers to Entry

•Other products/services which
perform the same function
•Place a ceiling on the price
Product/Service Substitutes
Movie Television, DVD, stage play
Telephone call Letter, fax, email
CD bought from retailer Download, Stream
Ferry journeyAeroplane, tunnel plus car, rail
tunnel
Product catalogue CD, download from web
Substitutes

•Slow industry growth: House Building
Intensity of Rivalry
•Numerous equally balanced competitors: Web Page Designers
•High fixed costs: Rolls Royce
•Lack of differentiation: Office Stationery
•Large increments in capacity: Oil Refining
•Diverse competitors: Recorded Music
•High strategic stakes: Military
•High exit barriers: Shipyards

•Actual market rivals
Competition: All Five Forces
•Potential entrants
•Buyers
•Suppliers
•Substitutes

How?
Appraise each force
Then
Compete using a generic strategy
Find a position in the industry where you can
best defend yourself
Goal of Competitive Strategy

•High volume low cost (HVLC)
•Differentiation
•Focus
The Generic Strategies

Loss for small player
High
LowVolume
Unit price &
unit cost
Low
High
Profits for
largest player
Generic 1: High Volume Low Cost (HVLC)
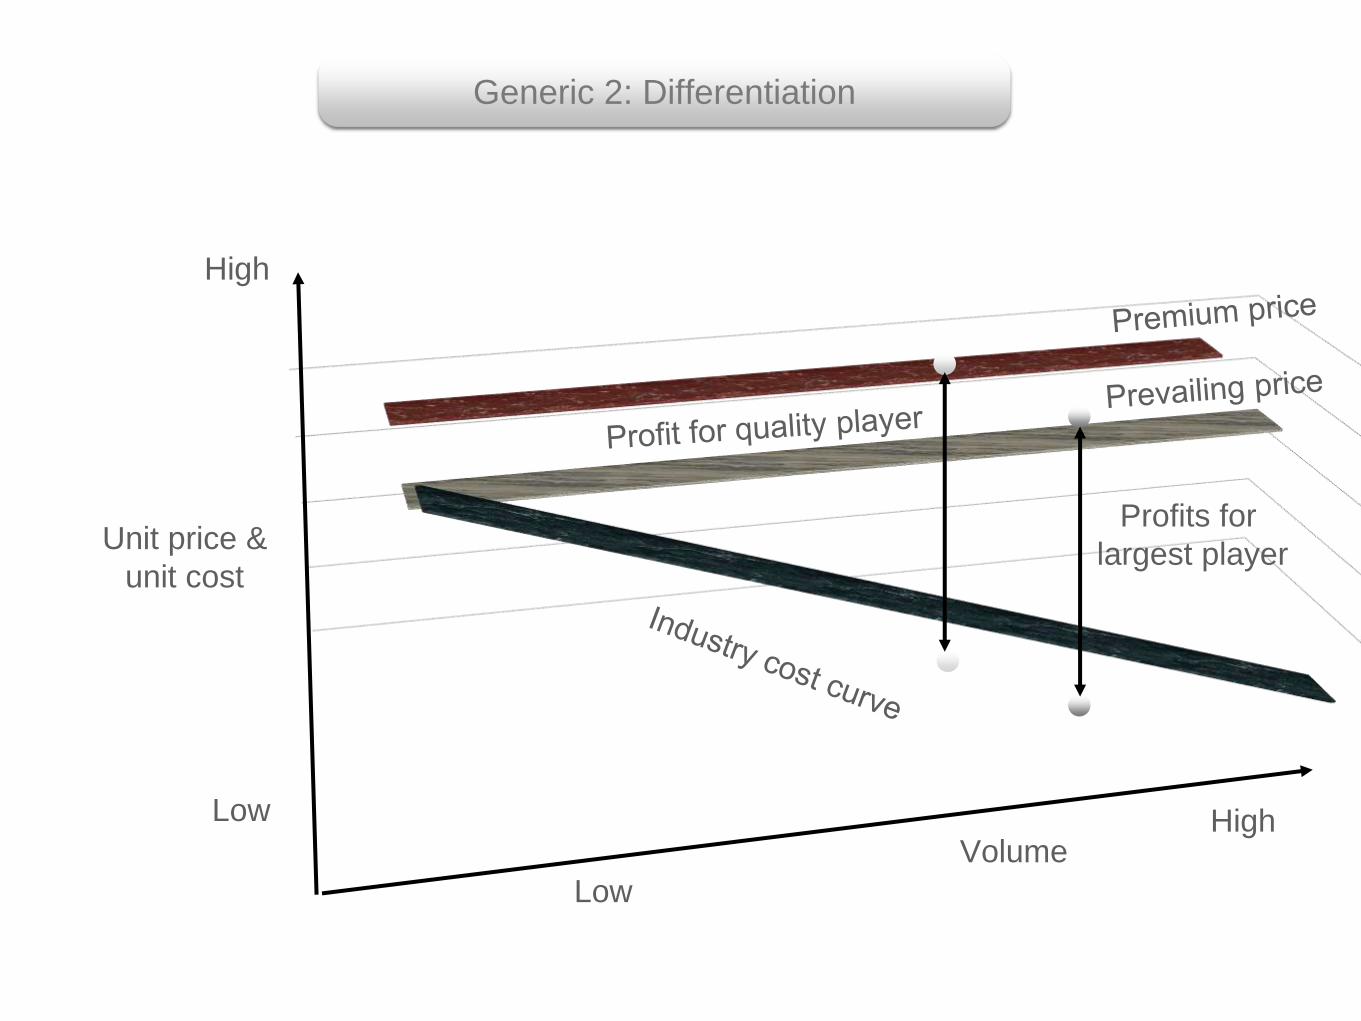
High
Low
Volume
Unit price &
unit cost
Low
High
Profits for
largest player
Generic 2: Differentiation

Lever Effects Difficulty
Price
Lower profits,
Disloyal buyers,
No skill
Retaliation
Easy
PromotionExpand overall
marketDifficult
Distribution Maintain margins Difficult
InnovationHigher and more
sustained profitsDifficult
ServicePrice and cost
advantageDifficult
QualityPrice and cost
advantageDifficult
Sources of Differentiation: The Marketing Levers
Or why low price is a terrible weapon

Differentiation
Marketing/Promotion
Innovation

Major Global Advertising Spend : A Paradox?
Samsung: World’s biggest advertising spend 2014Yet its Phone profits declined 78% in Q4
Apple: Lowest % advertising spendYet its profits soar
Microsoft spend 8.0% of sales
Apple spend 0.7% of sales
8.0%
0.7%
x 11 timesWhy?

The Reason
One is selling a product
The other is marketing a brand
Product Brand
Product
Price
Advertising
Product + Associated Services
Promotion
Design
Warranty
Quality
Customer service
Innovation
Distribution
Uniqueness

The World’s Top Brands 2014
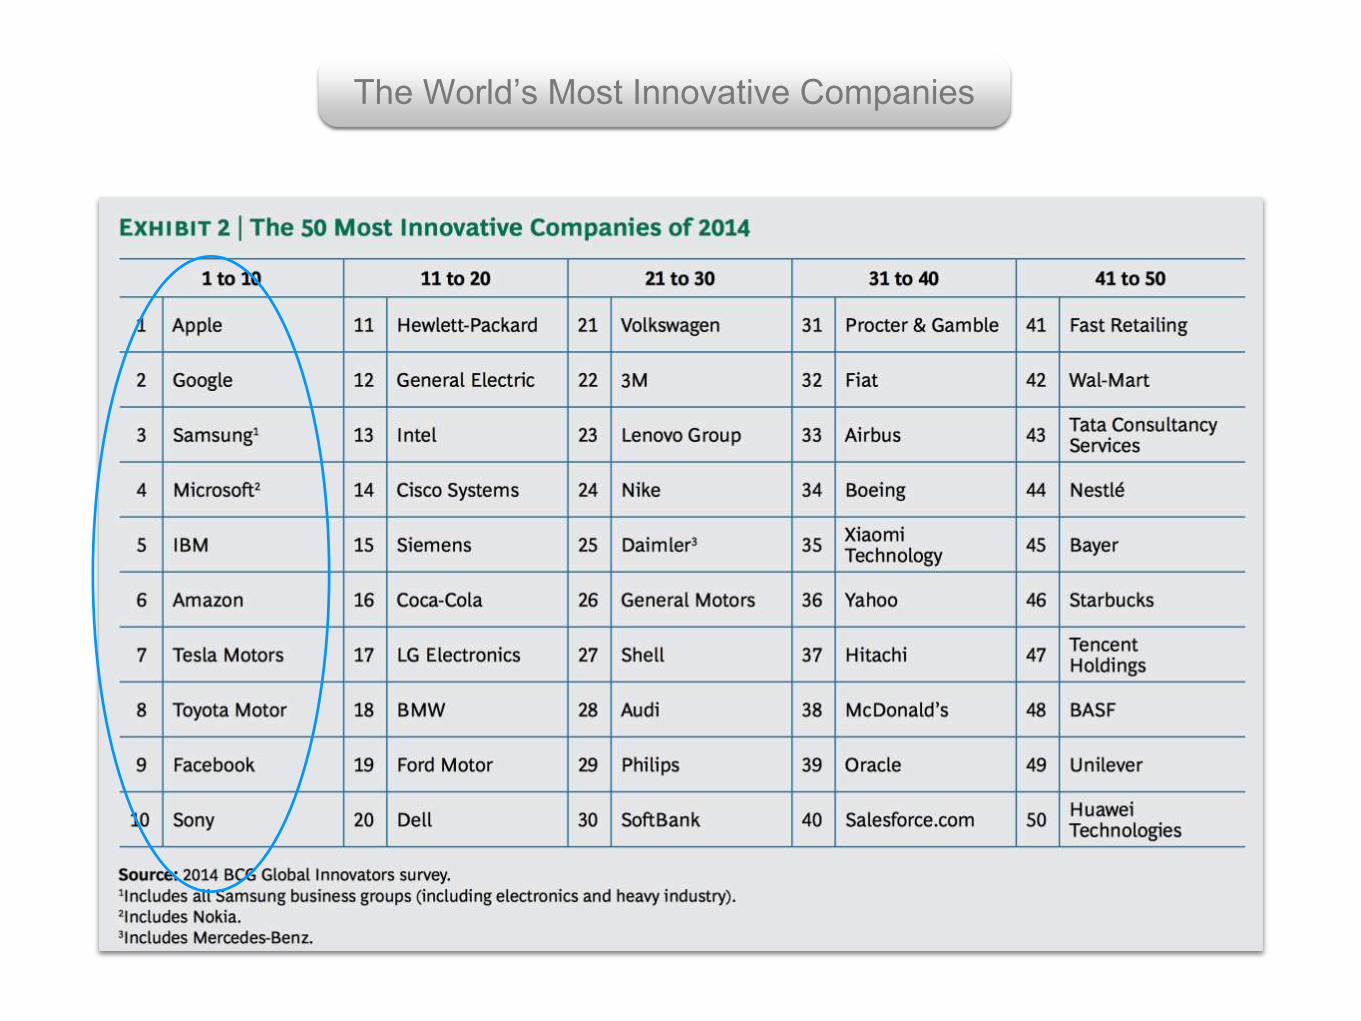
The World’s Most Innovative Companies

Cultures which Promote Innovation

Source: Forbes
0
20
40
60
80
Revenue GrowthEBITDA Grth
Mkt Cap Growth
Top 10 Innovators Top 10 Spenders
Top 10 innovators outperform their peers in 3 key
financial metrics (5 years CAGR)
Real Innovation Pays

Lever Effects Difficulty
Price
Lower profits,
Disloyal buyers,
No skill
Retaliation
Easy
PromotionExpand overall
marketDifficult
Distribution Maintain margins Difficult
InnovationHigher and more
sustained profitsDifficult
ServicePrice and cost
advantageDifficult
QualityPrice and cost
advantageDifficult
The Marketing Levers
Reminder

•Buyer power reduced – alternatives denied
Differentiation
•Price premiums + loyal buyers give
margins to deal with supplier power
•Brand loyalty protects

•Differentiated focus
•HVLC focus
Focus
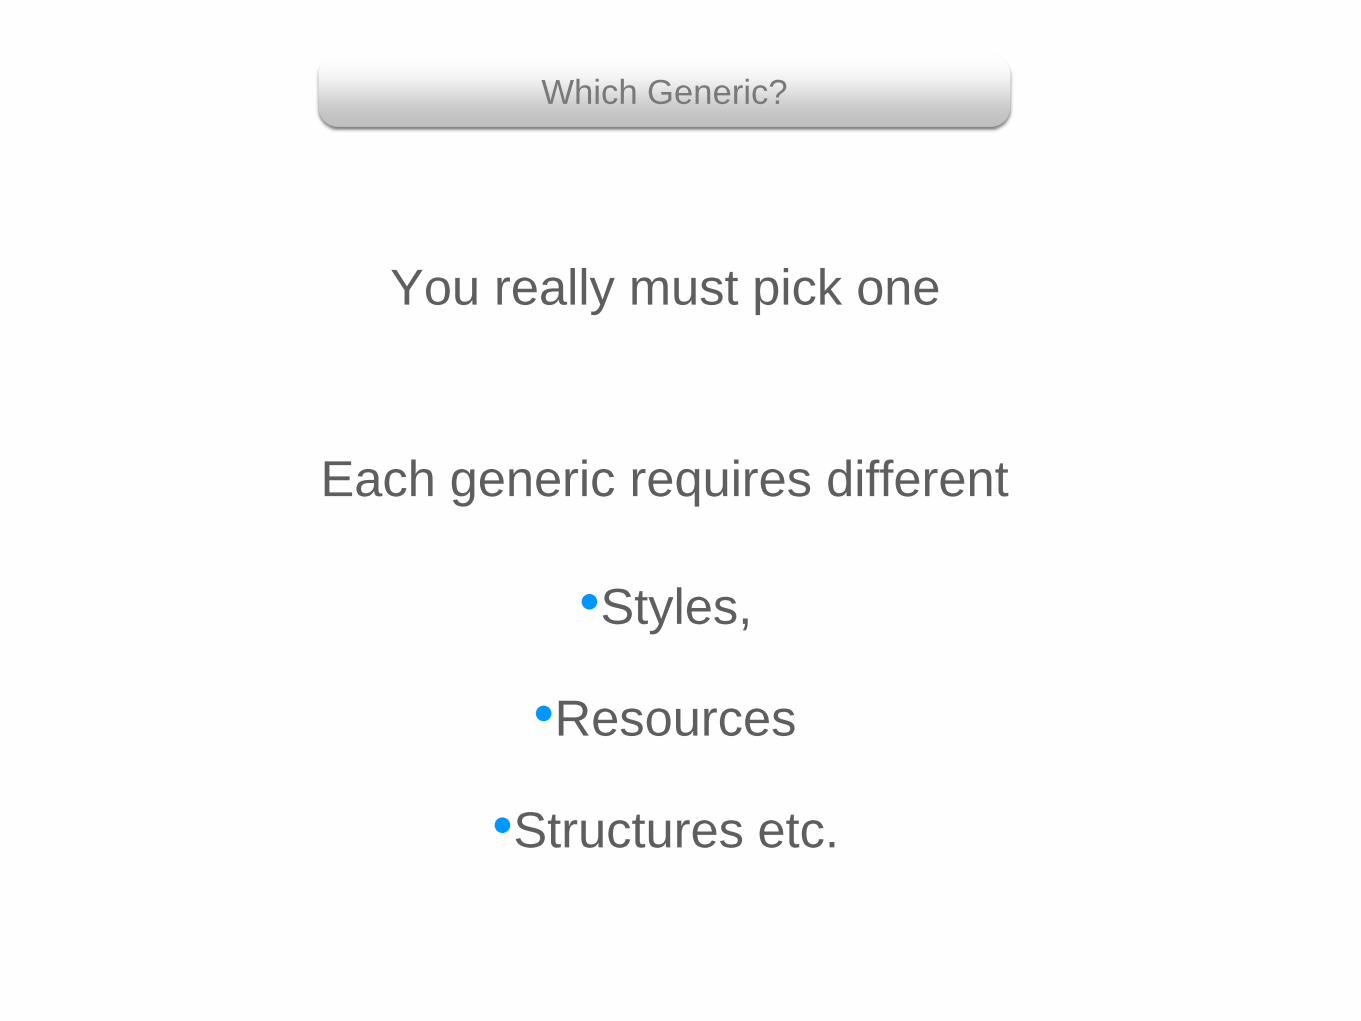
You really must pick one
•Structures etc.
•Resources
•Styles,
Each generic requires different
Which Generic?

ROCE
RMS HighLow
High
LowHVLCDifferentiated Stuck in the middle
The U-Shaped Curve

•More important than ever
•Generic strategies vital – the basis of
much successful e-business
The big changes:
•Switching costs reduced
•Fantastic opportunities to resolutely
pursue a generic
Competitive Forces in the Internet Ear

Force Threats Our strategy
Power of Buyers
Power of Suppliers
Threat of New Entrants
Threat of substitutes
Degree of rivalry
Our generic strategy:
Practical Application

Creating and Presenting Strategic Plans
Competitive Analysis and Strategies (B.2.4.)
Firm Competitive Position

Characteristic Comment
Sales (£) The larger the better
Market share (%) The larger the better
RMS The larger the better
RPQ The larger the better
Price rel to comp (%) The larger the better
New prod/sales (%) *The larger the better
R&D/Sales (%) The larger the better
Degree of Competition The more benign the better
Determinants of Firm Competitive Position
* Assuming firm is already No. 1 in RPQ
Which is
best?

Firm Competitive Position: Discussion
• Political
• Economic
• Social
• Technological
• Environmental
• Other influences
• Legal
• Barons
• Insurgent
s
• Serfs

Product Sales ($)Mkt Sh.
(%)RMS RPQ RP NP/Sales
R&D/Sal
esCompetition
Comments
Current Competitive Position Template

Creating and Presenting Strategic Plans
Competitive Analysis and Strategies (B.2.4.)
Actual Competitors

Know the Gossip

•Predictions
Actual Competitors: Wide discussion
•History:
•Leader/Follower
•Growth
•Focus on Leaders - past behaviours
•Focus on Insurgents and Barons
•HVLC versus Diff. versus Focus
•Organic versus Acquisition
Existing
•New diverse entrants or threatsNew
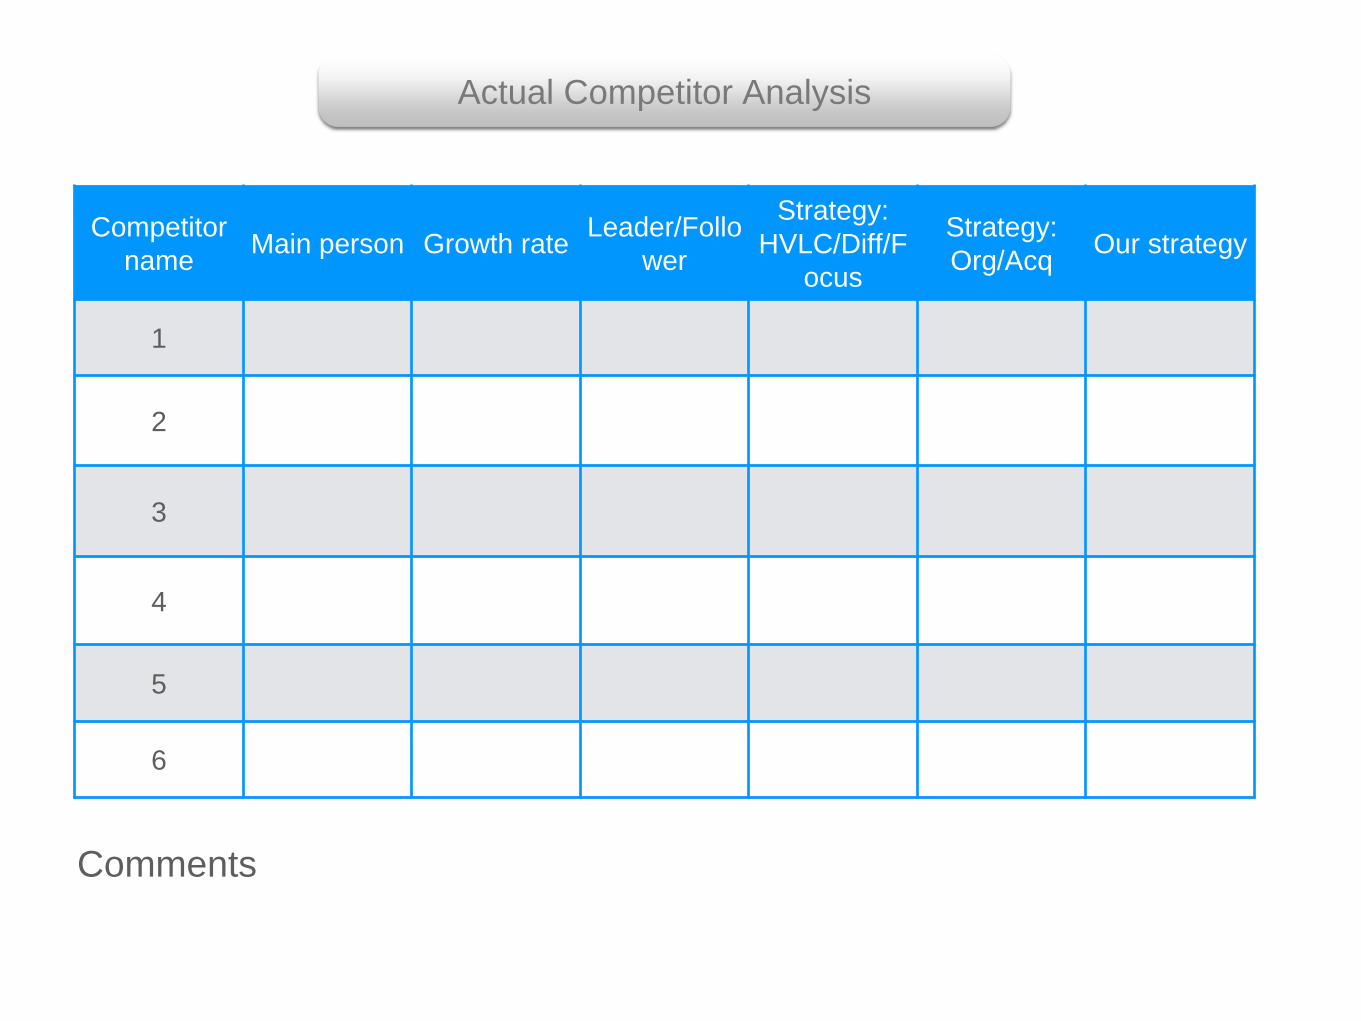
Competitor
nameMain person Growth rate
Leader/Follo
wer
Strategy:
HVLC/Diff/F
ocus
Strategy:
Org/AcqOur strategy
1
2
3
4
5
6
Comments
Actual Competitor Analysis

The End