Cpsp the product market portfolio
23
The Product Market Portfolio (B.2.2) Creating and Presenting Strategic Plans Part 1 of 2
-
Upload
prof-patrick-mcnamee -
Category
Business
-
view
81 -
download
0
Transcript of Cpsp the product market portfolio

The Product Market Portfolio (B.2.2)
Creating and Presenting Strategic Plans
Part 1 of 2

•Competitive position: leader or follower?
•Scale: value to portfolio?
•Growth rate: high or low?•Maturity: development, growth, maturity,
decline?
Product-Market Matrix lacks Dynamism

What are the strategic determinants of a superior cash position?
Bruce D. Henderson

•Relative market share (RMS)
•Market growth rate (MGR)
•Value of annual sales
Determinants of a Superior Cash Position

Your firm’s market shareYour firm’s largest rival’s market share
RMS =
Relative Market Share (RMS)

Mobile telephones Vodka
Competitor Market share Competitor Market share
A 40% Z 20%
Which Firm is Stronger Strategically: A or Z
B 60% Z1 to Z80 1%
Total 100%% Total 100%%

Mobile telephones Vodka
Competitor
Market share RMS
Competitor
Market share RMS
A 40% 0.67 Z 20% 20.0
B 60% 1.5 Z1 etc 1% 0.05
Which Firm is Stronger Strategically: A or Z
Chairs
Competitor Market share RMS
A 20% 20/40 =0.5
B 40% 40/20=2.0
C 20% 20/40=0.5
D 10% 10/40=0.25
E 10% 10/40=0.25
Mental Arithmetic: What are the RMSs

The Product Market Portfolio (B.2.2)
Creating and Presenting Strategic Plans
Part 2 of 2

•Relative market share (RMS)
•Market growth rate (MGR)
•Value of annual sales
Let’s put them on a matrix
Determinants of Strategic Position

Leader Follower
Market growth
rate
High
5%
10%
Low
0%High Low10.0 0.101.0
RMS
• RMS
• MGR
• Ann Sales
The Product Market Portfolio

Leader Follower
Market growth
rate
High
5%
10%
Low
0%High Low10.0 0.101.0
RMS
• RMS
• MGR
• Ann Sales
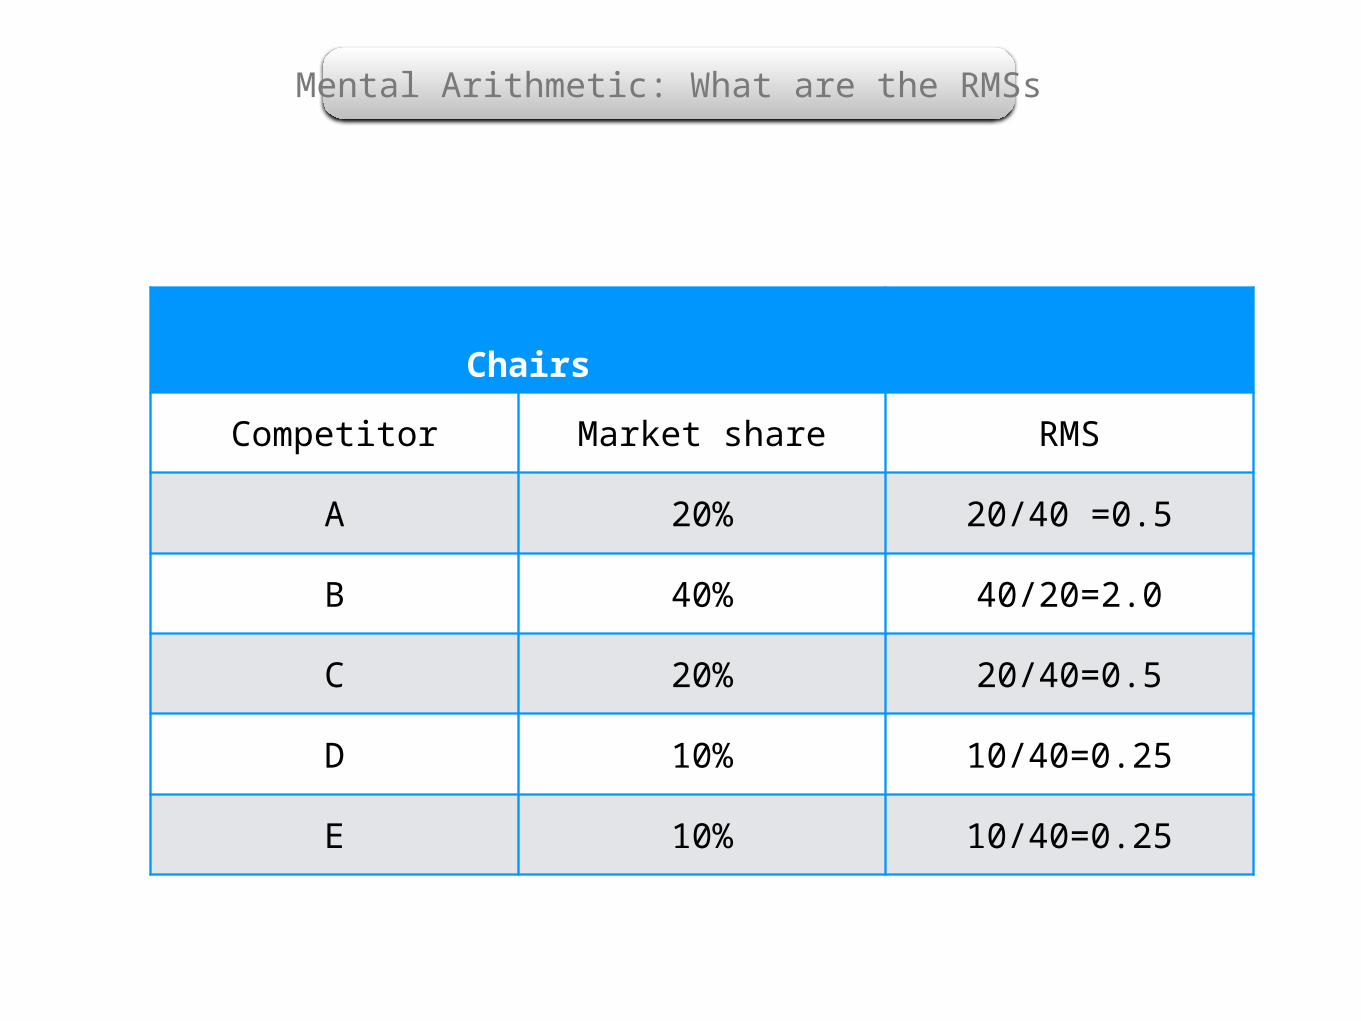
The Cash Characteristics
++++++
-
+++++
++++- - -
+
++- - - - -
- - - - - -
+- - - - -
12
3 4
Leader Follower
Market growth
rate
High
5%
10%
Low
0%High Low10.0 0.101.0
RMS
• RMS
• MGR
• Ann Sales
++++++
-
+++++
++++- - -
+
++- - - - -
+_ _ _ _ _ _ _ _ _
The Cash Characteristics & Names
Small cash surplus
Large cash drain
May be large cash drain
Large cash surplus
Problem children
DogsCash cows
Stars
_ _ _ _
D
A
B
C
E
F
12
3 4

Leader Follower
Market growth
rate
High
5%
10%
Low
0%High Low10.0 0.101.0
RMS
The Product Market PortfolioThe Cash Characteristics & Names
201X
A
B
C
D
F
E
201Z
PMP in 201X and 201Z

Leader Follower
Market growth
rate
High
5%
10%
Low
0%High Low10.0 0.101.0
RMS
• RMS
• MGR
• Ann Sales
The Product Market PortfolioIdeal Movement of Product A Over Life
20077
A
A
A
A
A

Leader Follower
Market growth
rate
High
5%
10%
Low
0%High Low10.0 0.101.0
RMS
A
B
C
D
E
Ideal Movements of Cash

Market growth
rate
High Low10.0 0.101.0
High
Low
5%
10%
0%
Relative market share
D
F
E
A
B
G
C
An Unbalanced Portfolio

2005 Qantas PMP

•Build market share: problem child, star
•Sell or divest the product: dog, problem child
•Harvest dog, selected problem child, cash cow
•Hold market share: cash cow
Strategies for Each Category

•Correlation of RMS and profitability
•Location
•Technology
•Efficiency
•Only high RMS is desirable
Possible Issues with the Matrix
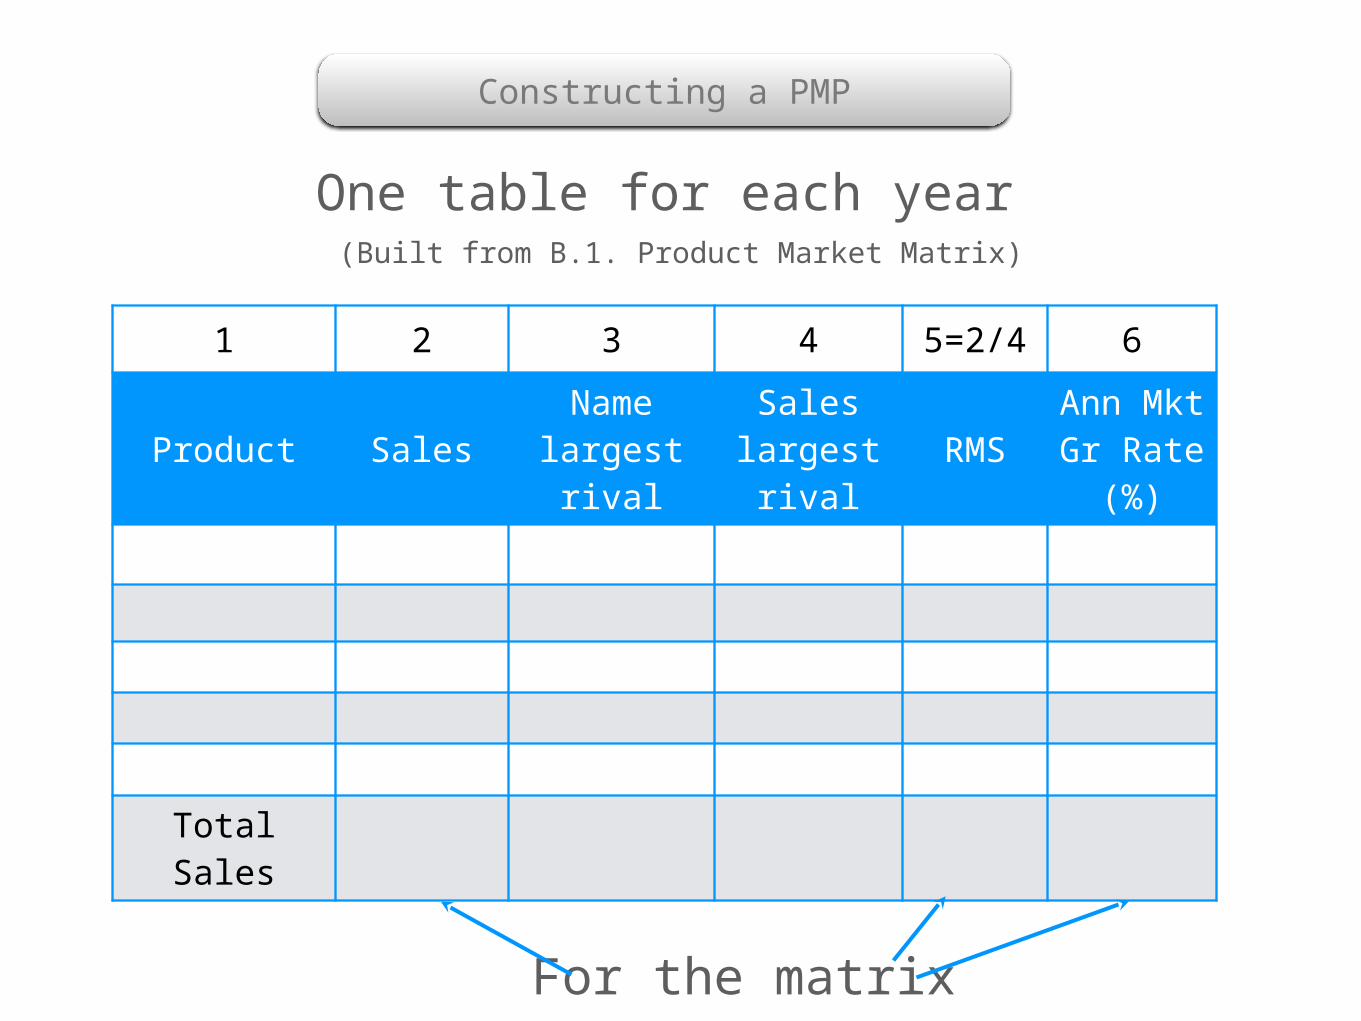
1 2 3 4 5=2/4 6
Product SalesName largest
rival
Sales largest
rivalRMS
Ann Mkt Gr Rate
(%)
Total Sales
For the matrix
Constructing a PMP
One table for each year(Built from B.1. Product Market Matrix)
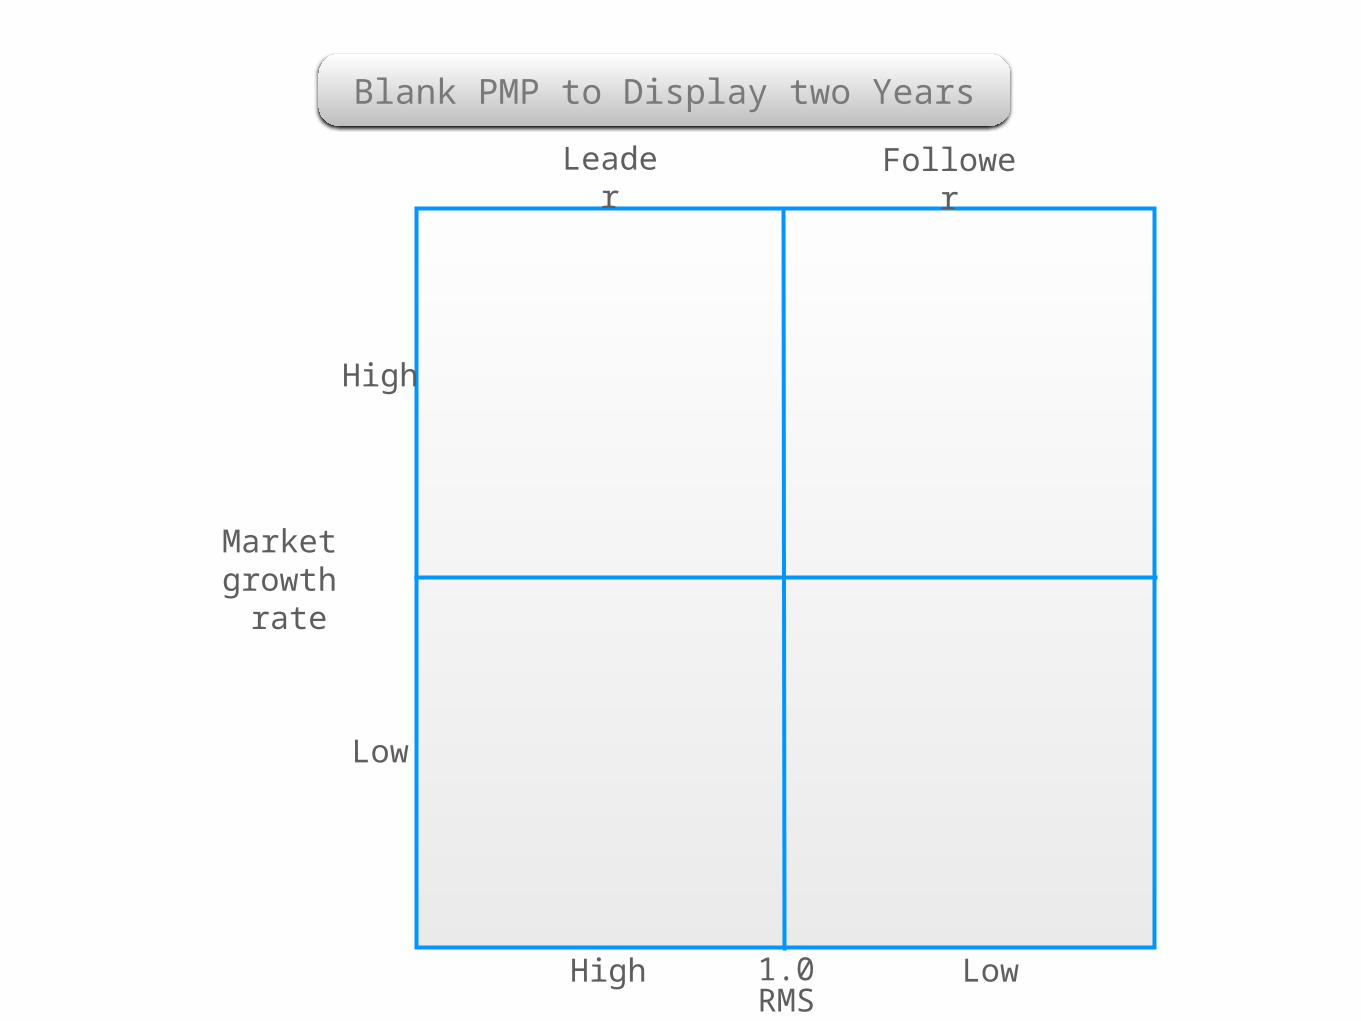
Leader Follower
Market growth
rate
High
Low
High Low1.0RMS
Blank PMP to Display two Years

The End
Parts 1 and 2