CPMS 2016 Q3 USA Market Revie › bt › HyL9256RT6T09072Pl7J7U9q › 2016 Q3 US Re… · 6 GICS...
32
<#> © 2015 Morningstar, Inc. All rights reserved. CPMS 2016 Q3 USA Market Review
Transcript of CPMS 2016 Q3 USA Market Revie › bt › HyL9256RT6T09072Pl7J7U9q › 2016 Q3 US Re… · 6 GICS...

<#>
© 2015 Morningstar, Inc. All rights reserved.
CPMS
2016 Q3 USA Market Review

2
Areas of Focus
1. Market performance: best sectors and stocks
2. How has Q4 performed historically?
3. Single factor analysis & model performance
4. Market fundamentals & outlook

3
S&P 500 Performance 2016 Q3 (Price Change)
2000
2050
2100
2150
2200
July August September
The quarter started off with a strong rebound from Brexit but
declined slightly afterwards.
3.6% -0.1% -0.1%
3.3%

4
U.S. Market Performance (Total Return)
July August September Q3
S&P 500 3.7% 0.1% 0.0% 3.9%
S&P 400 4.3% 0.5% -0.6% 4.1%
S&P 600 5.1% 1.4% 0.6% 7.2%
DJIA 2.9% 0.3% -0.4% 2.8%
NASDAQ 6.6% 1.2% 2.0% 10.0%
-2%
0%
2%
4%
6%
8%
10%
12%
While all indexes had performed strongly at the beginning of the quarter, many had muted results
afterwards. Small caps and the NASDAQ outperformed other indexes for Q3.

5
July August September Q3
S&P 500 73% 50% 50% 62%
S&P 400 76% 58% 48% 66%
S&P 600 76% 61% 49% 63%
DJIA 73% 50% 43% 53%
0%
20%
40%
60%
80%
100%
Market Breadth (% of stocks with a positive total return)
Breadth was high across many indexes in the third
quarter, mainly due to solid returns in July.

6
GICS Sectors: 2016 Q3 Total Returns
Sector Sector
Weight
Q3
Return
Q3
Breadth Best Performer % Worst Performer %
10 Energy 7.3% 2.3% 81% (30/37) Apache Corporation +29 Diamond Offshore Drill -5
15 Materials 2.9% 3.7% 48% (13/27) Albemarle Corporation +7 Mosaic Company -18
20 Industrials 9.7% 4.1% 57% (38/67) Quanta Services Inc +9 Fortune Brands Home -9
25 Consumer Discretionary 12.5% 2.9% 42% (35/83) Goodyear Tire +10 Tractor Supply Co -20
30 Consumer Staples 9.9% -2.6% 19% (7/36) Molson Coors Brewing. +7 Campbell Soup Company -10
35 Health Care 14.7% 0.9% 54% (32/59) Illumina Inc +8 Mylan N.V. -10
40 Financials 12.8% 4.6% 33% (21/64) E*TRADE Financial Corp +10 Wells Fargo & Co -13
45 Information Technology 21.2% 12.9% 71% (47/66) Western Digital Corp +26 Cognizant Tech Soltn -17
50 Telecommunications 2.6% -5.6% 0% (0/5) AT&T Inc. -1 Frontier Communications -7
55 Utilities 3.3% -5.9% 77% (21/28) AES Corporation +6 NRG Energy, Inc. -7
60 Real Estate 3.1% -2.1% 32% (9/28) Equity Residential +5 Host Hotels & Resorts -8
S&P 500 3.9% 50% (251/500) Apache Corporation +29 Tractor Supply Co -20
Technology was the outperforming sector for Q3. Telecom and Utilities
experienced the greatest loses for the quarter.

7
Q3 BEST & WORST PERFORMERS
Top and bottom 50 stocks in the S&P 500

8
Q3’s 50 Best Performing Stocks

9
Q3’s 50 Best Performing Stocks
Poor Growth metrics
Attractive valuations
At the beginning of Q3,
The 50 Best shared some of
the following attributes:
Initial poor earnings revisions
and surprise which turned
Higher earnings and price
variability
10
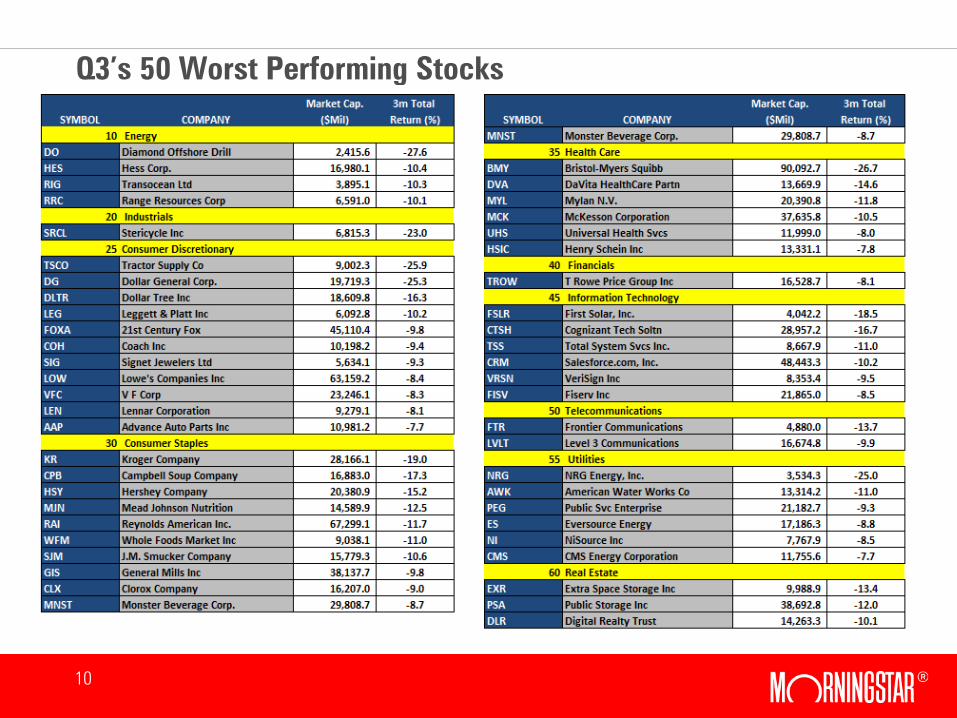
Q3’s 50 Worst Performing Stocks

11
Q3’s 50 Worst Performing Stocks At the start of Q3,
The 50 Worst shared some of
the following attributes:
Market-like ROE
Smaller-cap stocks with lower
price beta
Higher earnings and sales
momentum
Higher earnings surprise and
revision metrics
Slightly poor valuation metrics

12
Historic Performance – Q4
-25%
-20%
-15%
-10%
-5%
0%
5%
10%
15%
20%
25%
71 73 75 77 79 81 83 85 87 89 91 93 95 97 99 01 03 05 07 09 11 13 15
% T
otal R
eturn
80% % positive
9 # negative quarters
36 # positive quarters
Q4 Q1 Q2 Q3 Q4
Average 3.3% 2.9% 0.9% 4.4%
Median 3.4% 2.7% 2.7% 5.6%
Std Dev 8.1% 7.4% 9.0% 8.5%
S&P 500 Total Return – 4th
Quarter Performance: 1970 to 2015

13
Q4 Historic Performance
GICS Sector Q4 Performance: 1989 to 2015
Return (%) Energy Materials Industrials
Consumer
Disc.
Consumer
Staples
Health
Care Financials I.T. Telecom Utilities
*Real
Estate
Median 4.4% 8.5% 6.3% 7.4% 6.1% 5.2% 7.5% 8.7% 7.5% 4.9% 4.8%
Std Dev 9.2% 11.1% 8.6% 10.6% 7.2% 6.3% 11.8% 16.7% 11.9% 6.6% 16.1%
% Positive 68% 80% 84% 80% 92% 92% 76% 76% 68% 76% 83%
Historically, Technology and Materials have been the best performing sectors in Q4.
All sectors have historically posted more profitable quarters than not, with
Consumer Staples and Health Care doing so over 90% of the time.
The chart below illustrates the historic median return, standard deviation and probability of a
profitable quarter for all sectors in the US:
*Real Estate Sector Performance starts at 2002
14
Which fundamentals did the market reward during Q3?
At the start of the period, we equally weighted the best and
worst 50 stocks using each of the most commonly used
CPMS factors separately and measured their performance.
15
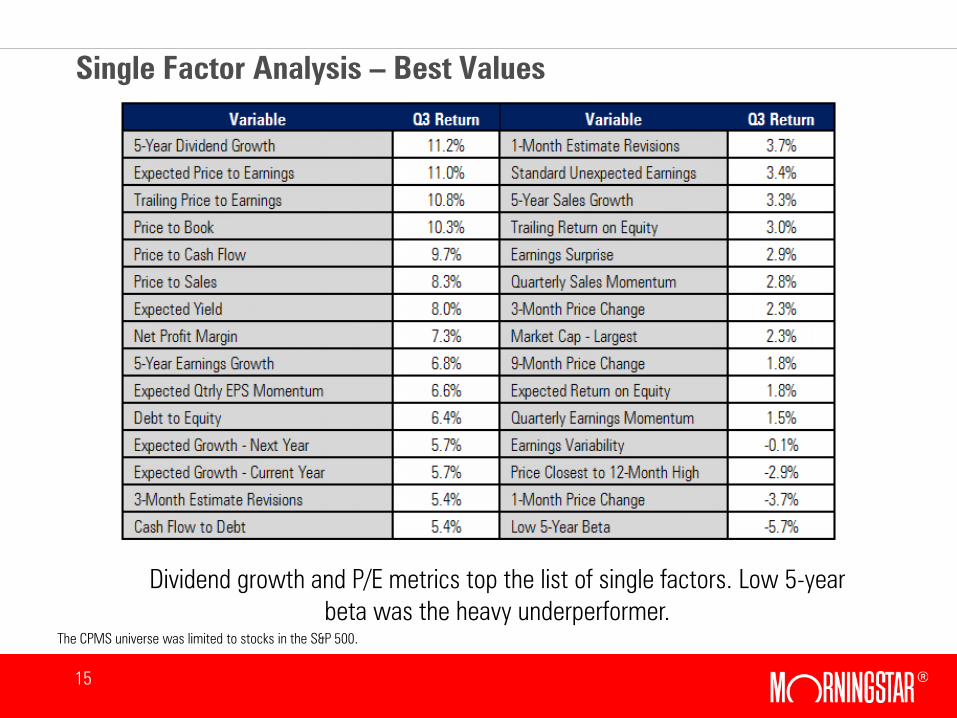
Single Factor Analysis – Best Values
The CPMS universe was limited to stocks in the S&P 500.
Dividend growth and P/E metrics top the list of single factors. Low 5-year
beta was the heavy underperformer.
16
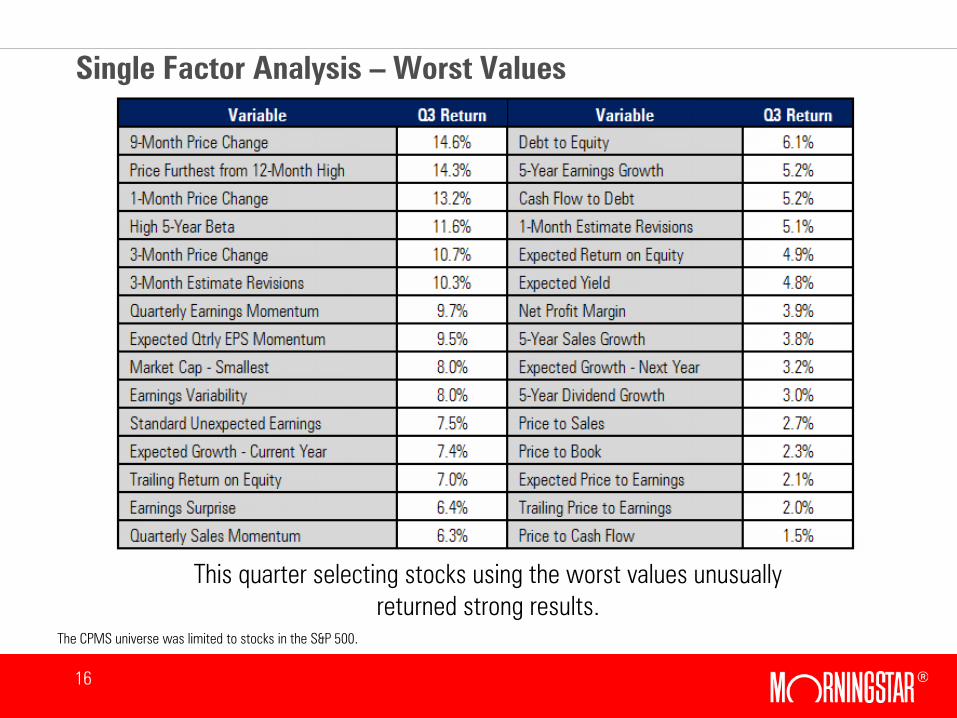
Single Factor Analysis – Worst Values
The CPMS universe was limited to stocks in the S&P 500.
This quarter selecting stocks using the worst values unusually
returned strong results.

17
Single Factor Analysis – Best Net of Worst
The CPMS universe was limited to stocks in the S&P 500.
A long/short approach highlights how investors may have been rewarded by
selecting top-ranking stocks and avoiding those that rank poorly

18
STYLE ANALYSIS

19
CPMS Model Strategy Returns: Q3 2016
Slightly under half of CPMS models performed better than the S&P 500 in Q3. The Dangerous
strategy, which is intended to underperform, actually was the biggest outperformer.
Style Portfolios July August September Q3
Dangerous 10.3% 5.5% 3.8% 20.8%
D10 Earnings Value/Earnings Momentum 7.8% 1.4% 1.6% 11.0%
Asset Value 5.7% 3.7% 0.1% 9.7%
Earnings Value 5.2% 1.0% 2.1% 8.5%
Price Momentum 9.9% -4.4% 1.2% 6.4%
Earnings Momentum 7.1% -2.5% 0.9% 5.4%
Industry Relative 4.3% -0.2% 0.5% 4.6%
D10 Valuation/Momentum Breakout 4.9% -2.7% 2.3% 4.4%
S&P 500 Total Return 3.7% 0.1% 0.0% 3.9%
Asset Growth 4.4% -1.2% -0.5% 2.7%
Momentum Breakout 5.3% -5.4% 2.5% 2.2%
Large Cap D10 Income/Asset Growth 4.3% -1.4% -0.7% 2.1%
Dividend Growth 4.0% -1.6% -0.4% 2.0%
Earnings Growth 5.6% -3.1% -0.6% 1.8%
Valuation 1.0% -2.5% 2.7% 1.1%
Income 2.4% -1.7% -0.4% 0.3%
Dividend Income 2.3% -1.3% -0.9% 0.0%
D10 Dividend/Earnings Growth 3.2% -2.2% -2.3% -1.4%

20
MARKET FUNDAMENTALS & OUTLOOK

21
What are you paying? vs. What are you getting?
P/B vs. ROE (net of T-bills): CPMS Median
The ROEs of the CPMS universe have remained relatively flat vs. the end of Q2; P/Bs have rose
slightly from last quarter, indicating spread between ROE and valuation is contracting.
22
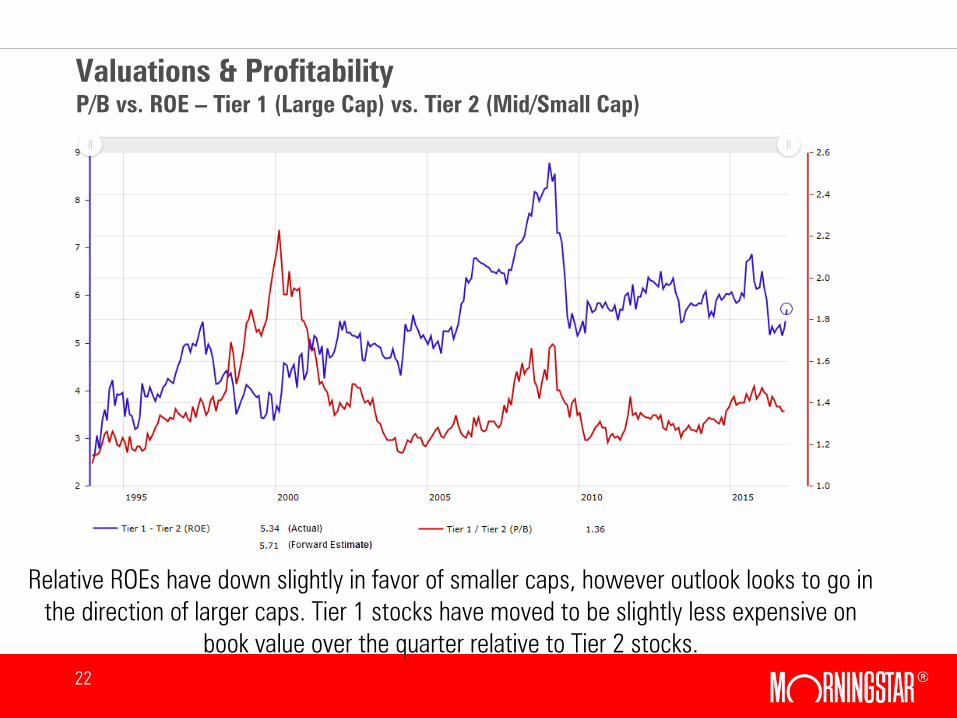
Valuations & Profitability
P/B vs. ROE – Tier 1 (Large Cap) vs. Tier 2 (Mid/Small Cap)
Relative ROEs have down slightly in favor of smaller caps, however outlook looks to go in
the direction of larger caps. Tier 1 stocks have moved to be slightly less expensive on
book value over the quarter relative to Tier 2 stocks.

23
Earnings
Year-over-year earnings growth (Median & Average - CPMS Universe)
Earnings growth has increased over the quarter.

24
Earnings
Year-over-year earnings growth of the S&P 500
Year over year Index earnings saw a slight decrease over the quarter.

25
Estimate Revisions & Earnings Surprise
Earnings surprise and average estimate revision have improved by a slight margin
from the previous quarter. Estimate revisions are still in negative territory.

26
GICS Sectors: 2016 Q3 Overview
Sector Current
P/B
Expected
ROE
Expected
EPS Growth
Earnings
Surprise
Estimate
Revisions
10 Energy 1.6x 0.7% -42.7% 3.8% 1.4%
15 Materials 2.6x 16.4% 7.5% 2.6% -0.3%
20 Industrials 2.9x 16.1% 2.3% 1.4% -2.8%
25 Consumer Discretionary 2.9x 18.5% 4.1% 1.8% -2.8%
30 Consumer Staples 4.6x 20.4% 2.4% 0.9% -0.2%
35 Health Care 4.1x 14.7% 6.6% 1.0% -2.8%
40 Financials 1.3x 9.9% 5.0% 0.8% -1.1%
45 Information Technology 3.2x 13.8% 8.1% 2.3% -1.6%
50 Telecommunications 1.6x 7.1% -19.0% 2.5% -2.8%
55 Utilities 2.0x 10.6% 6.5%% -1.5% 0.0%
Most sectors show positive expected EPS growth with the exceptions being Energy and
Telecom. Sector revisions at the end of Q3 are all negative.

27
OTHER CONSIDERATIONS

28
The Asset Mix Decision
Equity dividend yields continue to offer a suitable alternative to bonds.
The S&P 500 yield remains slightly above 2%.

29
Economic Snapshot
Unemployment and capacity utilization have moved higher. The inflation rate is relatively
flat from last quarter.

30
Technical Analysis
Short-term indicators have moved downward while long-term indicators have moved up from the
prior quarter. The S&P 500 looks to be overbought.

31
Technical Analysis
The S&P 500 remains above the 200 day MA and in line with the 50 day MA.

32
Fundamental Summary
FUNDAMENTALS:
Valuations:
Slightly more expensive relative to the prior quarter. Larger caps seem to be favored
over smaller caps.
Profitability:
Expected ROE numbers strongest for Staples, weakest for Energy.
Earnings Growth:
Earnings growth expectations are positive quarter over quarter in most sectors with
the exception being Energy and Telecomm. Estimates being revised downwards for
all sectors.
ASSET MIX DECISION: Low bond yields remain in support of equities.
TECHNICAL ANALYSIS: Technicals indicate the market is overbought.
ECONOMICS ANALYSIS: Unemployment has increased. Inflation is muted. Capacity Utilization
moved slightly higher.