
Covid-19 PPE demand & supply perspectives
34
This programme is funded by UK aid from the UK Government; however, the views expressed do not necessarily reflect the UK government’s official policies Covid-19 – PPE demand & supply perspectives Webinar presentation March 2021 Based on report written in December 2020
Transcript of Covid-19 PPE demand & supply perspectives

This programme is funded by UK aid from the UK Government; however, the views
expressed do not necessarily reflect the UK government’s official policies
Covid-19 – PPE demand & supply
perspectives
Webinar presentation
March 2021Based on report written in December 2020

Contents
Project objectives and scope
I. Impact of Covid-19 on global PPE supply
II. Modelling of global PPE demand for 2020-25
III. Emerging perspectives on PPE market
dynamics in the short to medium term
3
This report has 2 main objectives
Estimate global
demand for PPE for
2021-2025 by
geography, product
and type of end-
consumption
Clarify recent and
possible future global
supply dynamics and
their implications for
manufacturers
Key
objectives

4
This report looks at 3 types of products: medical PPE, non-medical PPE
and disinfectant/waste management products
Gowns
Aprons
Coveralls
Gloves
Cloth masks
Medical masks
(respirators and
surgical masks)
Eye protection
(face shield,
goggles)
Body bags
Cleaning
equipment
(chlorine, alcohol
hand sanitizers)
Clinical waste
bags
Shoe covers
Medical PPE
Non-medical PPE
Disinfectant products/
biological waste
management
This report looks only at medical PPE used in (i) medical settings for « business as usual » activities and Covid-19-related
activities and (ii) in other industry settings for usage related to Covid-19-induced sanitary measures.
PPE demand coming from « business as usual » of certain industries (e.g., construction, restauration) is not within the scope of
this report.

Contents
Project objectives and scope
I. Impact of Covid-19 on global PPE supply
II. Modelling of global PPE demand for 2020-25
III. Emerging perspectives on PPE market
dynamics in the short to medium term

6
I. Impact of Covid-19 on global PPE supply
In 2019 the medical PPE market amounted to ~$8bn. It was consolidated
and led by the US and Asia.

7
Before the crisis, the global PPE market accounted for ~$8bn and was
led by North America and Asia
Medical PPE market share by region, 2019, % Key messages
28%
33% 22%
11%
6%
Asia and the Pacific
North America Europe
Latin America
Middle East and
Africa
Total revenues = ~$8bnIn 2019 the medical PPE market
was estimated to amount to
~$8bn, in turn accounting for 15%
of total PPE1 market size
In 2019, the countries with the
highest production were China,
US and Germany, each with
different export dynamics: while
China was the biggest exporter
worldwide, the US exported
mainly across North and Latin
America and Germany served
almost exclusively European
countries
Source: Mordor Intelligence (updated in November 2020), Asian Development Bank
1. The PPE market has several sub-industries, including healthcare, construction, chemicals, and industry
INTENDED TO PROVIDE INSIGHT BASED ON CURRENTLY AVAILABLE INFORMATION FOR CONSIDERATION AND NOT SPECIFIC ADVICE
MARKET ESTIMATES – ONLY MEDICAL PPE CONSIDERED

8
China and the US make the majority of every category except for gloves,
which are mostly manufactured in Malaysia and Thailand
Medical PPE market share by type of PPE, 2019, % of total market
44%
23%
15%
9%
9%
Gloves
(50% latex-
50% nitrile)
Masks2
Coveralls
ApronsOther
(eye protection and shoe covers)
Source: Mordor Intelligence (updated in November 2020), Statista Research Department, Industry experts interviews (November 2020), Malaysian Rubber Glove
Manufacturers Association (MARGMA)
1. Figures by the Malaysian Rubber Glove Manufacturers Association (MARGMA)
2. In 2019, respirators accounted for ~60% of the medical masks market and surgical masks accounted for ~40%, according to interviews with industry experts
Top producing countries
China (40%)
US (20%)
India (10%)
South Korea (5%)
Top producing countries1
• Malaysia (~65%)
• Thailand (~20%)
• China (~10%)
• Indonesia (~5%)
Top producing countries
China (50-60%)
US (20-25%)
Top producing countries
(eye protection)
China (40-50%)
US (20%)
Top producing countries
(shoe covers)
China (30-40%)
US (20-25%)
India, Germany, UK,
Australia (5-10% each)
Top producing countries
China (40%)
US (20%)
Australia (10%)
INTENDED TO PROVIDE INSIGHT BASED ON CURRENTLY AVAILABLE INFORMATION FOR CONSIDERATION AND NOT SPECIFIC ADVICE
MARKET ESTIMATES – ONLY MEDICAL PPE CONSIDERED

9
I. Impact of Covid-19 on global PPE supply
Industry experts suggest that, as a consequence of the Covid-19
pandemic, global production of medical PPE increased by at least 300% at
the peak, principally driven by demand for masks.
This ramp-up started at the end of Q1/beginning of Q2 to compensate for
a then global shortage and to satisfy forward-looking surge orders from
governments and private entities.

10
Covid-19 triggered a surge in global PPE production: medical mask
manufacturing spiked by as much as 1,200%
GogglesFace shield
100-200%
Medical
masks
25-50%
Medical
gloves
Gowns Shoe covers Aprons Coveralls Alcohol-
based
hand rub
Body bags Clinical
waste bags
Chlorine
HTH 70%
Non-medical
masks-
500-1,200%
200-600%
25-50%
50-100% 50-100% 50-100% 50-100%
25-50%
200-600%
50-100%
Estimated peak increases in global production during the Covid-19 crisis, %
Source: Industry experts interviews (November 2020), press search
Medical PPE Non-medical PPEDisinfectant/waste mgmt.
Newly1
created
product
during
Covid-19
pandemic
1. Production pre-Covid-19 was negligible compared to current production
INTENDED TO PROVIDE INSIGHT BASED ON CURRENTLY AVAILABLE INFORMATION FOR CONSIDERATION AND NOT SPECIFIC ADVICE
NON-EXHAUSTIVE – DIRECTIONAL ESTIMATES BASED ON INTERVIEWS WITH INDUSTRY PLAYERS, AS OF MID-DECEMBER 2020

11
Around half of this increased production was delivered by incumbents
and the other half came from new market entrants
50-60%
40-50%
Source: Industry experts interviews (November 2020), press search
Incumbents
New players
Share of new production capacity added
during Covid-19 pandemic, estimates Examples (non-exhaustive)
▪ 3M increased its PPE production by 3x
▪ DuPont doubled its production of
gowns
▪ Top Glove increased its production by
~20%
2 types of new players: companies in
adjacent industries converting production
capacities and new local players
▪ National Safety Apparel started
producing 1.5m face masks a week
▪ Several textile companies in Italy and
North Africa shifted part of their
production to manufacture masks
▪ Haco and East African Breweries, in
Kenya, partnered to produce hand
sanitizers
Before Covid-19, 90% of medical PPE was
targeted at health system customers. Currently
sales are running at closer to 50% to medical
customers and 50% to non-medical customers
– former Life Safety Product Manager at
leading PPE manufacturer
Most incumbents consider their capacity
addition to be temporary as most have either
increased utilization or deployed idle
machine/production lines
New players have invested in machinery and
equipment but only been able to generate
acceptable returns on investment because of
surges in market price
A significant part of this production surge has
come from targeting new customer segments
beyond health systems (e.g., consumers,
workers in non-healthcare settings)
Main insights from interviews
INTENDED TO PROVIDE INSIGHT BASED ON CURRENTLY AVAILABLE INFORMATION FOR CONSIDERATION AND NOT SPECIFIC ADVICE
NON-EXHAUSTIVE AND ILLUSTRATIVE – ESTIMATES BASED ON INTERVIEWS WITH INDUSTRY PLAYERS, AS OF MID-DECEMBER 2020

12
I. Impact of Covid-19 on global PPE supply
This increase in output put the entire PPE manufacturing value chain
under significant pressure.

13
Increasing manufacturing capacity has put the PPE supply chain under
pressure, especially with regard to raw materialsHigh supply
pressure
Focus of next pages Medium supply
pressure
Low supply
pressure
Mapping of bottlenecks along the PPE value chain
• Trade restrictions forced a couple of countries to stop exporting PPE, putting pressure on importers who were compelled to build local capacity
• Disruptions of transport and logistics have made delivery of PPE to final customers more complicated and resulted in delays even at domestic level
Shortage
of melt-
blown
non-
woven
Respirators
Shortage
of melt-
blown
non-
woven
Surgical
masks
Pressure
on labour
n.a.
Aprons
Pressure
on labour
Pressure
on non-
woven
and
composite
fabric
Disposable
gowns
Pressure
on labour
Coveralls
Pressure
on non-
woven
and
composite
fabric
Pressure
on labour
Goggles
n.a.
n.a.
Face
shield
n.a.
n.a.
Medical
gloves
Pressure
on nitrile
Machinery
lead time
of 1 year
Body bags
Pressure
on PU,
PVC,
HDPE
Pressure
on labour
Chlorine
HTH 70%
n.a.
n.a.
Alcohol-
based
hand rub
Shortage
of alcohol
Pressure
on labour
Clinical
waste
bags
n.a.
n.a.Pressure
on labour
Shoe
covers
Pressure
on non-
woven
and
composite
fabric
Pressure
on labour
Raw materials
sourcing
Manufac-
turing1
Distribution
Source: Industry experts interviews (November 2020), Asian Development Bank
1. High pressure on manufacturing usually comes from technology solutions with machines manufactured by very few players over long lead times
Most pressure Least pressure
Value chain
Cloth
masks
n.a.
n.a.
INTENDED TO PROVIDE INSIGHT BASED ON CURRENTLY AVAILABLE INFORMATION FOR CONSIDERATION AND NOT SPECIFIC ADVICE
NON-EXHAUSTIVE – BASED ON INTERVIEWS WITH INDUSTRY PLAYERS, AS OF MID-DECEMBER 2020

Contents
Project objectives and scope
I. Impact of Covid-19 on global PPE supply
II. Modelling of global PPE demand for 2020-25
III. Emerging perspectives on PPE market
dynamics in the short to medium term

15
II. 2020-25 global PPE demand forecast
Global volume demand for PPE increased by 300-400% between 2019 and
20201, driven by increased consumption by the general public and in non-
healthcare work settings.
This peak demand is expected to continue throughout 2021 but is likely to
decrease sharply in 2022 as consumption from both these groups is
expected to shrink.
Demand will then return to its pre-crisis mix and keep rising at a CAGR of
6-9% between 2022 and 2025, underpinned by some lagging effect of
Covid-19 as well as natural healthcare sector growth.

16
Consumers and non-healthcare workers will drive global PPE demand to
peak in 2021 at 340-420bn units before it resumes its historic growth rate
Total estimated1 volume PPE demand, 2018-25, units, bn2
Source: Mordor Intelligence (updated in November 2020), EPI model, WHO assumptions
~105
320-405
340-420
160-190165-195
175-215
70-120
19
~10
7-12
2018
80-130
22
23-25
120-145
~20
~110
20
135-160
~5
21
10-20
125-140
23-27
135-155
23
145-175
185-235
7-12
23-28
24
155-193
7-12
23-28
2025
2-6
120-130~95
+10% p.a.
+6-9% p.a.
E. ConsumersC. VaccinationA. Non-COVID-19
B. Hospital days D. Non-healthcare workers
1.Range reflects 2 scenarios (“high” vs. “low”): (i) non-Covid-19 baseline demand based on 2 growth scenarios (historic growth -2% to account for critical size of
the market vs. historic growth +1% to account for potential changes in usage habits), (ii) hospital days and vaccination demands depend on vaccination scenario
(“pessimistic” vs. “optimistic”), and (iii) workers in non-healthcare settings and consumer demand depend on adoption rate assumptions (“high” vs. “low”)
2.Unit is per item or per pair in case of gloves, hand sanitizer is per litre and chlorine is per kg
3.Surgical masks adoption rate is assumed to be 10% for consumers in Sub-Saharan Africa while 80% represents the adoption rate for workers in non-
healthcare settings in China and North America
INTENDED TO PROVIDE INSIGHT BASED ON CURRENTLY AVAILABLE INFORMATION FOR CONSIDERATION AND NOT SPECIFIC ADVICE
ESTIMATES – AS OF 16 DECEMBER 2020
17
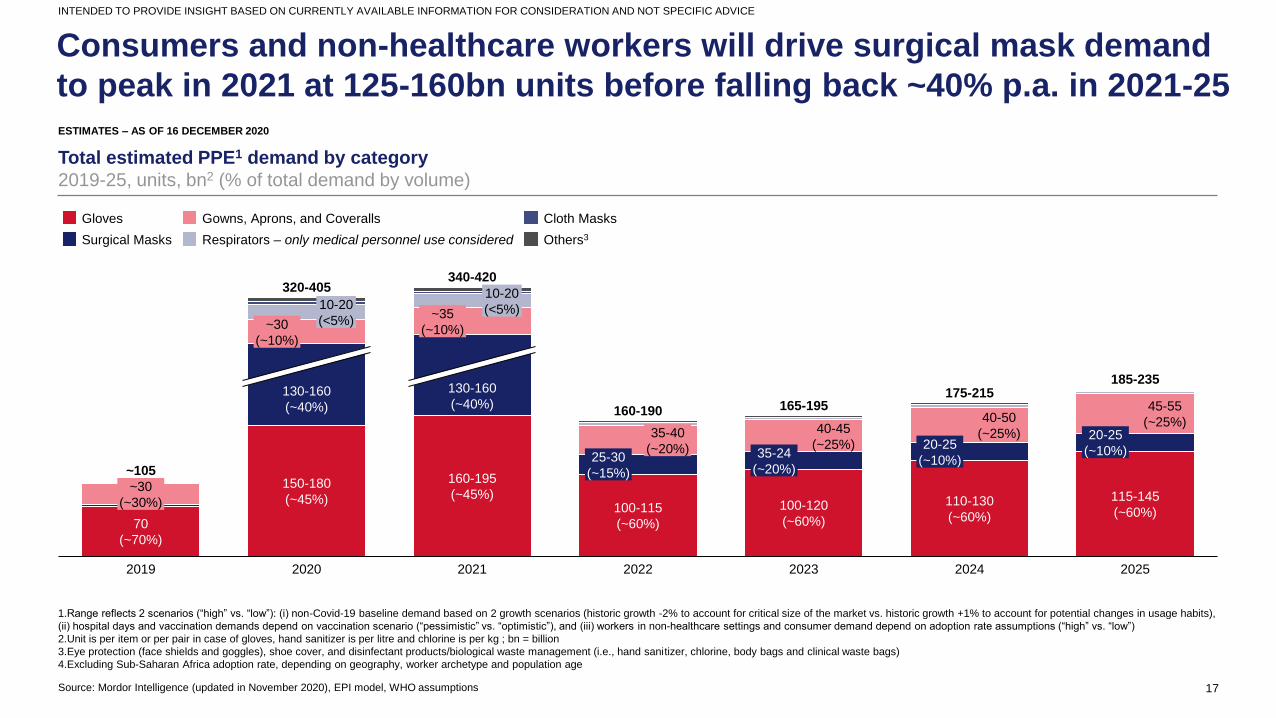
Consumers and non-healthcare workers will drive surgical mask demand
to peak in 2021 at 125-160bn units before falling back ~40% p.a. in 2021-25
Source: Mordor Intelligence (updated in November 2020), EPI model, WHO assumptions
Total estimated PPE1 demand by category
2019-25, units, bn2 (% of total demand by volume)
1.Range reflects 2 scenarios (“high” vs. “low”): (i) non-Covid-19 baseline demand based on 2 growth scenarios (historic growth -2% to account for critical size of the market vs. historic growth +1% to account for potential changes in usage habits),
(ii) hospital days and vaccination demands depend on vaccination scenario (“pessimistic” vs. “optimistic”), and (iii) workers in non-healthcare settings and consumer demand depend on adoption rate assumptions (“high” vs. “low”)
2.Unit is per item or per pair in case of gloves, hand sanitizer is per litre and chlorine is per kg ; bn = billion
3.Eye protection (face shields and goggles), shoe cover, and disinfectant products/biological waste management (i.e., hand sanitizer, chlorine, body bags and clinical waste bags)
4.Excluding Sub-Saharan Africa adoption rate, depending on geography, worker archetype and population age
INTENDED TO PROVIDE INSIGHT BASED ON CURRENTLY AVAILABLE INFORMATION FOR CONSIDERATION AND NOT SPECIFIC ADVICE
2019
25-30
(~15%)
10-20
(<5%)~30
(~10%)
~105
130-160
(~40%)
150-180
(~45%)
2020
10-20
(<5%)~35
(~10%)
130-160
(~40%)
160-195
(~45%)
2021
35-40
(~20%)
100-115
(~60%)
185-235
110-130
(~60%)
2022
40-45
(~25%)
100-120
(~60%)
2023
175-215
40-50
(~25%)20-25
(~10%)
2024
115-145
(~60%)
20-25
(~10%)
2025
320-405340-420
45-55
(~25%)
165-195
~30
(~30%)
70
(~70%)
35-24
(~20%)
160-190
Gloves
Respirators – only medical personnel use consideredSurgical Masks
Gowns, Aprons, and Coveralls Cloth Masks
Others3
ESTIMATES – AS OF 16 DECEMBER 2020
18
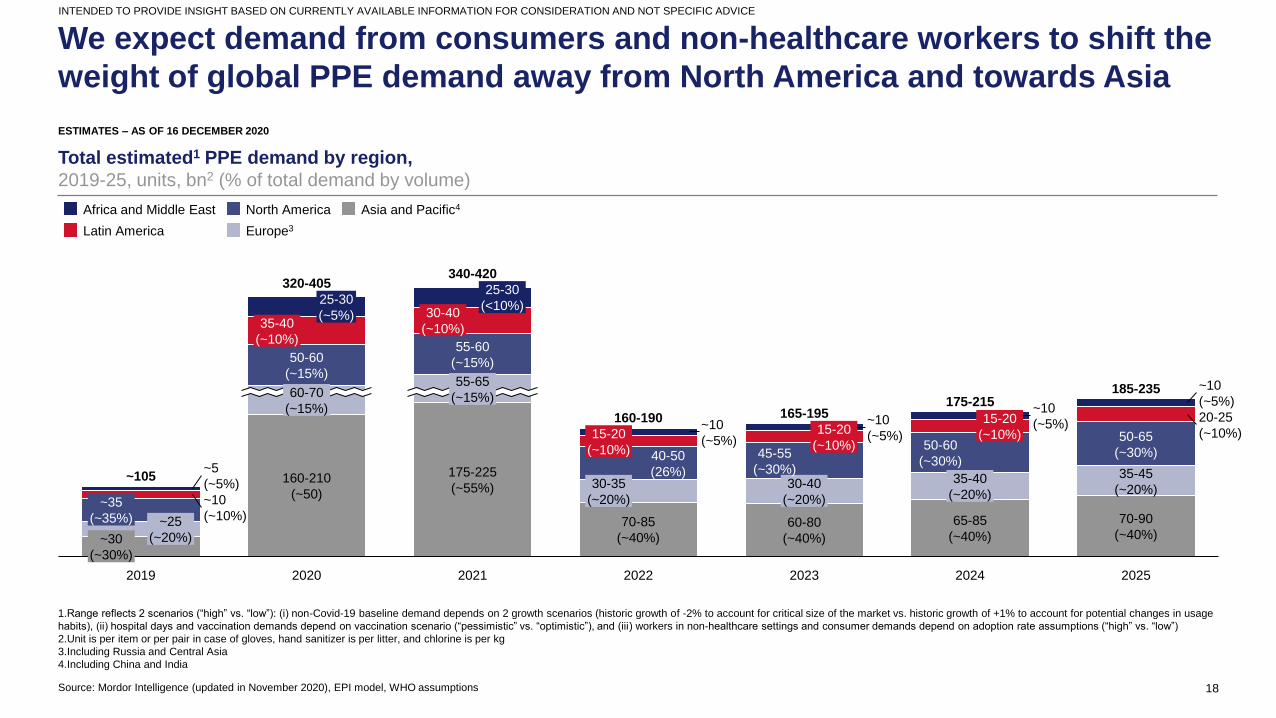
We expect demand from consumers and non-healthcare workers to shift the
weight of global PPE demand away from North America and towards Asia
Total estimated1 PPE demand by region,
2019-25, units, bn2 (% of total demand by volume)
28%
Source: Mordor Intelligence (updated in November 2020), EPI model, WHO assumptions
1.Range reflects 2 scenarios (“high” vs. “low”): (i) non-Covid-19 baseline demand depends on 2 growth scenarios (historic growth of -2% to account for critical size of the market vs. historic growth of +1% to account for potential changes in usage
habits), (ii) hospital days and vaccination demands depend on vaccination scenario (“pessimistic” vs. “optimistic”), and (iii) workers in non-healthcare settings and consumer demands depend on adoption rate assumptions (“high” vs. “low”)
2.Unit is per item or per pair in case of gloves, hand sanitizer is per litter, and chlorine is per kg
3.Including Russia and Central Asia
4.Including China and India
INTENDED TO PROVIDE INSIGHT BASED ON CURRENTLY AVAILABLE INFORMATION FOR CONSIDERATION AND NOT SPECIFIC ADVICE
~10
(~10%)
50-65
(~30%)
20-25
(~10%)
~35
(~35%) ~25
(~20%)
~10
(~5%)
25-30
(<10%)25-30
(~5%)
175-215
35-40
(~10%)
65-85
(~40%)
50-60
(~15%)
~10
(~5%)
70-85
(~40%)
60-70
(~15%)
55-60
(~15%)
160-210
(~50)
2020
35-45
(~20%)
175-225
(~55%)
30-40
(~10%)
2021
15-20
(~10%) 40-50
(26%)30-35
(~20%)
2022
~10
(~5%)
70-90
(~40%)
15-20
(~10%)
185-235
30-40
(~20%)
60-80
(~40%)
2023
~5
(~5%)
45-55
(~30%)
15-20
(~10%)
35-40
(~20%)
2024
~10
(~5%)
2025
~105
50-60
(~30%)
160-190
340-420
165-195
~30
(~30%)
55-65
(~15%)
2019
320-405
Africa and Middle East North America
Europe3Latin America
Asia and Pacific4
ESTIMATES – AS OF 16 DECEMBER 2020

19
II. 2020-25 global PPE demand forecast – Update from March 2021
There is still some significant uncertainty as to the magnitude of the peak
in 2021 as we witness a fast-evolving health situation (e.g., new variants)
and developing scientific advice, leading to changes in public health and
government policies as well as individual behaviors (i.e., mask wearing
requirements and habits)

20
2 new scenarios for mask adoption, driven by
both regulations and sentiments
INTENDED TO PROVIDE INSIGHT BASED ON CURRENTLY AVAILABLE INFORMATION FOR CONSIDERATION AND NOT SPECIFIC ADVICE
Source: EPI model, WHO, YouGov, interviews with public health experts (November-December 2020), survey of working professionals (held in the US in
May 28-June 3, 2020; n=100)
Point at which vaccination starts
Vaccination ramp-up New normalCurrent situation
Mar. Jun.Dec. Dec
.
Mar. Jun. Sep
.2120 22 2523
Hospitalisation rate is close to 0 but some additional PPE
demand persists due to new consumption habits – this
new normal will last from Q1 2023 to Q4 2025
Vaccines arrive. Rising uncertainty
regarding vaccine efficacy persaudes
governments to maintain regulations
regarding mask use in public places,
contrary to initial projections made in
December 2020.
High adoption
and use rates
due to coercive
measures
Scenario 1
• Official guidelines continue to require wearing
masks in public places, in part due to
uncertainty about incidence and transmission
of variants
• As remaining at-risk populations are
vaccinated, governments slowly lift regulations
regarding masks wearing in public space
• Mask adoption declines as the vaccination
continues, gradually reaching a "new normal"
near the pre-COVID adoption rate
Scenario 2
• Official guidelines continue to require wearing
masks in public places until herd immunity is
achieved
• Long-term adoption rate remains higher than
pre-COVID crisis levels due to e.g. personal
preferences
It is important to note that there is still a high level of
uncertainty regarding the crisis future evolutions;
therefore these might be more possible scenarios
than these 2 ones.
Scenario 2 – March 2021 modelling
Scenario 1 – March 2021 modelling
Scenario 0 – December 2020 modelling
Mask adoption rate among general public, 2020-2025, US example (illustrative)
Note: in this example, the moment at which the adoption rate starts to decline is specific to the US context; in
other geographies, it may occur later, depending on the progress of national vaccination campaigns.

21
With revised adoption rates, global PPE demand could peak in 2021 at
510-595bn units before falling back to 195-235bn units in 2022-23
Total estimated1 volume PPE demand, 2018-25, units, bn2
Source: Mordor Intelligence (updated in November 2020), EPI model, WHO assumptions
~190
~5
235-275
22 2025
~195
~85
20 232018
~40
195-235
~90
~215
19
~40
~40~40
~420
~230
24
~95
21
510-595
195-235
~105
215-255
~405
+10% p.a.
+6-9% p.a.
1.For readability reasons, only the “high” scenario is presented
2.Unit is per item or per pair in case of gloves, hand sanitizer is per litre and chlorine is per kg
3.Surgical masks adoption rate is assumed to be 10% for consumers in Sub-Saharan Africa while 80% represents the adoption rate for workers in non-
healthcare settings in China and North America
INTENDED TO PROVIDE INSIGHT BASED ON CURRENTLY AVAILABLE INFORMATION FOR CONSIDERATION AND NOT SPECIFIC ADVICE
Scenario 0 (December 2020)
Surplus from increased adoption rate – Scenario 1 (March 2021)
Surplus from increased adoption rate – Scenario 2 (March 2021)
ESTIMATES – NEW ADOPTION RATES AS OF MARCH 2021

Contents
Project objectives and scope
I. Impact of Covid-19 on global PPE supply
II. Modelling of global PPE demand for 2020-25
III. Emerging perspectives on PPE market
dynamics in the short to medium term

23
III. Emerging perspectives on short/medium term market dynamics
Market entry is less attractive than it was in 2020, with prices decreasing
and global supply meeting demand for most PPE

24
Despite supply bottlenecks at the start of the crisis, several countries
have now built stockpiles and are showing early signs of oversupply
We will find ourselves in an oversupply
market once the pandemic is over.
Australia alone can now supply all of
Europe’s pre-Covid-19 needs
– PPE industry expert, November 2020
The UK is already facing an oversupply
situation on surgical masks
– Procurement Director at a
government agency, November 2020
Mask oversupply has succeeded the lack of supply in the
French textile industry. […] Some companies have
actually had to lay off employees because of oversupply
– Press article (France Info), July 2020
“Stocks of masks manufactured in France are largely
sufficient to meet local demand […] In the Auvergne-
Rhône-Alpes region alone, we have a stock of 3 million
masks and enough fabric to manufacture an additional
19 million”
– Regional general delegate (Pierric Chalvin), July
2020
Before the crisis, France was producing 3 million masks
a week [...] In June, 25 million masks were produced
each week in France [...] 40 million masks did not find
takers. […] it is estimated that 10% of the companies
involved in this production have stocks on their hands
– Press article (France Culture), June 2020
Since the second wave in Europe, there
has been a slight increase in orders, but
without comparison with last March and
April. Countries have built up stocks and
are now relying on them
– PPE industry expert, November 2020
NON-EXHAUSTIVE AND ILLUSTRATIVE – AS OF NOVEMBER 2020
Source: press search, interviews with industry experts (November-December 2020)
“The government is now in a position where it has
sufficient contracted supplies to meet demand,
and the total volume of offers it has is far greater
than any foreseeable future requirement
It is therefore no longer accepting offers for PPE.
It has also closed down all existing offers
submitted that are surplus to requirements”
– Contractsfinder.service.gov.uk
Volume and value of PPE ordered in the UK has
started to ramp down from June, given stock
supply
– National Audit Office analysis of Department
of Health & Social Care information
Interviews with industry experts
suggest a potential oversupply riskBoth France and the UK have accumulated large stocks of PPE
25
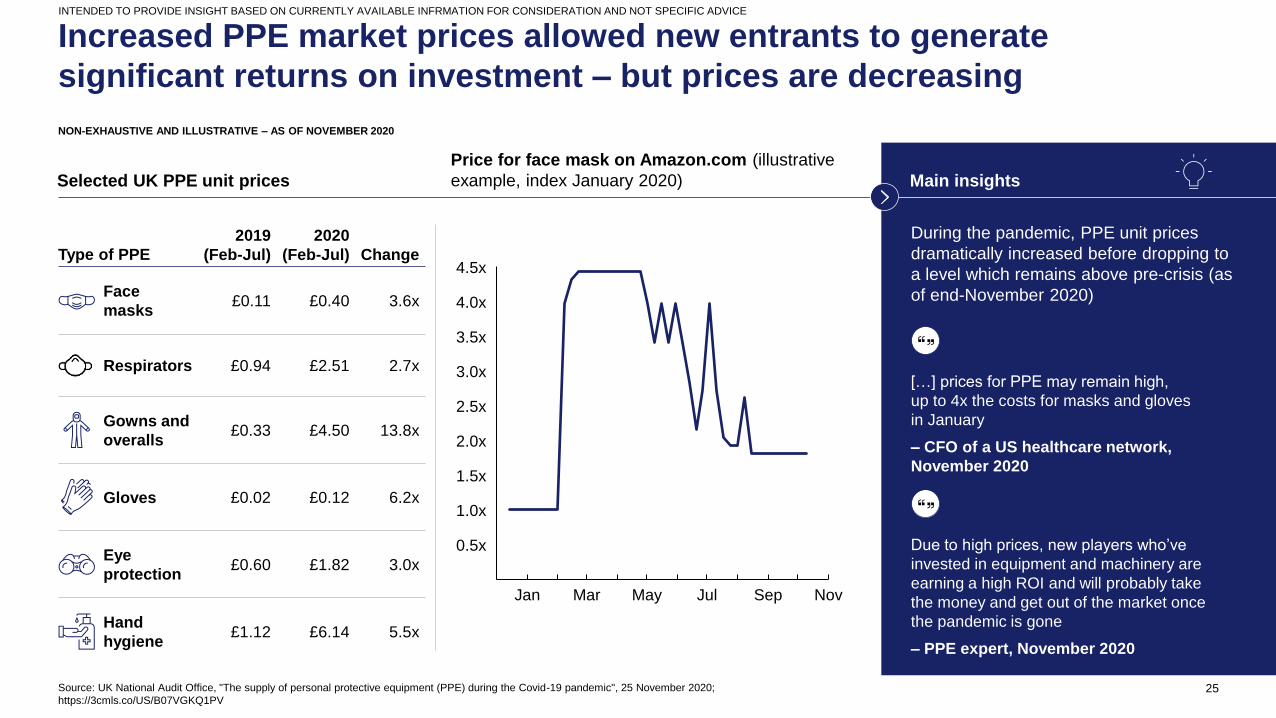
Increased PPE market prices allowed new entrants to generate
significant returns on investment – but prices are decreasing
Source: UK National Audit Office, "The supply of personal protective equipment (PPE) during the Covid-19 pandemic", 25 November 2020;
https://3cmls.co/US/B07VGKQ1PV
Selected UK PPE unit prices
Mar
0.5x
Jan
2.5x
May NovJul
3.5x
Sep
1.0x
1.5x
2.0x
3.0x
4.0x
4.5x
Price for face mask on Amazon.com (illustrative
example, index January 2020)
2019
(Feb-Jul)
2020
(Feb-Jul) ChangeType of PPE
£0.11 £0.40 3.6xFace
masks
£0.02 £0.12 6.2xGloves
£0.60 £1.82 3.0xEye
protection
£1.12 £6.14 5.5xHand
hygiene
£0.33 £4.50 13.8xGowns and
overalls
£0.94 £2.51 2.7xRespirators
Due to high prices, new players who’ve
invested in equipment and machinery are
earning a high ROI and will probably take
the money and get out of the market once
the pandemic is gone
– PPE expert, November 2020
[…] prices for PPE may remain high,
up to 4x the costs for masks and gloves
in January
– CFO of a US healthcare network,
November 2020
Main insights
During the pandemic, PPE unit prices
dramatically increased before dropping to
a level which remains above pre-crisis (as
of end-November 2020)
INTENDED TO PROVIDE INSIGHT BASED ON CURRENTLY AVAILABLE INFRMATION FOR CONSIDERATION AND NOT SPECIFIC ADVICE
NON-EXHAUSTIVE AND ILLUSTRATIVE – AS OF NOVEMBER 2020

26
III. Emerging perspectives on short/medium term market dynamics
The outlook for the market nevertheless remains positive over the longer
term

27
Although the 2020 demand peak triggered by Covid-19 might reduce after
2021, the outlook for the market remains positive over the longer term
Key messages
Source: Mordor Intelligence (updated in November 2020)
In the short-term, although demand peak is to
persist through 2021, market entry appears
less attractive than it was in 2020, with prices
decreasing and global supply meeting
demand for most PPE
In the medium / long-term, despite the
reduction of the Covid-19-induced peak after
2021, the outlook for the market remains
positive over the longer term, with a 6-9%
annual growth in 2023-2025
• Incumbents might continue to capture the
lion’s share of this growth as they are already
cost-competitive, have been able to ramp up
their production capacity during the crisis and
already meet quality requirements
• New entrants may be able to capture a
degree of this growth, provided that they can
be cost-competitive, manage to meet quality
standards, and receive government support
(especially in guaranteeing offtake)
Global estimated1 PPE demand by volume, 2018-25, units, bn2
320-405
~105
175-215
~95
340-420
160-190 165-195
185-235
2018 2319 20 21 22 24 2025
+10% p.a.
+6-9% p.a.
1.Range reflects 2 scenarios (“high” vs. “low”): (i) non-Covid-19 baseline demand depends on 2 growth scenarios (historic growth of -2% to account for critical
size of the market vs. historic growth of +1% to account for potential changes in usage habits), (ii) hospital days and vaccination demands depend on vaccination
scenario (“pessimistic” vs. “optimistic”), and (iii) non-healthcare worker and consumer demands depend on adoption rate assumptions (“high” vs. “low”)
2.Unit is per item or per pair in case of gloves, hand sanitizer is per litre, and chlorine is per kg
ESTIMATES – ONLY MEDICAL PPE CONSIDERED – AS OF MID-DECEMBER 2020

28
The progressive lifting of export restrictions imposed in March has eased
supply pressure and rebalanced global supply and demand
PPE export restrictions worldwide as of November 2020
In April 2020, the US banned
exports for 5 categories of
PPE (including respirators,
gloves and masks)
In August, the export ban
was renewed until December
2020
Countries with active
export restrictions
In April 2020, the UK decided to
introduce a specific license to
allow exports of PPE beyond the
EU and EFTA member states
In April 2020, China banned
medical supplies exports
from firms not licensed to sell
them nationally.
At the end of April, a new set
of regulations was introduced
which made manufacturers
subject to export
authorisations
Source: International Trade Center website (access in November 2020)
Countries with export
restrictions which have
been terminated
INTENDED TO PROVIDE INSIGHT BASED ON CURRENTLY AVAILABLE INFORMATION FOR CONSIDERATION AND NOT SPECIFIC ADVICE
NON-EXHAUSTIVE AND ILLUSTRATIVE – AS OF NOVEMBER 30, 2020

29
III. Emerging perspectives on short/medium term market dynamics
In light of these dynamics, incumbents and new PPE manufacturers alike
may wish to consider four strategic moves for the future – investment for
the long term, distribution, diversification and innovation

30
PPE manufacturers can try to lock in short- and medium-term demand in
those geographies where they are cost-competitive by systematic
exploration of multiple channels – Europe example
Source: Interviews with industry experts (November-December 2020)
INTENDED TO PROVIDE INSIGHT BASED ON CURRENTLY AVAILABLE INFORMATION FOR CONSIDERATION AND NOT SPECIFIC ADVICE
Public healthcare
provision and rest of
government
Demand
Private healthcare
provision
Typical channels
International organizations'
procurement arms
Direct tendering from public sector
Regional online tendering platform
Distributors and/or GPOs supplying to
public sector
Direct tendering from private sector
Distributors and/or GPOs supplying to
private sector
Examples of organizations involved Level of opportunity1
Limited High
1. Qualitative assessment based on expert interviews - current as Nov-Dec 2020
n/a to European countries overall
Launch of pan-European med product
procurement platform, few tenders
open from local authorities and
various public entities (e.g., schools)
Some opportunities flagged by private
hospitals in UK on specific niche
products (gloves, gowns) when NHS
undersupplying; probably low volume
NON EXHAUSTIVE AND ILLUSTRATIVE
Distributors and GPOs reported to be
looking to enlarge their supplier list
with cost-competitive options closer
than Far East
n/a
Distributors GPOs
Distributors GPOs
Few tenders open from local
authorities and various public entities
(e.g., schools) on national platforms,,
sometimes directly accessible to
manufacturers (vs. distributors/GPOs)
Distributors and GPOs reported to be
looking to enlarge their supplier list
with cost-competitive options closer
than Far East

31
PPE manufacturers can try to lock in short- and medium-term demand in
those geographies where they are cost-competitive by systematic
exploration of multiple channels – Africa example
Source: Interviews with industry experts (November-December 2020)
INTENDED TO PROVIDE INSIGHT BASED ON CURRENTLY AVAILABLE INFORMATION FOR CONSIDERATION AND NOT SPECIFIC ADVICE
Public healthcare
provision and rest of
government
Demand
Private healthcare
provision
Typical channels
International organizations'
procurement arms
Direct tendering from public sector
Regional online tendering platform
Distributors and/or GPOs supplying to
public sector
Direct tendering from private sector
Distributors and/or GPOs supplying to
private sector
Examples of organizations involved
Ministries of Health of several African countries
Central pharmacies and public procurement authorities
(public GPOs) from several African countries
Level of opportunity1
Limited High
1. Qualitative assessment based on expert interviews - current as Nov-Dec 2020
UNICEF stating open to enriching its
supplier catalogue in 2021 directly
with manufacturers
African Medical Supply Platform
(AMSP) launched in 2021 to pool
volume from public sector across
continent
Several central state reported to be
overall over-stocked with PPE at end
of 2021 (e.g., French-speaking
Africa); some exception also reported
(e.g., Ethiopia)
Inconsistencies in distributors
reporting willingness to enlarge PPE
supplier list
Expected lower volume
NON EXHAUSTIVE AND ILLUSTRATIVE

32
New businesses could target 3 potential diversification opportunities
along the PPE value chain
Opportunities
Market opportunity: high-level and
directional assessment
Barriers to entry (non-exhaustive; see further details next
pages)
Source: industry expert interviews (December 2020)
Market size 2019,
Estimates, $m
x% x%Historic CAGR
2017-19
Forecast CAGR
2020-25
NON-EXHAUSTIVE – FROM EXPERT INTERVIEWS, AS OF MID-DECEMBER 2020
1. Global market size in volume is estimated at 200m gallons in 2019 and average price is estimated at $2.50/gallon
Level of opportunity
Limited SignificantTHOROUGH BUSINESS PLANNING REQUIRED TO ASSESS FURTHER THE 3 OPPORTUNITIES
INTENDED TO PROVIDE INSIGHT BASED ON CURRENTLY AVAILABLE INFORMATION FOR CONSIDERATION AND NOT SPECIFIC ADVICE
Potential to play a “volume”
strategy and supply smaller
mask manufacturers
• Regulation
• Raw material and machinery shortage
• Consolidated market
• Importance of scale
i
ii
iii
Melt-blown
manufacturing
Gloves machinery
manufacturing
Alcohol
manufacturing (for
hand sanitizer)
• Technical knowledge and expertise
• Brand recognition needed
• Highly fragmented market concentrated in China for
semi-automated machines manufacturers
Manufacturing semi-automated
machines requiring less
technical knowledge and
expertise
Purchasing a low- quality
alcohol factory (e.g., for
gasoline end use) and
upgrading it to a high-quality
alcohol plant to supply hand
sanitizer manufacturers
~1,000
~800
~5001
9%
2%
4%• Importance of scale
• High capex required
• Brand recognition needed
• Proximity to feedstocks required
• Regulation
8%
10%
10%
X Focus next page

33
Focus on melt-blown market: potential opportunities for cost-advantaged new
entrants and large end-product producers looking to integrate vertically
Cost leader
Premium
manufacturer
Value chain
integrator1
For a brand
new player
For an
existing end-
product
manufacturer
Strategic positioning Description Key success factors Feasibility
Enter the melt-blown industry with
a high volume and low cost
strategy by using low cost raw
materials and low quality machinery
• Achieve economies of scale (would require producing
spunbond as well as melt-blown and targeting multiple
industries as customers)
• Locate near to raw material supply
• Locate in a low labour and utilities cost country
• Target small/medium and local players as customers
Enter the melt-blown industry with
a high margin strategy by using
high quality raw materials and
machinery
• Secure high quality raw materials and machinery (in
short supply during the Covid-19 crisis)
• Target large players as customers (would involve
inspections and quality control)
• Build solid brand and reputation (would require
several years)
Build in-house melt-blown
production capabilities for own use
(only makes sense for large end-
product manufacturers)
• Sufficient internal demand to break-even; it would be
hard for a small company to integrate upward due to
capital intensity and technical barriers
• Secure high quality machinery and raw materials for
premium products manufacturers/locate in low labour
costs country with proximity to raw materials for lower
quality products manufacture.
Source: interviews with industry experts (November-December 2020)
PROPOSITION - NON-EXHAUSTIVE
1. Some examples of hygiene end-product manufacturers with integrated melt-blown manufacturing: Cardinal Health, Kimberly-Clark, Halyard Health
THOROUGH BUSINESS PLANNING REQUIRED TO FURTHER ASSESS THE STRATEGIC POSITIONING
Feasibility
Low High
Type of player

34


