Cover Update PORR AG FY 2016 PORR AG Q3 2016 1H 2016 of ... · EUR m 1 Output of consortiums and...
32
Investor Presentation August 2016 1H 2016 of PORR AG PORR AG Q3 2016 NEW BUILDING Investor Presentation November 2016 PORR AG FY 2016 Intelligent Building... Investor Presentation April 2017 Cover Update
Transcript of Cover Update PORR AG FY 2016 PORR AG Q3 2016 1H 2016 of ... · EUR m 1 Output of consortiums and...
Investor Presentation
August 2016
1H 2016 of PORR AG
PORR AG Q3 2016 NEW BUILDING
Investor Presentation
November 2016
PORR AG FY 2016 Intelligent Building...
Investor Presentation
April 2017
Cover Update
Disclaimer • This presentation was prepared by PORR AG (the "Company") solely for use at investors’ meetings and is provided solely for
informational purposes.
• This presentation dates from May 2017. The facts and information contained herein might be subject to revision in the future.
Neither the delivery of this presentation nor any further discussions of the Company with any of the recipients shall, under any
circumstances, create any implication that there has been no change in the affairs of the Company since such date. None of
the Company or any of its parents or subsidiaries or any of such person's directors, officers, employees or advisors nor any other
person makes any representation or warranty, express or implied as to, and no reliance should be placed on, the accuracy or
completeness of the information contained in this presentation. None of the Company or any of its parents or subsidiaries or
any of their directors, officers, employees and advisors nor any other person shall have any liability whatsoever for any loss
howsoever arising, directly or indirectly, from any use of this presentation. The same applies to information contained in other
material made available at the meeting.
• This document is selective in nature and is intended to provide an introduction to, and overview of, the business of the
Company. Wherever external sources are quoted in this presentation, such external information or statistics should not be
interpreted as having been adopted or endorsed by the Company as being accurate.
• This presentation contains forward-looking statements relating to the business, financial performance and results of the
Company and/or the industry in which the Company operates. These statements generally are identified by words such as
"believes", "expects", "predicts", "intends", "projects", "plans", "estimates", "aims", "foresees", "anticipates", "targets", and
similar expressions. The forward-looking statements, including but not limited to assumptions, opinions and views of the
Company or information from third party sources, contained in this presentation are based on current plans, estimates,
assumptions and projections and involve uncertainties and risks. Various factors could cause actual future results, performance
or events to differ materially from those described in these statements. The Company does not represent or guarantee that the
assumptions underlying such forward-looking statements are free from errors nor do they accept any responsibility for the
future accuracy of the opinions expressed in this presentation. No obligation is assumed to update any forward-looking
statements.
• By accepting this presentation you acknowledge that you will be solely responsible for your own assessment of the market and
of the market position of the Company and that you will conduct your own analysis and be solely responsible for forming your
own view of the potential future performance of the Company's business.
HP RS
Investor Presentation ● May 2017 ● Page 2
01 Highlights
Investor Presentation ● May 2017 ● Page 3
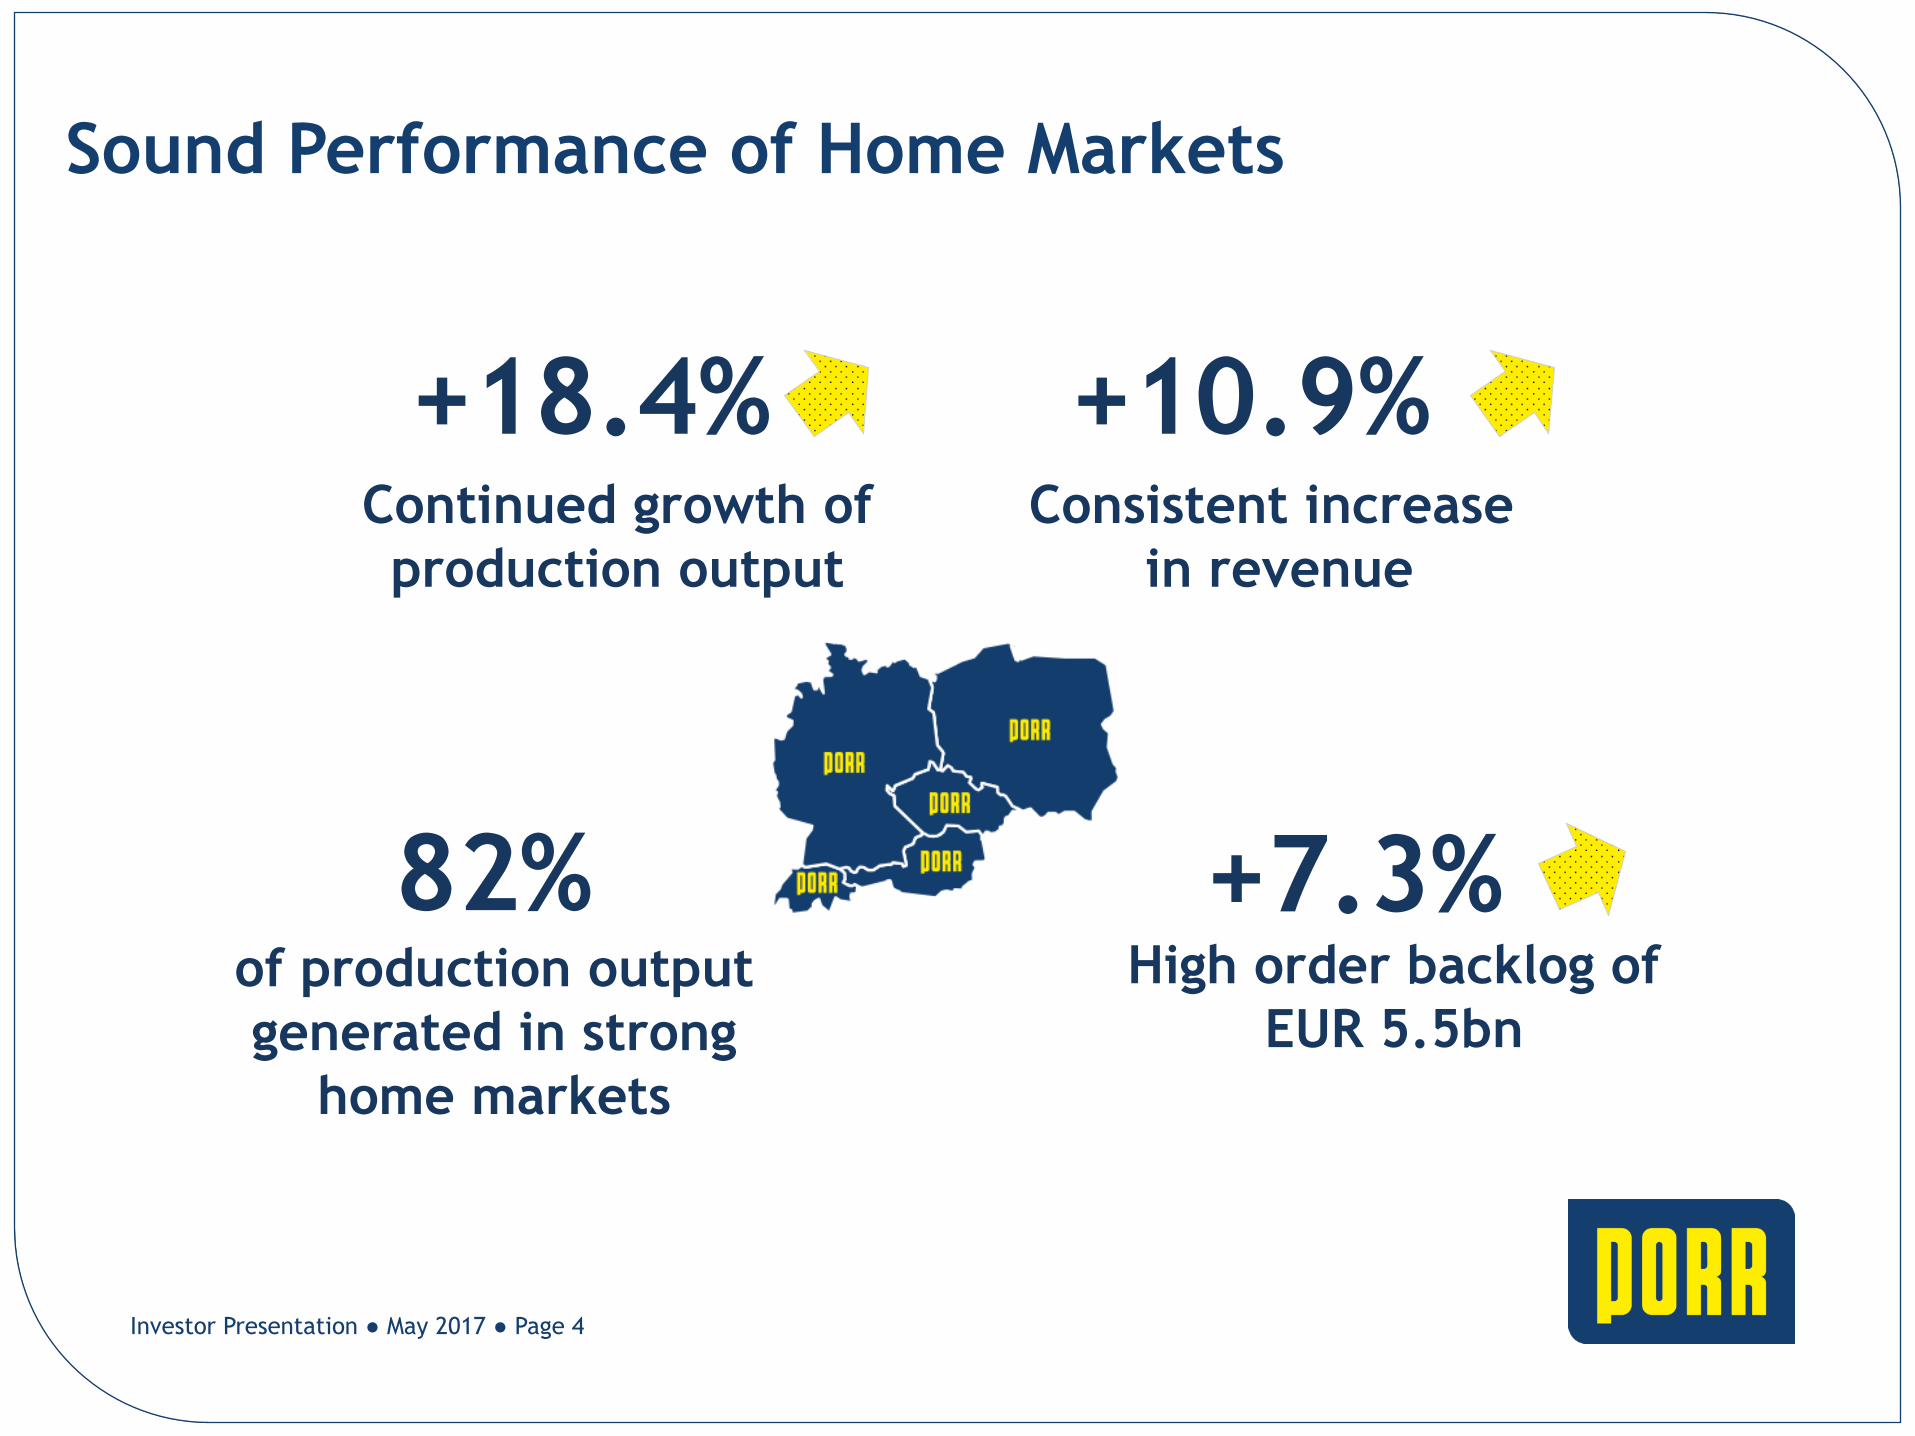
82% of production output
generated in strong
home markets
Continued growth of
production output
+18.4%
High order backlog of
EUR 5.5bn
+7.3%
AC HP RS
Sound Performance of Home Markets
Consistent increase
in revenue
+10.9%
Investor Presentation ● May 2017 ● Page 4
Healthy Balance Sheet – High Liquidity
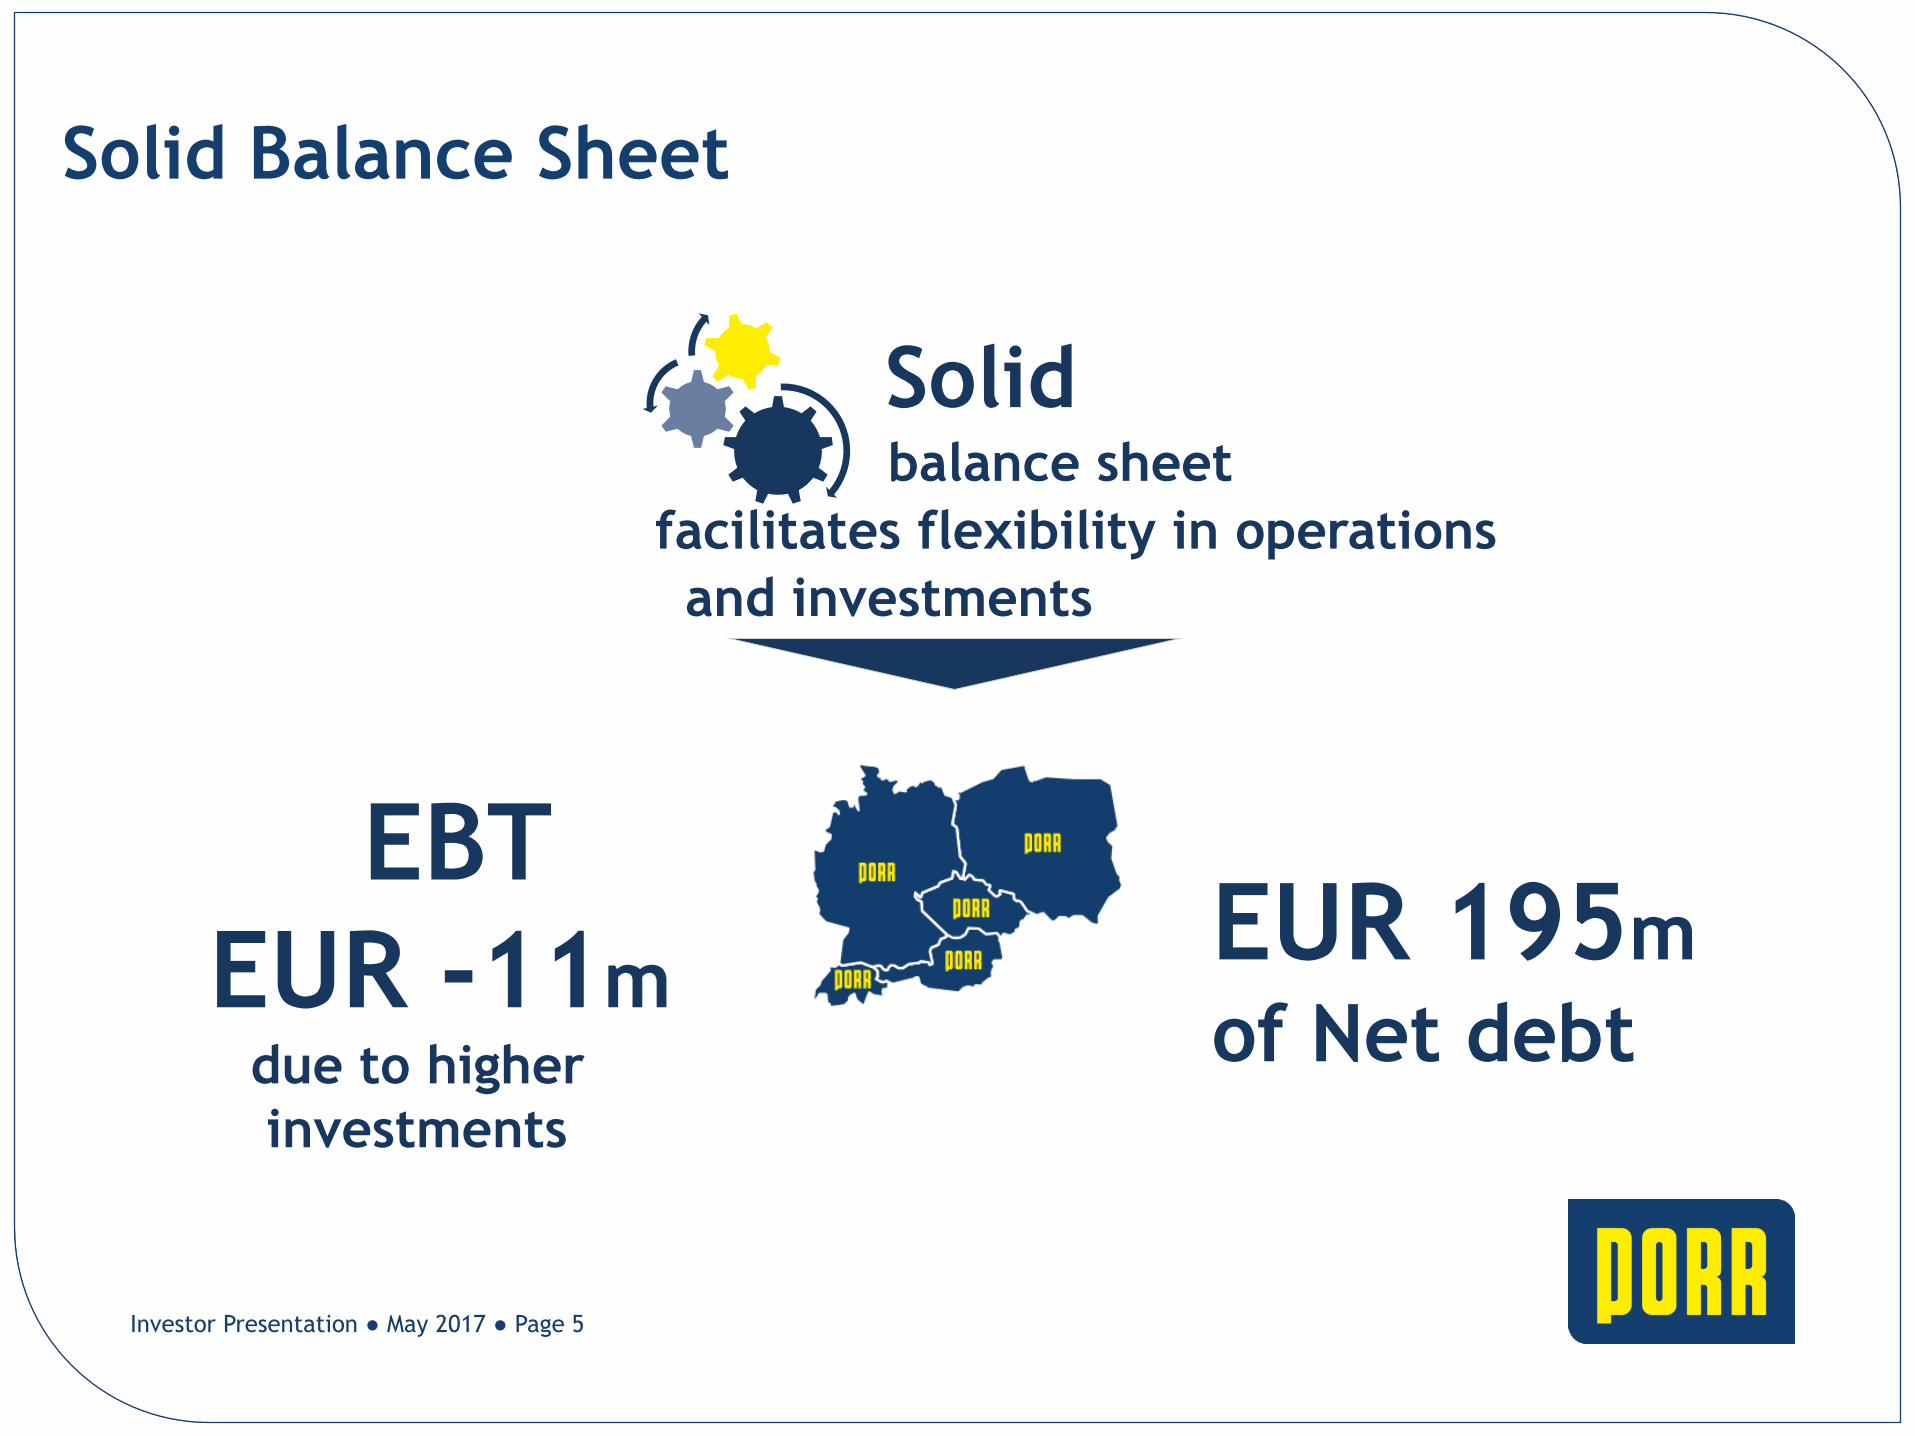
EBT
EUR -11m due to higher
investments
Solid
and investments
balance sheet
facilitates flexibility in operations
EUR 195m
of Net debt
AC HP RS
Solid Balance Sheet
Investor Presentation ● May 2017 ● Page 5
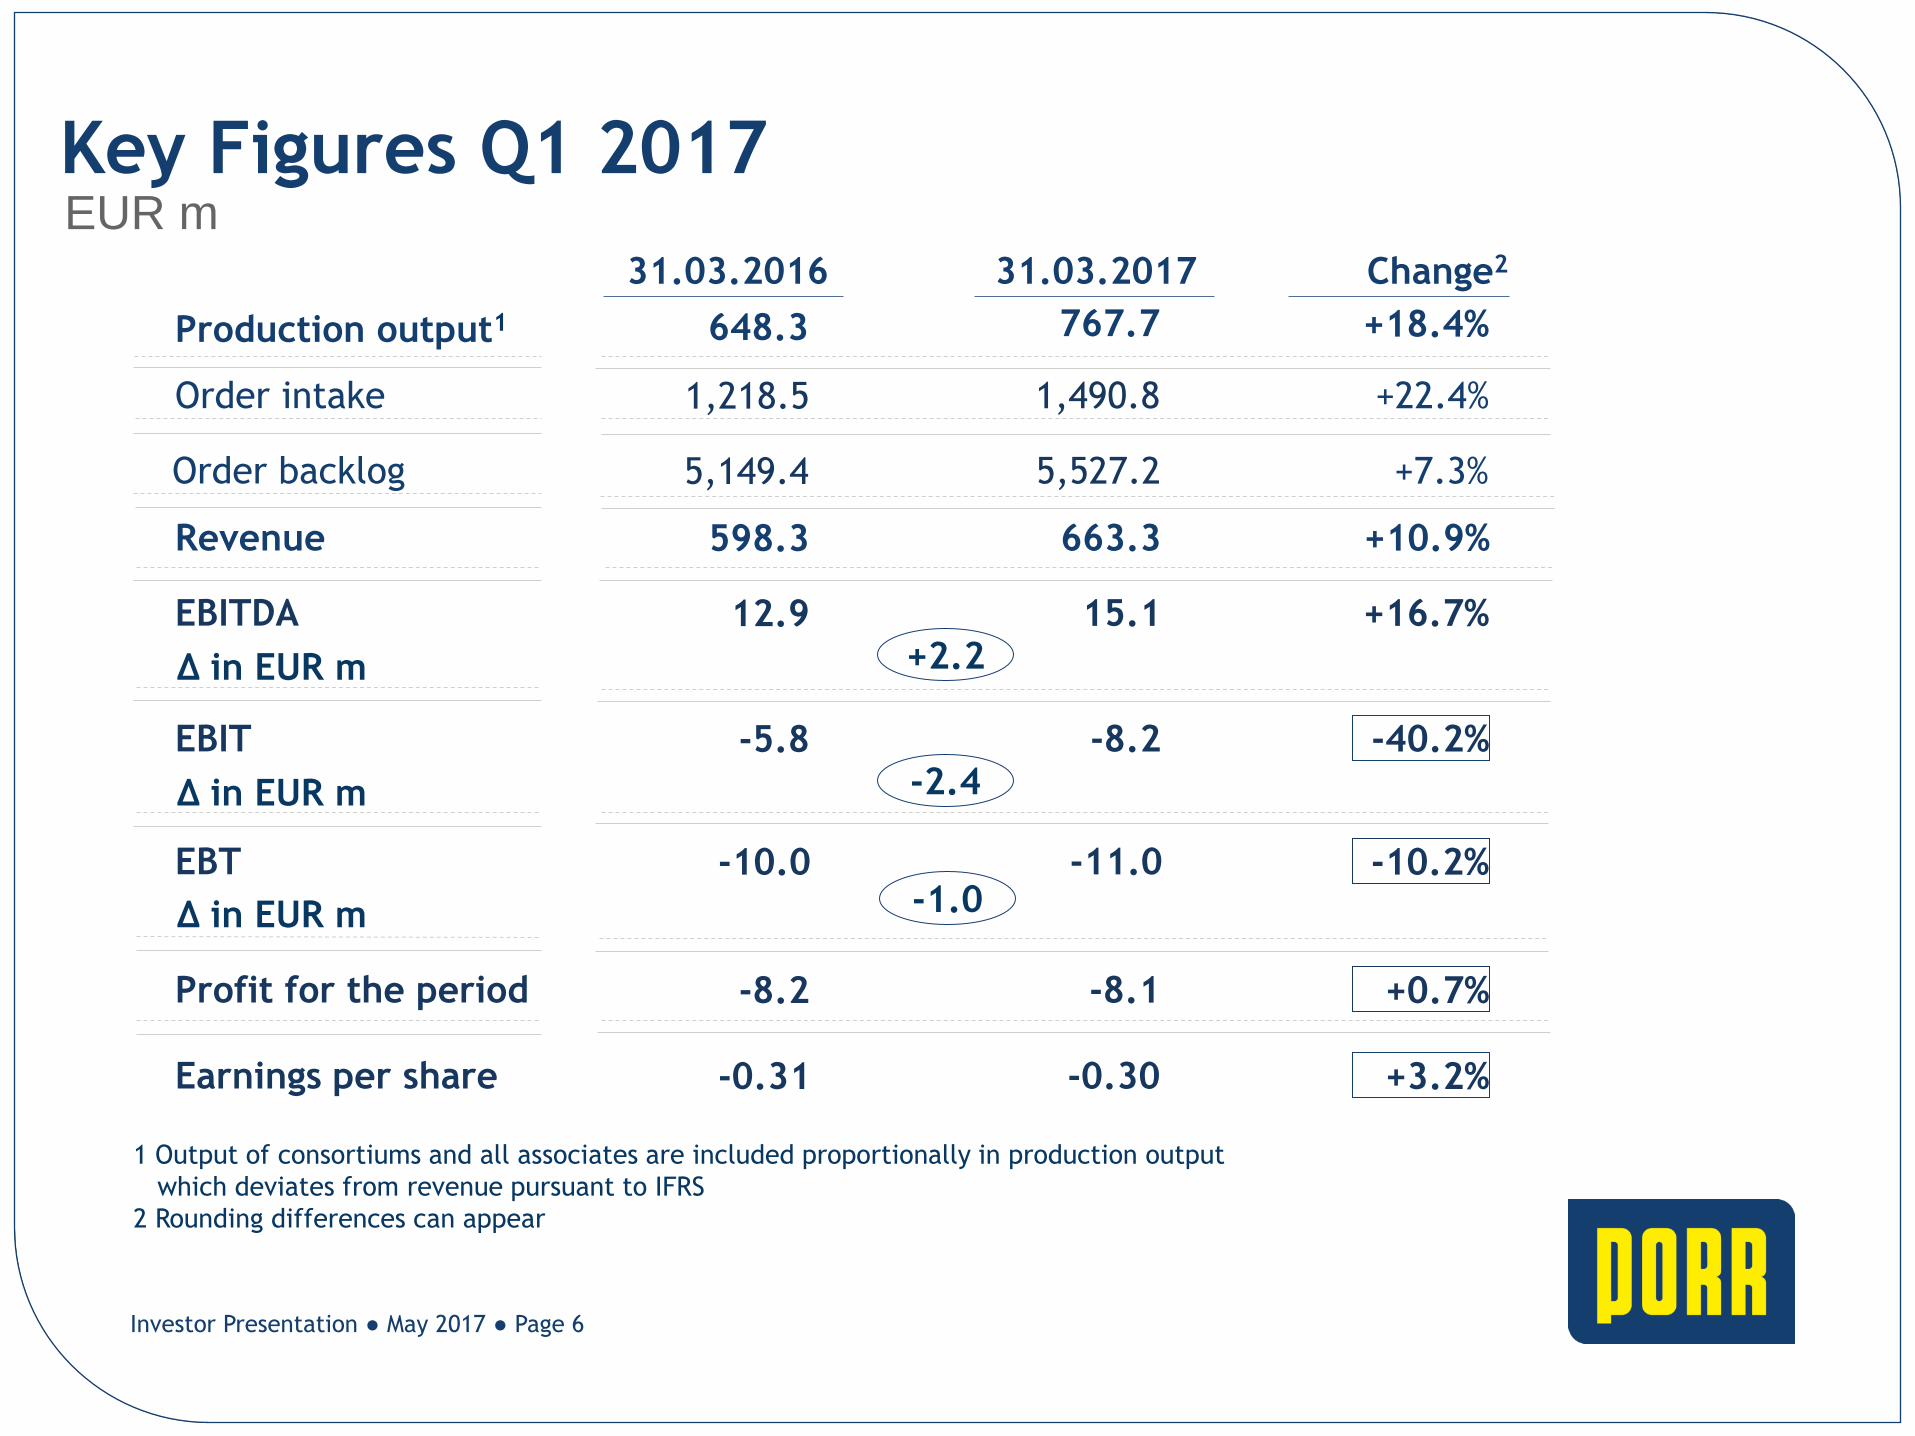
Key Figures Q1 2017
EUR m
1 Output of consortiums and all associates are included proportionally in production output
which deviates from revenue pursuant to IFRS
2 Rounding differences can appear
+18.4% 767.7
Change2
+0.7%
+16.7%
+22.4%
+7.3%
15.1
-11.0
31.03.2017
-8.1
663.3
1,490.8
5,527.2
+10.9%
-10.2%
+3.2% -0.30
Profit for the period
Revenue
EBITDA
Production output1
EBT
Order intake
Order backlog
Earnings per share
∆ in EUR m
648.3
31.03.2016
-8.2
1,218.5
5,149.4
12.9
-10.0
598.3
-0.31
-1.0
+2.2
Investor Presentation ● May 2017 ● Page 6
∆ in EUR m
-40.2% -8.2 EBIT -5.8 -2.4 ∆ in EUR m
02 Markets & Strategy
Investor Presentation ● May 2017 ● Page 7
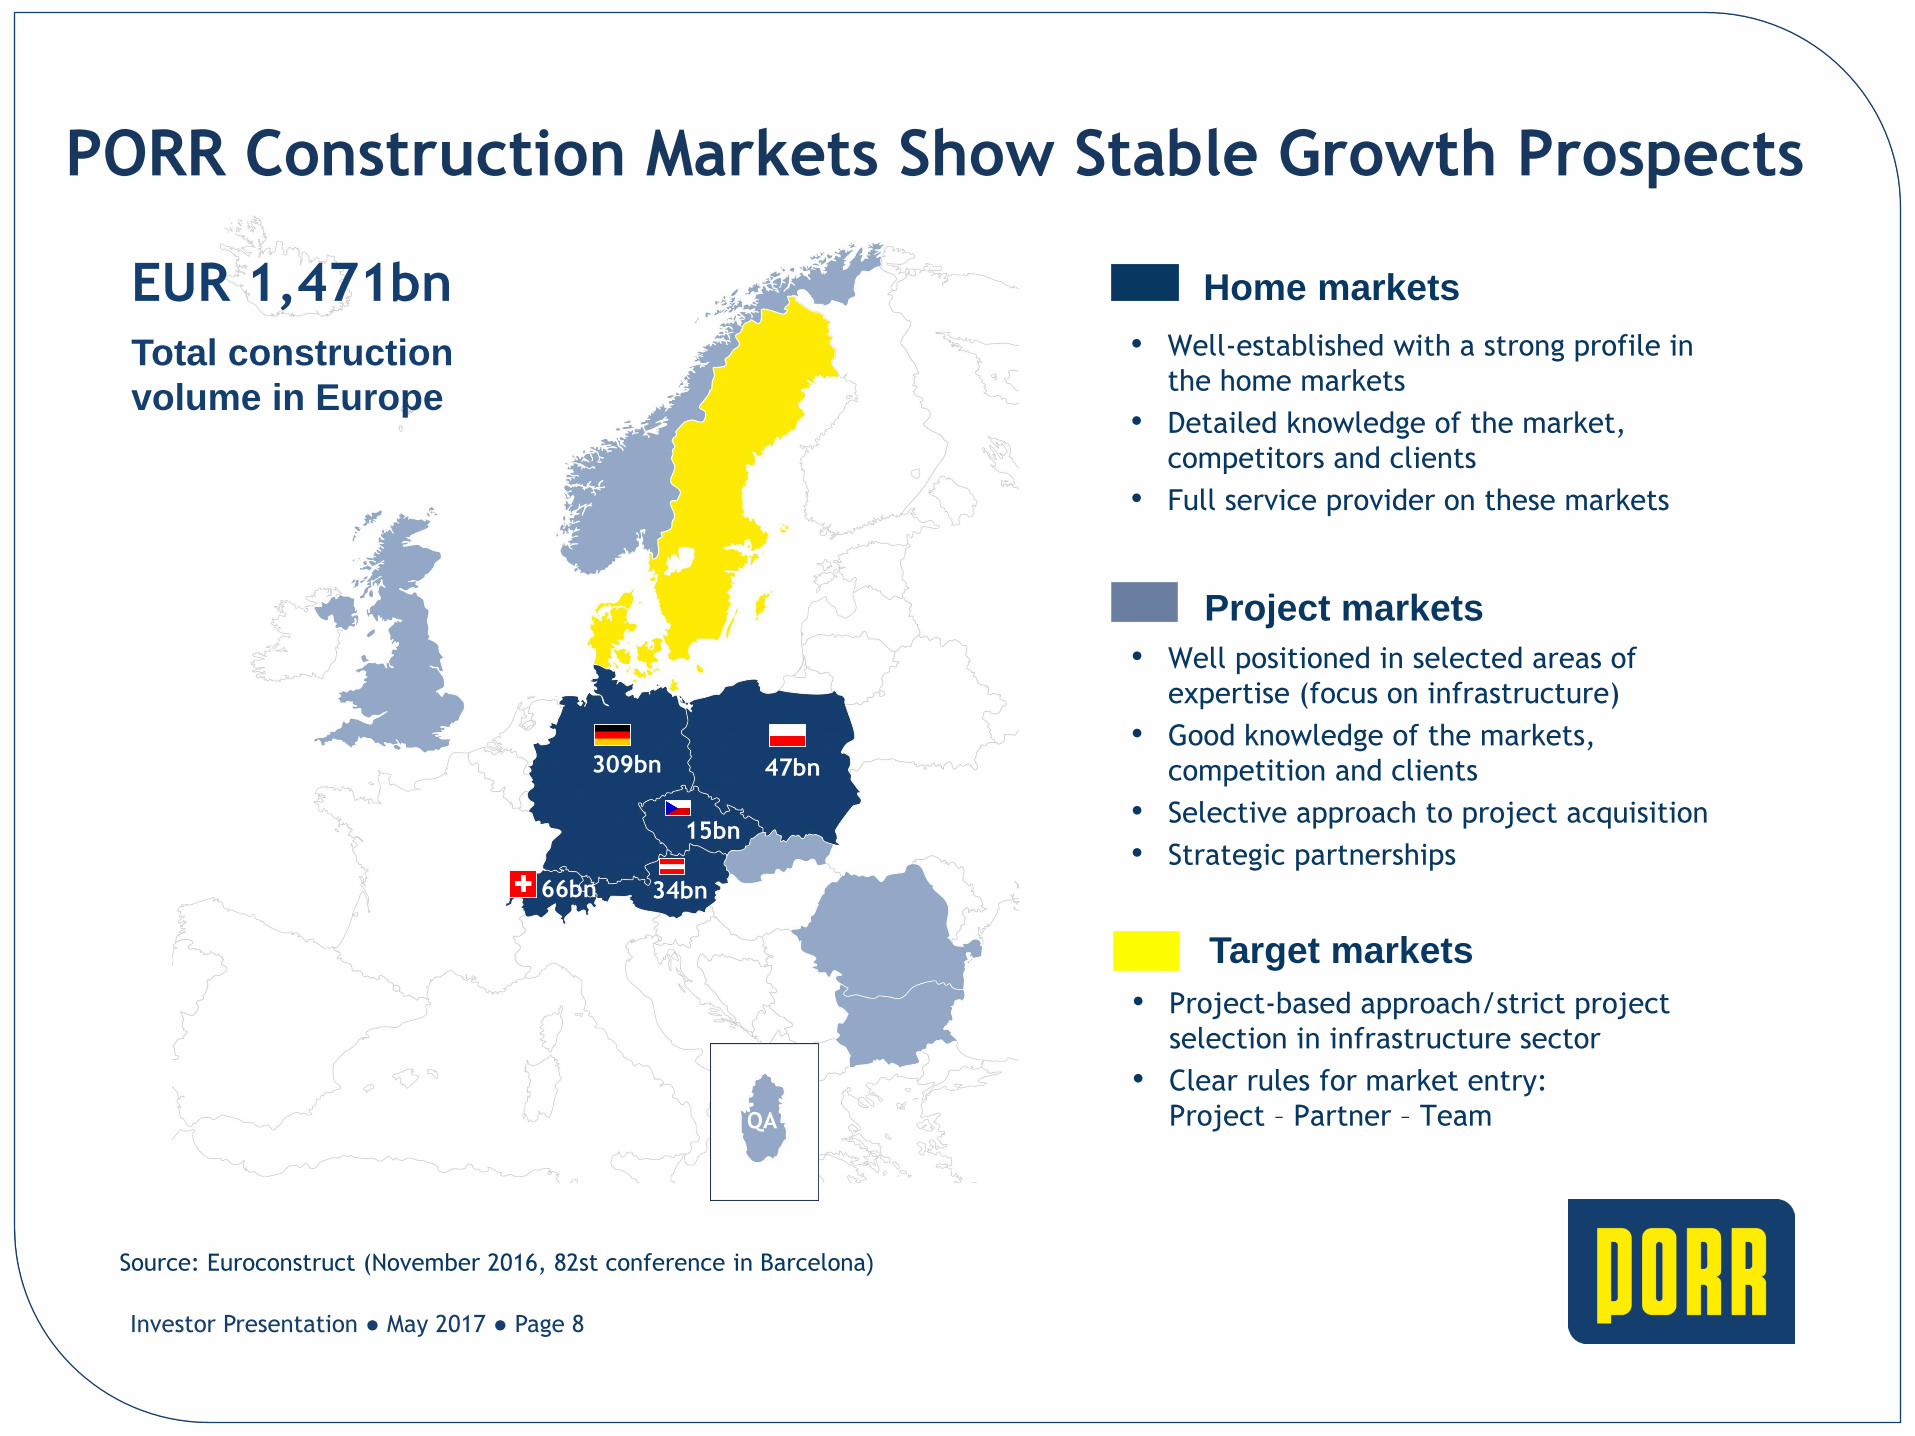
• Well-established with a strong profile in
the home markets
• Detailed knowledge of the market,
competitors and clients
• Full service provider on these markets
PORR Construction Markets Show Stable Growth Prospects Market Volume & Approach
309bn
EUR 1,471bn
Total construction
volume in Europe
Source: Euroconstruct (November 2016, 82st conference in Barcelona)
AC RS HP
• Well positioned in selected areas of
expertise (focus on infrastructure)
• Good knowledge of the markets,
competition and clients
• Selective approach to project acquisition
• Strategic partnerships
Project markets
• Project-based approach/strict project
selection in infrastructure sector
• Clear rules for market entry:
Project – Partner – Team
Target markets
47bn
15bn
34bn 66bn
Home markets
QA
Investor Presentation ● May 2017 ● Page 8
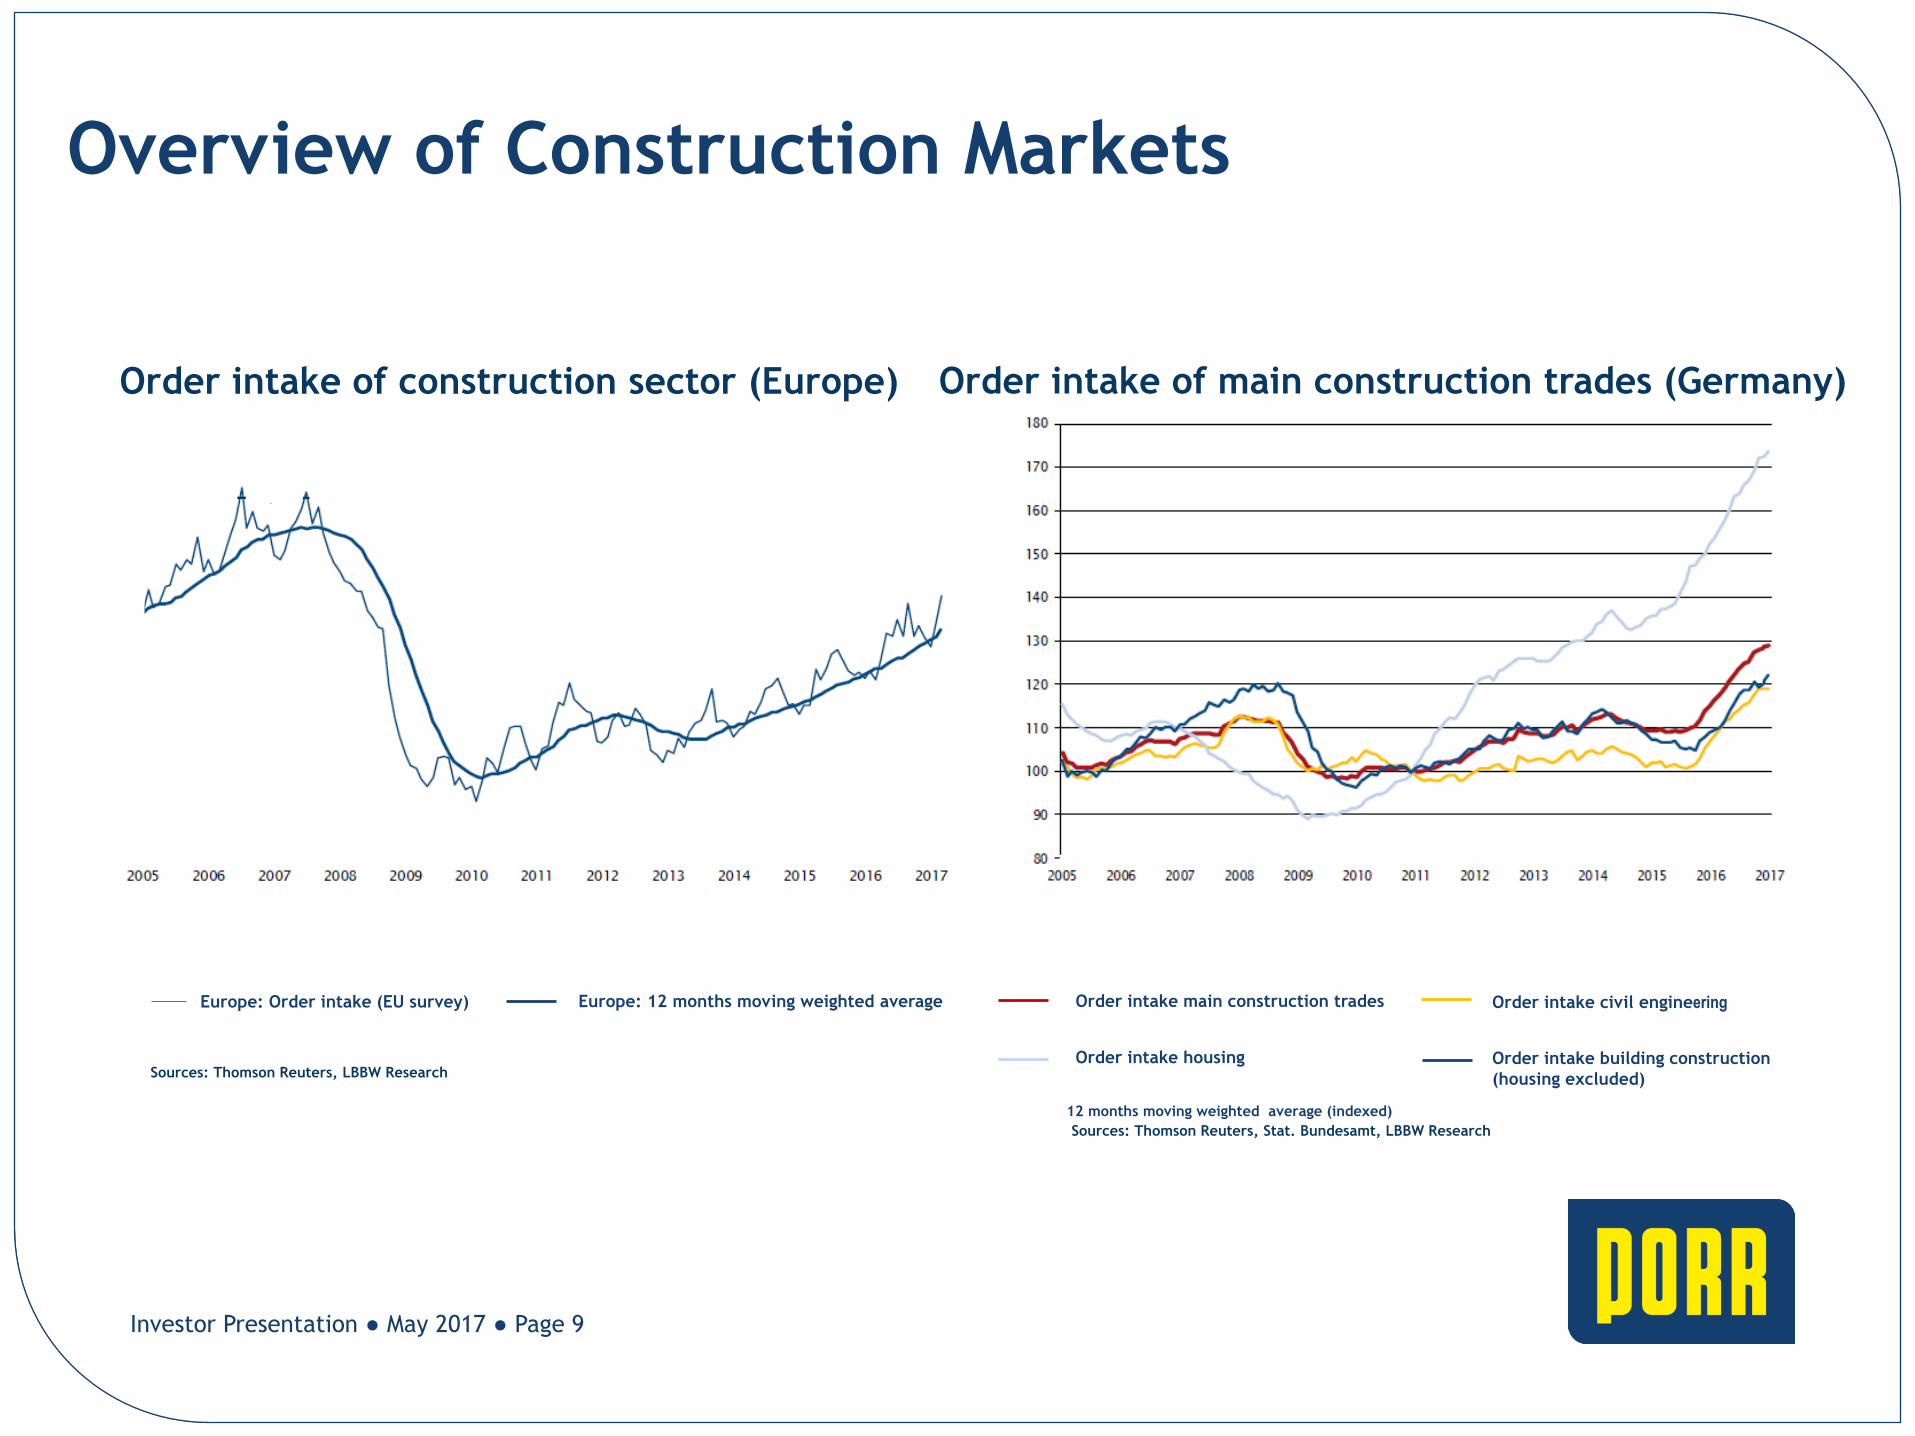
Order intake of construction sector (Europe)
Overview of Construction Markets
12 months moving weighted average (indexed)
Sources: Thomson Reuters, Stat. Bundesamt, LBBW Research
Order intake main construction trades
Order intake housing
Order intake civil engineering
Order intake building construction
(housing excluded)
Order intake of main construction trades (Germany)
Investor Presentation ● May 2017 ● Page 9
Sources: Thomson Reuters, LBBW Research
Europe: Order intake (EU survey) Europe: 12 months moving weighted average
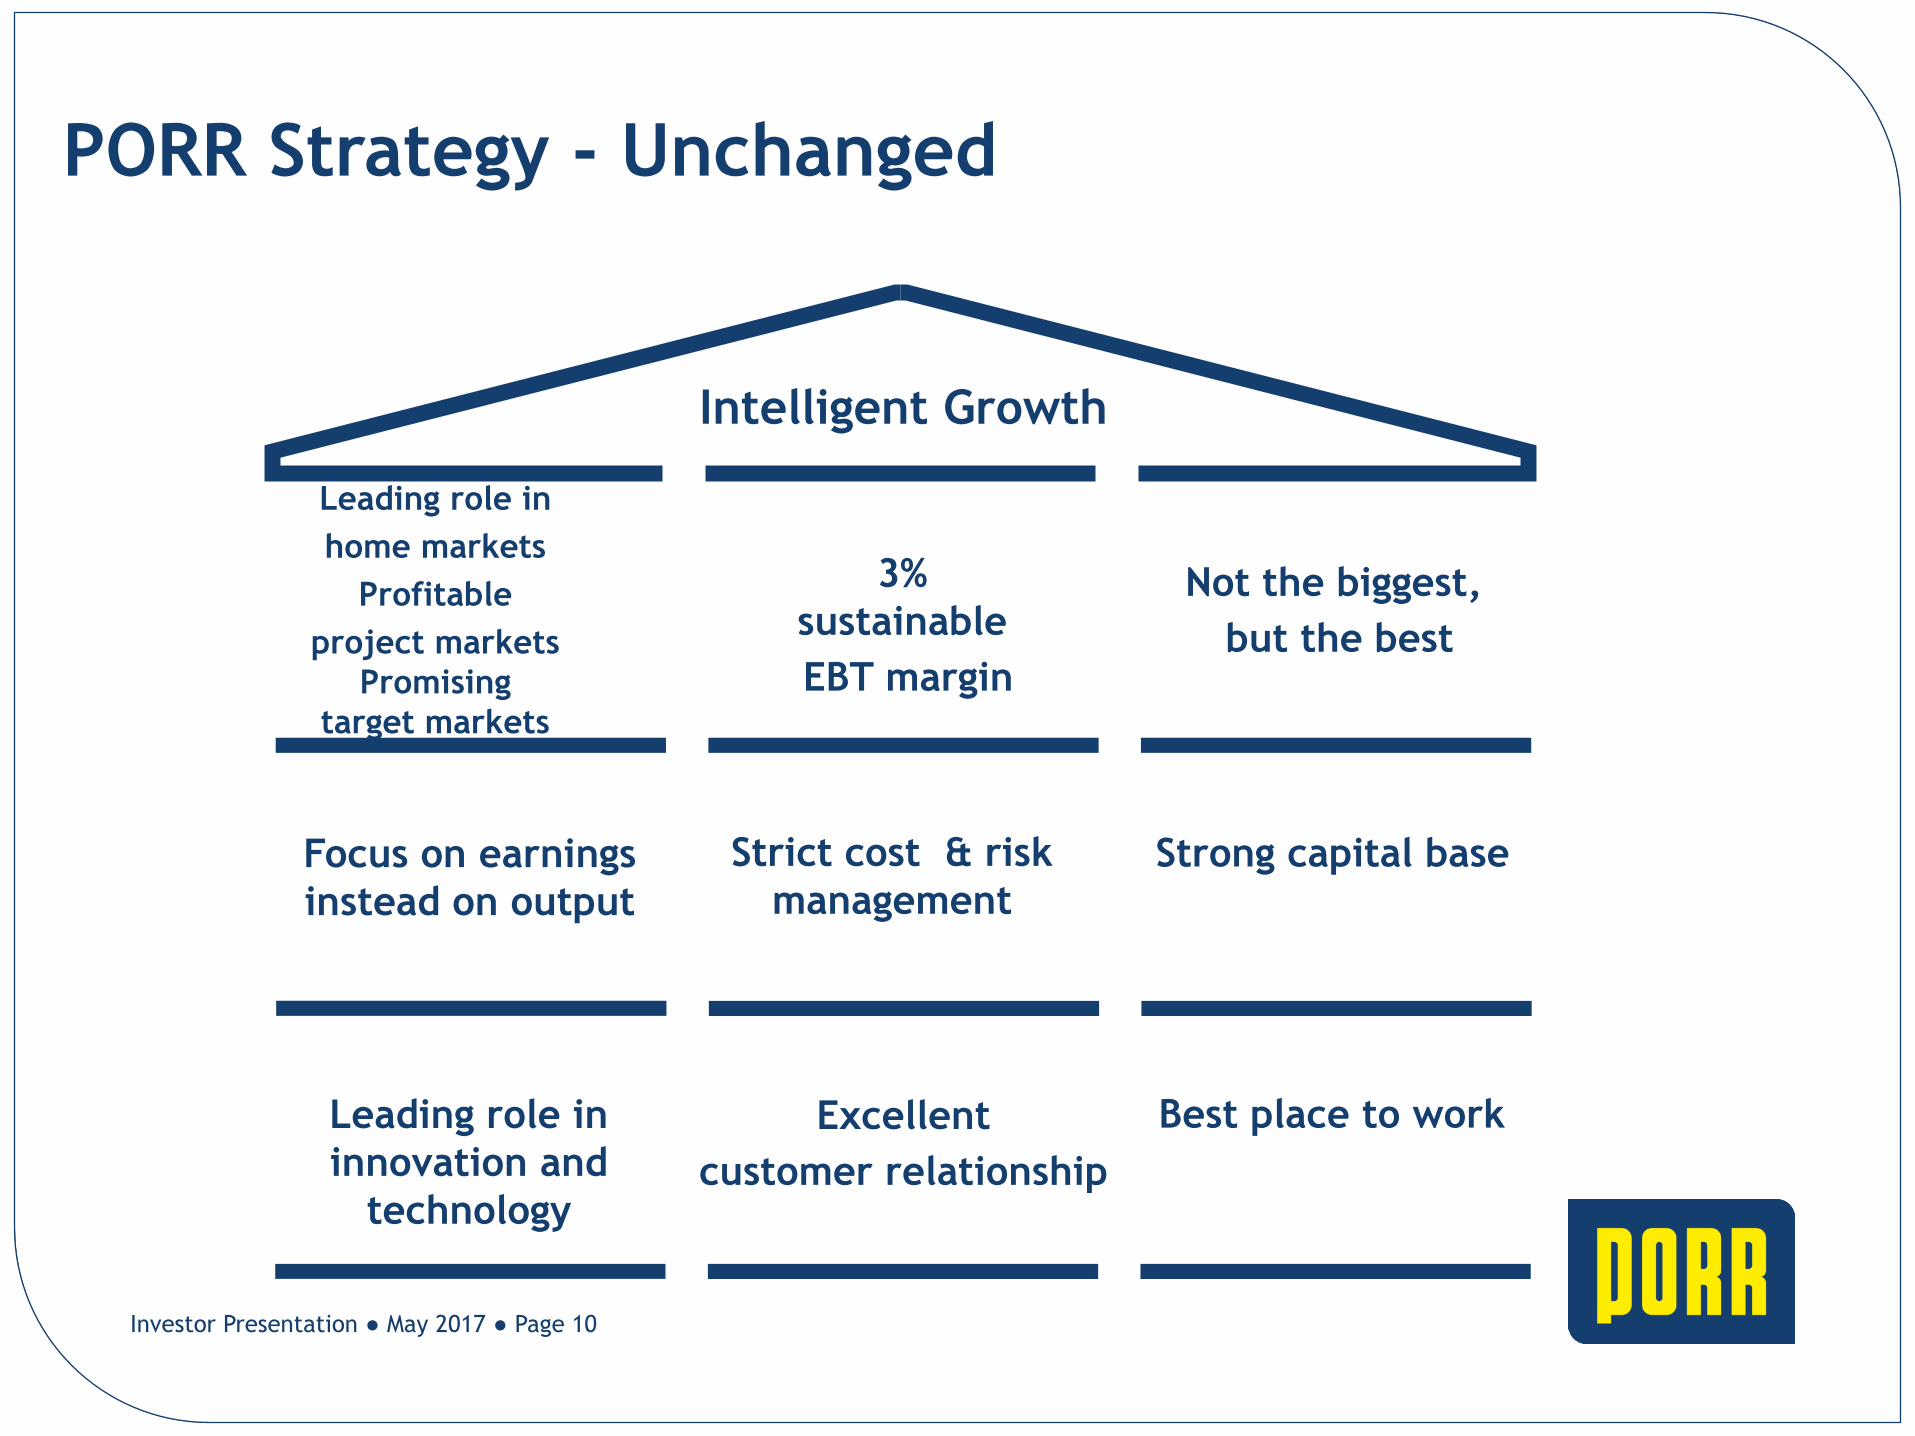
Leading role in
home markets
Profitable
project markets
Promising
target markets
3%
sustainable
EBT margin
Not the biggest,
but the best
Focus on earnings
instead on output
Strict cost & risk
management
Strong capital base
Leading role in
innovation and
technology
Excellent
customer relationship
Best place to work
Intelligent Growth
PORR Strategy - Unchanged
Investor Presentation ● May 2017 ● Page 10
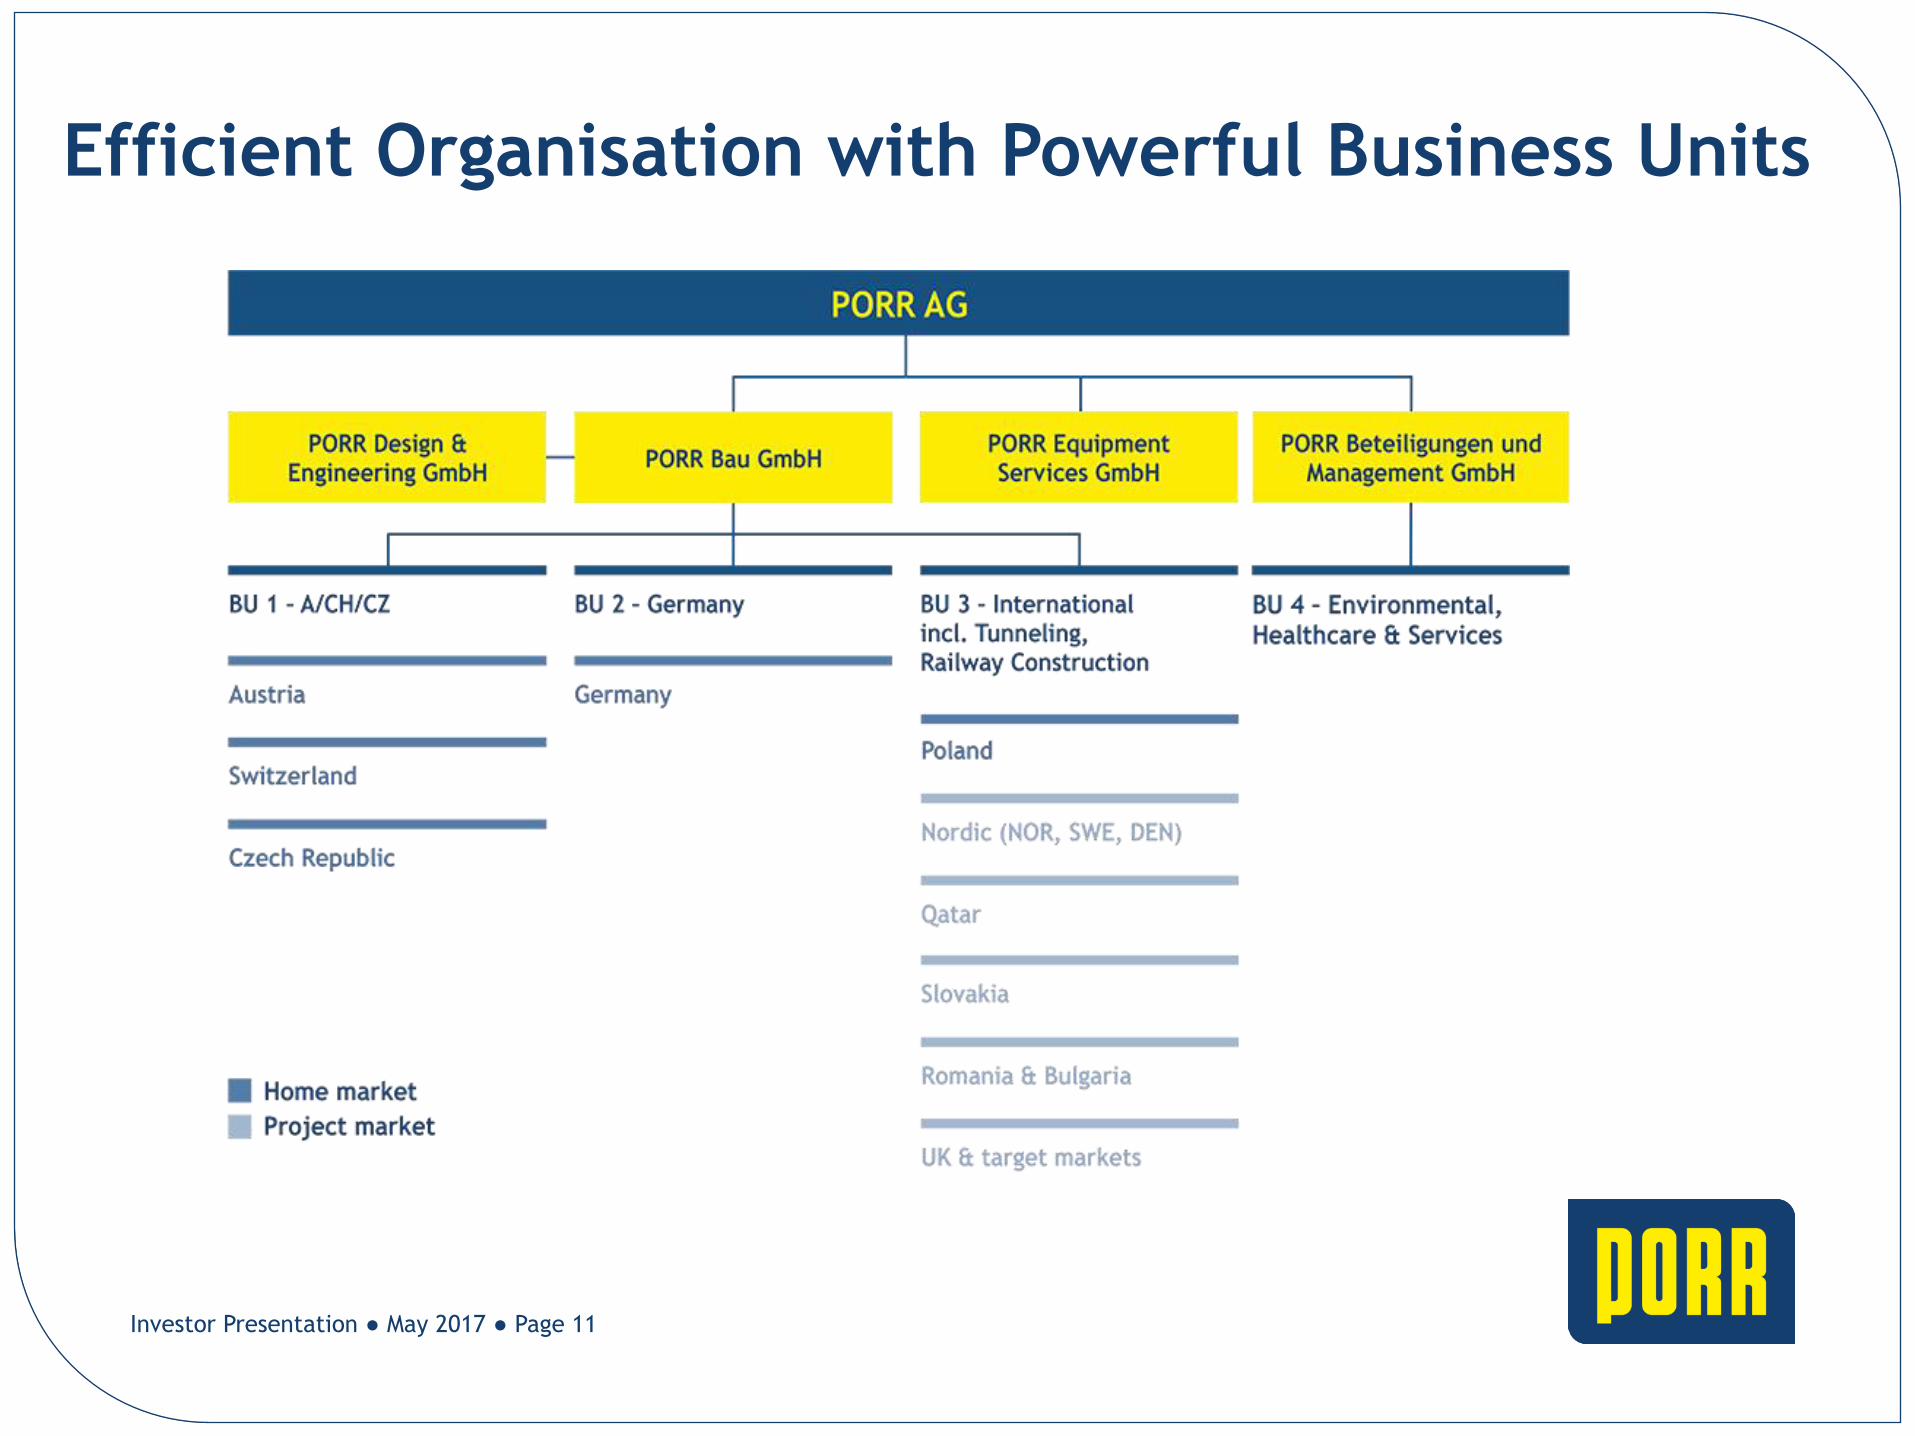
Efficient Organisation with Powerful Business Units
Investor Presentation ● May 2017 ● Page 11
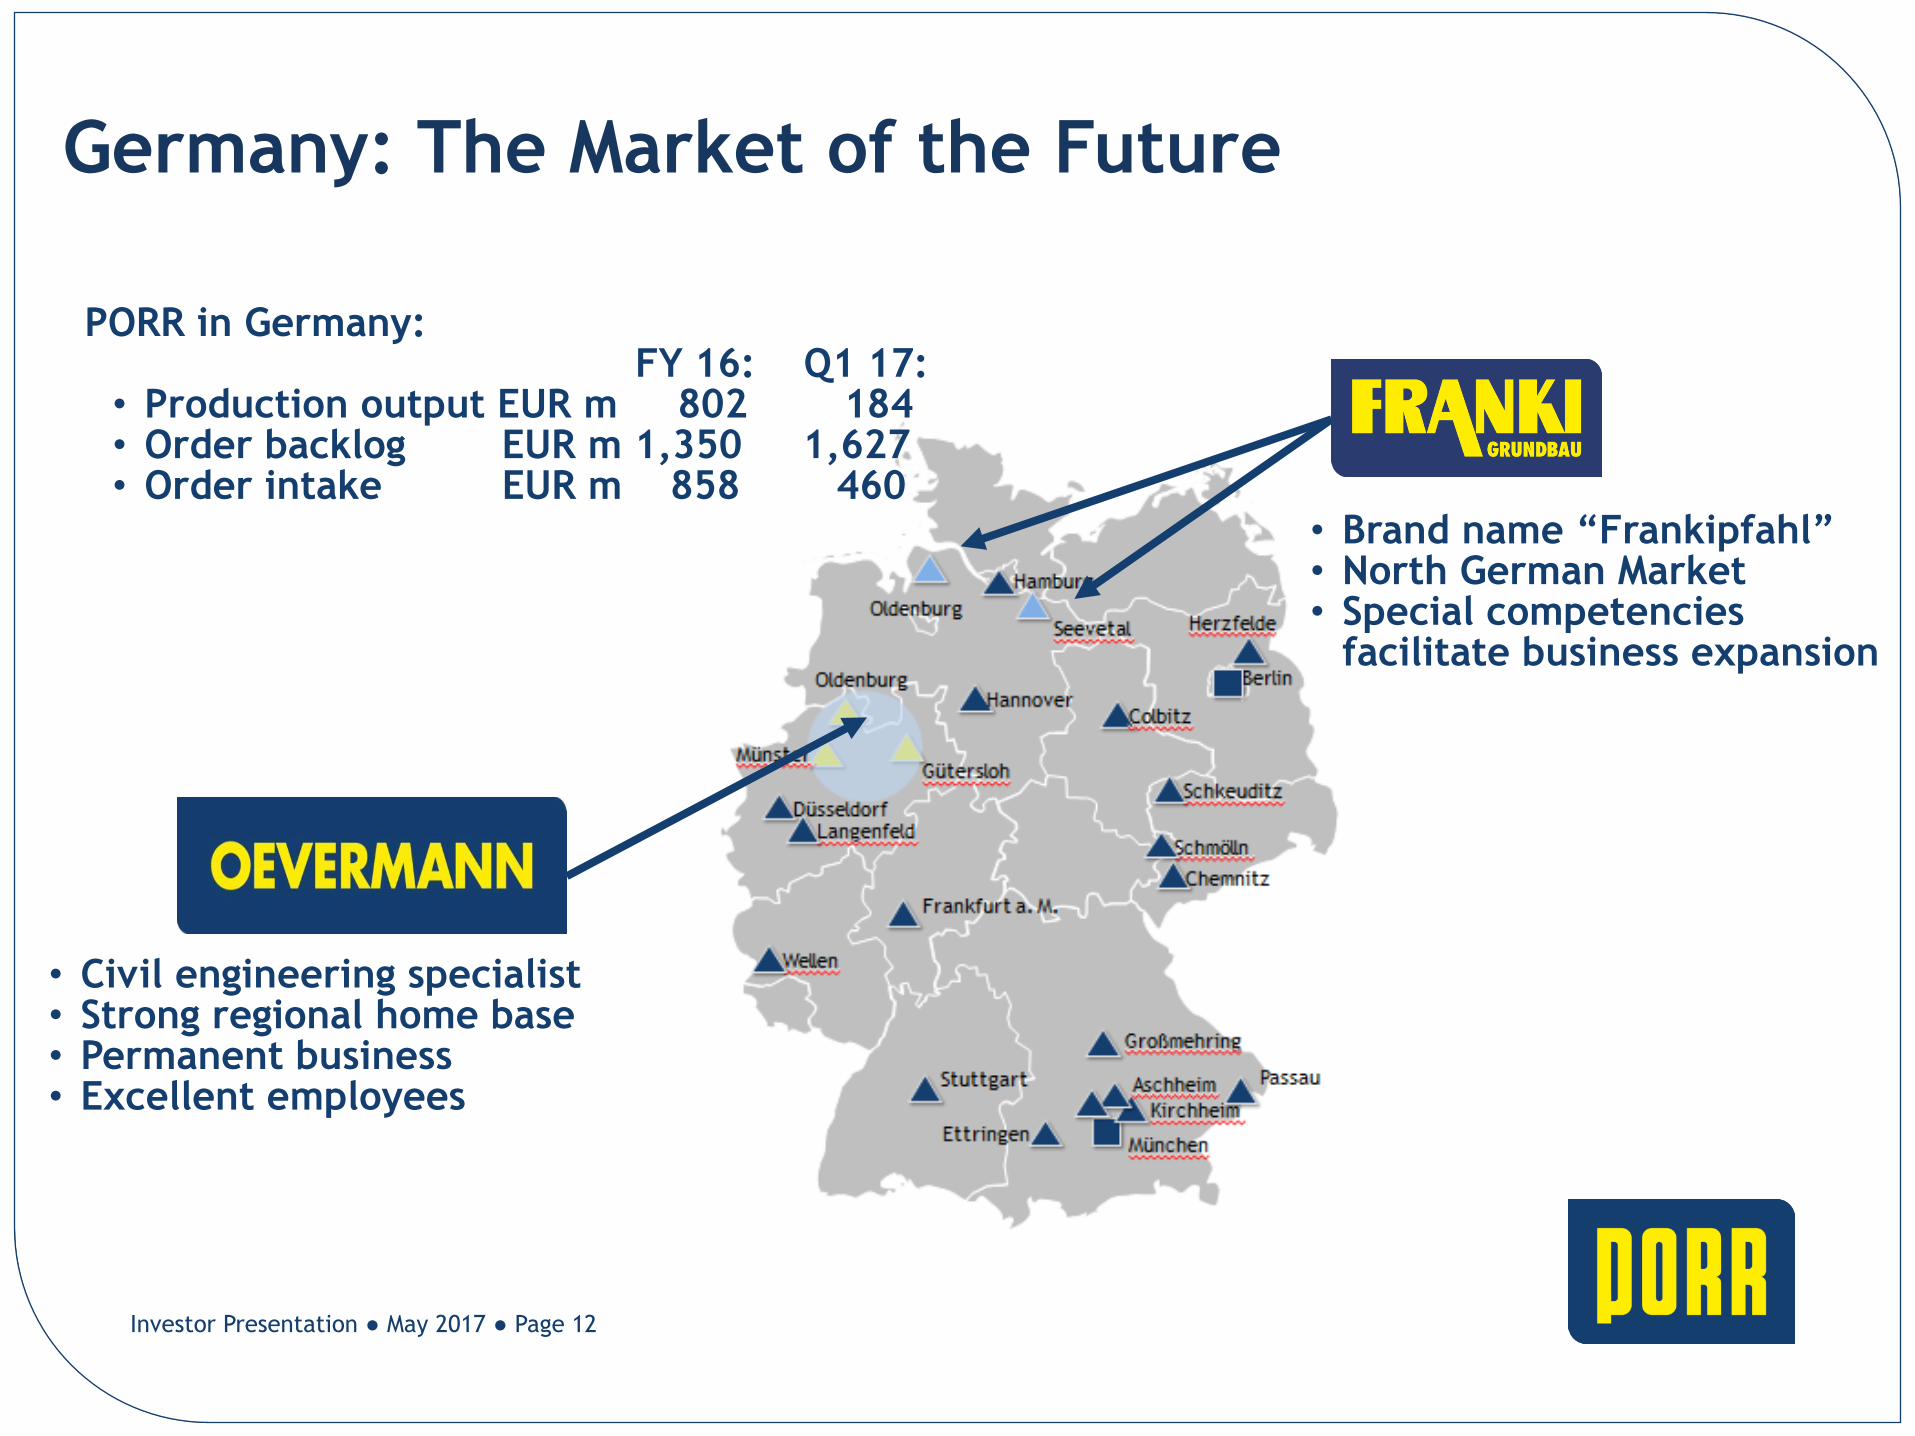
Germany: The Market of the Future
PORR in Germany: FY 16: Q1 17: • Production output EUR m 802 184 • Order backlog EUR m 1,350 1,627 • Order intake EUR m 858 460
• Civil engineering specialist • Strong regional home base • Permanent business • Excellent employees
• Brand name “Frankipfahl” • North German Market • Special competencies
facilitate business expansion
M&A Activities in Germany
Investor Presentation ● May 2017 ● Page 12
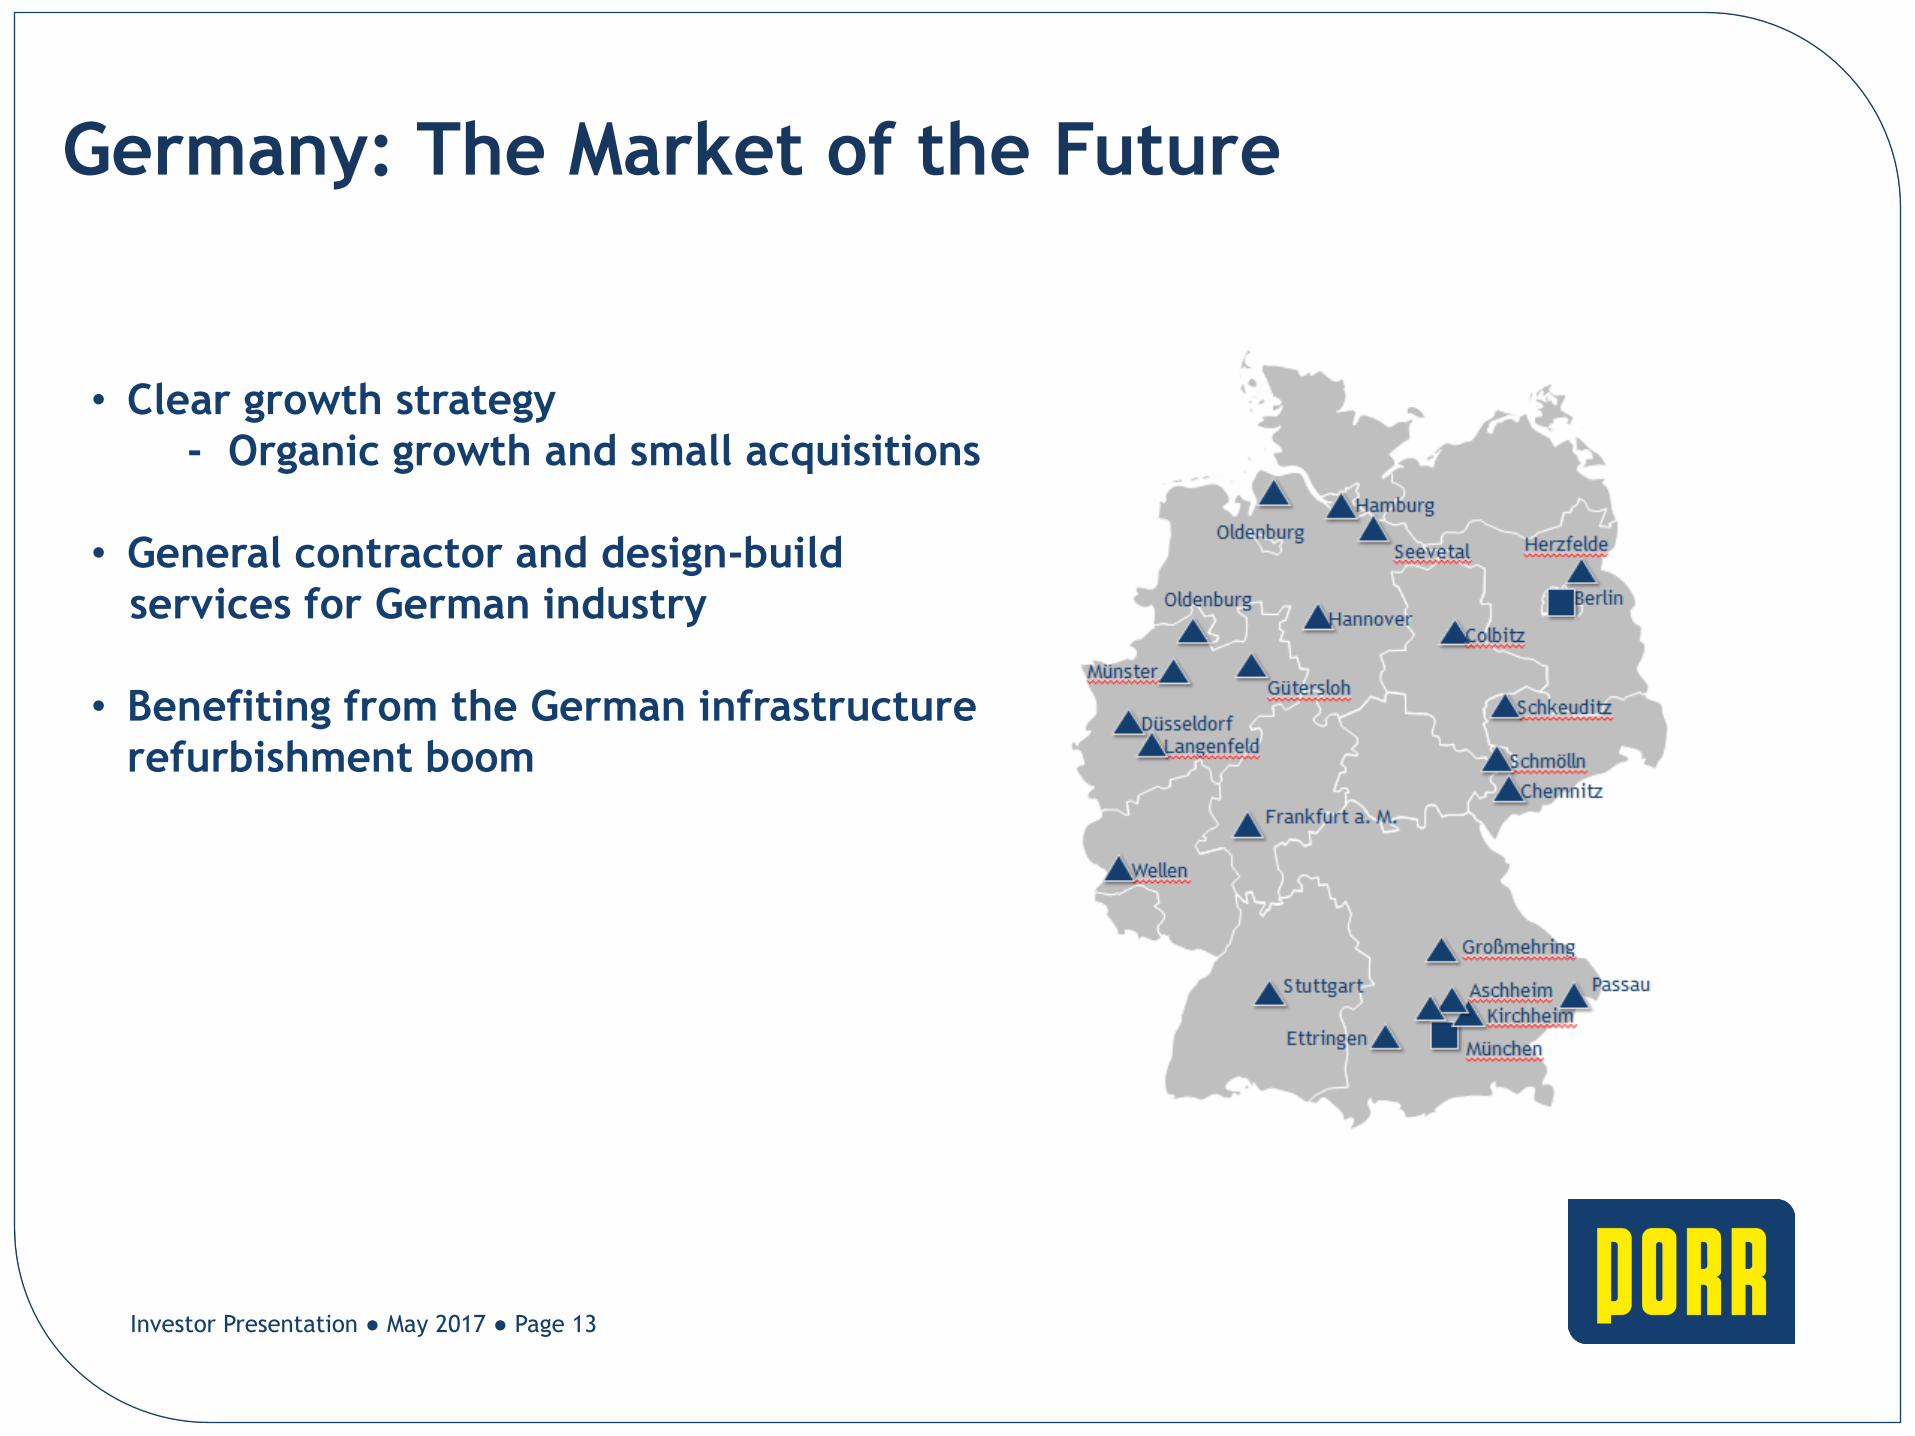
Germany: The Market of the Future
• Clear growth strategy
- Organic growth and small acquisitions
• General contractor and design-build
services for German industry
• Benefiting from the German infrastructure
refurbishment boom
Investor Presentation ● May 2017 ● Page 13
Control and steering mechanisms
RS HP
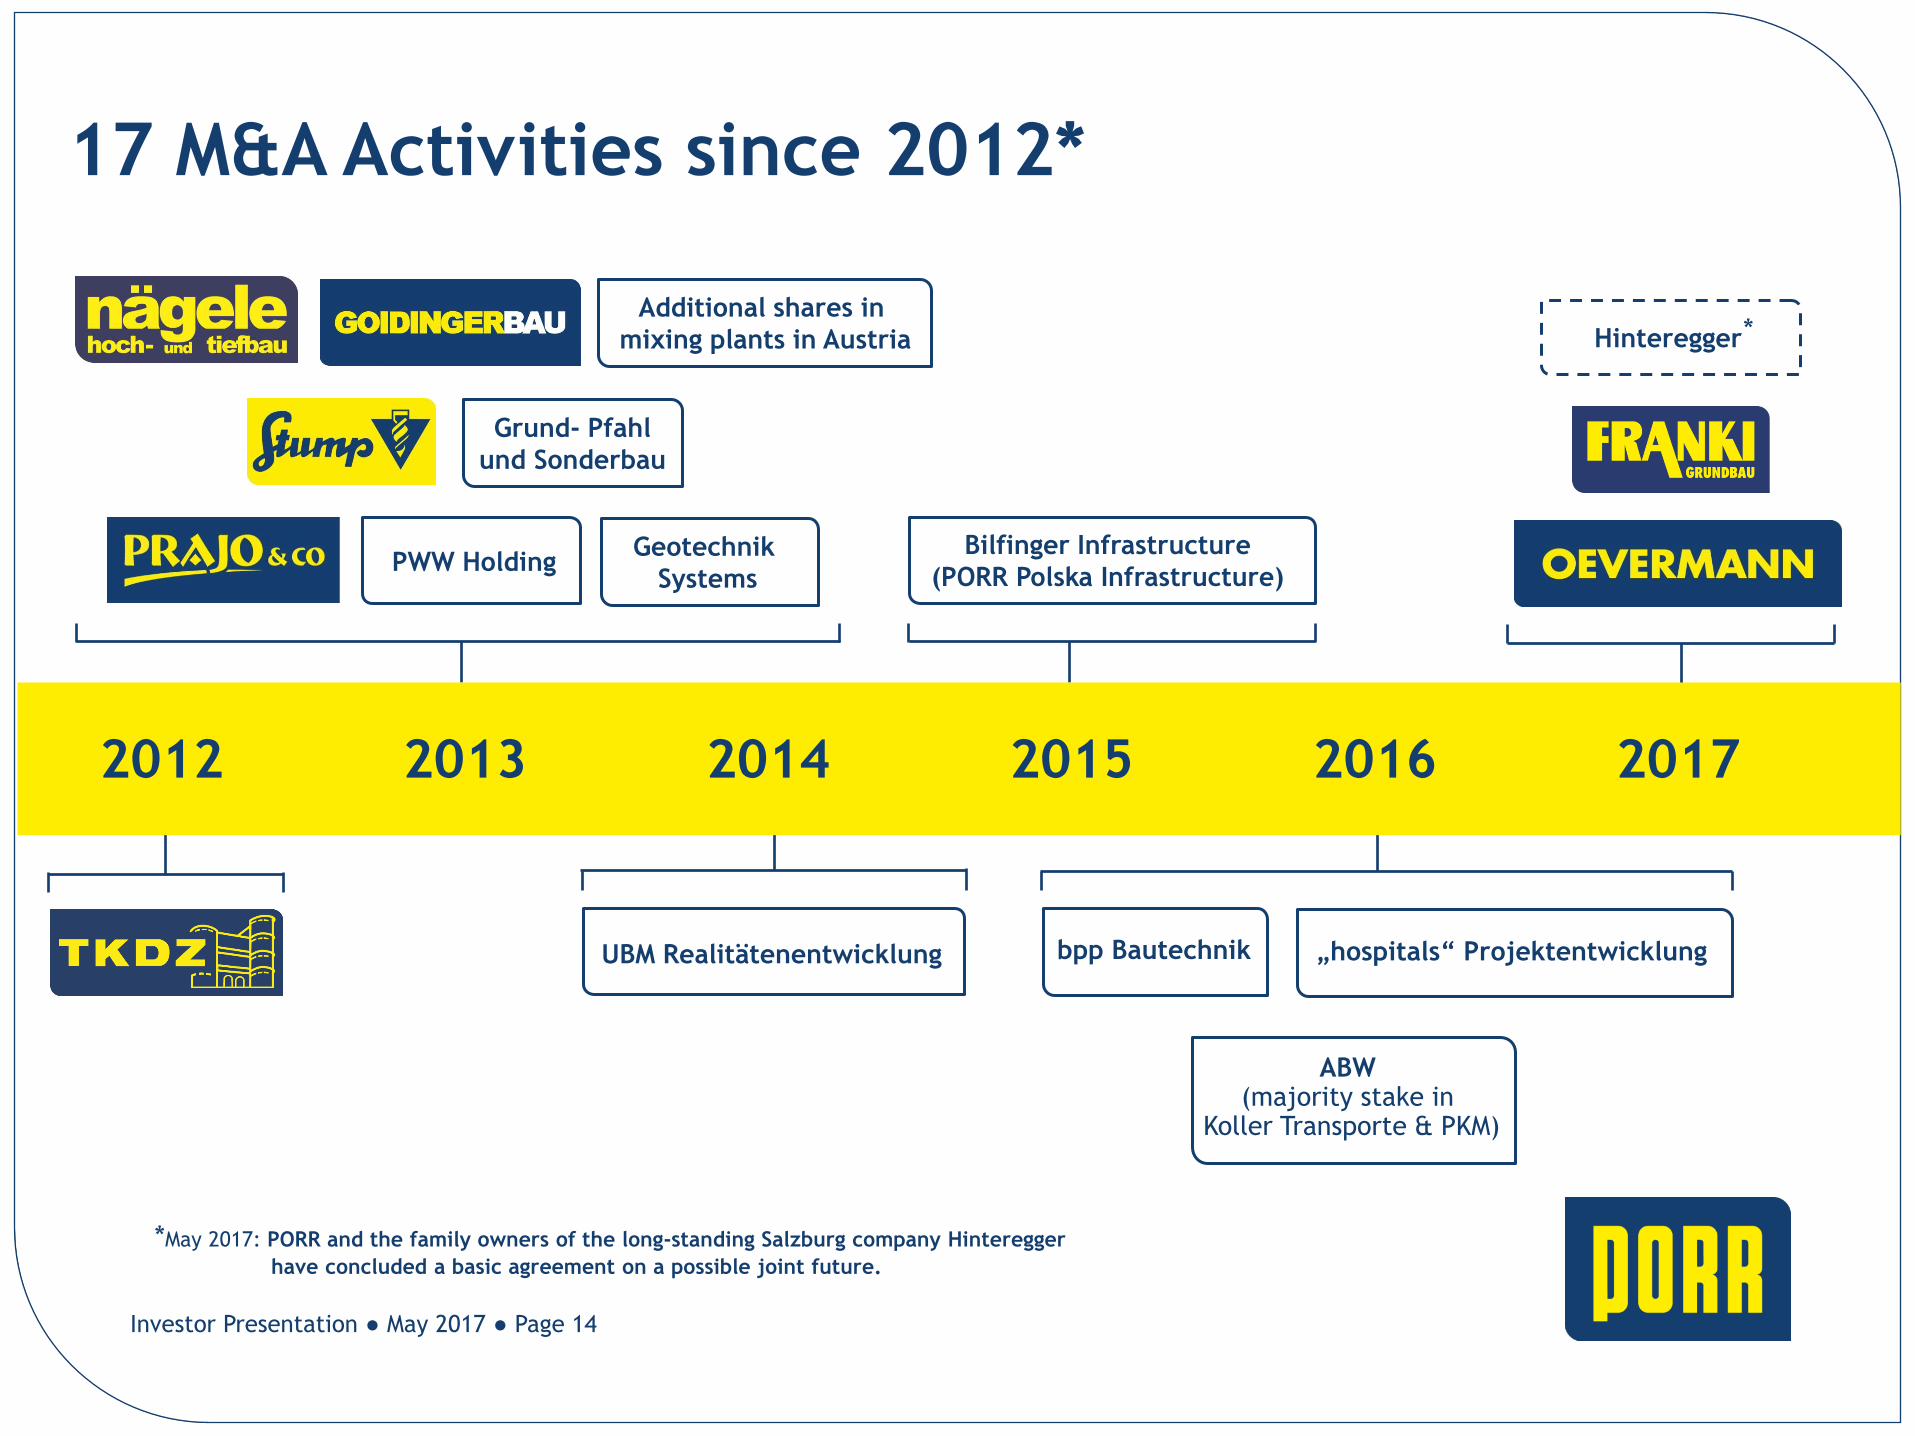
17 M&A Activities since 2012*
2012
PWW Holding
Additional shares in
mixing plants in Austria
Geotechnik
Systems
Grund- Pfahl
und Sonderbau
Bilfinger Infrastructure
(PORR Polska Infrastructure)
UBM Realitätenentwicklung „hospitals“ Projektentwicklung bpp Bautechnik
ABW (majority stake in
Koller Transporte & PKM)
2013 2014 2015 2016 2017
Investor Presentation ● May 2017 ● Page 14
Hinteregger *
*May 2017: PORR and the family owners of the long-standing Salzburg company Hinteregger
have concluded a basic agreement on a possible joint future.
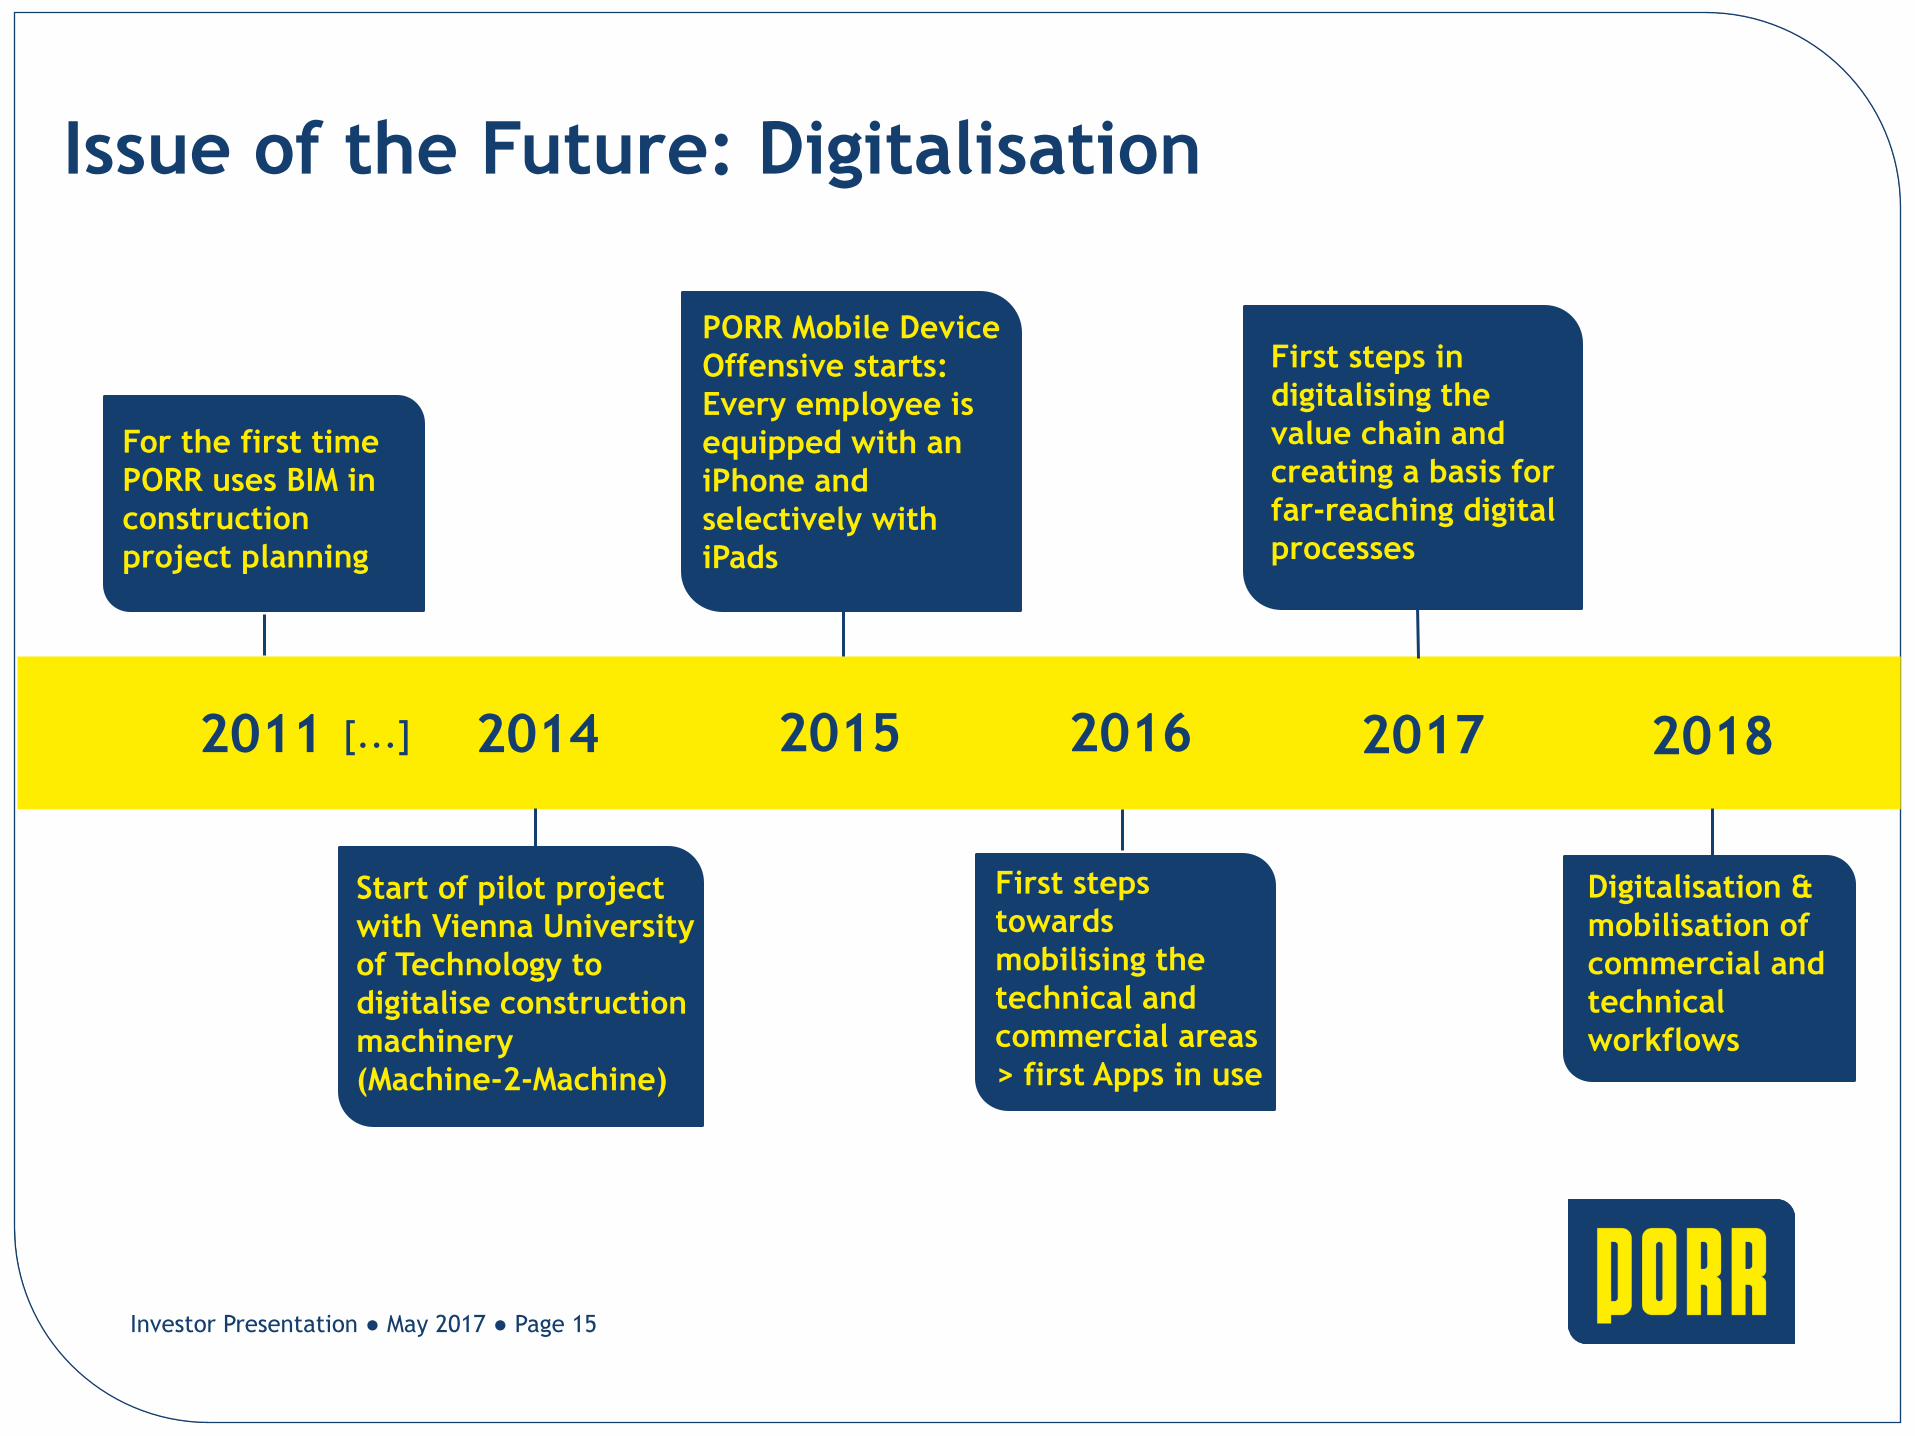
Issue of the Future: Digitalisation
2011 2014 2015 2016 2017 2018
Start of pilot project
with Vienna University
of Technology to
digitalise construction
machinery
(Machine-2-Machine)
PORR Mobile Device
Offensive starts:
Every employee is
equipped with an
iPhone and
selectively with
iPads
First steps
towards
mobilising the
technical and
commercial areas
> first Apps in use
First steps in
digitalising the
value chain and
creating a basis for
far-reaching digital
processes
Digitalisation &
mobilisation of
commercial and
technical
workflows
For the first time
PORR uses BIM in
construction
project planning
[...]
Investor Presentation ● May 2017 ● Page 15
Control and steering mechanisms
RS HP
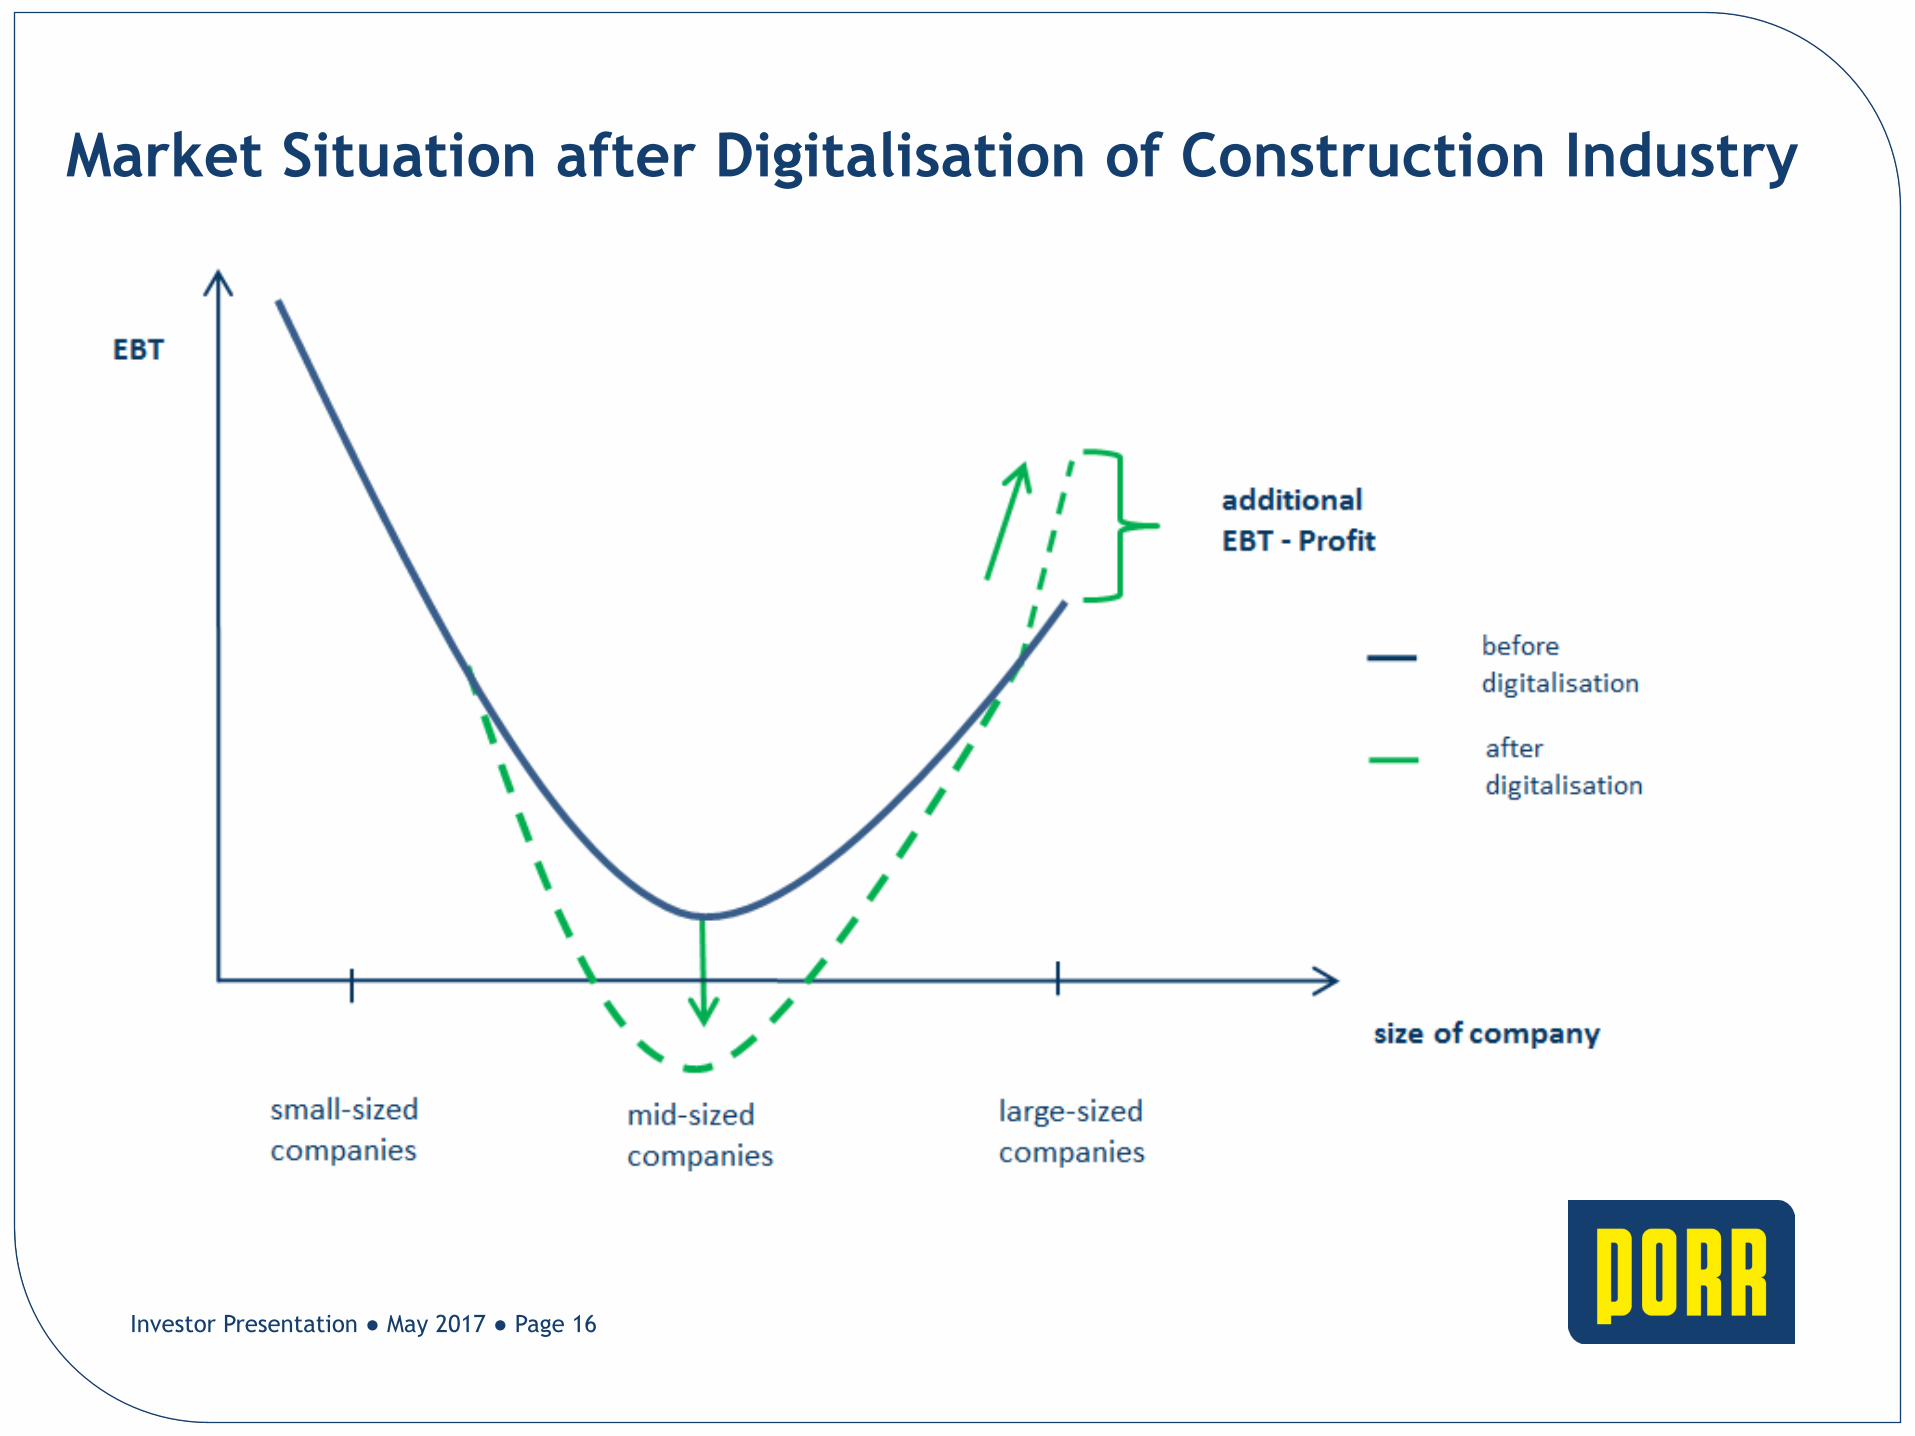
Market Situation after Digitalisation of Construction Industry
Investor Presentation ● May 2017 ● Page 16
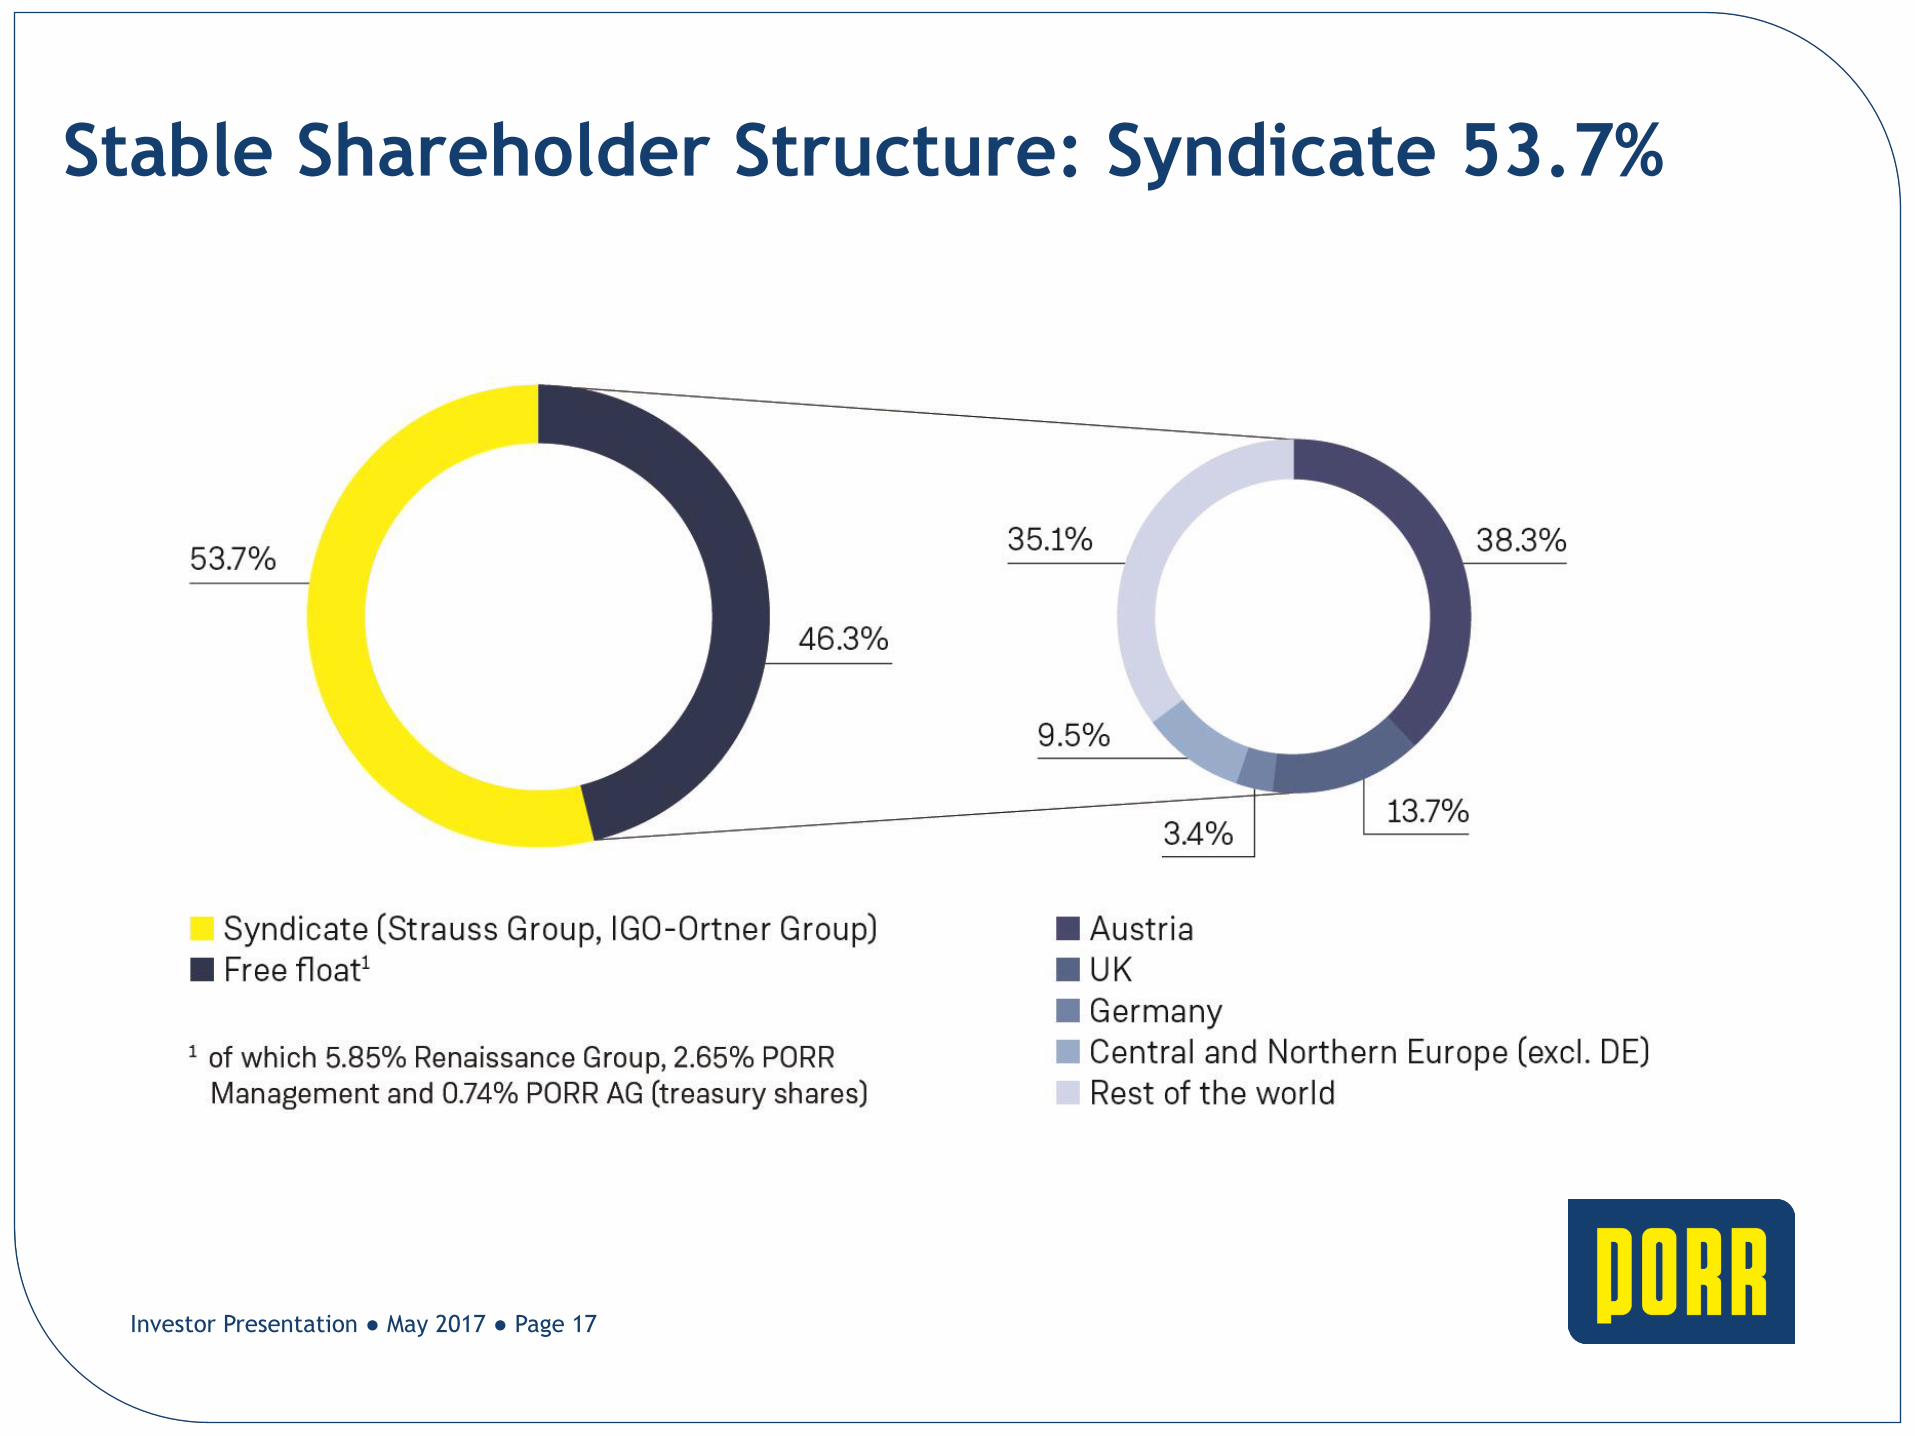
Stable Shareholder Structure: Syndicate 53.7%
Investor Presentation ● May 2017 ● Page 17
03 Operational Performance
Investor Presentation ● May 2017 ● Page 18
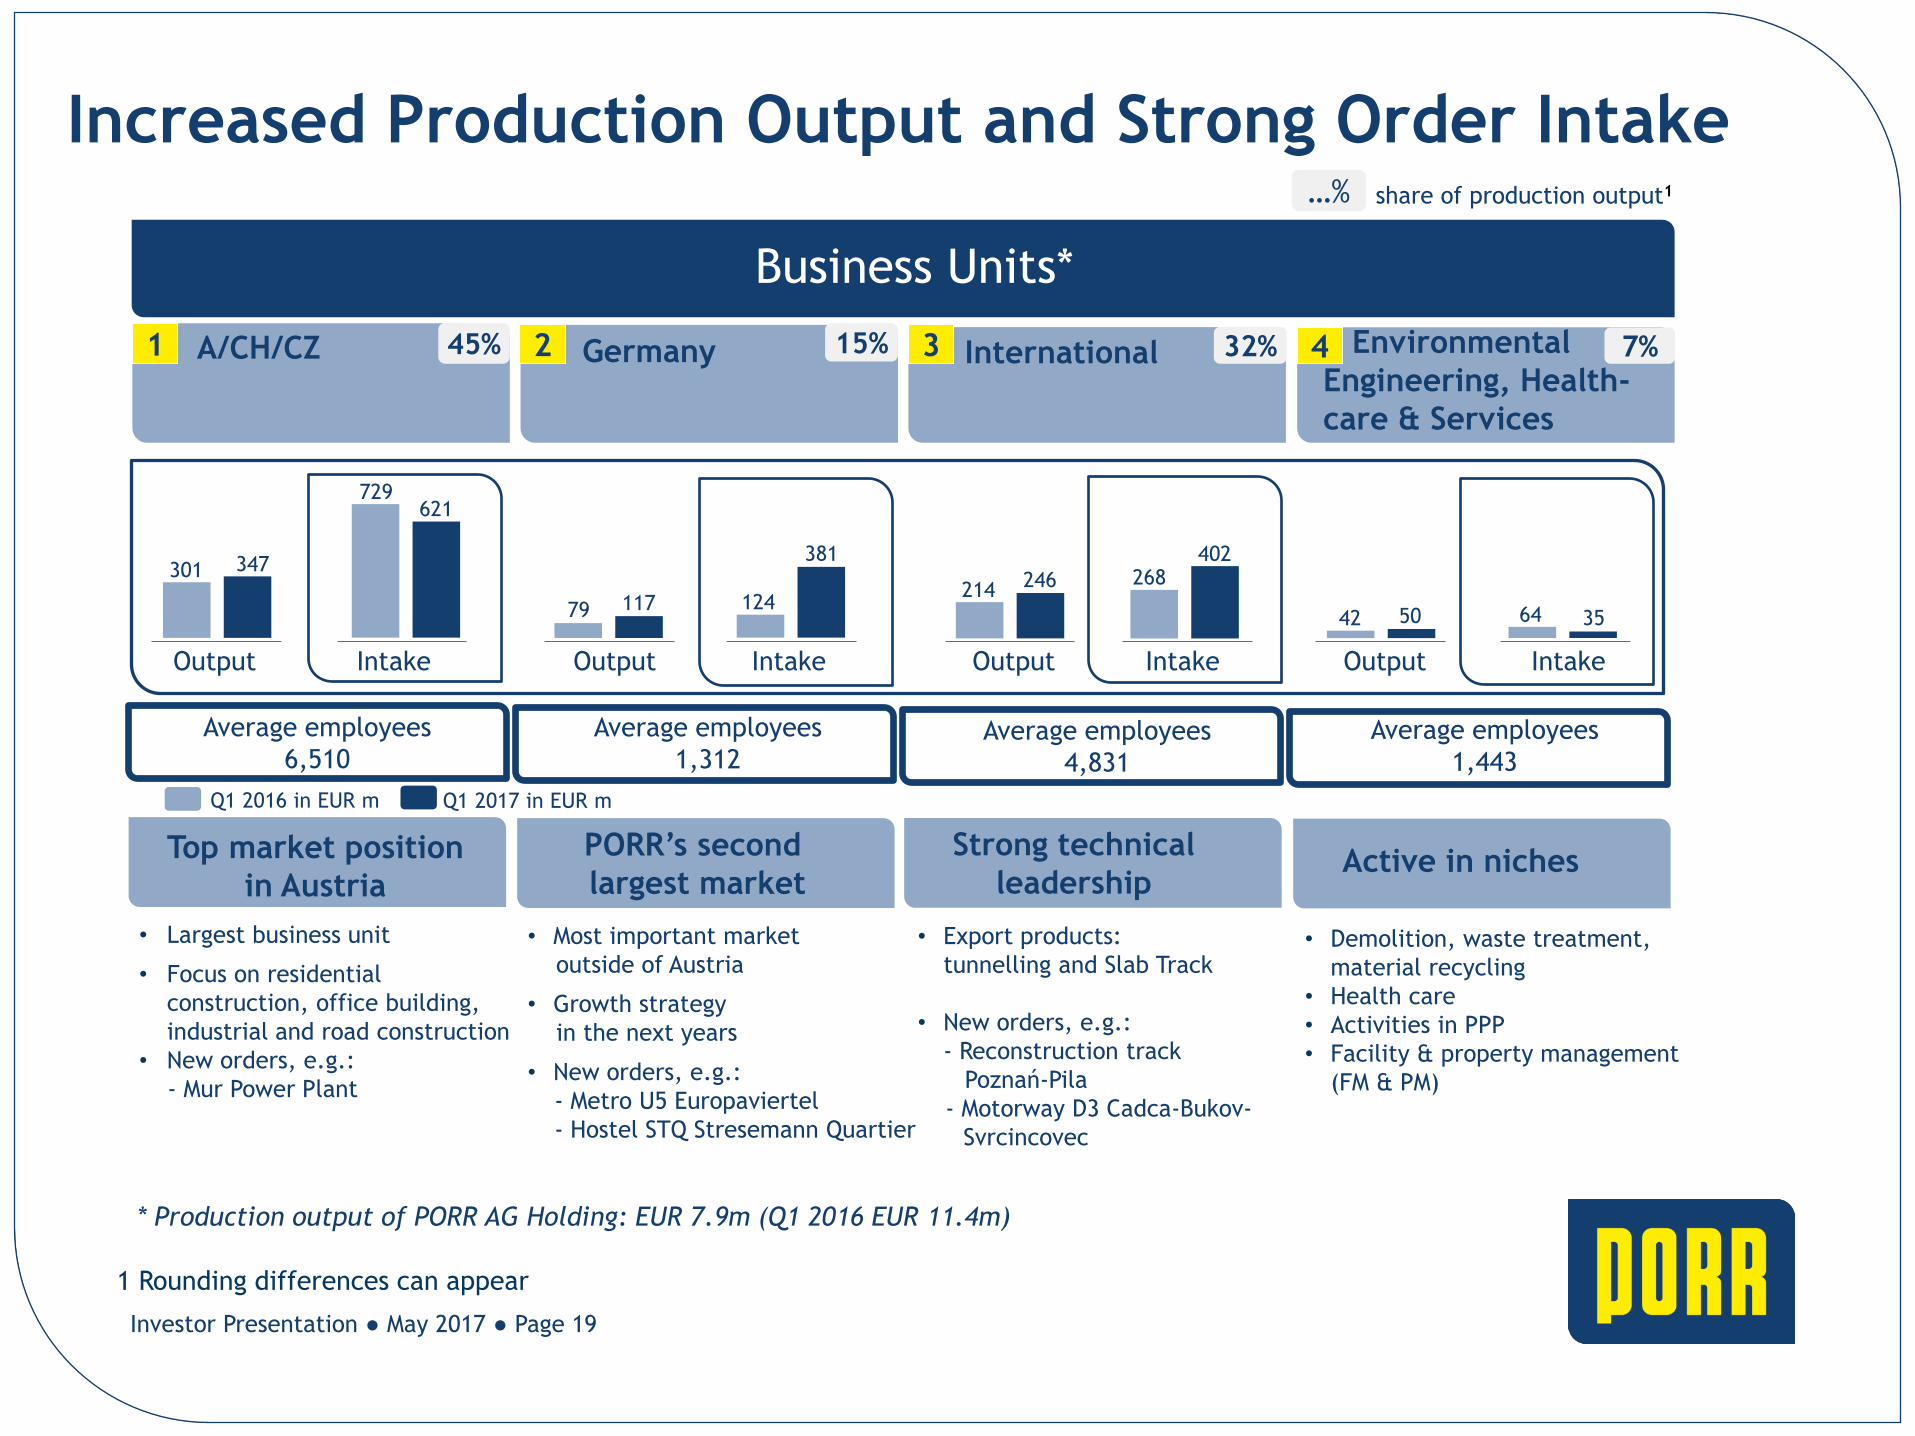
Increased Production Output and Strong Order Intake
• Largest business unit
• Focus on residential
construction, office building,
industrial and road construction
• New orders, e.g.:
- Mur Power Plant
• Most important market
outside of Austria
• Growth strategy
in the next years
• New orders, e.g.:
- Metro U5 Europaviertel
- Hostel STQ Stresemann Quartier
• Export products:
tunnelling and Slab Track
• New orders, e.g.:
- Reconstruction track
Poznań-Pila
- Motorway D3 Cadca-Bukov-
Svrcincovec
• Demolition, waste treatment,
material recycling
• Health care
• Activities in PPP
• Facility & property management
(FM & PM)
Output Intake Output Intake Output Intake Output Intake
729 621
79 117 124
381
214 246 268 402
42 50 64 35
Environmental
Engineering, Health-
care & Services
share of production output1
1 A/CH/CZ 45% 2 Germany 15% International 32% 4 7%
…%
Q1 2016 in EUR m Q1 2017 in EUR m
Top market position
in Austria
PORR’s second
largest market
Strong technical
leadership Active in niches
Business Units*
* Production output of PORR AG Holding: EUR 7.9m (Q1 2016 EUR 11.4m)
301 347
3
1 Rounding differences can appear
Investor Presentation ● May 2017 ● Page 19
Average employees
6,510
Average employees
1,312 Average employees
4,831
Average employees
1,443
5,149 5,527
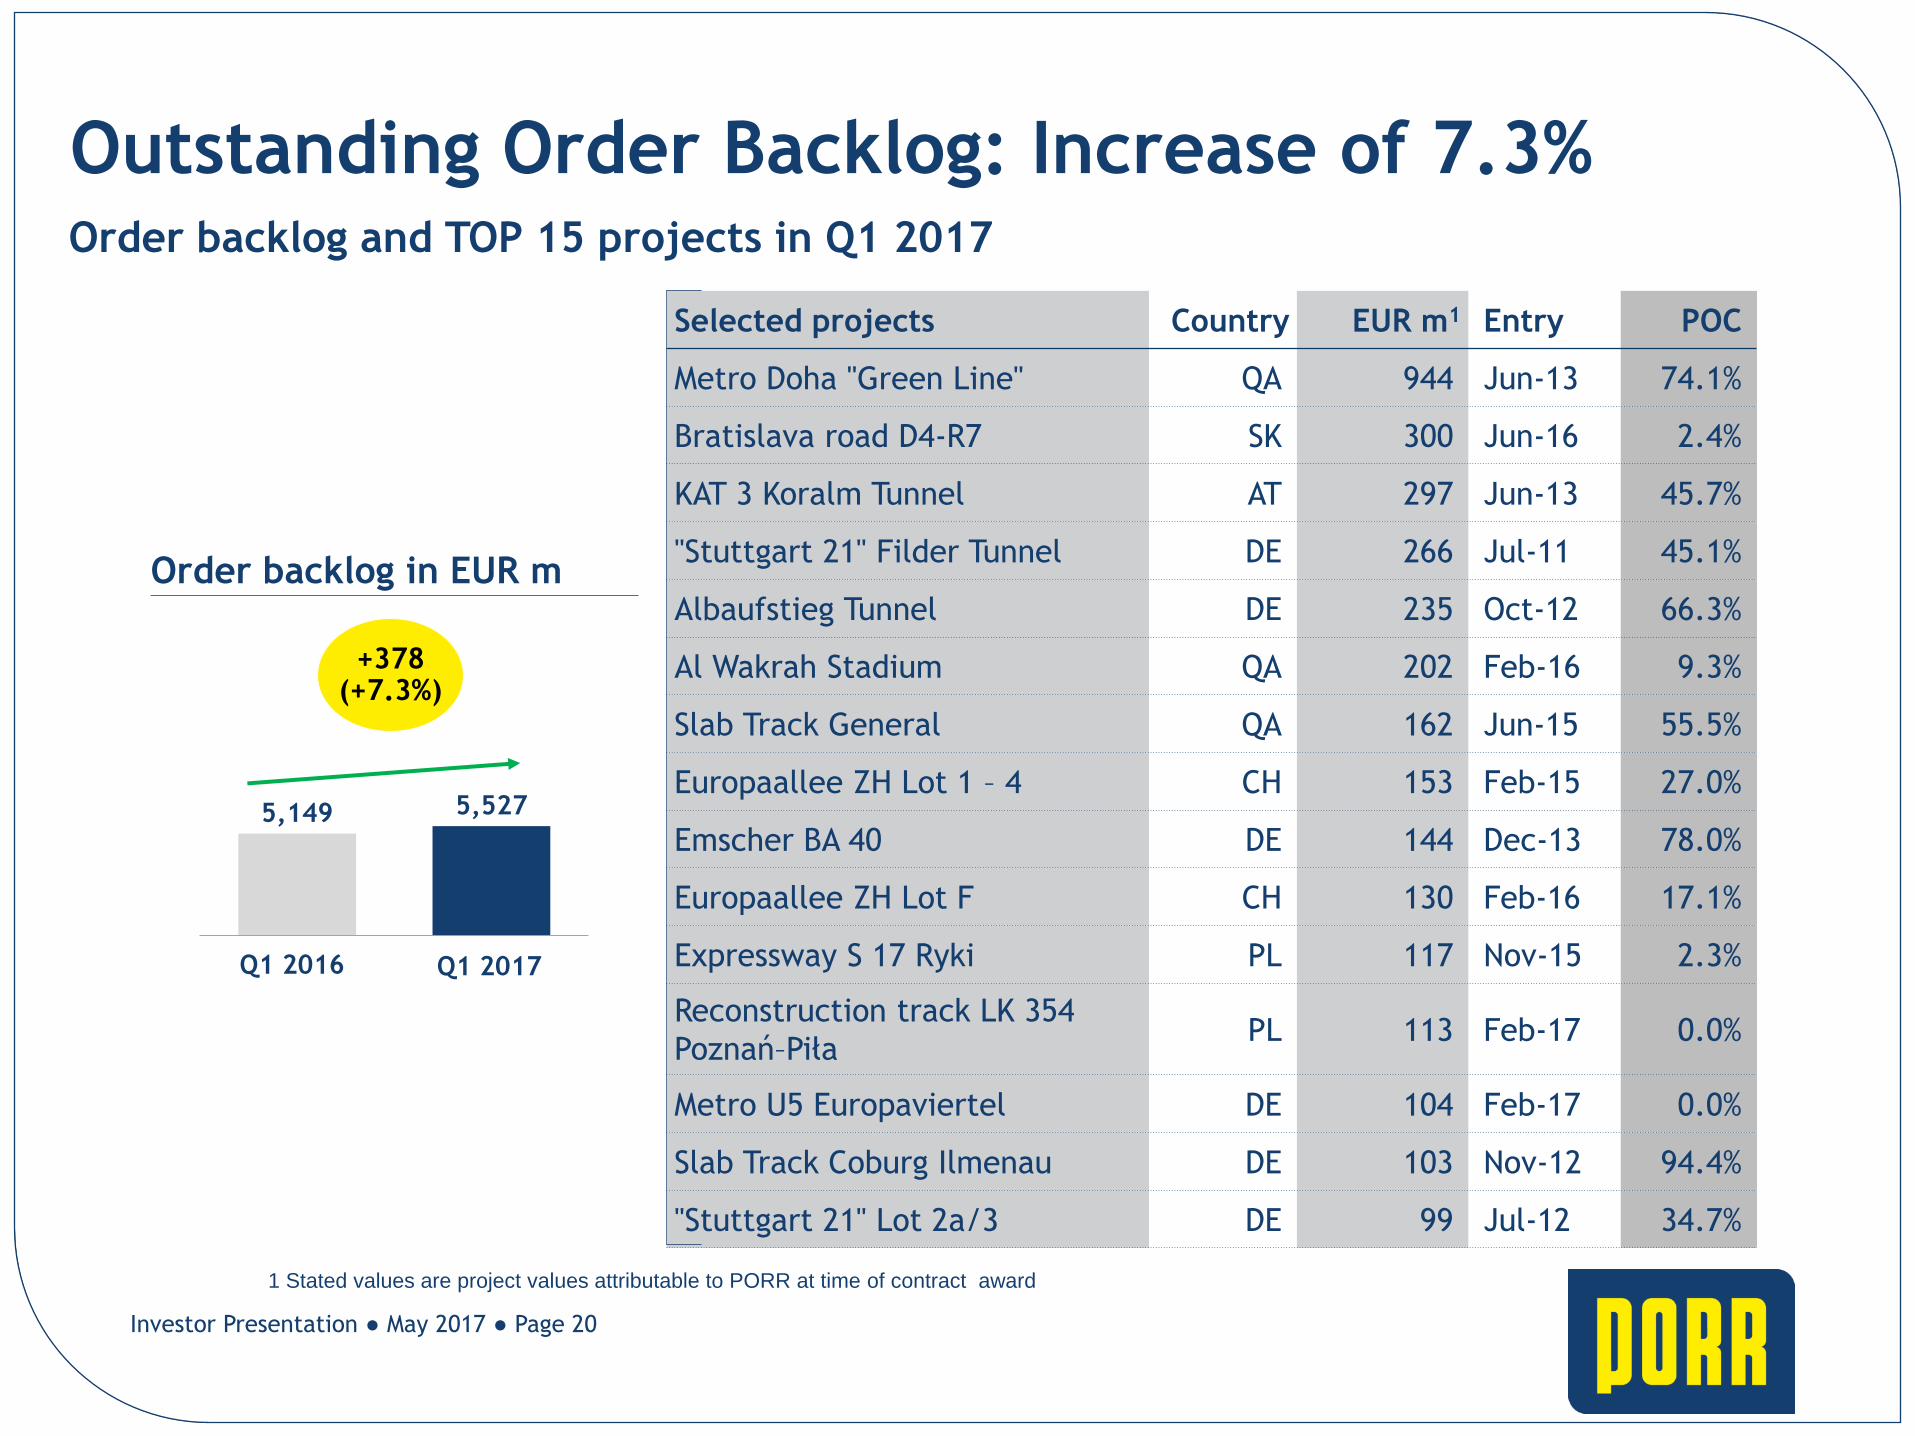
Outstanding Order Backlog: Increase of 7.3%
1 Stated values are project values attributable to PORR at time of contract award
AC RS HP
Selected projects Country EUR m1 Entry POC
Metro Doha "Green Line" QA 944 Jun-13 74.1%
Bratislava road D4-R7 SK 300 Jun-16 2.4%
KAT 3 Koralm Tunnel AT 297 Jun-13 45.7%
"Stuttgart 21" Filder Tunnel DE 266 Jul-11 45.1%
Albaufstieg Tunnel DE 235 Oct-12 66.3%
Al Wakrah Stadium QA 202 Feb-16 9.3%
Slab Track General QA 162 Jun-15 55.5%
Europaallee ZH Lot 1 – 4 CH 153 Feb-15 27.0%
Emscher BA 40 DE 144 Dec-13 78.0%
Europaallee ZH Lot F CH 130 Feb-16 17.1%
Expressway S 17 Ryki PL 117 Nov-15 2.3%
Reconstruction track LK 354
Poznań–Piła PL 113 Feb-17 0.0%
Metro U5 Europaviertel DE 104 Feb-17 0.0%
Slab Track Coburg Ilmenau DE 103 Nov-12 94.4%
"Stuttgart 21" Lot 2a/3 DE 99 Jul-12 34.7%
Order backlog in EUR m
+378 (+7.3%)
Order backlog and TOP 15 projects in Q1 2017
Q1 2016 Q1 2017
Investor Presentation ● May 2017 ● Page 20
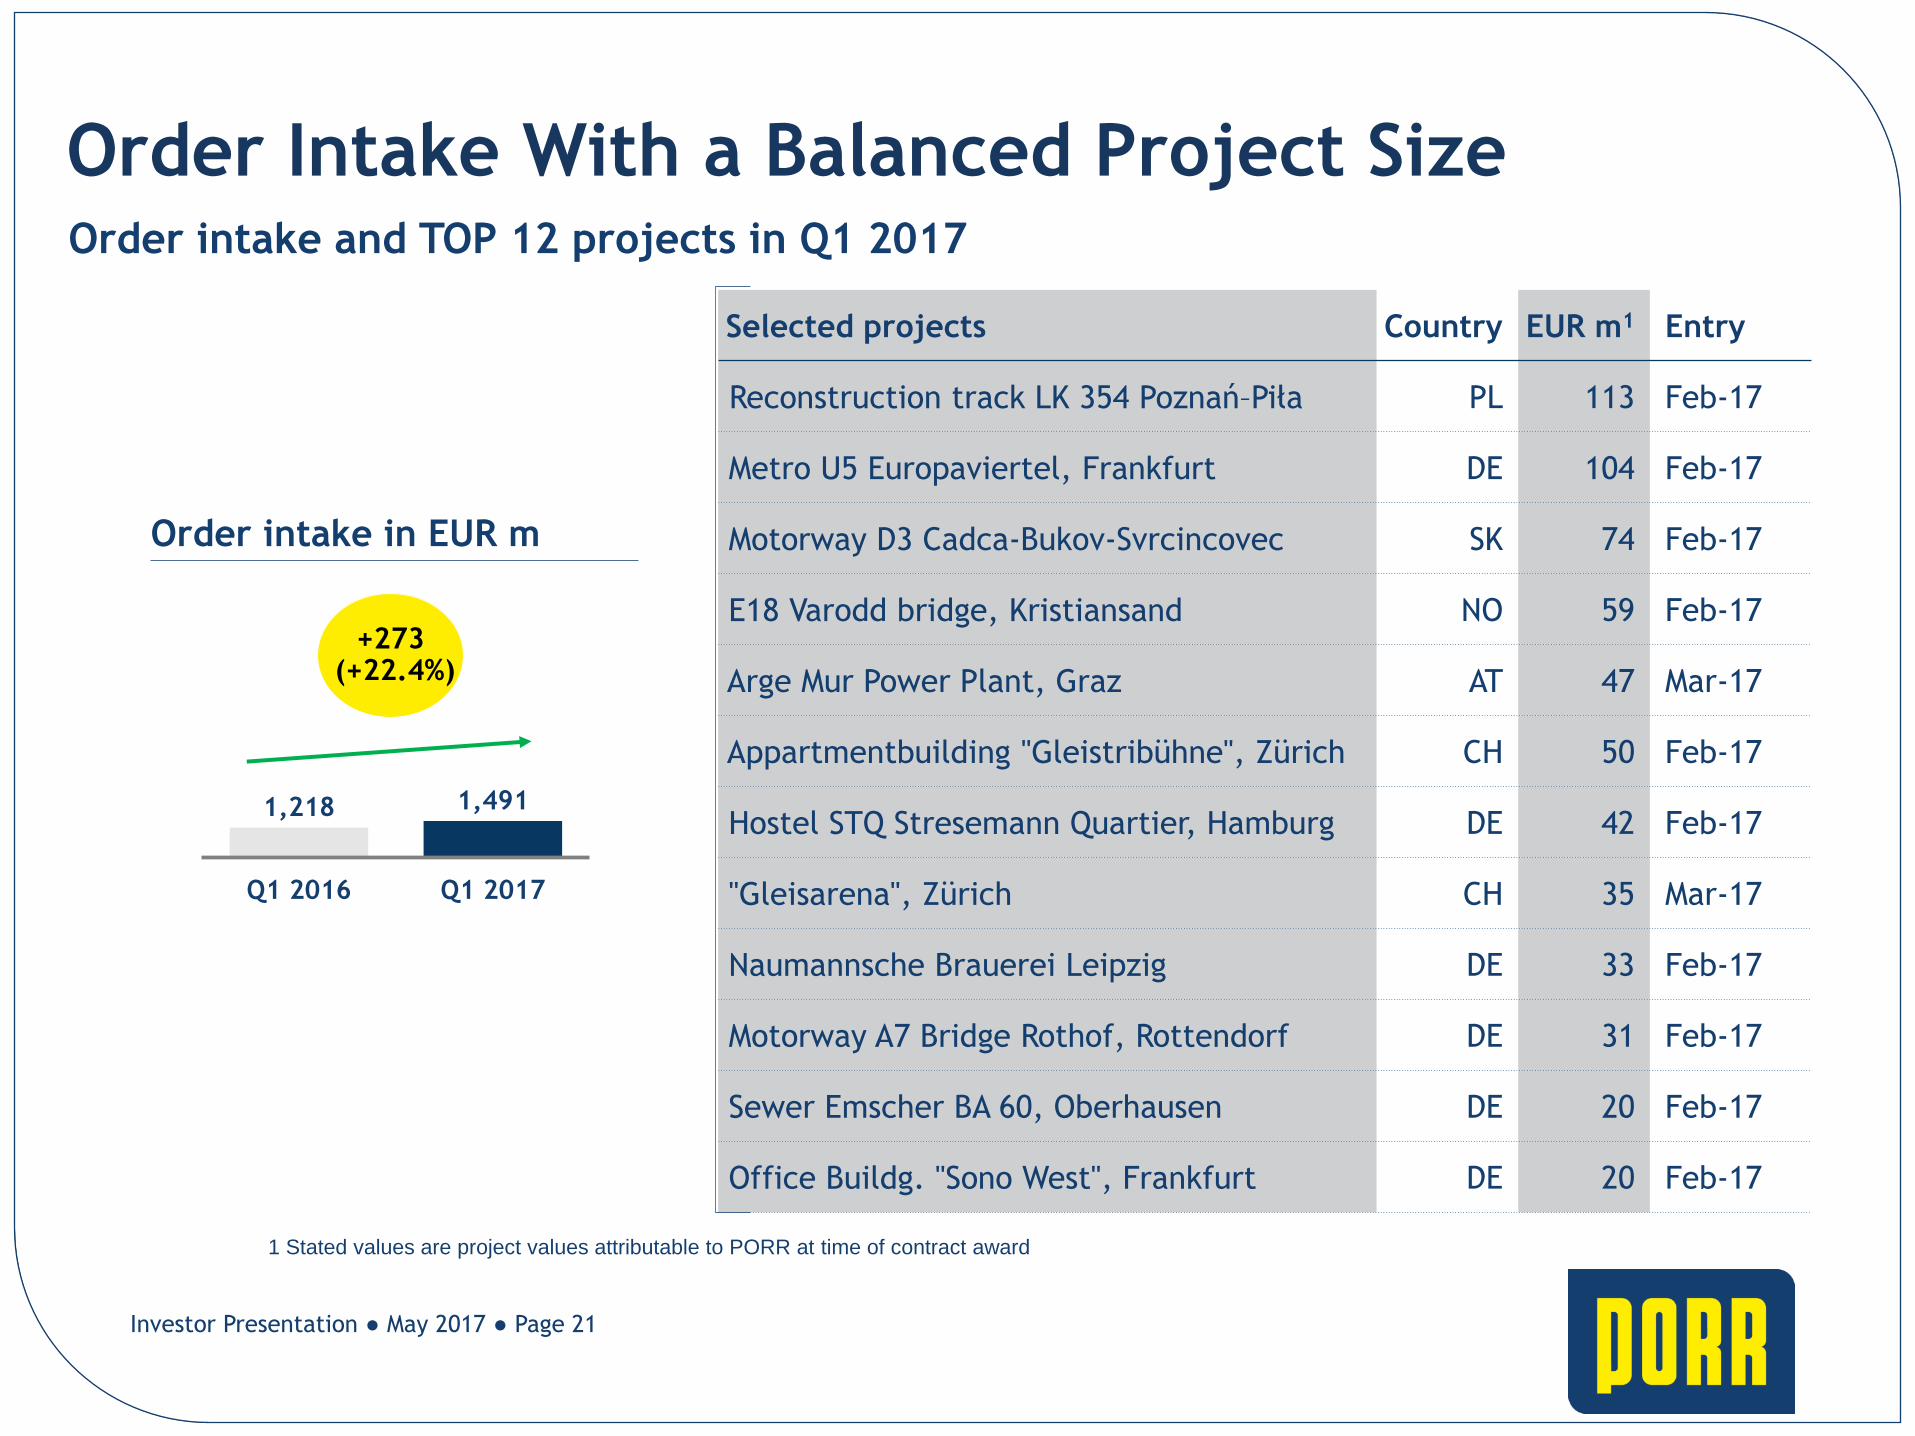
Order Intake With a Balanced Project Size
AC RS HP
Selected projects Country EUR m1 Entry
Reconstruction track LK 354 Poznań–Piła PL 113 Feb-17
Metro U5 Europaviertel, Frankfurt DE 104 Feb-17
Motorway D3 Cadca-Bukov-Svrcincovec SK 74 Feb-17
E18 Varodd bridge, Kristiansand NO 59 Feb-17
Arge Mur Power Plant, Graz AT 47 Mar-17
Appartmentbuilding "Gleistribühne", Zürich CH 50 Feb-17
Hostel STQ Stresemann Quartier, Hamburg DE 42 Feb-17
"Gleisarena", Zürich CH 35 Mar-17
Naumannsche Brauerei Leipzig DE 33 Feb-17
Motorway A7 Bridge Rothof, Rottendorf DE 31 Feb-17
Sewer Emscher BA 60, Oberhausen DE 20 Feb-17
Office Buildg. "Sono West", Frankfurt DE 20 Feb-17
Order intake in EUR m
+273 (+22.4%)
Order intake and TOP 12 projects in Q1 2017
1,218 1,491
Q1 2016 Q1 2017
1 Stated values are project values attributable to PORR at time of contract award
Investor Presentation ● May 2017 ● Page 21
04 Financial Section
Investor Presentation ● May 2017 ● Page 22
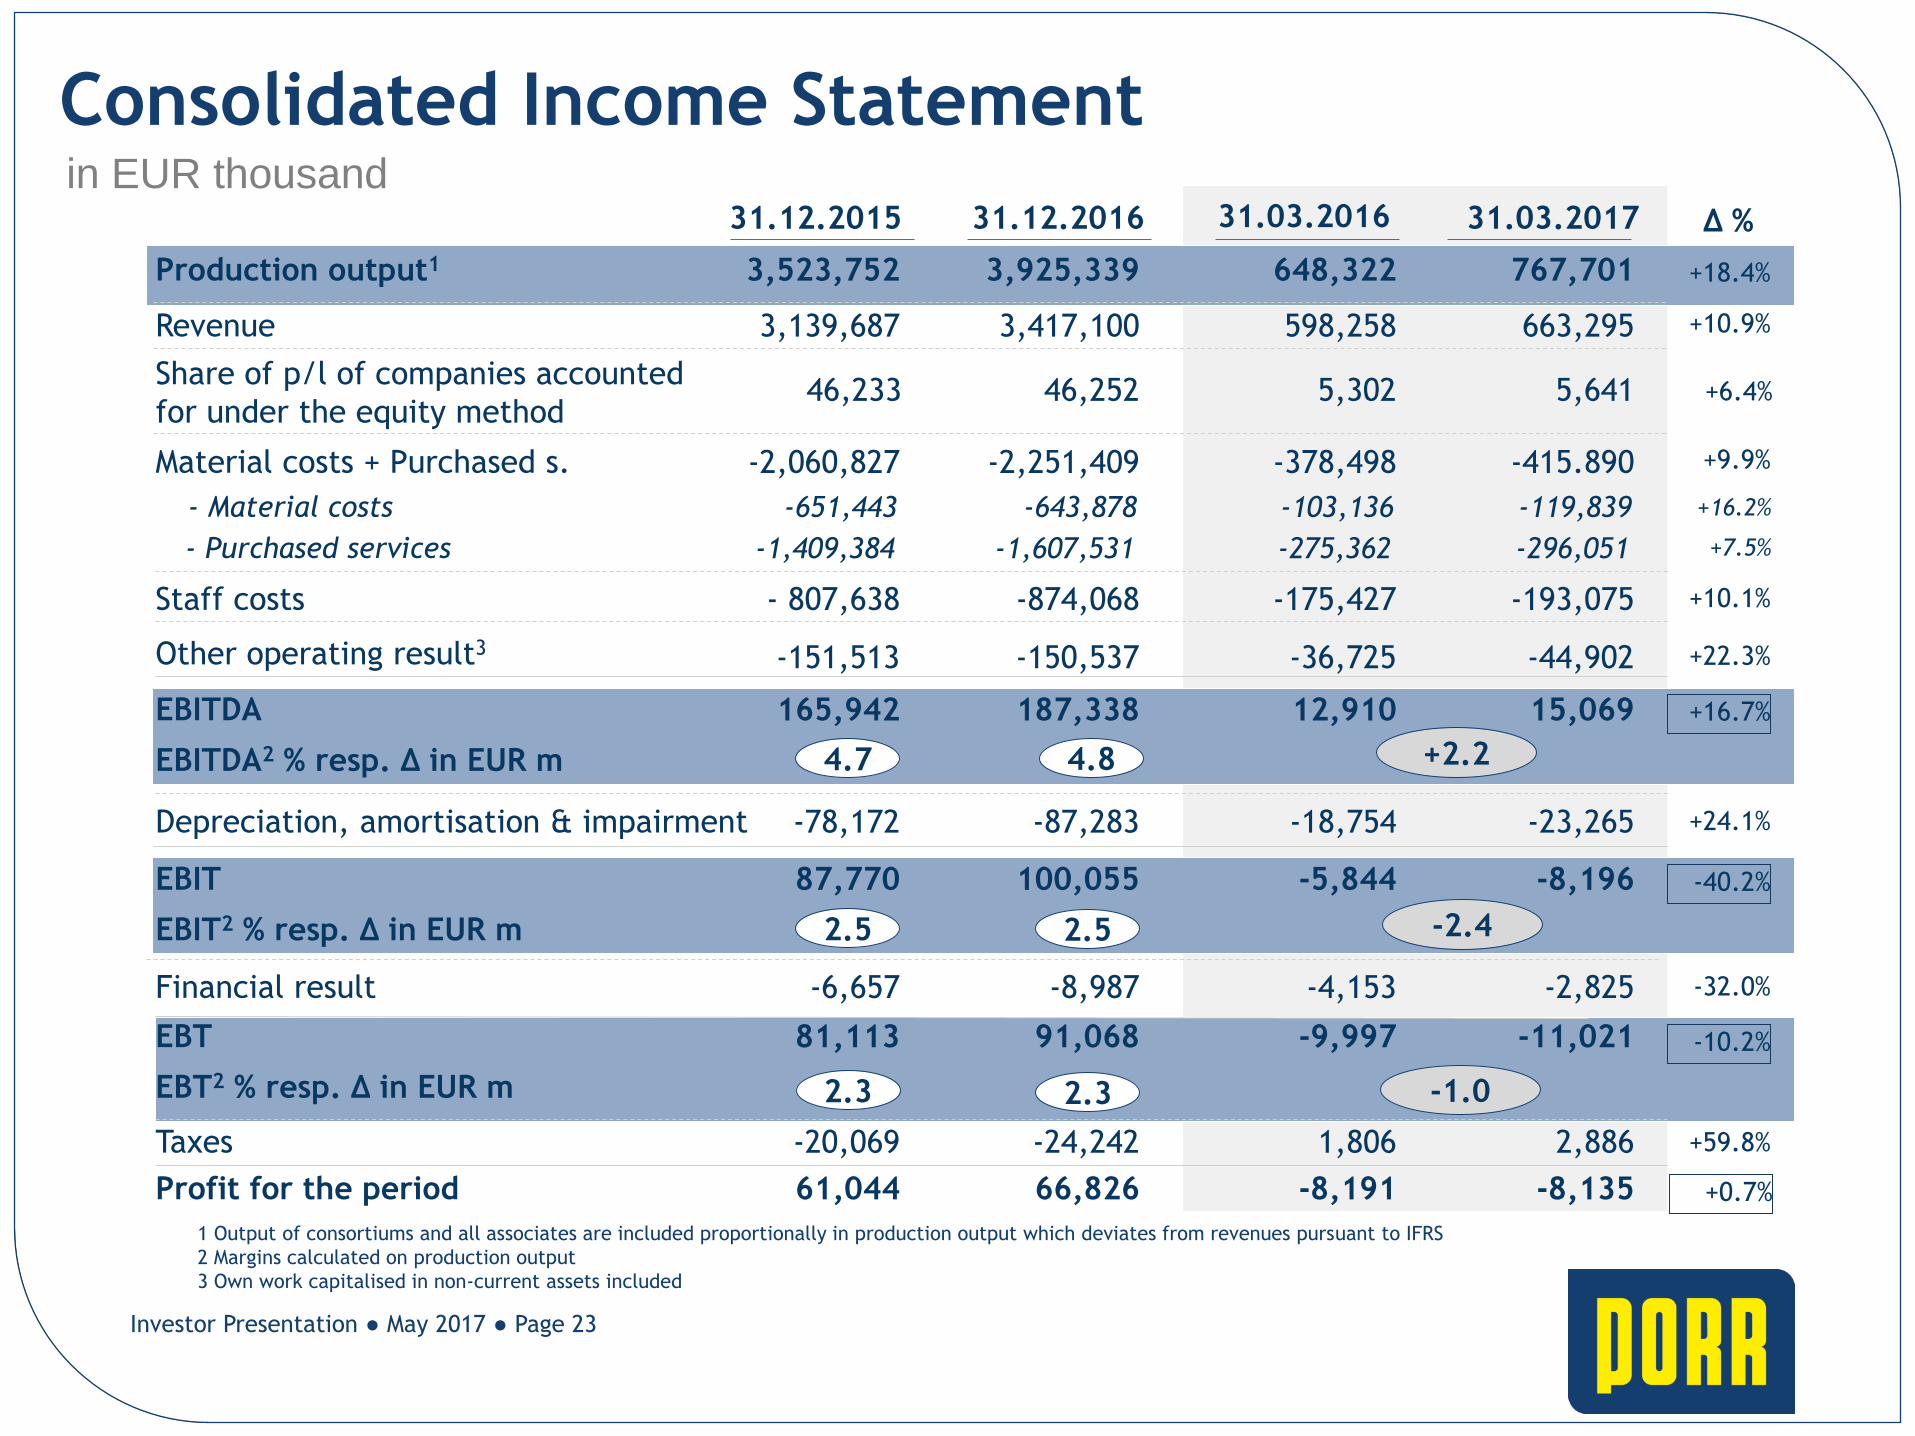
Consolidated Income Statement
in EUR thousand
1 Output of consortiums and all associates are included proportionally in production output which deviates from revenues pursuant to IFRS
2 Margins calculated on production output
3 Own work capitalised in non-current assets included
Material costs + Purchased s. -2,060,827
Staff costs - 807,638
Other operating result3 -151,513
Depreciation, amortisation & impairment -78,172
Financial result -6,657
Taxes -20,069
Profit for the period 61,044
Revenue 3,139,687
EBITDA 165,942
EBIT 87,770
EBT 81,113
Production output1 3,523,752
31.12.2015
EBITDA2 % resp. ∆ in EUR m
EBIT2 % resp. ∆ in EUR m
EBT2 % resp. ∆ in EUR m 2.3
4.7
2.5
AC RS HP
- Material costs -651,443
- Purchased services -1,409,384
∆ %
+18.4%
+10.9%
+9.9%
+16.2%
+7.5%
+10.1%
+22.3%
+16.7%
-10.2%
-32.0%
-40.2%
+24.1%
+59.8%
+0.7%
31.12.2016
-2,251,409
-874,068
-150,537
-87,283
-8,987
-24,242
66,826
3,417,100
187,338
100,055
91,068
3,925,339
-643,878
-1,607,531
4.8
2.5
2.3
Share of p/l of companies accounted
for under the equity method 46,233 46,252 +6.4%
Investor Presentation ● May 2017 ● Page 23
31.03.2016
-378,498
-175,427
-36,725
-18,754
-4,153
1,806
-8,191
598,258
12,910
-5,844
-9,997
648,322
-103,136
-275,362
+2.2
5,302
31.03.2017
-415.890
-193,075
-44,902
-23,265
-2,825
2,886
-8,135
663,295
15,069
-8,196
-11,021
767,701
-119,839
-296,051
5,641
-2.4
-1.0
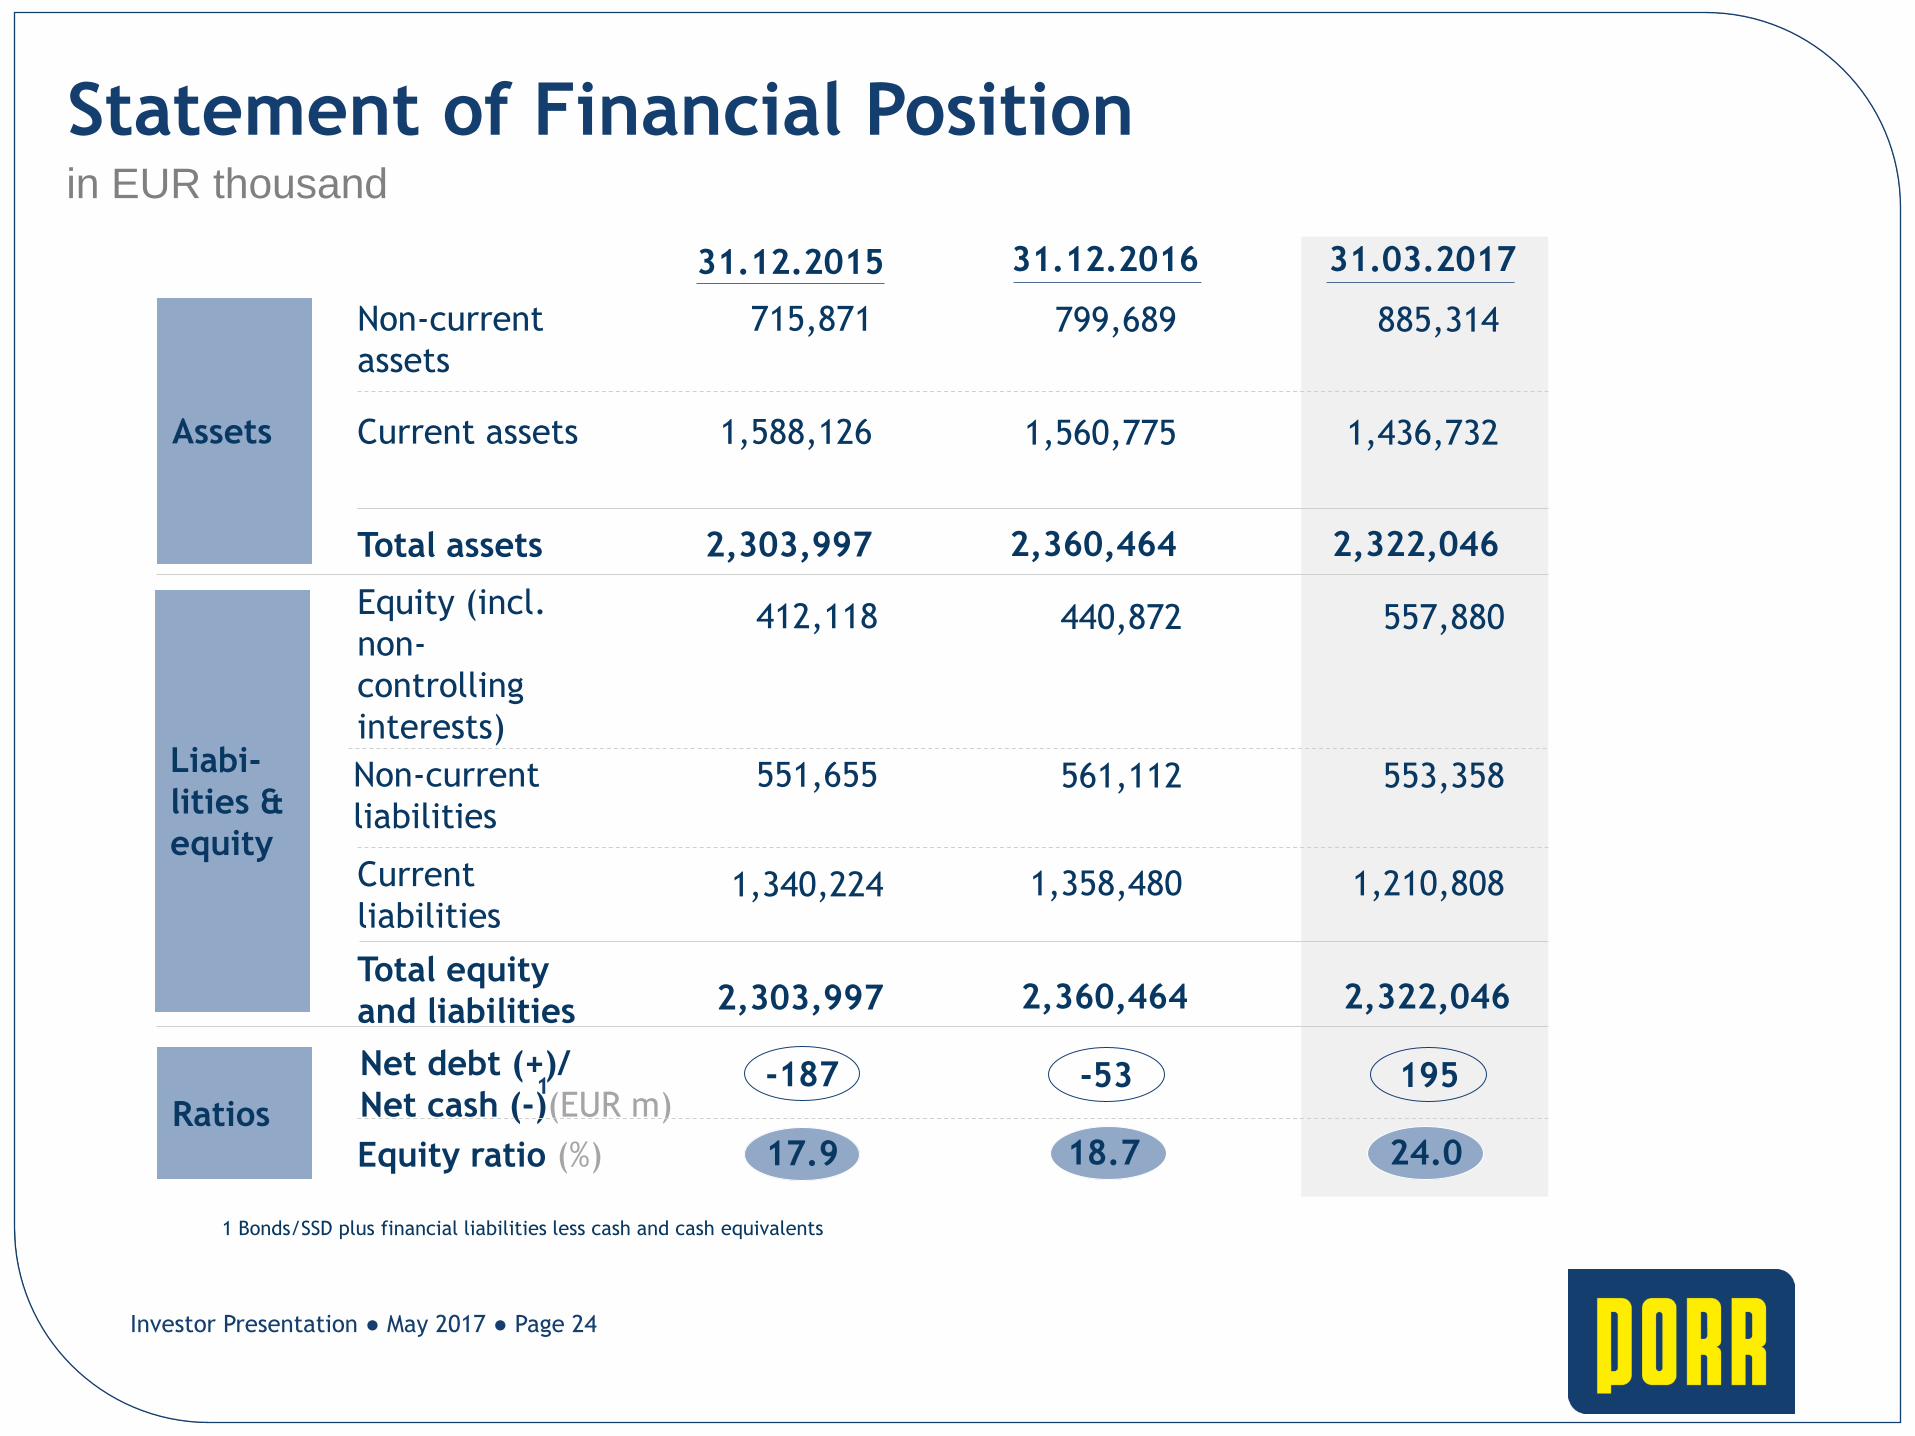
Statement of Financial Position in EUR thousand
1 Bonds/SSD plus financial liabilities less cash and cash equivalents
Liabi-
lities &
equity
Assets
Non-current
liabilities
Current
liabilities
Equity (incl.
non-
controlling
interests)
Total equity
and liabilities
Total assets
Current assets
Non-current
assets
Ratios
Net debt (+)/
Net cash (-)(EUR m)
Equity ratio (%)
1
1,588,126
551,655
1,340,224
412,118
2,303,997
2,303,997
715,871
31.12.2015
17.9
-187
AC RS HP
31.12.2016
1,560,775
561,112
1,358,480
440,872
2,360,464
2,360,464
799,689
-53
18.7
Investor Presentation ● May 2017 ● Page 24
31.03.2017
1,436,732
553,358
1,210,808
557,880
2,322,046
2,322,046
885,314
195
24.0
05 Key Takeaways
Investor Presentation ● May 2017 ● Page 25
1
3
4
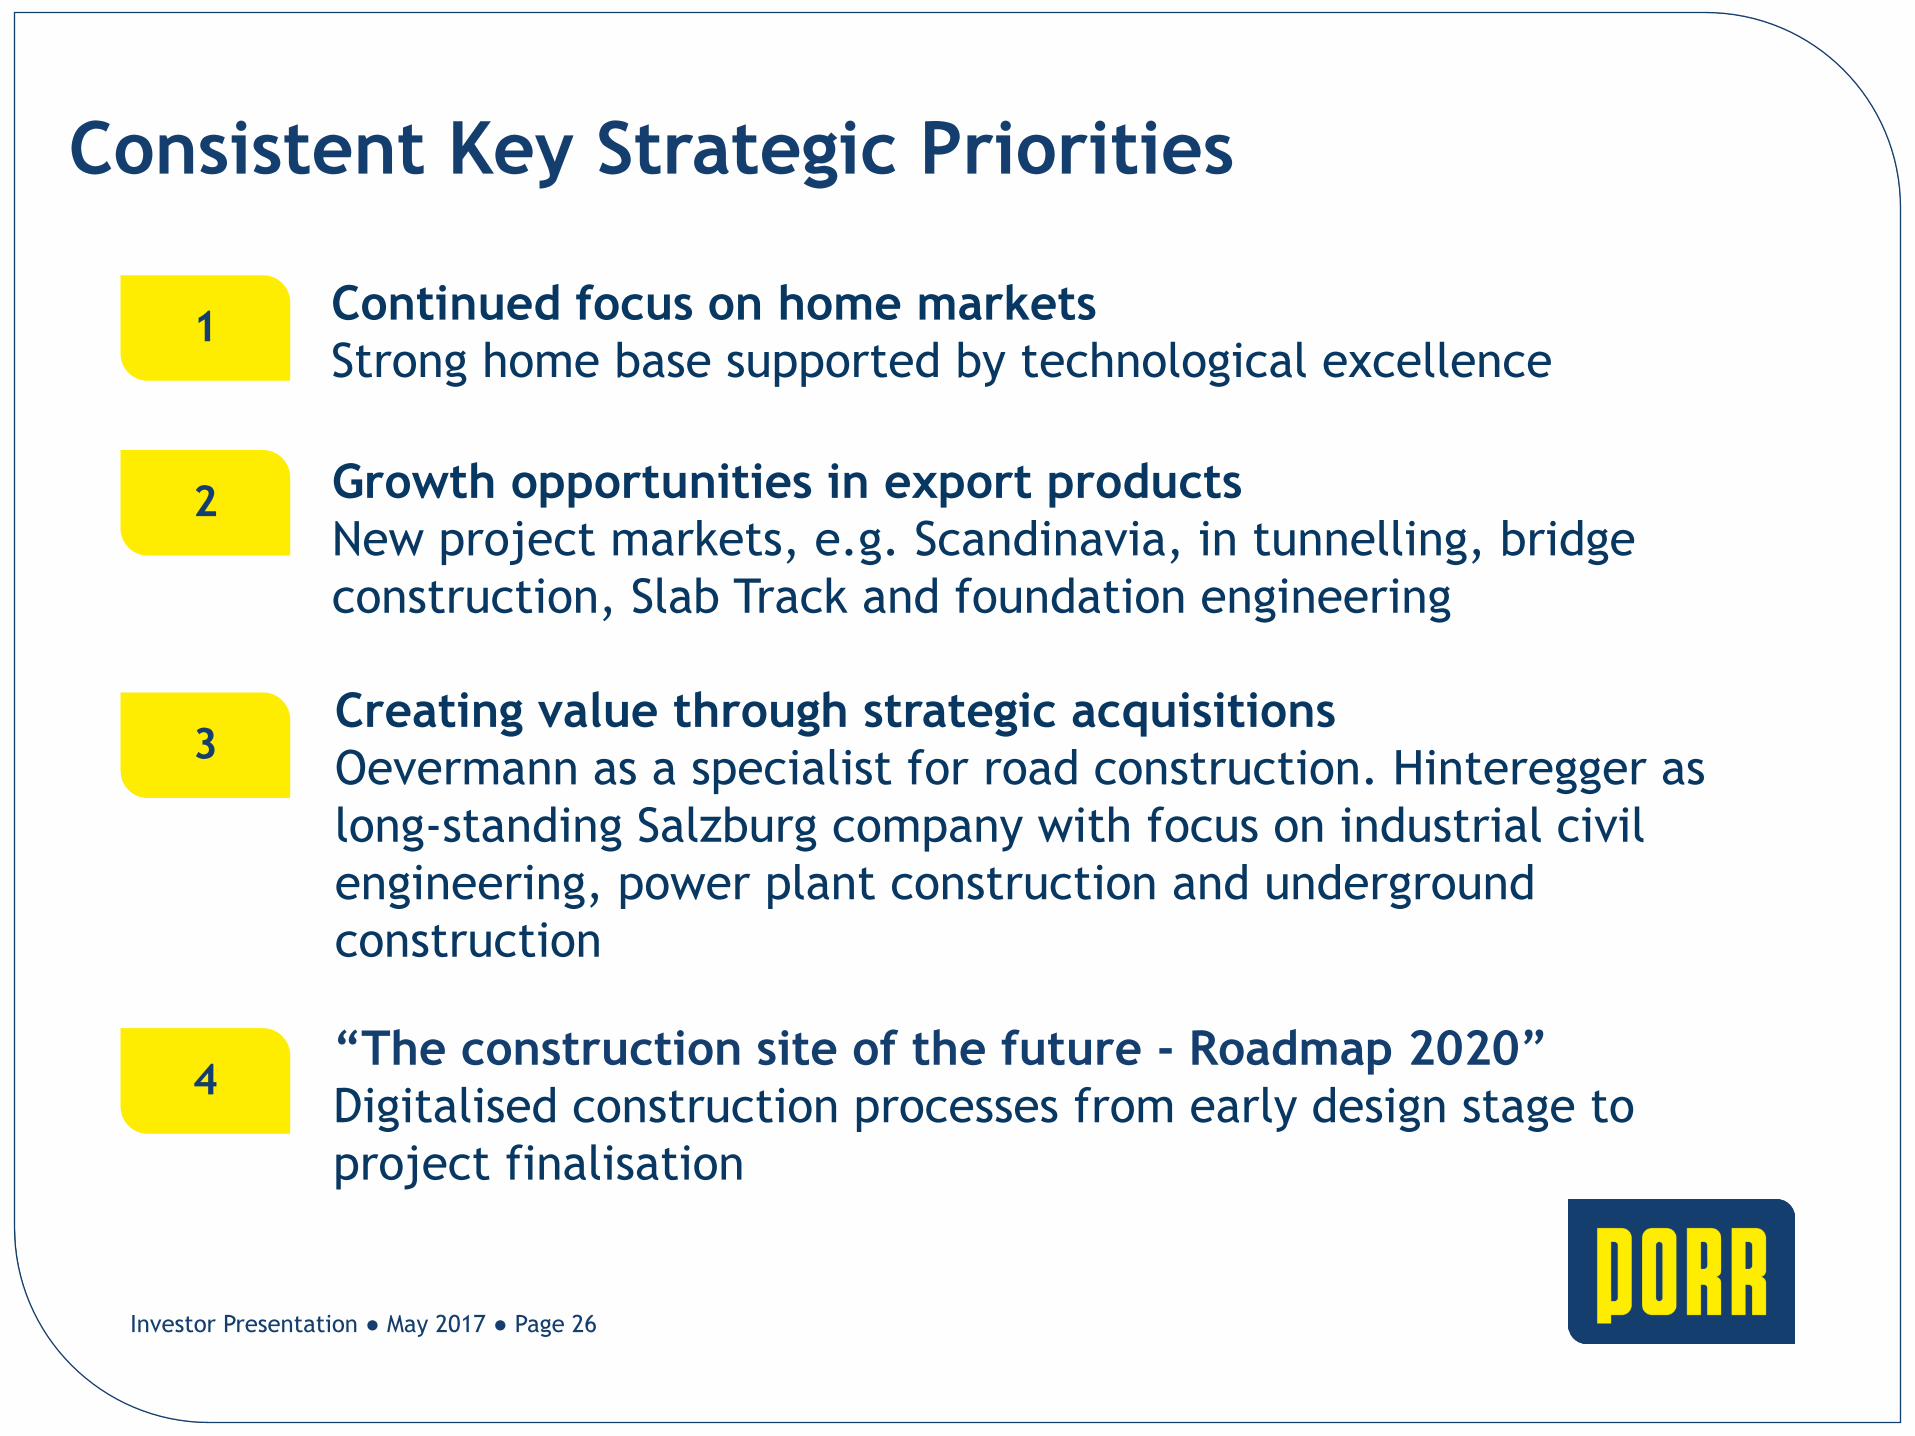
Continued focus on home markets
Strong home base supported by technological excellence
Creating value through strategic acquisitions
Oevermann as a specialist for road construction. Hinteregger as
long-standing Salzburg company with focus on industrial civil
engineering, power plant construction and underground
construction
“The construction site of the future - Roadmap 2020”
Digitalised construction processes from early design stage to
project finalisation
Consistent Key Strategic Priorities
Growth opportunities in export products
New project markets, e.g. Scandinavia, in tunnelling, bridge
construction, Slab Track and foundation engineering
2
Investor Presentation ● May 2017 ● Page 26
06 Backup
Investor Presentation ● May 2017 ● Page 27
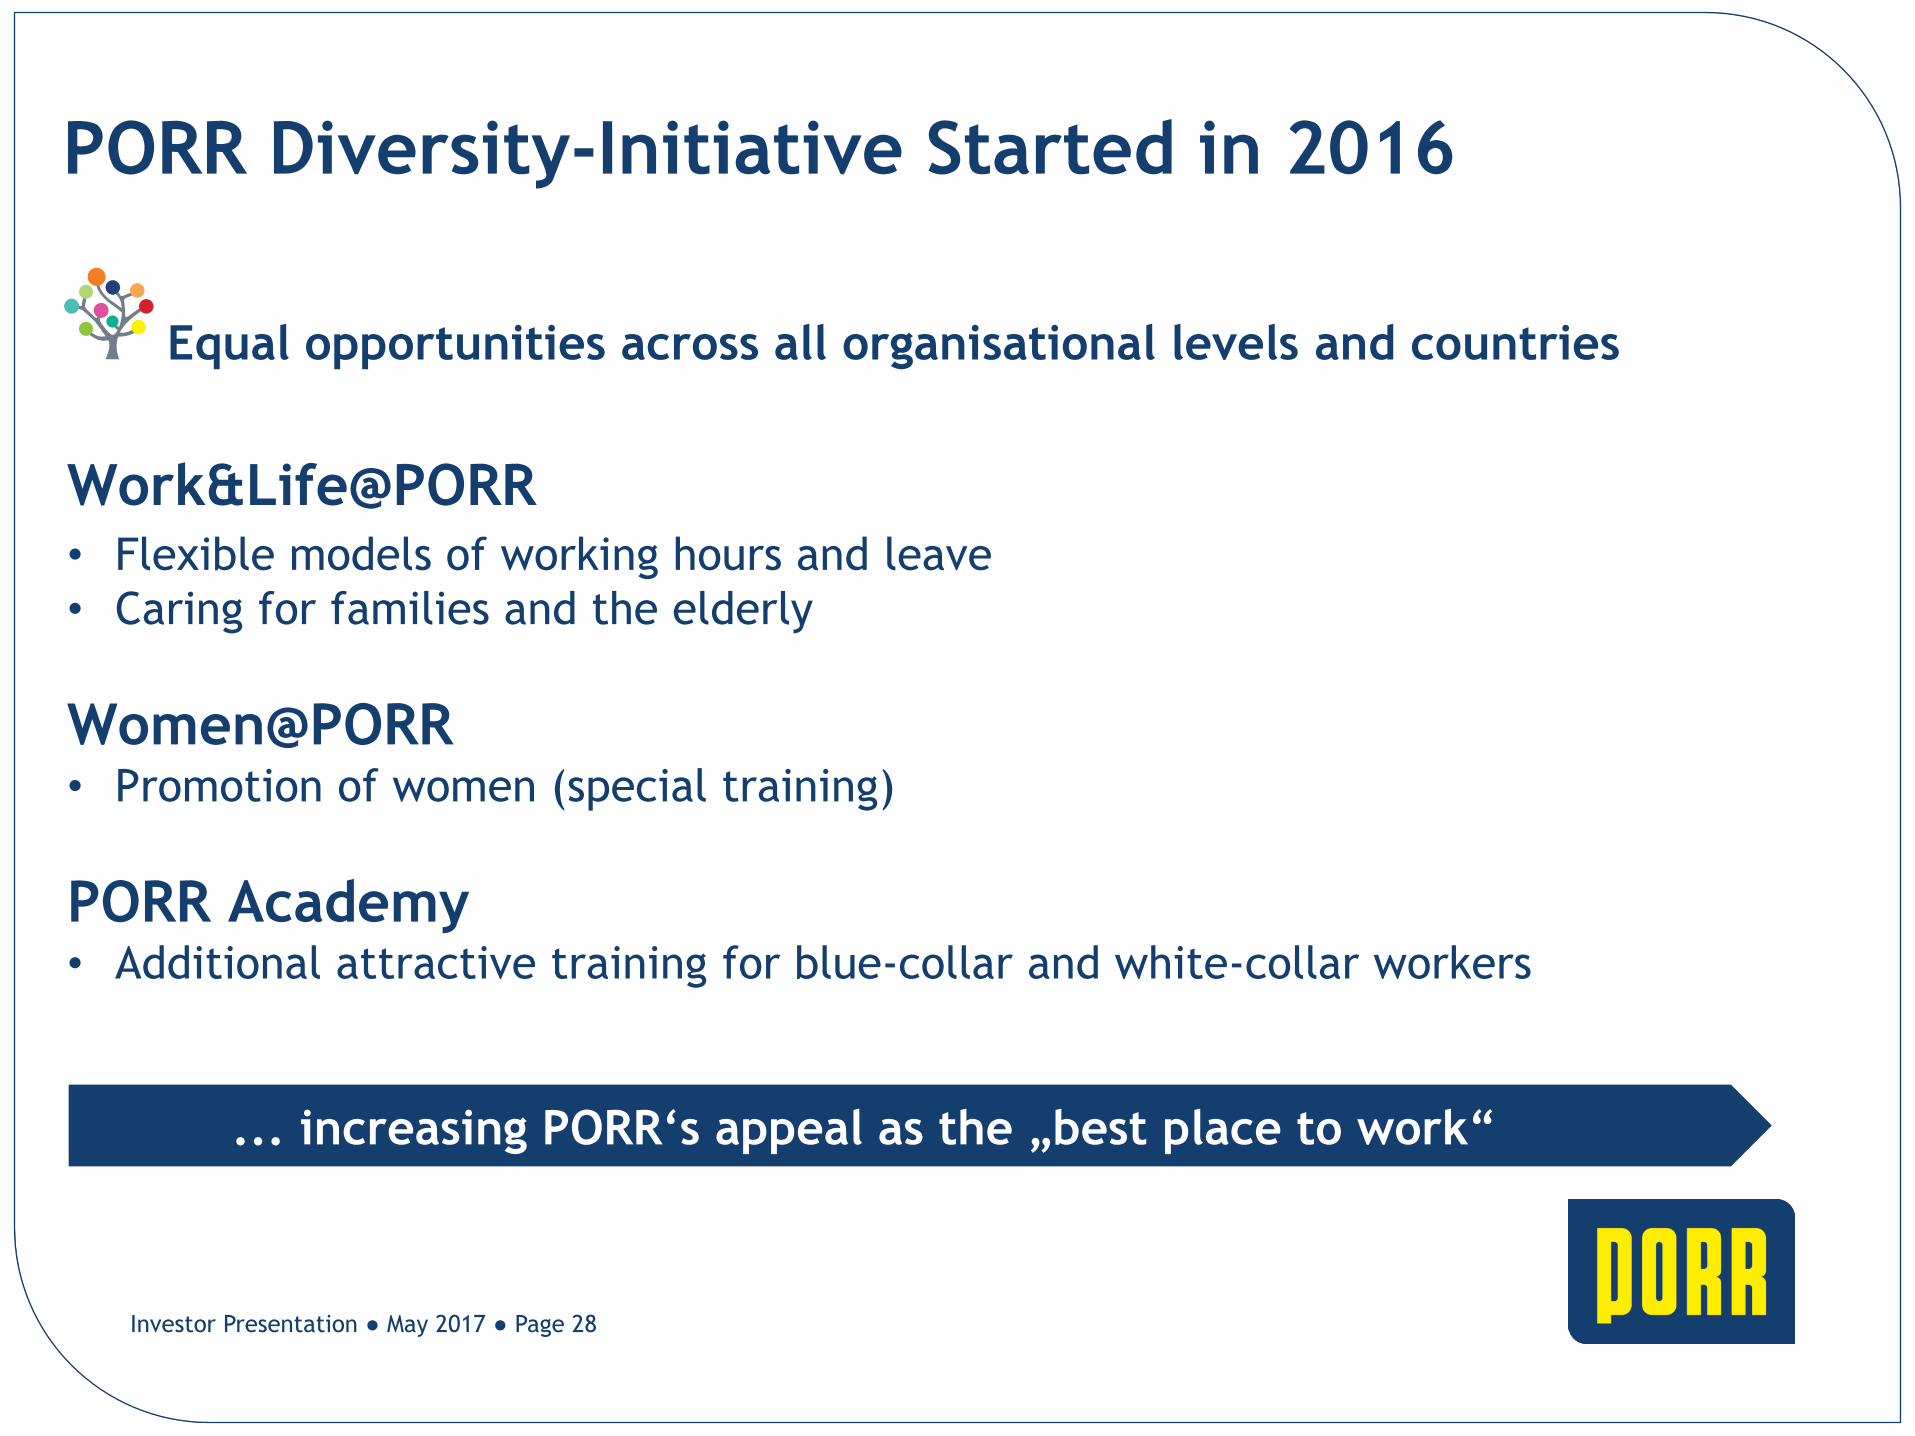
PORR Diversity-Initiative Started in 2016
... increasing PORR‘s appeal as the „best place to work“
Work&Life@PORR
• Flexible models of working hours and leave
• Caring for families and the elderly
Women@PORR • Promotion of women (special training)
PORR Academy • Additional attractive training for blue-collar and white-collar workers
Equal opportunities across all organisational levels and countries
Investor Presentation ● May 2017 ● Page 28
Control and steering mechanisms
RS HP
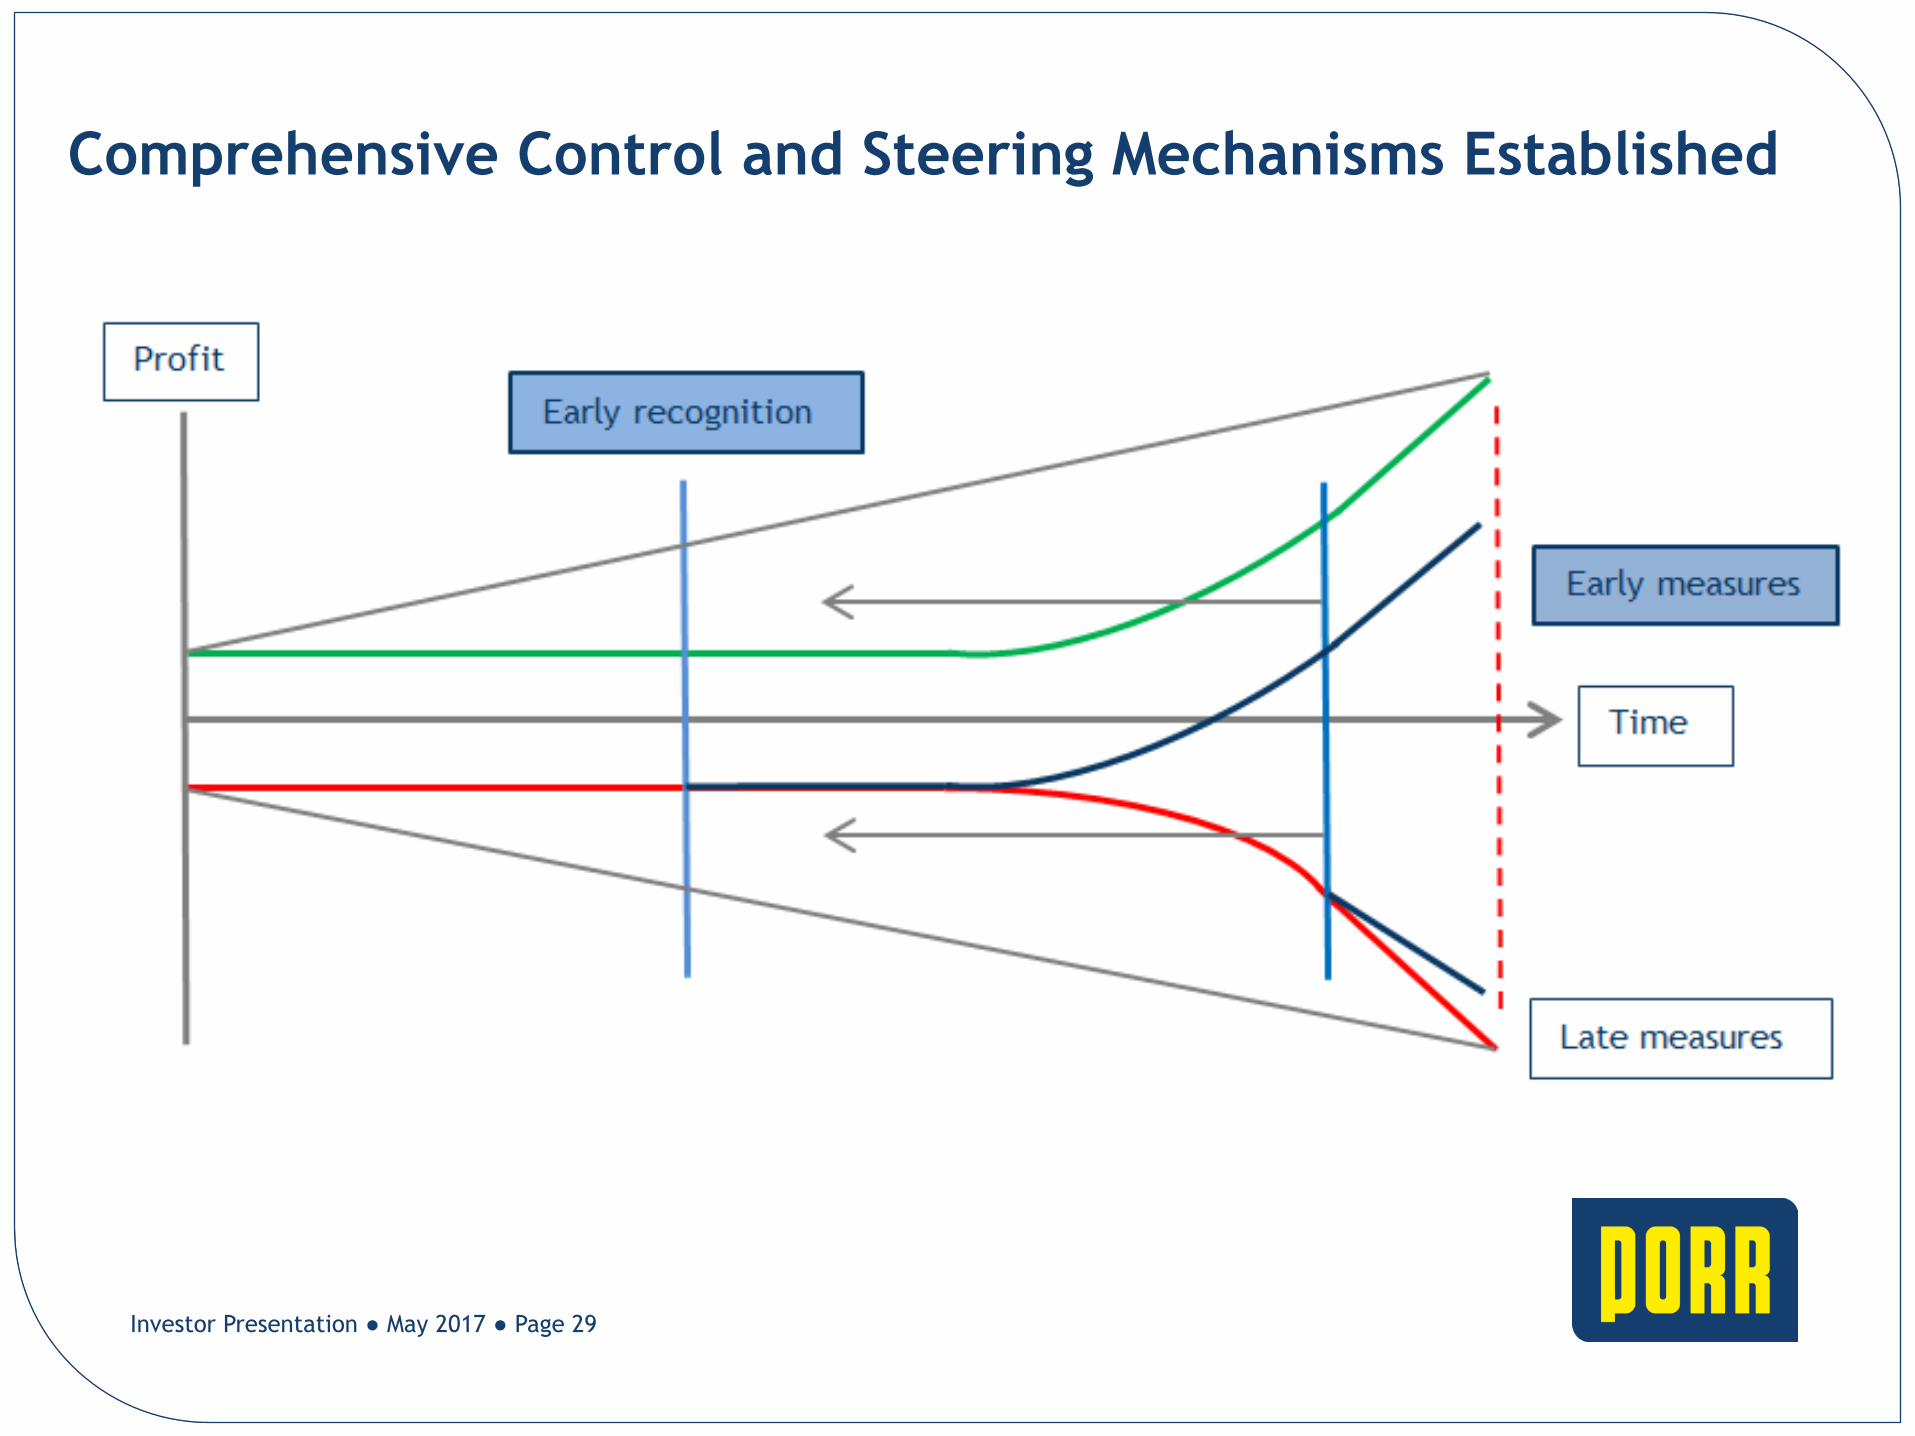
Comprehensive Control and Steering Mechanisms Established
Investor Presentation ● May 2017 ● Page 29
Healthy Balance Sheet – High Liquidity
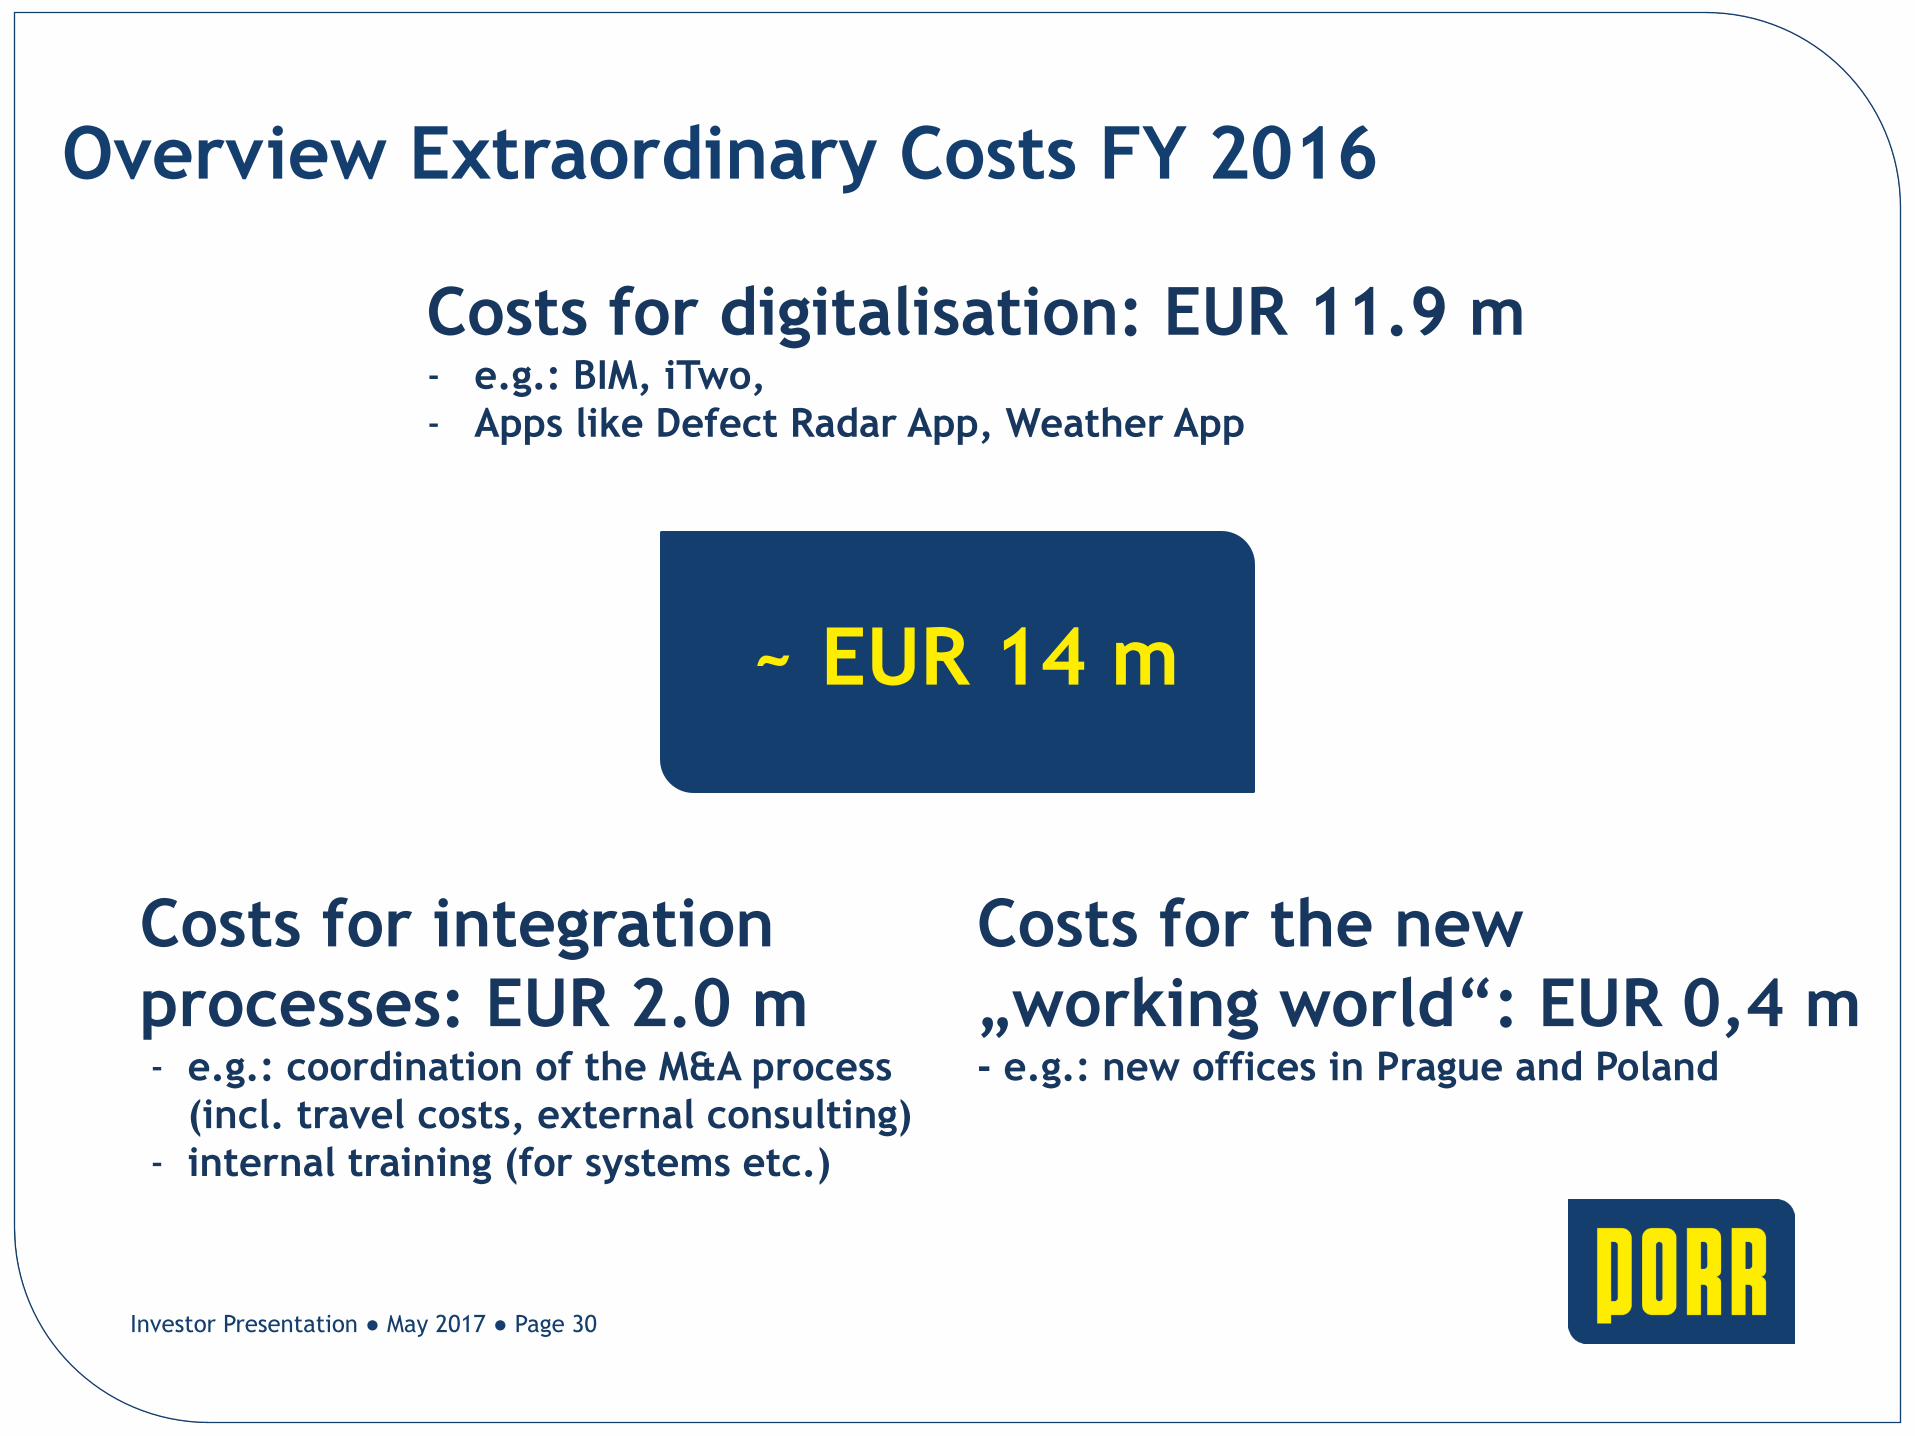
Costs for integration
processes: EUR 2.0 m - e.g.: coordination of the M&A process
(incl. travel costs, external consulting)
- internal training (for systems etc.)
Costs for digitalisation: EUR 11.9 m - e.g.: BIM, iTwo,
- Apps like Defect Radar App, Weather App
Costs for the new
„working world“: EUR 0,4 m - e.g.: new offices in Prague and Poland
AC HP RS
Overview Extraordinary Costs FY 2016
Investor Presentation ● May 2017 ● Page 30
~ EUR 14 m
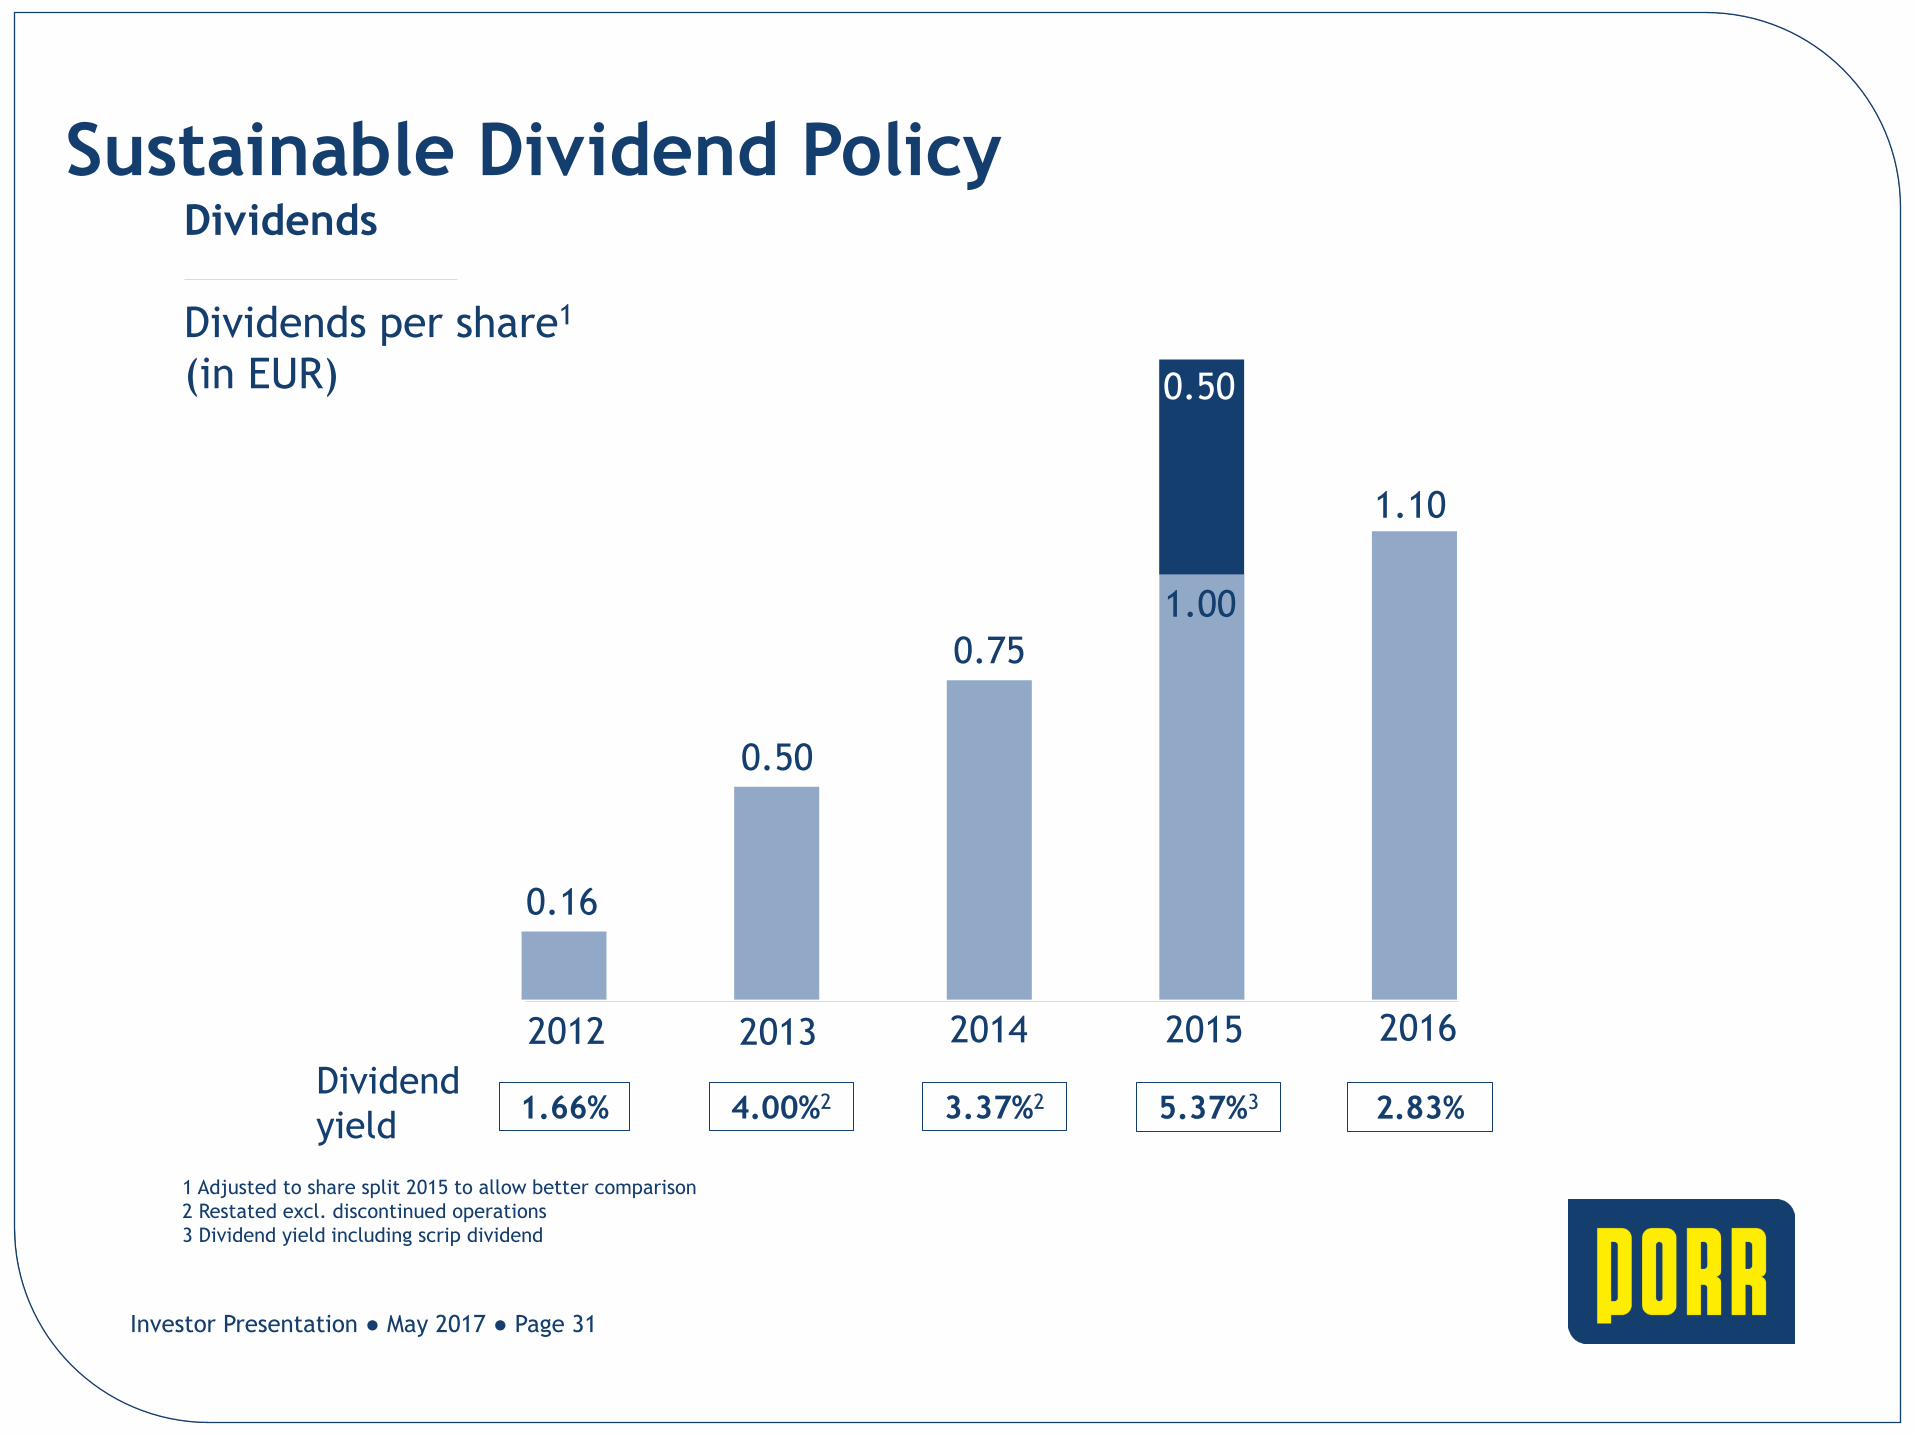
Sustainable Dividend Policy Dividends
Dividends per share1
(in EUR)
1 Adjusted to share split 2015 to allow better comparison
2 Restated excl. discontinued operations
3 Dividend yield including scrip dividend
AC RS HP
Dividend
yield 1.66% 4.00%2 3.37%2 5.37%3
2016 2015 2014 2013 2012
2.83%
0.75
0.50
0.16
1.00
0.50
1.10
Investor Presentation ● May 2017 ● Page 31
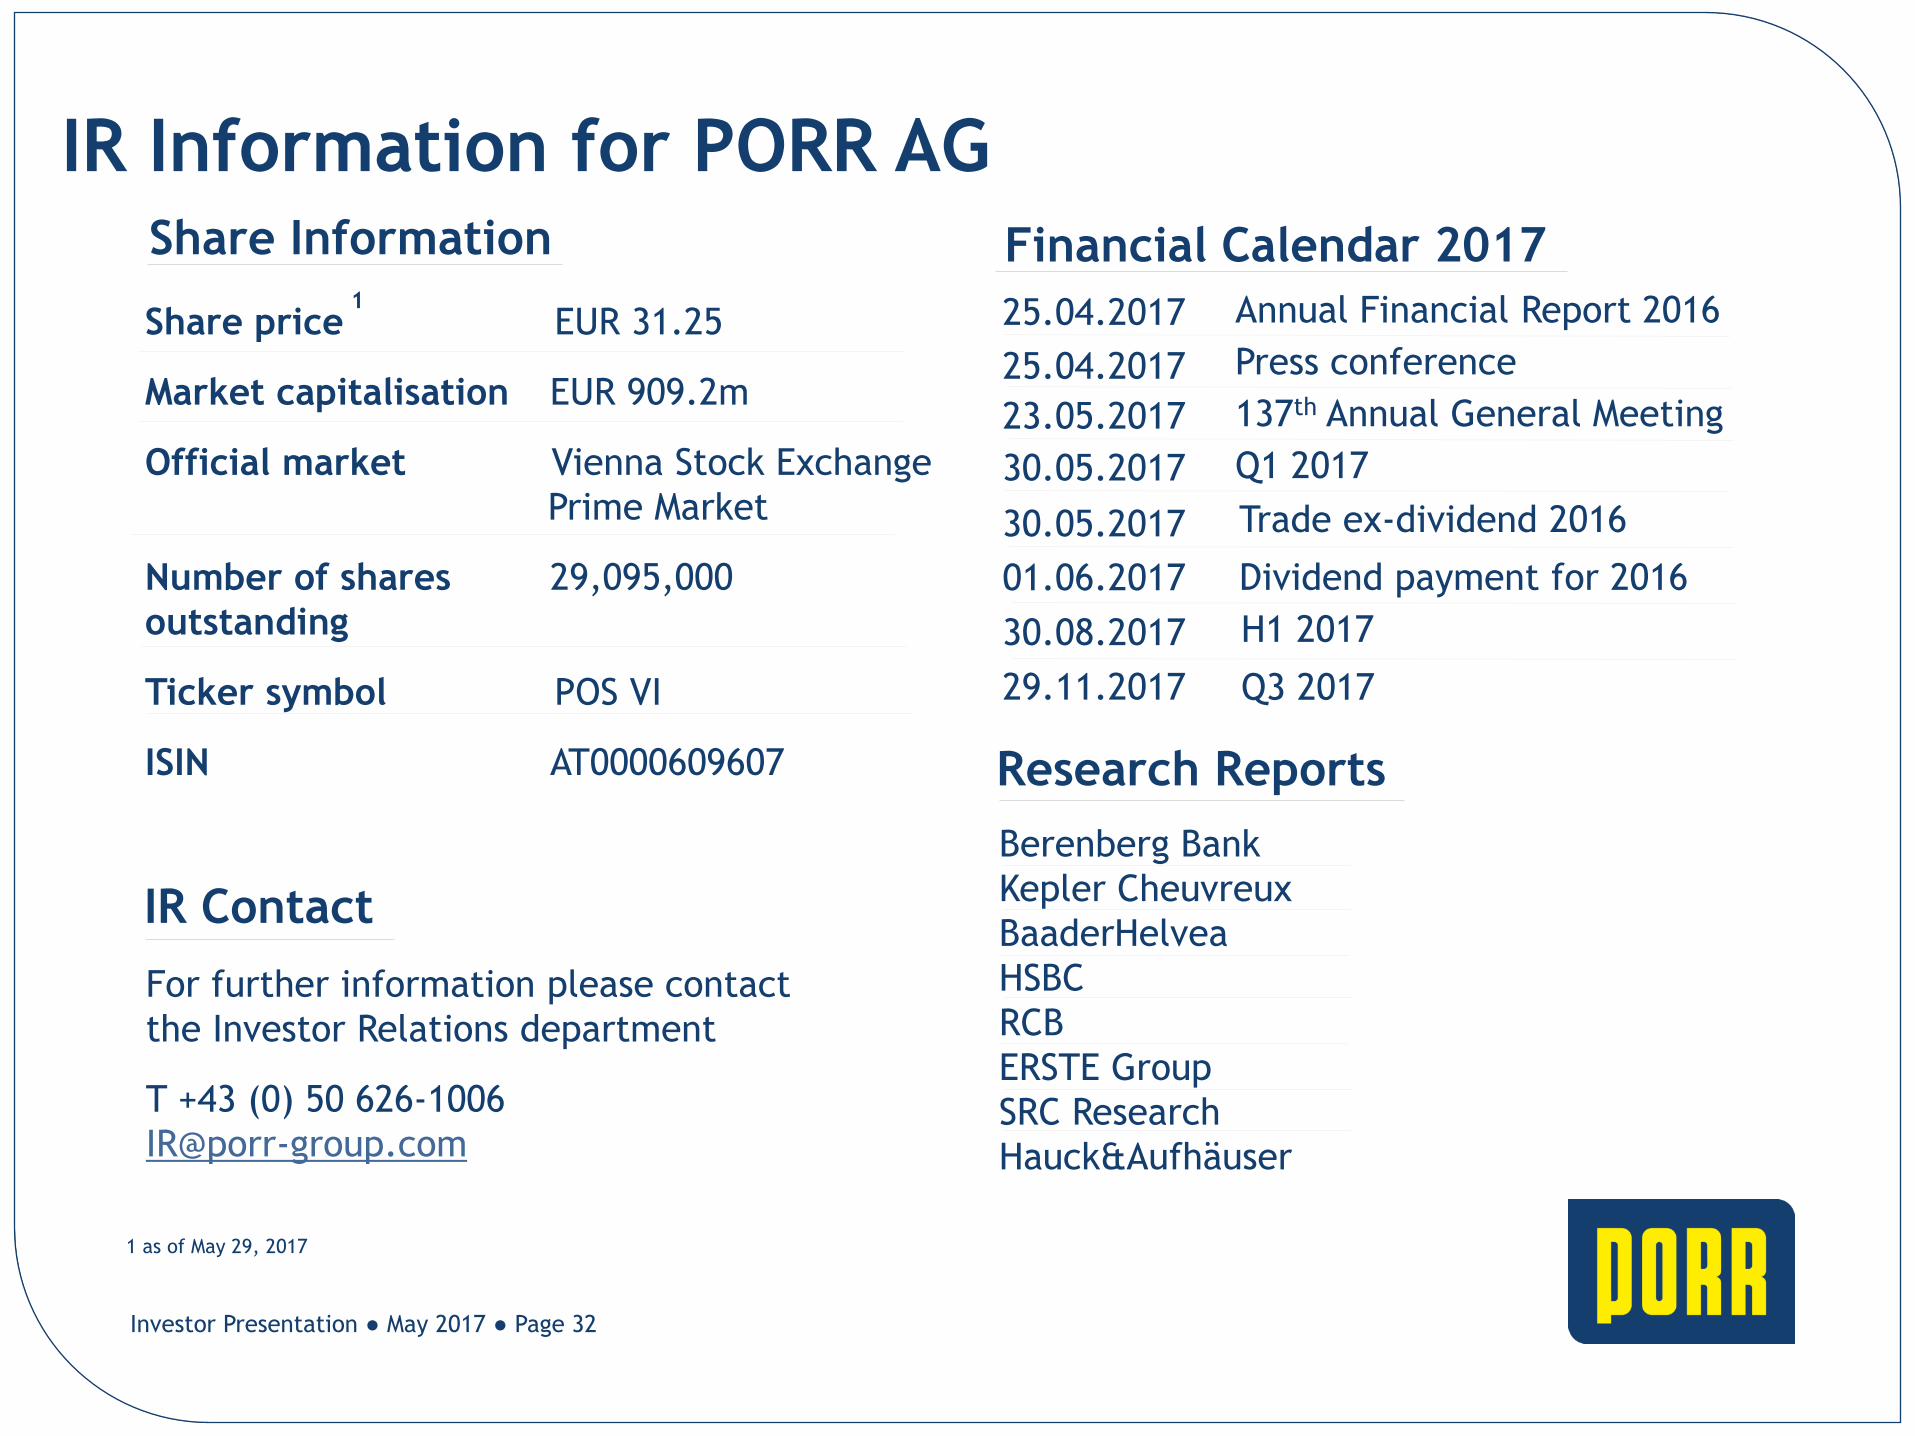
IR Information for PORR AG Share Information Financial Calendar 2017
IR Contact
For further information please contact
the Investor Relations department
T +43 (0) 50 626-1006
Share price EUR 31.25
Market capitalisation EUR 909.2m
Official market Vienna Stock Exchange
Prime Market
Number of shares 29,095,000
outstanding
Ticker symbol POS VI
ISIN AT0000609607
1
RS HP
Research Reports
Berenberg Bank
Kepler Cheuvreux
BaaderHelvea
HSBC
RCB
ERSTE Group
SRC Research
Hauck&Aufhäuser
25.04.2017 Annual Financial Report 2016
1 as of May 29, 2017
25.04.2017 Press conference
23.05.2017 137th Annual General Meeting
30.05.2017 Q1 2017
30.05.2017 Trade ex-dividend 2016
01.06.2017 Dividend payment for 2016
30.08.2017 H1 2017
29.11.2017 Q3 2017
Investor Presentation ● May 2017 ● Page 32
![World of PORR...World of PORR 172/2018 Table of contents 7DEOH RI FRQWHQWV)RUHZRUG.DUO +HLQ] 6WUDXVV &(2 3DJH 3255 3URMHFWV 2%0 +DPSWRQ E\ +LOWRQ 1HZ KRWHO DQG UHVLGHQWLDO EXLOGLQJ](https://static.fdocuments.in/doc/165x107/5ea2fc8a7e2b3043e216cb8e/world-of-porr-world-of-porr-1722018-table-of-contents-7deoh-ri-frqwhqwvruhzrugduo.jpg)