Cover Final Prepped
34
TheCenter A John V. Lombardi Elizabeth D. Capaldi Kristy R. Reeves Denise S. Gater December 2004 An Annual Report from The Lombardi Program on Measuring University Performance A TheCenter Measuring and Improving Research Universities: TheCenter at Five Years
Transcript of Cover Final Prepped

TheCenter
The TopA
John V. Lombardi
Elizabeth D. Capaldi
Kristy R. Reeves
Denise S. Gater
December 2004An Annual Report from
The Lombardi Program on Measuring University Performance
MThe TopA
TheCenter
Resech
Measuring and ImprovingResearch Universities:TheCenter at Five Years

The Top American Research Universities Page 1
Contents
Measuring and Improving Research Universities: TheCenter at Five years ................................ 3Introduction ............................................................................................................................................ 3TheCenter’s Framework ............................................................................................................................ 5Ranking and Measurement ...................................................................................................................... 7Particular Difficulties in Undergraduate Rankings ................................................................................... 9Performance Improvement .................................................................................................................... 10Our Choice of Indicators of Competitive Success .................................................................................. 13Definitional Issues ................................................................................................................................. 17TheCenter’s Categories ........................................................................................................................... 19Change Over Time ................................................................................................................................ 21Faculty Numbers ................................................................................................................................... 25Impact of TheCenter Report .................................................................................................................. 27Future Challenges .................................................................................................................................. 30Notes ..................................................................................................................................................... 30

Page 2
AcknowledgmentsThe authors gratefully acknowledge the support of Mr. Lewis M. Schott, whosegenerous contribution established the Lombardi Program on Measuring UniversityPerfomance.
AcknowledgmentsThe authors gratefully acknowledge the support of Mr. Lewis M. Schott, whosegenerous contribution established the Lombardi Program on Measuring UniversityPerfomance.
The Top American Research Universities Page 3
Measuring and Improving Research Universities:TheCenter at Five Years
priate interference. In highly politicized contexts,systems prefer to report only system-level data toprevent misuse of campus-specific data. For these andother reasons some multi-campus institutions remaincommitted to viewing themselves as single institutionson multiple campuses. While we respect that deci-sion, we nonetheless attempt to separate out theperformance of campuses in our presentation of data.
The second major issue involves the question ofaggregate versus some relative measures of perfor-mance of research universities. TheCenter’s datareports an aggregate measure of performance in all butone instance (the SAT scores), whether it is theinstitution’s total research, its federal research, itsawards, or the like. Each of these measures (with theexception of the SAT score, which the College Boardreports as a range) appears without any adjustment forthe size of the institution, normalization by numberof faculty, adjustment for size of budgets, or any othermethods of expressing performance relative to someother institutional characteristic.
While size, for example, is of some significance inthe competition for quality faculty and students, thesize variable is not easily defined. We have made someestimates in our 2001 and 2002 reports in an attemptto identify the impact of institutional size (whetherexpressed in terms of enrollment or budget). In somecircumstances size is an important variable; but this isnot universally so. Public institutions with largeenrollments have an advantage over public institutionswith small enrollments in many cases, but not in all.Private universities benefit much less, if at all, fromlarge student enrollments. We do know that theamount of disposable income available to an institu-tion after deducting for the base cost of educatingstudents appears to provide a significant advantage inthe competition measured by our data. However,reliable data on institutional finances remain elusive,and we consider our findings in this area indicativebut not necessarily definitive.
If the data on enrollment and finances proveinadequate to help us measure the relative perfor-mance of institutions, the data on faculty are even lessuseful. As we discuss in more detail below, thedefinition of “faculty” varies greatly among institu-
Introduction
This report marks the first five years of TheCenter’sTop American Research Universities. Over this period,we have expanded the scope of these reports, we haveoffered some observations on the nature of theresearch university and its competitive context, andwe have provided our colleagues with a stable andconsistent collection of reliable indicators. The workof TheCenter’s staff has involved all of us in a widerange of conversations with colleagues at otheruniversities, with associations and conferences, and onoccasion with colleagues overseas. These discussionsand presentations have helped us test our methodol-ogy. Much of the comment on TheCenter’s methodol-ogy turns on two primary issues. The first is our focuson campus-based institutions, and the second is ouremphasis on aggregate measures.
Our initial approach to the question of measuringuniversity performance came from a commitment toinstitutional improvement. Campuses seekingimprovement need reliable national indicators to helpthem place their own performance within a nationalcontext. In several essays, we explored the nature ofthis context as well as discussed the operational modelof research universities and the structural implicationsof state university system organization. These discus-sions have enriched our understanding and reinforcedour conclusion that a campus’ performance is thecritical indicator of institutional competitiveness.
Some state systems prefer to present themselves totheir statewide constituencies as if they were a singleuniversity with a common product, but students,parents, faculty, and other institutions immediatelyrecognize that the products of different campuseswithin the same system vary significantly. The systemapproach has value for explaining the return on astate’s public investment in higher education, but itprovides a less effective basis for measuring institu-tional performance. We discuss some of these issuesin more detail in this document where we reviewsystem performance measures and compare them tocampus performance to provide a perspective on scaleand utility of these views of institutional activity. Insome states, moreover, systems serve to protect thecampuses against legislative or other forms of inappro-

Page 4 Introduction
tions, and the proportion of faculty effort devoted toresearch rather than to teaching, administration, orservice is usually unavailable in any comparable form.
These two defects in thedata reported publicly byuniversities render allattempts to normalizeinstitutional performanceby faculty size misleading.
Until reliable, standardmeasures appear for manyof the quantities thatinterest all of us who seekeffective measures ofinstitutional performance,the data collected andreported by TheCenterwill remain the bestcurrent indicators fortracking competitiveperformance over time.
In reaffirming our focus, we must continually empha-size that TheCenter’s data do not identify whichinstitution is “better” or which institution is of“higher quality.” Instead, the data show the share ofacademic research productivity achieved by eachcampus represented in the data. It is entirely possiblethat some of the faculty in a small institution, with asmall amount of federal research, are of higher qualitythan some of the faculty in a large institution, with alarge amount of federal research. However, it is surelythe case that the institution with a large amount offederal research has more high-quality, nationallycompetitive faculty than the institution with asmall amount of federal research.
TheCenter primarily measures market share. Forexample, the federal research expenditures reportedfor each institution represent that institution’s share ofall federal research expenditures. That Johns HopkinsUniversity (JHU) spends more federal research dollarsper year than the University of Maryland-BaltimoreCounty (UMBC) is indisputable, and that JHU hasmore people engaged in federally sponsored researchactivity than IMBC does is virtually certain. Thisdoes not mean, however, that the best faculty mem-bers at UMBC are less competitive than the bestfaculty members at JHU. It means only that the JHUfaculty have succeeded in competing for more federalresearch awards leading to higher annual expenditures.
This distinction, often lost in the public relationsdiscussion about which campus is the best university,is of significance because each campus of each univer-sity competes against the entire marketplace for
federal research dollars (and other items captured inTheCenter’s data). When Johns Hopkins’ faculty orwhen the University of Maryland-Baltimore County’sfaculty win awards, they do so in competition withfaculty based at institutions all over the country. Theuniversity competition reflected in TheCenter’s datameasures the success of each institution’s faculty andstaff in competition against all others – not the successof each institution in a competition against a pre-sumed better or worse institution in some ranking.This frame of reference gives TheCenter’s data itsutility for institutions seeking reliable ways of measur-ing their improvement because it indicates institu-tional performance relative to the entire marketplaceof top research universities. Although TheCenterranks institutions in terms of their relative successagainst this total marketplace, it is not only theranking or the changes in ranking that identifycompetitive improvement but also the changes inperformance relative to the available resources. If thepool of federal research expenditures controlled bythose universities spending $20 million or more growsby 5% and an institution increases its federal expendi-tures by 3%, it has indeed improved, but it has lostground relative to the marketplace. This contexthelps place campus improvement programs into aperspective that considers the marketplace withinwhich research universities compete.
From the beginning, TheCenter posted online allthe data published in The Top American ResearchUniversities and variety of other data that universitiesmight find useful in understanding and interpretingresearch university competitiveness in a format thatpermits downloading and reanalysis. This feature hasproved particularly helpful to institutional researchoffices, and comments from many colleagues indicateits value. The Web statistics compiled each year forthe annual meeting of TheCenter’s advisory board alsoindicate the value of the online presentation of data.Although we distribute about 3,000 copies of thereport each year, primarily to university offices onresearch campuses, the hit rate on the Web siteindicates that the reach of TheCenter’s work is consid-erably larger. We note in particular a significantinterest overseas, as more institutions see the competi-tive context as international and as more institutionsoutside the United States seek ways of measuring theirown competitiveness. This interest also has promptedconsultations and papers from TheCenter staff.
While we have been pleased with the receptiongiven this effort by our colleagues, our review ofTheCenter’s impact offers some lessons for improvedeffectiveness. Many in our audiences have found the
Absent reliable, standard
measures , the data
collected and reported by
TheCenter remain the
best current indicators
for tracking competitive
performance over time.

The Top American Research Universities Page 5
essays at the beginning of each report of considerableinterest, either because they treat topics of currentinterest or because they have proved useful in educat-ing trustees and others about the context of researchuniversity competition. At the same time, the essays’inclusion in the report has limited their visibility inthe academic community, and we have begun toreconsider the practice of bundling the topical essayswith the report. As the prevalence of Web-baseddistribution of specialized publications continues toexpand, we also have begun a review of the currentpractice of publishing a paper report. While someaudiences, particularly trustees and other participantsin the larger policy debates, may find the paper copymore accessible, the professionals who use the datamay well see the Web-based product as sufficient.
In any event, these five years have provided theoccasion to develop a useful set of data and haveoffered an opportunity to contribute to the conversa-tion about university competitiveness and improve-ment. We remain grateful to Mr. Lewis Schott, whosegift to the University of Florida made this reportpossible. We also are grateful to the University ofFlorida for continuing to serve as the host institu-tion for the TheCenter’s activities and to theUniversity of Massachusetts Amherst and The StateUniversity of New York for their continued sup-port of the co-editors.
TheCenter’s Framework
Research universities live in an intensely competi-tive marketplace. Unlike commercial enterprises thatcompete to create profits and enhance shareholdervalue, research universities compete to collect thelargest number of the highest-quality research facultyand research productivity as possible. They alsocompete for the highest-quality but not necessarily thelargest number of students.
Because the demand for these high-quality studentsand faculty greatly exceeds the supply, researchinstitutions compete fiercely to gain a greater share ofthese scarce resources. Although the process ofcompetition is complex and has different characteris-tics in different segments of the research universitymarketplace (small private institutions and largepublic universities, stand-alone medical institutionsand public land grant universities, for examples), thepursuit of quality follows the same basic patterneverywhere. Talented faculty and students go wherethey believe they will receive the best support fordeveloping their talent and sustaining their individual
achievement in the many marketplaces for their skills.Research universities compete to capture and holdtalented individuals in the institution’s name, andindividuals compete with other individuals for therecognition of their academic accomplishments. Thiscompetition takes place in a national and interna-tional marketplace represented by publications inprestigious journals and presses, grants won innational competition, prizes and awards recognizingexceptional academic accomplishments, offers fromincreasingly prestigious institutions, desirable employ-ment post-graduation or placement in prestigiouspost-graduate programs, and similar tokens of na-tional or international distinction.
The work that defines a research university’s levelof competitive performance appears in the accumu-lated total productivity of its individual faculty, staff,and students. The importance of individual talent inthe research university marketplace helps explain thestrategies institutions pursue to enhance their com-petitiveness. Although faculty talent is mobile, theinfrastructure that supports their creativity andproductivity is usually place bound. Institutions,universities, and medical centers build elaborate andoften elegant places tocapture and support high-quality faculty. Theyprovide equipment, labspace, staff, and researchassistance. They buildlibraries and offices, paythe substantial cost ofresearch not covered bygrants or external funds,support the graduatestudents essential formuch faculty research,and in most places recruitthe best undergraduatespossible for the faculty toteach and to create the campus life that attracts manyresearch faculty.
The American research university enterpriseoperates within a complex multilayered organiza-tional, managerial, and regulatory framework. Withelaborate bureaucracies and highly structured organi-zational charts, research universities resemble moderncorporations on the surface. Operationally, however,especially at the faculty level, they are one of the lastof the handicraft, guild-based industries in America,as described in our 2001 report. Faculty organizethemselves into national guilds based on the method-ologies and subject matter of their disciplines. Chem-
The research university’s
competitive performance
appears in the total
productivity of its
individual faculty, staff,
and students.
Page 6 TheCenter’s Framework
ists and biologists use different methods and tools toinvestigate different subsets of the scientific universe.While many topics at the edges of these guild bound-aries overlap, and produce such fields as biochemistry,the guilds define themselves by the center of theirintellectual domains and not the edges.
The national nature of the guilds reflects themobility of faculty talent. A historian in Californiatoday may be a historian in New York tomorrow. Thehistorians’ guild remains the same, and the criteriaused to define historical excellence are the same onboth coasts. The university does not define thestandards of excellence; the faculty guilds do. Auniversity can accept individuals who do not meetguild standards, but it cannot do so and remaincompetitive. Evaluating and validating qualityrequires the highest level of very specific expertise.Few observers outside the guild have sufficientexpertise to identify and validate quality research atthis level, and so the university requires the nationalguilds to certify the quality the institution seeks.
Although faculty research talent is individual, high-quality faculty become more productive when theywork in contexts with significant numbers of otherhigh-quality faculty. Not only is it easier to recruit ahigh-quality faculty member to join a substantialgroup of similarly distinguished colleagues but theuniversity can support 10 first-rate chemists muchmore effectively than it can support one. Universityquality, once established at a high level and substantialscale, becomes self-sustaining. We describe thestructure and operation of the research university inthe 2001 report as quality engines, and we explain therelationships that link academic guilds to theirorganizational structure within colleges and schools,and to their relationship with the university’s adminis-trative shell.
The key question for every research university ishow to engage the competition for quality. The mostimportant element in every research university’sstrategy is a set of indicators – measures that allow aclear and objective method to assess how well theinstitution competes against the others among the topresearch universities. Constructing such reliablemeasures proves exceedingly difficult, even thoughevery university needs them. These difficulties fallinto various categories.
Compositional difficulties refer to the widelydiffering characteristics of research competitiveinstitutions. Some have large undergraduate popula-tions of 30 thousand or more while others supportfive, one, or even fewer than one thousand under-
graduates. Competitive research universities canencompass practically every known academic andresearch specialty while others concentrate on medicalsciences, engineering, or the liberal arts and sciences.When we compare institutional performance acrossthis widely diverse universe, we encounter significantdifficulty interpreting the data as discussed in our2001 report.
Organizational difficulties occur because researchuniversities often exist within complex governancestructures. Most private institutions have relativelysimple organizational arrangements with a singleboard of trustees governing one university campus.Public institutions, however, operate within a widerange of different and often complex governancesystems, often with multiple institutions governed bysingle boards and elaborate control structures appliedto multiple campuses. These public models respondmostly to political considerations and can change withsome frequency. In our 2002 report, we discusswhether these different organizations have an influ-ence on the research effectiveness of the institutionsthey govern, rendering comparisons of institutionsdifficult to interpret.
Money differences also distinguish researchuniversities. All research universities derive theirrevenue from the same general sources, although insignificantly different percentages. These sourcesinclude:
• student tuition and fees;
• grants and contracts for research and services;
• federal and state funds achieved through entitle-ments, earmarks, funding formulas, or specialappropriations;
• income from the sale of goods and services includ-ing student housing and dining, various forms ofcontinuing and distance education, interest ondeposits, and other smaller amounts from suchservices as parking;
• clinical revenue from medical services provided byuniversity faculty and staff;
• income from private funds located in endowmentsor received through annual giving programs; and
• income from the commercialization of intellectualproperty in licensing, patents, and royalties.
Public and private universities have differentrevenue structures, with many public research institu-tions having significant portions of their operating

The Top American Research Universities Page 7
and capital budgets provided by their state govern-ments from tax revenue. Private institutions, whilethey often have special subsidies from the state forspecial projects or through per-student subventionsfor in-state students attending the private institution,nonetheless have a much smaller percentage of theirbudgets from state dollars in most cases. In contrast,private universities usually have higher average tuitionper student than most public institutions, althoughoften the out-of-state fees charged by many publicinstitutions reach levels comparable to the discountedtuitions of many but not all private institutions.
All major research universities, public or private,have large expenditures from grants and contracts forresearch and services. The most prestigious of thesefederal grants come from agencies such as the Na-tional Institutes of Health (NIH) and NationalScience Foundation (NSF) that use competitive peer-reviewed processes to allocate funding, but all institu-tions seek contract and grant funding from everypossible source – public, private, philanthropic, orcorporate. In most, but not all, cases, private institu-tions tend to have a larger endowment than publicuniversities, although in recent decades aggressivefundraising by prestigious public institutions hascreated endowments and fundraising campaigns thatexceed many of their private research counterparts.The income from these endowments and the revenuefrom annual campaigns that bring current cash to theinstitutions provide an essential element to supporthigh-quality, research university competition.
Most observers recognize that the revenue availableto any institution is critical to the successful competi-tion for talented faculty and students, but measuringthat revenue in an effective and comparative wayproves difficult, as we outline in our 2002 report.One of the challenges involves higher educationcapital funding, especially in the public sector. Publicuniversities have many different ways of funding andaccounting for the capital expenditures that buildbuildings and renovate facilities. In some states, theuniversity borrows funds for this purpose on its owncredit, and the transactions appear fully accounted foron the university’s books. In other states, however,the state assumes the debt obligation and builds theinstitution’s academic and research buildings. Thedebt and payments can appear in different ways onthe state’s books, often combined with other statecapital expenditures either for all of higher educationor all public construction.
It usually proves impossible to get good compa-rable data about university finances. In the case ofresearch universities, this is particularly important
because the availability of good research space is acritical element in the quest to attract the best re-search faculty. In our 2002 report we discuss atechnique to approximate the amount of disposablerevenue available for a university to invest in support-ing research and higher-quality instruction, afterallowing for the base cost of instruction. Full explora-tion of the issue of revenue and expenses relies mostlyon case studies of particular university circumstancesamong relatively small subsets of institutions. Com-parison of numbers such as annual giving and endow-ments provides a sense of the relative wealth availableoutside of the general revenue from tuition and fees,grants and contracts, and other sources of earnedincome to support quality competition.
Ranking and Measurement
Given the complexity of the research universitymarketplace, reliable indicators of university perfor-mance are scarce. Nonetheless, colleges and universi-ties of all types and especially their constituencies ofparents and alumni, donors and legislators, and highschool counselors and prospective students all seeksome touchstone of institutional quality – somedefinitive ranking that takes all variables into accountand identifies the best colleges in a clear numericalorder from No. 1 on down.
Any reasonably well-informed person knowsimmediately that such a ranking is not possible in anyreliable or meaningful way. Yet, commercial publica-tions continue to issue poorly designed and highlymisleading rankings with great success. Many thingscontribute to this phenomenon of the high popularityof spurious rankings.
The most obvious is that Americans have a passionfor the pursuit of the mythical No. 1 in every field –the richest people, the best dressed, the tallest build-ing, the fastest runner, the No. 1 football team. Thiscultural enthusiasm includes an implied belief that thestatus of No. 1 is a fragile condition, likely to disap-pear or decline within a year or less. The popularityof most rankings rests in part on the expectation that,each year, the contest for No. 1 will produce a newwinner and the rankings of the other players willchange significantly. The ranking summarizes thiscompetitive drama at the end of each cycle.
This model of human behavior in competition maywork well for track-and-field events, or basketballseasons. It may serve to categorize relativelystandardized quantities such as wheat productionor rainfall amounts. However, it fails miserably in

Page 8
accurately classifying higher education institutionsthat are not only complex and different but whoseperformance does not change dramatically orsignificantly on annual cycles.
Yet the ranking industry thrives. Even whencollege and university leaders recognize, mostly in
private, that the publishedcommercial rankings areunsound, they nonethelesscelebrate in public thoserankings in which someaspect of the institutionranked highly. In thesecases, the right answerjustifies faulty measure-ment. If we want 2-plus-2to equal a rank of 1, wecelebrate those who say theanswer is 1, we publicizethe result of 1, and weallow the error in calcula-tion to pass unchallenged.If the calculation of 2-plus-2 produces anundesirable ranking of100, then we focus ourattention on the serious
flaws in a ranking that gives the wrong answer,whatever its methodology.
Perhaps a more fundamental reason for the popu-larity of college and university rankings reflects theextraordinary complexity and variety of Americanhigher education institutions and the remarkablystandardized nature of their undergraduate curriculaand programs. Observers have great difficultydistinguishing the relative value of institutionsbecause their undergraduate products appear sosimilar. The rankings offer the illusion of havingresolved this dilemma by producing a set of numbersthat purport to be accurate tokens of widely differen-tial relative value.
We, along with many other colleagues, havereviewed the methodological fallacies and other errorsin the most popular ranking schemes. These cri-tiques, even though devastatingly accurate, have hadminimal impact on the popularity of the rankings andindeed probably have contributed to the proliferationof competing versions.
Aside from the obvious public relations value ofrankings and the American fascination with lists ofthis kind, a more fundamental reason for their successand popularity has been the lack of any reasonable
alternatives based on quality, standardized data fromthe institutions themselves. Colleges and universitieshave few incentives to provide the public with accu-rate, systematic data useful for good measurement ofthe products they produce. Although some observersthink this responds to a cynical disregard of thepublic’s right to know and an effort to disguise poorperformance (which may well be a minor item in thelarger context), the real reason for the reluctance ofinstitutions to provide data useful for comparativepurposes is a justifiable concern about how othersmight use the data.
If the data were good, they would account forinstitutional complexity. Universities, however, areremarkably complex and highly differentiated inorganization, composition, purpose, and financing.At the same time, they produce similar if not identicalproducts. Many university leaders fear that theprovision of standardized data that do not take intoaccount significant institutional differences will leadto invidious and inaccurate comparisons amonguniversities or colleges of much different type thatproduce virtually identical products of identicalquality.
As an example, an urban institution with largenumbers of part-time enrollees that serves at-riskstudents from families with low-to-modest annualearnings and with poor high school preparationnonetheless produces the same four-year baccalaureatedegree as a suburban residential college that admitsonly highly qualified students from exceptional highschools whose parents have substantial wealth. Acommon and easily computed measure is graduationrate, which measures the percentage of those studentswho enroll first time in college and then graduatewith a completed –four-year degree by year four, five,or six. The elite college may have a rate in the 80%-90% range, and the urban school may have a rate inthe 40% range. Legislators, parents, and others takethis simple, standardized measure as representingdifferences in educational performance by the collegesand attack the urban institution for its failure tograduate a higher percentage of those enrolled. Thiskind of response is familiar to university and collegepeople, and in reaction they often reject most stan-dardized measurement.
The reasons for differential graduation rates aremany. Two identically positioned institutions withidentical student populations could have differentgraduation rates either because they differ in thequality of their instruction or because they grade allstudents with a passing grade. The graduation rate byitself tells nothing about the performance of the
The popularity of college
and university rankings
reflects the complexity of
American higher
education and the
remarkably standardized
nature of their
undergraduate curricula.
Ranking and Measurement

The Top American Research Universities Page 9
institution or its students unless we know a lot moreabout the institution, its instructional activities, itsgrading patterns, and the quality and preparation aswell as economic circumstances of its students. Forexample, if the full-time institution has students whoarrive from elite high schools with advanced place-ment courses, then the full-time institution’s studentswill have fewer courses to complete for a four-yeardegree than will students who arrive in higher educa-tion without these advantages.
Does this mean that an indicator such as gradua-tion rate has no value? Of course not. What it doesmean is that its primary value is in measuring changeover time in a single institution and within thecontext of that institution’s mission. However,regulatory agencies, the press, legislators, trustees,alumni, and other observers frequently misrepresentor misunderstand these indicators. In response,institutions resist standardized measures as much aspossible. Instead, institutions may provide difficult-to-misuse data, or data unique to the institution that isdifficult to compare. In some cases, if a standardizedmeasure will make the campus appear successful, evenif the data underlying it are suspect, the institutionwill publicize the data for public relations purposes.
Particular Difficulties in UndergraduateRankings
Many observers have difficulty recognizing theremarkable formal uniformity of the undergraduateeducational product of American higher education.Thanks to accreditation systems, the pressure ofpublic funding agencies in search of standards forfinancing higher education, the need for common anduniform transfer rules among institutions, and theexpectations of parents, most undergraduate educa-tion in America conforms to a standardized pattern of120 credit hours of instruction delivered within a full-time four-year framework. Whether the studentbegins in a community college and transfers to a four-year institution, or begins and graduates at an eliteprivate four-year college, this pattern is almostuniversal in the United States. Accreditation agenciesspeak to this norm, parents expect this norm, publicagencies fund this norm, and graduate or professionaleducation beyond the baccalaureate degree anticipatesstudent preparation within this norm.
This norm, of course, does not apply exactly toevery student because many take longer than fouryears to complete, many pursue higher education atmultiple institutions through transfer processes, and
others start but never complete a four-year degree.Nonetheless, this standardized frame not only speci-fies the normal amount of time on task (120 credithours for a liberal arts degree) but also includesstandardized content with a core curriculum taken byall students and a major specialization that preparesstudents for specific work or advanced study. Evenwhen the rhetoric surrounding the structure of thecurriculum varies from institution to institution, thecontent of organic chemistry, upper-division physics,calculus, accounting, American history, or engineeringvary little from institution to institution. The pres-sure of accreditation agencies in such fields as engi-neering and business and the expectations for gradu-ate students in medicine, law, and the liberal arts andsciences impose a narrow range of alternatives toprepare students for their post-graduate experience.This, in addition to the expectations of many employ-ers, combines to ensure the uniformity of undergradu-ate experience. All four-year institutions producestudent products for the same or similar markets.Consequently, these products tend toward the stan-dards consumers expect of their graduates.
As we indicated above, the competition for qualitystudents is particularly fierce among high-qualityfour-year colleges and universities, but because of thestandardized nature of the curriculum, it is difficult tocompete on instructional content. Instead, institu-tions focus on other issues. They speak to the “experi-ence” of the student as distinguished from the knowl-edge acquired by the student. They speak to theactivities available for students beyond the classroomas distinguished from the standard context of theclassroom. They talk about the quality of the facili-ties, the amenities of the campus, and the opportuni-ties for enhancements to the standard curriculum inthe form of overseas studies, internships, and similarextracurricular activities. They emphasize the smallsize of the classes rather than the amount of knowl-edge acquired by students during their education.These contextual characteristics of an undergraduateeducation are easier to advertise and display thandifferences in the actual quality of instruction thatmay take place in classes taught by better or worsefaculty to well- or poorly prepared students.
Indeed, few institutions have a clear plan formeasuring the amount of knowledge students acquireduring the course of their passage through the four-year frame of an undergraduate degree. Do studentswho attend part-time, do not participate in extracur-ricular activities, and live at home acquire less knowl-edge than those who attend full-time, reside oncampus, and participate intensively in campus life
Page 10
throughout the four years of their residence at thecollege? Much research has attempted to find a wayof measuring these effects, but, for the most part, theresults have been inconclusive. While students whoattend continuously for four years at institutions thatrecruit students from high-income families withexcellent high school preparation appear to have anadvantage in the marketplace after graduation, thedifference is minor compared to advertised advantagesand price differentials. Moreover, the differences donot appear to flow necessarily from the knowledgeacquired in the standardized curriculum through theinstruction of superior faculty but perhaps from theassociations and networks developed among students
and alumni by virtueof participation at theinstitution rather thanby virtue of thecontent of the educa-tion provided.
Some data do existon the knowledgeacquired by collegegraduates thoughstandardized tests foradmission to medicalschool (MCAT),graduate school(GRE), or law school(LSAT), for examples.However, few institu-
tions collect this information in ways that wouldpermit effective institutional comparisons of perfor-mance. Only some four-year institutions would havesufficient percentages of their graduates taking theseexams for the standardized test results to serve asnational metrics, although these results surely wouldbe useful indicators for the highly competitiveresearch institutions that have been our focus.
Performance Improvement
Most institutions avoid large-scale public compari-sons based on standardized data. They see littleadvantage in such exercises because the data used areoften so poor. They believe it more effective topublicize the unique context within which theydeliver their standardized curriculum than to explainand document any differential quality or success thattheir classroom work might produce.
Nonetheless, most university people want toimprove their institutions. They want to have moresuccess in every dimension—from acquiring resourcesto attracting first-rate students and faculty, fromdriving research performance to enhancing theirprestige among their peers. The literature on perfor-mance improvement in higher education is endlessand endlessly creative. Journals, higher educationassociations, conferences, and foundations all focus onthese issues. Elaborate budgeting schemes attempt tomotivate and reward improvement. Complex evalua-tion and accountability structures, particularlypopular in public higher education, consume the timeand energy of faculty, staff, and students. Much ofthis activity falls into the area of fad—popular butshort-lived enthusiasms that create flurries ofactivity, much reporting and meeting, and littlepractical effect.
Those involved in the accountability movementand the institutional improvement process over longperiods can easily become cynical about these recur-ring enthusiasms for reform using innovative andclever systems, many derived from corporate fads ofsimilar type. Often the university will become the lastimplementation of a corporate fad whose time hasalready passed, whether it is Zero-Based Budgeting,Total Quality Improvement, Six-Sigma, or any of anumber of other techniques designed to drive corpo-rate quality control and profitability and proposedas solutions to the higher education productionenvironment.
These usually fail—not because they lack insightand utility but because they do not fit the businessmodel of the high-quality research university. Al-though research universities have a number of surfacecharacteristics that make them look like moderncorporations, as we have mentioned above anddiscussed at length elsewhere, they do not functionlike modern corporations.
Before we turn to a discussion of the indicators thatcan drive improvement in performance, we have to beclear about the performance we seek to improve.Research universities have a business model that seeksthe largest quantity of accumulated human capitalpossible. This model does not accumulate humancapital to produce a profit; it does not accumulate thecapital to increase individual wealth, provide highsalaries for its executives and employees, or generate areturn on investment to its stockholders. The researchuniversity accumulates human capital for its own sake.The measure of a research university’s success as anenterprise is the quantity of high-quality humancapital it can accumulate and sustain.
Performance Improvement
Most institutions publicize
the unique context of their
standardized curriculum
rather than document the
differential quality or
success of their classroom
work.
The Top American Research Universities Page 11
Because the accumulation of this capital takes placeat the lowest level of the institutional organization—the academic guild or discipline—all incentives andmeasurements in the end focus on the success of theguild. The rest of the institution—the administra-tion, physical plant, housing, parking, accountingservices, research promotion, fundraising, legislativeactivity, student affairs, instructional program en-hancements, and every other like activity—exists toattract and retain both more and better-qualityhuman capital. Some of this capital is short-term,student human capital with a replacement cycle offour to six years. Some of it is longer-term, facultyhuman capital with a replacement cycle of 20 yearsor more.
This business model provides us with a clearerfocus on what we need to measure, and how we needto manage investments to improve any major researchinstitution. Although the focus here is on humancapital accumulation, the most important singleelement in the acquisition of high-quality humancapital is money. All other things being equal, theamount of money available to invest in attracting andretaining human capital will set a limit on a universityresearch campus’ success. Of course, not all things areequal, and institutions with good support systems,effective and efficient methods for managing physicalplant and supporting research, and creating excitingenvironments for students will get more from eachdollar invested than those places with inefficient andineffective administration and support. Nonetheless,while good management can multiply the effective-ness of the money spent on increasing human capital,good management cannot substitute for lack ofinvestment.
Within this business model, then, are two places tofocus measurement in order to drive improvement.The first is to emphasize revenue generation. Thesecond is to measure faculty and student quality. Inhigher education, as in most other fields, people tendto maximize their efforts and creativity on what theirorganization measures; as a result, a clear focus onmeasurement is particularly helpful. In universities,moreover, when few people’s motivation is profitoriented (primarily because the personal incomeincrease possible from an added amount of university-related effort is very small) the competition normallyturns on quality, which produces prestige. Indicatorsof quality, then, create a context for recognition ofprestige differences.
While individuals in research universities haverather narrow opportunities for personal income
enhancement through the university, they havesubstantial opportunities for prestige enhancementthrough institutional investment in the activities fromwhich they derive their prestige. A superb facultymember may make only 150% of the salary of amerely good faculty colleague, but the institution caninvest millions in supporting the work of the superbfaculty member and only hundreds of thousands inthe work of the goodfaculty member. Themultiplier for facultyquality is the institutionalinvestment in the facultymember’s work ratherthan the investment inthe individual’s personalwealth. The institutionmust pay market rates forhigh-quality faculty, butthe amount required tocompete on salary isminimal compared to theamount required to compete on institutional supportfor research excellence. A hostile bid for a superbfaculty member in the sciences might include from$50,000 to as much as $100,000 in additional salarybut $1 million to $5 million in additional researchsupport, as an illustration of these orders of magni-tude. Although the additional salary is a recurringexpense and the extra research support generally aone-time expense, the cumulative total of specialresearch support for new or retained faculty representsa significant repeating commitment for every com-petitive research institution. Unionized and civilservice faculty salary systems moderate the impact ofindividual wealth acquisition as a motivator forfaculty quality. These systems raise the average cost offaculty salaries above open-market rates and focusmost attention on maintaining floors and averageincreases rather than on significant merit increases.Most universities nonetheless meet competitive offersfor their nationally competitive faculty, whatever thebureaucratic structure of pay scales. The marketplacesbased on salary enhancement and the requiredinvestments in research support combine to increasethe cost of maintaining nationally competitive faculty.
In the case of the accumulation of high-qualitystudent capital, the model is a bit more complexdepending on the institution and its financial struc-ture. In a private research university without substan-tial public support and high tuition, quality studentsrepresent a net expense in most cases. Althoughtuition and fees are high, at least nominally, thecompetition for very high-quality students requires a
The measure of a research
university’s success is the
quantity of high-quality
human capital it
accumulates.
Page 12
discount from the sticker price, on average perhaps atthe 40% rate. Universities and colleges provide thisdiscount at much higher rates to superb students andat much lower rates, if at all, to merely good students.Almost all elite private research universities subsidizethe cost of undergraduate education for their veryhigh-quality students. High-quality students are aloss leader. Colleges and universities recover thisinvestment in the long term, of course, through thedonations and contributions of prosperous alumni,but in the short term it costs more to produce astudent than the student pays after the discounts. Thisplaces a limit on the number of high-quality studentsa private institution can support. The number variesdepending on many individual characteristics of theinstitutions, but the self-limiting character of theinvestment in quality students tends to keep privateresearch university enrollments substantially belowthose of their public counterparts.
In the public sector, the state provides a subsidy forevery student. In most states, but not all, the subsidymakes the production of undergraduate education asurplus-generating activity, and at student populationsizes less than 40,000, undergraduate educationbenefits from increased scale. Public institutionsteach some courses at sizes substantially larger than inprivate institutions (200 to 500 or more in an intro-ductory lecture), and they use inexpensive teachinglabor to support large numbers of instructional hoursin laboratories, discussion sections, and other begin-ning classes. These economies of scale permit publicuniversities to accumulate a surplus from theirundergraduate economy to reinvest in the quality ofthe students attracted (either by merit scholarships orthrough the provision of amenities and curricularenhancements such as honors colleges and endlessextracurricular activities).
In both public and private sectors, the investmentsthe institution makes in acquiring a high-qualitystudent population and those it makes to recruit andretain superb faculty compete. The return on aninvestment in student quality always competes againstthe return on an investment in faculty quality.Although most institutions behave as if these are twoseparate economic universes, in fact, they both drawon the same institutional dollars. Every dollar savedon instructional costs can support additional research,and every dollar saved on research support cansupport an instructional enhancement.
The American research university environmentvaries widely in this relationship between size ofundergraduate student population, number of faculty,and amount of research performed. Depending on
the possible surplus generated by teaching, universitieswill have larger or smaller student populations relativeto their continuing tenure-track faculty. Universitiesalso have different strategies for teaching, with someinstitutions expecting a substantial teaching commit-ment from all faculty and others using temporary,part-time, or graduate student instructors to carry asignificant portion of the teaching responsibility.These variations reflect different revenue structures,but for high-quality research universities, the goal isalways to have the highest possible student populationand the highest-quality research performance by thefaculty.
The need for balance reflects not a philosophicalposition on the nature of higher education but ratherthe structure of funding that supports high-qualityuniversities. The critical limit on the accumulation ofhigh-quality human capital is revenue, and all researchuniversities seek funding from every possible source.Revenue is the holy grail of all research universities.Students are a source of revenue, whether deferreduntil graduates provide donations (as in the case ofprivate and increasingly public universities) or currentfrom state subsidies (in the case of public and, to amuch lesser extent, some private institutions). Stu-dents not only pay costs directly but also mobilize thesupport of many constituencies who want to see high-quality students in the institutions they support(through legislative action, federal action, private gifts,or corporate donations).
Each revenue provider has somewhat differentinterests in students, but all respond to the quality ofthe undergraduate population. Legislators appreciatesmart students who graduate on time and reflect anenthusiastic assessment of their educational experi-ence. Federal agencies provide support throughfinancial aid programs for students who attend highereducation, making it possible to reduce the cost to thecampus of teaching. Private individuals invest inundergraduate programs either because they them-selves had a wonderful experience 10 to 40 years agoor they want to be associated with today’s high-qualitystudents. Corporations support student programsbecause they are the ultimate consumers of much ofthe institutions’ student product.
All of these examples respond to quality. Few wantto invest in mediocre, unenthusiastic, unhappystudents who do not succeed. Smart, creative, andmotivated students not only make effective advertise-ments for the institution but are cheaper to teach,cause fewer management problems, attract the interestof high-quality faculty, and go on to be successfulafter graduation, continuing the self-reinforcing cycle
Performance Improvement

The Top American Research Universities Page 13
for increased student quality. Moreover, the moremoney generated around the instructional activity, themore becomes available to support the researchmission.
The business model of the research enterprise bearssome similarities to the student enterprise. Researchis a loss leader. It does not pay its own expenses.Research requires a subsidy from university revenuegenerated through some means other than theresearch enterprise itself. This is a fundamentalelement in the research-university business model thatoften is lost in the conversation about the largerevenue stream that comes to universities fromresearch partially sponsored by the federal govern-ment, corporations, and foundations. In successfulresearch universities, at least 60% to 70% of theresearch enterprise relies on subsidies from theinstitution’s non-research revenue. The other 30% to40% of the total research expenses come from externalresearch funding for direct and indirect costs.
Many expenses fall to the university’s account. Theinstitution provides these indirect costs for the space,light, heat, maintenance, and operations associatedwith every research project funded by an externalagency. These costs, audited by the federal govern-ment though an elaborate procedure, add about 60%to the direct costs, or the expenses on such things aspersonnel and other elements required to perform theresearch. In addition, the rules for defining theseindirect costs exclude many expenses assumed by theinstitutions. Government agencies, recognizing theintense competition for federal research grants, oftennegotiate discounts from the actual indirect costs and,in addition, require a variety of matching investmentsfrom the successful competitors for grants. If aninstitution can recover even half of the auditedindirect costs from the agency funding its research, itconsiders itself fortunate. At the same time, successfulcompetitors for federal research also have to makespecial capital investments in laboratory facilities,faculty and staff salaries, graduate student support,and a wide range of other investments to deliver theresults partially paid for by the federal grant. Thesematching contributions, in addition to the unrecov-ered indirect costs, can add an additional 10% ormore to project cost. These transactions clarify thebusiness model of the research university, for the goalof research is obviously not profit or surplus genera-tion but rather the capacity to attract, support, andretain superb research faculty to add to total of high-quality human capital.
The research university’s relentless pursuit ofadditional revenue from every source gathers thefinancial support required to ensure that first-rankfaculty can compete successfully for research grantsand projects. Therevenue also supports,although at a lower costbut nonetheless signifi-cant scale, the humanitiesand social science facultywhose research results inpublications in presti-gious journals or univer-sity presses.
Our Choice ofIndicators ofCompetitive Success
Over the years, manypeople have devotedmuch time and effort tothe task of measuringresearch universityperformance. Theseefforts, including this one, tend to focus on particularaspects of university activity such as students, re-search, public service, or other elements of aninstitution’s activities. Almost all indicators inventedfor measuring institutions of higher education dependon the quality and reliability of the data collected andthe relationship of the indicator to the variousdimensions of university activity for their usefulness.Good indicators used for inappropriate purposes areno more helpful than bad indicators. Annual federalresearch expenditures, for example, is a good indicatorof research competitiveness, but it cannot measure thequality of classroom instruction.
The Top American Research Universities collects datathat have certain characteristics.
• First, the data need to be reliably collected acrossthe universe of research universities. This oftenmeans data collected or validated by sourcesoutside the institutions themselves.
• Second, the data need to either speak directly toindicators of quality or serve as useful surrogatesfor quality.
• Third, TheCenter must publish the data in a formthat permits others to use the information indifferent ways or for different purposes.
Smart, creative, and
motivated students are
cheaper to teach, cause
fewer management
problems, attract the
interest of high-quality
faculty, and go on to be
successful after
graduation.
Page 14
TheCenter avoids survey data. While survey datacan help universities understand many aspects of theiroperations, we have not found good survey datafocused on research performance. This is particularlytrue of survey data that attempt to measure researchperformance based on the opinions of universitypeople. These surveys, while technically sound inmany cases, fail because the surveyed population
cannot have sufficientknowledge to respondaccurately to questionsabout research quality.No one in the universityworld has a full under-standing of the currentresearch productivity thataffects the success ofmajor institutions.Experts may know a lot
about theoretical physics or modern poetry and aboutaccounting programs or mechanical engineering, butno one has enough information to pass informedjudgment on the research quality of the 180 or somajor research institutions in America. They canreflect on the general prestige of institutions, they cangive a good sense of the public name recognition ofvarious institutions, and they can reflect the accumu-lated public relations success of colleges and universi-ties. Under the best of circumstances, reputationreflects both current and past success; it may rest onthe work of famous scholars long departed, on thefame associated with celebrities, or on the namerecognition associated with intercollegiate athletics.
Whatever the source of the name recognition thattranslates into reputation, and whatever the impor-tance of name recognition in the competition forquality faculty and students, improvement andcompetition in the end turn on actual research by andacquisition of actual faculty and students, and not onthe variable reflections of the glory associated withdifferent name brands. Often, the reputation ofinstitutions matches their current performance; butsometimes it does not. While reputation may matchperformance among the best institutions that excel ineverything, it is much less a reliable indicator amonguniversities with below-top-level performance. Totrack improvement among these colleges and universi-ties, more robust and reliable indicators that apply tothe great and near-great are required. The Top Ameri-can Research Universities offers data on an annual basisthat can help institutions improve. We use data thatreflect performance rather than surveyed opinionsabout performance.
Equally problematic are data that attempt tomeasure student satisfaction or student engagement.These data may prove helpful for institutions seekingto improve student retention and recruitment. Theirvalue in measuring quality of instruction and qualityof the students themselves is doubtful. Clear linkagesbetween what students learn and how well theyenjoyed or engaged the institution during the courseof learning remain elusive. We can establish thatstudents did indeed engage the campus, that they doenjoy their experience, that they did find the environ-ment supportive and creative, and so on. It is muchmore difficult to create a clear link between whatstudents learn about chemistry and history, or ex-ample, and the experiential characteristics of collegelife. With the advent of distance education and otherforms of educational delivery, these discussions ofstudent experience become even more difficult tointerpret across the wide range of institutional typeswe classify as research universities.
To some extent, from our perspective, the universeof possible data to use to explore research universityperformance falls into two large categories.
• At the top level, clear quantitative indicators ofcompetitiveness help classify institutions by theircompetitive success against similar institutions.
• At a second level, data about student satisfaction,faculty satisfaction, and other elements of theprocesses of university life can help individualinstitutions identify the strategies and tactics that,when implemented, will improve the competitive-ness reflected by the top-level measures.
This is the black box approach to institutionalsuccess. It imagines that the university is a black boxwhose inner workings are not visible from the outsidebut whose work delivers products to an open, highlycompetitive marketplace. By measuring indicators ofthe competitiveness of these products, we can inferwhether the mostly invisible processes inside the blackbox functioned effectively. If they did not, then theinstitution could not be competitive. This perspectiveallows us to recognize that individual institutions mayuse different methods to arrive at similar, highlycompetitive results, and it allows us to focus on resultsrather than processes.
The value of this approach lies in, among otherthings, the ability to sidestep the academic fascinationwith process. Universities, like most highly structuredbureaucracies, spend a great deal of time on theprocess for management rather than on the purpose orresult of management. This universal tendency gains
Good indicators used for
inappropriate purposes
are no more helpful than
bad indicators.
Our Choice of Indicators of Competitive Success

The Top American Research Universities Page 15
even greater prominence because of the highlyfragmented nature of the academic guilds and theirhandicraft production methods. Every managementdecision requires a process to capture the competinginterests of the various guilds, and in universityenvironments, a focus on results and external com-petitiveness can contain these process issues withinsome reasonable bounds.
The top-level indicators, chosen for this publica-tion, fall into several groups—each speaking to a keyelement in research university competitiveness. Thefirst group of measures speaks directly to researchproductivity: federal research expenditures and totalresearch expenditures. For federal research expendi-tures, we report the total spent from federal researchfunds during the most recent fiscal year (usually thedata lag a year and a half ). The value of this indicatoris that the federal government distributes most of itsfunds on a peer-reviewed, merit basis. While somesignificant projects arrive at university campuses frompolitically inspired earmarks, and other direct appro-priations for research, most federal research invest-ment comes through agencies such as the NSF, NIH,Department of Energy, and others that use peer-review panels to select projects for funding. Throughthis mechanism, the dollars expended serve as areasonable indicator of a university’s total competi-tiveness relative to other institutions seeking thesefederal funds.
Research expenditures is an aggregate measure. Itmeasures whether each institution’s total faculty effortproduces a greater share of federally funded researchthan the faculty of another institution. This indicatoris not a direct measure of research quality but ratheran indirect measure. When we use this indicator, weassume that the total amount of federal dollarsaccurately reflects the competitiveness of the faculty.We do not assume, for example, that a grant of $5million reflects higher merit on the part of the facultyinvolved than a grant of $1 million. We simply reportthat the most competitive research universities capturethe largest amounts of federal funding.
This measure also reflects the composition of theresearch profile of the institution. An institution witha medical school, an engineering school, and a high-energy physics program may have very substantialamounts of annual federal research expenses thatreflect the expensive nature of the projects in thesefields. In contrast, another institution may pursuetheoretical physics, have no medical school, support astrong education program, and attract an outstandingfaculty in the humanities and social science and in thefine and performing arts. This institution likely will
have a lower annual federal research expenses even if ithas the same number of faculty who have the samelevel of national quality because its research emphasisis in fields with smaller funding requirements. Do weconclude that the second institution has less qualitythan the first? No. We conclude that the secondinstitution is less competitive in the pursuit offederally funded research than the first. The prioritiesof the federal government can also skew the measure.When NIH funding is greater and grows faster thanthe funding of other federal agencies (such as NSF, forexample), universities with medical schools and stronglife sciences research programs benefit. Understandingthe meaning of these indicators helps institutionseffectively use the comparative measures withoutinferring meaning that the indicators do not measure.
A second measure of research productivity appearsin the indicator the NSF defines as total research.Total research funding includes not only the annualexpenditures from federal sources but also those fromstate, corporate, and entitlement programs. These caninclude state and federal entitlement grants to publicland grant colleges, corporate funding of research, anda wide range of otherresearch support. As thetables demonstrate, allmajor research universi-ties compete for this non-peer-reviewed funding insupport of research.Some of this fundingcomes to an institutionbecause of geographiclocation, political connec-tions, commercialrelationships withcorporations, and similarrelationships, rather thanthrough direct competi-tion based on quality.Nonetheless, the researchactivity reflected by these expenditures enhances thestrength and competitiveness of the institutions,which all compete, if not always based on peer-reviewed merit, for these funds. Total research addsan important dimension to our understanding ofresearch university competition.
The next group of indicators focuses on thedistinction of the faculty. Although research volumeis by far the clearest indicator of university researchcompetitiveness, it fails to capture the quality of theindividual faculty members. In our model, theindividual faculty provide the drive and leadership to
The top-level indicators,
chosen for this
publication, fall into
several groups—each
speaking to a key element
in research university
competitiveness.
Page 16
compete for research excellence. The dollar totals,while a critical indicator of faculty quality, lack thespecificity of individual faculty recognition. The TopAmerican Research Universities includes two measuresof faculty distinction unrelated to dollars spent:National Academy Memberships and Faculty Awards.
An indicator of faculty competitiveness comes fromelection to prestigious national academies and thehigh-level national awards faculty win in competitionwith their colleagues. National Academy Member-ships often reflect a lifetime of achievement; mostnational-level faculty awards reflect recent accomplish-ments. In addition, the process of selection forNational Academies is substantially different fromthat used for faculty awards. Even more importantlyhere, these indicators provide a way to capture thecompetitiveness of faculty not in the sciences or otherfederally funded areas of research. Humanities andthe fine arts, for example, appear reflected in the listof faculty awards included in these indicators.
A third group provides a perspective on under-graduate quality. In the data for 2000-2003, wereport the SAT ranges for research universities as arough indicator of the competitiveness in attractinghigh-quality students. This indicator serves primarilybecause the public pays so much public attention tothis indicator rather than because it is a good measureof student quality. Other indicators predict collegesuccess better than the SAT, and of course standard-ized tests measure only one dimension of studentabilities. Nonetheless, the intense public focus on thismeasure made it a useful indicator to test whetherfirst-rank research universities also attract the mostsought-after undergraduate students.
Another indicator concerns graduate students—specifically the production of doctorates. A majorresearch university has as one of its purposes themanagement of many doctoral students and theproduction of completed doctorates. To capture thisdimension of research university performance, weinclude the number of doctorates granted. As afurther indication of advanced study, we include thenumber of postdoctoral appointments at each institu-tion. Major research universities, as a function oftheir research programs, compete for the best graduatestudents to become doctoral candidates and competefor the best postdocs to support and expand theirresearch programs and enhance their competitiveness.
The final group has two indicators that serve asimperfect indicators of disposable institutional wealth.This is a complicated and unsatisfactorily resolvedissue. Universities have different financial resources
available to invest in their work. They invest ingeneral operations and they invest in the enhance-ment of quality. The size of a university’s budget is apoor indicator of the choices the university makes insupporting high-quality research competitiveness. If auniversity has a large undergraduate population, itsbudget also will be large but a significant percentagegoes to pay the cost of delivering the undergraduatecurriculum to all the students. Similarly, if aninstitution has a smaller budget but also a muchsmaller student population, then it may invest morein support of research competition than the largeruniversity. Disposable income is the income notcommitted to the generic operation of the institutionand its undergraduate program. Disposable incomecan enhance the institution’s undergraduate competi-tiveness or subsidize its research competition. In mostplaces, disposable income covers both these goals invarying combinations and patterns.
We made an effort to estimate the disposableresources of research universities in the 2002 editionof The Top American Research Universities, and welearned much about the finances and reported data onfinances of these institutions. Unfortunately, noreliable data exist that would allow us to collect andreport a clear indicator of institutional wealth. As anincomplete surrogate, we report the size of auniversity’s endowment and the amount of its annualprivate gifts.
Endowment represents the accumulated savings ofthe permanent gifts to the university by its alumniand friends over the lifetime of the institution. Theseendowments range from about $14 million to about$19 billion in 2003 among universities with morethan $20 million in federal research expenditures. Theincome from these endowments represents a constantand steady source of income available for investment(limited by endowment restrictions, of course) inquality teaching and research. If in the past publicuniversities might have been exempt from the need toraise private dollars, this has not been the case for ageneration or more. Every major public researchuniversity has a substantial endowment and a largeannual giving program, designed to provide theincome to support quality competition for studentsand faculty. While private institutions rely mostlyon alumni and friends, public institutions not onlyseek donations from those traditional sources butin some states enjoy the benefit of state matchingprograms that donate public funds to the endow-ment on a public to private matching basis of 1 to1 or some lesser fraction ($0.50 per $1 privatedollar, for example).
Our Choice of Indicators of Competitive Success

The Top American Research Universities Page 17
Where endowment reflects past support, annualgiving, some of which ends up in endowment orcapital expenditures and some appears as directsupport for operations, serves as a current reflection ofan institution’s competitiveness in seeking privatesupport for its mission. Every research universityoperates a major fundraising enterprise whose purposeis the acquisition of these funds to permit greatercompetitiveness for quality students and faculty, andincreased national presence.
These nine measures, then, have served as ourreference points for attempting to explore the com-petitiveness of America’s top research universities:Federal and Total Research Expenditures, NationalAcademy Memberships and National Faculty Awards,Undergraduate SAT Scores, Doctorates Awarded andPostdoctorates Supported, and Endowment andAnnual Giving.
Definitional Issues
Before turning to the classification system, we needto review the universe included within The TopAmerican Research Universities. While the UnitedStates has about 2,400 accredited institutions ofhigher education that award a baccalaureate degree,only 182 of them qualify as top research universitiesunder our definition for this report. The cutoff wechose at the beginning of this project, and havemaintained for consistency, is $20 million in annualfederal research expenditures. This number identifiesinstitutions with a significant commitment to theresearch competition. This universe of institutionscontrols approximately 94% of all federal expendi-tures for university research and includes the majorityof the faculty guild members who define the criteriafor faculty research quality. The competition takesplace primarily between the faculty in these institu-tions, and the support that makes that competitionpossible comes primarily from the 182 institutionsreported here, which had more than $20 million infederal research expenditures in fiscal year 2002.
In general, the bottom boundary of $20 million isa boundary of convenience, for it could be $30million or $15 million without much impact on theresults. The nature of the competition in which allresearch universities engage is determined primarily bythose universities at the top of the distribution—thosespending perhaps more than $100 million fromfederal research each year. Those universities have thescale to invest in their faculty, invest in the recruit-ment of their students, invest in the physical plant
and other infrastructure needed to compete forresearch grants, and provide the institutional match-ing funds so many competitive projects require. .When institutions at lower level of performance sendtheir faculty to compete for federal grants from theNIH or the NSF, they must also send them withinstitutional support equivalent to what one of thetop tier of institutions can muster behind their facultymember’s project. This drives the cost of the competi-tion upward. The top institutions set the entry barrierfor competition in any field. A top-performinginstitution can support faculty at competitive levels ina wide range of fields, disciplines, and programs. Auniversity at a lower level of performance may becapable of supporting competitive faculty in only afew fields, disciplines, or programs. The behavior ofthe top 50 or so competitors drives marketplacecompetition among research universities.
If we have a decision rule for including institutionswithin the purview of this review of competitiveness,we also have to define what we mean by “institution.”American universities, especially public universities,exist in a bewildering variety of institutional con-structs, bureaucratic arrangements, public organiza-tional structures, and the like. For those interested inthis structure, we reviewed these organizationalpatterns in our 2002 report. . As mentioned in theintroduction, for various political and managerialreasons, many multi-campus public universities preferto present themselves to the public as if they were oneuniversity. We believe that while these formulationsserve important political and organizational purposes,they do not help us understand research universitycompetition and performance. The primary actors indriving research university performance are thefaculty, and because the faculty are almost universallyassociated with a particular campus locality, andbecause the resources that support most facultycompetitive success come through campus-basedresources or decisions, we focus on campus-definedinstitutions. The unit of analysis, for example, is notthe University of California, but the campuses ofBerkeley, UCLA, UC San Diego, UC Davis, and soon. We compare the performance of Indiana-Bloomington and Massachusetts-Amherst; we com-pare Illinois-Urbana Champaign and Michigan-AnnArbor. Some university systems resent this distinc-tion, believing that this study should preserve theirformulation of a multi-campus single university. Wedo not agree because we believe that the resource baseand competitive drive that make research competitionsuccessful come from campus-based faculty.

Page 18
In some cases, this produces complexities. Forexample, the University of Michigan has itsmedical enterprise and all research activityassociated with it on its Ann Arbor campus, whilethe Massachusetts campuses of Amherst andWorcester operate independently and so appearseparately in our report, even though both belongto the University of Massachusetts system. Inmost cases, these distinctions are relatively easy tomake. Another variation occurs with IndianaUniversity, whose Bloomington campus has acomplete undergraduate and graduate programand whose Indianapolis campus operated jointlyby Indiana and Purdue also has a completeundergraduate and graduate program as well as amedical school. In addition, each campus has itsown independent law school. We report researchseparately for each campus even though bothbelong within the Indiana University administra-tive structure. The criteria we use to identify acampus are relatively simple. We look to seewhether a campus reports its research dataindependently, operates with a relatively autono-mous academic administrative structure, admitsundergraduate students separately, has distinctacademic programs of the same type, and likecriteria. If many of these elements exist, we takethe campus as the entity about which we reportthe data. While not all of our colleagues agreewith our criteria for this study, the loss is minimalbecause we provide all the data we use in a formatthat permits every institution to aggregate thedata to construct whatever analytical categories itbelieves most useful for its purposes. This reportpresents the data in a form most useful for ourpurposes.
As an illustration of the difficulty of usingsystems as the unit of analysis, the followingtables show systems inserted in the federalresearch expenditures ranking as if they weresingle institutions. For this demonstration wecombined those campuses of state systems thatappear independently within The Top AmericanResearch Universities with more than $20 millionin federal research. A few systems have cam-puses with some federal research expendituresthat do not reach this level of competitiveness,but we did not include those for the purposesof this demonstration.
Note that the research campuses of five publicsystems together perform federal research at levelsthat place them among the top 10 single-campus
institutions. Only the University of California systemexceeds the research productivity of Johns Hopkins,and only the University of Texas system exceeds allother campuses. Other systems performing withinthe top 10 of individual campuses are the Universityof Illinois, ranked about seventh, and the Marylandand Colorado systems, ranked about ninth.
Three systems perform at levels that match thefederal research expenditures of the second 10 cam-puses: SUNY, Penn State, and the University ofAlabama systems.
The Utah State system appears at 22 and the TexasA&M system at 32 among individual campusesranked from 21 to 40.
Ten other systems complete this distribution, withthe University of Nevada system having the smallestaggregated federal research expenditures ranking atabout 102 among these campuses.
The complete table showing all the measures(except the SAT, which cannot be combined from thecampus data for system totals) along with nationaland control rankings for systems and individualinstitutions is in the Appendix.
An inspection of this table shows that the totals forsystems reflect primarily the political and bureaucraticarrangements of public research campuses rather thanany performance criteria. A different political organi-zation of the University of California system—wemight imagine a Northern University of Californiaand a Southern University of California—wouldproduce dramatically different rankings withoutrepresenting any change in the underlying productiv-ity of campuses. The number of campuses with morethan $20 million in federal research expenditures inany one system varies from a low of 2 in many statesto a high of 9 for the University of California system.Note that many of these systems have many morecampuses, but for this comparison we included onlythose with more than $20 million in federal researchexpenditures. Similarly, had we done this table six orseven years ago, we would have had a State UniversitySystem of Florida in the rankings. Today, each campusin that state operates as an independent universitywith its own board. Since the goal of our work is tofocus on the quality and productivity of researchuniversities, it is campus performance that mattersmost, not the political alignments of campuses—structures that change quickly.
Definitional Issues

The Top American Research Universities Page 19
TheCenter’s Categories
Many of the critics of popular rankings focus notonly on the defective methodology that characterizesthese publications but also on the assumption that arank ordering of universities displays meaningfuldifferences between the institutions. Much attention,for example, gravitates toward small changes inranking when No. 1 in last year’s ranking is No. 2 inthis year’s. Even if the methodology that producesthese rankings were reliable and sound, which it isnot, differences between similar and closely rankedinstitutions are usually insignificant, and smallchanges on an annual basis rarely reflect underlyingimprovement or decline in relative institutionaleffectiveness. Universities are indeed different. Theyhave different levels of performance, and their relativeperformance varies in comparison with the perfor-mance of their competitors. Universities’ rank order
on various indicators does change from year to year,but these changes can reflect a decline in nearbyinstitutions rather than an improvement in thecampus with an improved rank. Significant changesin university performance tend to take time, and mostinstitutions should respond not to annual changes inrelative performance but rather to trends in relativeperformance.
This is an important consideration because focus-ing on short-term variations in suspect rankings leadstrustees, parents, and others to imagine that universityquality itself changes rapidly. This is false, primarilybecause the key element in institutional quality comesfrom the faculty and the faculty as a group changesrelatively slowly. Faculty turnover is low, and mostfaculty have long spans of employment at theirinstitution. While the media notice any rapid move-ment of superstars from one institution to another,
University of California system 1,706,603
Private Johns Hopkins University 1,022,510 1
University of Texas system 752,586
Public University of Washington - Seattle 487,059 2
Public University of Michigan - Ann Arbor 444,255 3
Private Stanford University 426,620 4
Private University of Pennsylvania 397,587 5
Public University of California - Los Angeles 366,762 6
Public University of California - San Diego 359,383 7
University of Illinois system 357,506
Private Columbia University 356,749 8
Public University of Wisconsin - Madison 345,003 9
University of Maryland system 340,488
University of Colorado system 337,061
Private Harvard University 336,607 10
Private Massachusetts Institute of Technology 330,409 11
Public University of California - San Francisco 327,393 12
Public University of Pittsburgh - Pittsburgh 306,913 13
Private Washington University in St. Louis 303,441 14
State University of New York system 302,956
Public University of Minnesota - Twin Cities 295,301 15
Pennsylvania State University system 284,706
University of Alabama system 278,781
Private Yale University 274,304 16
Private Cornell University 270,578 17
Private University of Southern California 266,645 18
Private Duke University 261,356 19
Private Baylor College of Medicine 259,475 20
ControlInstitutions with More Than $20 Million in Federal Research Expenditures
and Public Multi-Campus Systems Ranked 1-20 out of 40 (Systems include only campusesat $20 Million in Federal Research Expenditures)
2002***
Federal Researchx $1000
Federal ResearchNational Rank

Page 20
these changes affect a very small number of faculty.The impact of such defections and acquisitions on thefundamental competitive quality of the institution islikely small unless accompanied by a sustainedreduction of investment in the areas they represent ora decline in the quality of the replacements hired.
Year-to-year changes also can be deceptive becauseof spot changes in the research funding marketplace,temporary bursts of enthusiasm for particular institu-tional products as a result of a major capital gift, afootball or basketball championship, and other one-time events. These things can produce a spike insome indicator, producing what appears to be achange in the relative position of an institution in aranking, but the actual sustained change in institu-tional quality may be quite small.
At the same time, annual reports of relative perfor-mance on various indicators serve a useful purpose foruniversity people focused on improvement andcompetitiveness. Changes reflected in these indicatorsrequire careful examination by each institution todetermine whether what they see reflects a temporaryspike in relative performance or an indication of atrend to be reversed or enhanced. Single valuerankings, that combine and weight many different
elements of university performance, obscure realperformance elements and render the resulting rankedlist relatively useless for understanding the relativestrength of comparable institutions.
At TheCenter, considering these issues, we decidedto present the best data possible on research universi-ties and then group the institutions into categoriesdefined by similar levels of competitiveness on theindicators for which we could get good data. Whilethis does indeed rank the institutions, it does so in away that forces the observer to recognize both thestrength and weakness of the data as well as thevalidity of the groups as a device for categorizinginstitutional competitiveness.
The methodology is simple. We ranked theuniversities in our set of research institutions on thenine indicators. We then put institutions performingamong the top 25 on all the indicators in the firstgroup, the institutions performing among the top 25on all but one of the indicators in the second group,and so on. This process follows from the observationthat America’s best research universities tend toperform at top levels on all dimensions. The mostcompetitive institutions compete at the top levels in
Public Pennsylvania State University - University Park 256,235 21
Public University of North Carolina - Chapel Hill 254,571 22
Utah State system 222,018
Public University of Texas - Austin 219,158 23
Public University of California - Berkeley 217,297 24
Public University of Alabama - Birmingham 216,221 25
Public University of Illinois - Urbana-Champaign 214,323 26
Public University of Arizona 211,772 27
Private California Institute of Technology 199,944 28
Private University of Rochester 195,298 29
Public University of Maryland - College Park 194,095 30
Public University of Colorado - Boulder 190,661 31
Private Emory University 186,083 32
Texas A&M University system 185,905
Private University of Chicago 183,830 33
Private Case Western Reserve University 181,888 34
Public University of Iowa 180,743 35
Private Northwestern University 178,607 36
Public Ohio State University - Columbus 177,883 37
Public University of California - Davis 176,644 38
Private Vanderbilt University 172,858 39
Private Boston University 171,438 40
ControlInstitutions with More Than $20 Million in Federal Research Expenditures
and Public Multi-Campus Systems Ranked 21-40 out of 40 (Systems include only campusesat $20 Million in Federal Research Expenditures)
2002***
Federal Researchx $1000
Federal ResearchNational Rank
TheCenter’s Categories

The Top American Research Universities Page 21
federal research, total research, and student quality.They produce the most doctorates, they support themost postdocs, they raise the most money from theiralumni and friends, and they run the largest annualprivate giving programs. They have the most facultyin the national academies, and their faculty win themost prestigious awards. We also do this grouping intwo ways—first, taking all research universities, publicor private, and grouping them according to theirrelative performance. and second, separating theuniversities by their control or governance (public orprivate) and then grouping the publics by theircompetitive success among public institutions and theprivates by their competitive success among privateinstitutions.
This method focuses attention on the competitionthat drives public and private research universitysuccess and challenges the observer to understand themarketplace within which they compete.
Change Over Time
TheCenter’s methodology allows a comparison ofchange over time in valid and reliable objectiveindicators of success. Unlike popular magazinerankings, which change each year much more quicklythan universities actually change, TheCenter’s rankingsgive a good measure of how likely change actually isfor universities. Even TheCenter’s data, however, aresusceptible to misinterpretation because universitiescan change their reporting methods or reorganizetheir institutions in ways that produce changes in thedata that may not reflect actual changes in perfor-mance. Careful review of major shifts in researchperformance by individual institutions can separatethe real changes from artifacts of changes in reportingor organization.
The Top American Research University rankings areperhaps more useful for illustrating the competitionthat defines research success than for displaying therank order itself. For example, our analysis of thefederal research data demonstrated that the competi-tion among institutions over time produces a fewdramatic leaps forward and some steady change overtime. This is significant because often trustees,alumni, and other observers imagine that a reasonableexpectation is for a university to rise into the top 10or some similar number in the space of a few years bysimply doing things better or more effectively. If theinstitution is already No. 12 in its competitiveness,perhaps such an expectation is reasonable. If aninstitution is competing among other institutions that
rank in the 20s or 30s, a move into the top 10 in 10years is probably beyond reach. This is because thedistance in performance between the top institutionsand the middle-to-bottom institutions in this market-place is very large.
In the important federal research funding competi-tion, which is the best indicator of competitive facultyquality, the median annual federal research expendi-ture of a top-10 research university is about $382.2million a year. The median for the 10 researchuniversities ranked from 41 to 50 nationally onfederal research expenditures is about $155.3 million.A median institution in this group would need todouble its annual federal research expenditures toreach the median of the top 10. If we look at only thetop 25 institutions, the median of federal researchexpenditures in this elite group is $317.2 million,with a high at Johns Hopkins of $1,022.5 million anda low at the University ofAlabama–Birmingham of$216.2 million. UA-Birmingham would haveto increase its federalresearch expenditures by afactor of about five tomatch Hopkins. To meeteven the median of thegroup, it would need anincrease of $100 millionper year. This is a formi-dable challenge for even atop-25 research university.
The second group of 25institutions has a muchlower median of $176.6 million. For the 50th-rankedinstitution in federal research, the University of Utahwith $142.6 million, to reach the median of theinstitutions ranked in the second 25, it would need toincrease its federal research expenditures by about $24million per year, or 17%.
These two examples illustrate an importantcharacteristic of the university federal research market-place. At the top, the difference between universityperformances tends to be much greater than at lowerlevels. As we go down the ranking on federal research,institutional performance clusters closer and closer,with small differences separating an institution fromthe ones above and below. The spread between thebottom of the top 25 and median of the top 25 isabout $100 million. The spread between the bottomof the second 25 and the median is about $24 mil-lion; but the spread between the last institution in theover-$20 million ranking (at $20.0 million) and the
Because universities change
their reporting methods or
reorganize their institution’s
changes in data may not
reflect actual changes in
performance.

Page 22
median of the last 25 institutions in the over-$20million group (at $22.8 million) is only about $2.8million.
This pattern helps explain the small amount ofsignificant change in ranking among the top institu-tions over the five years of TheCenter’s publicationsand the larger amount of movement in rank amongthe institutions lower down in the research productiv-ity ranking. For example, if we look at the top 10institutions in our first publication in 2000 that usedfederal research data from 1998, only one (MIT) fellout of the top 10 by 2002 to be replaced by Colum-bia, a university not in the top 10 in 1998. A similaramount of modest change occurs among the top 25.Within this group in 1998, only two institutions fellout of this category in the 2002 data (University ofIllinois-Urbana-Champaign and Caltech), replaced bytwo institutions not in the top 25 in 1998 (Penn Stateand Baylor College of Medicine). These examplesdemonstrate that the large amounts of federal researchrequired to participate in the top categories of univer-sity competition create a barrier for new entrantsbecause the characteristics of success are self-perpetu-ating. Very successful institutions have the character-istics that continue to make them major competitorsin this marketplace year after year.
If we look nearer the middle of the distribution ofuniversities by their federal research expenditures andchart the changes over the five years of our reports, wesee considerably more change in the rankings, as wewould expect. For example, among universitiesranked nationally from 101 to 125 on federal researchexpenditures, nine institutions included in this groupin 1998 disappeared from this section of the rankingsby 2002 and another nine institutions took theirplace. However, the movement into and out of thisgroup is quite varied.
Five institutions moved from a lower ranking in1998 into the 121-125 group in 2002:
Another four institutions declined in rank fromtheir 1998 location in this group to fall below 125 inthe 2002 ranking:
Finally, five institutions moved out of the 121-125category in 1998 into a higher ranking for 2002:
These examples reflect the greater mobility at thelower ranks, where the difference between oneuniversity and another can be quite small and a fewsuccessful grants can jump an institution many rankswhile a few lost projects can drop an institution out ofits category.
Rankings, however, have another difficulty. Thedistance between any two contiguous institutions inany one year can vary dramatically, so changes thatreflect one or two ranks may represent either asignificant change in performance or a relativelyminor change in performance. For example, if wetake the top 25 and calculate the distance thatseparates each institution from the one above it, themedian separation is $6.8 million. However, leavingaside the difference between No. 2 and Johns Hopkins(which is $535.5 million), the maximum distance is$42.8 million and the minimum distance is $1.1million. Even in this rarefied atmosphere at the top ofthe ranking charts, the range is dramatic and very
Change Over Time
Kansas State 130 121 +9
Auburn 128 122 +6
West Virginia 134 113 +11
University of New Hampshire-Durham 133 112 +21
University of Connecticut-Storrs 143 110 +33
Institution
FedResearchRanking
1998
FedResearchRanking
2002
Changein Fed
ResearchRank
Institution
University of Massachusetts-Amherst 100 106 -6
Washington State University-Pullman 96 105 -9
George Washington University 94 103 -9
Tulane University 86 101 -15
FedResearchRanking
1998
FedResearchRanking
2002
Changein Fed
ResearchRank
Rice University 110 128 -18
UC Santa Cruz 119 139 -20
Syracuse University 120 140 -20
Brandeis University 125 152 -27
Institution
FedResearchRanking
1998
FedResearchRanking
2002
Changein Fed
ResearchRank
University of Tennessee – Knoxville 104 74 +30
Mississippi State University 102 89 +13
University of South Florida 109 77 +32
Medical University of South Carolina 107 91 +16
University of Alaska – Fairbanks 115 99 +16
Institution
FedResearchRanking
1998
FedResearchRanking
2002
Changein Fed
ResearchRank
Four institutions lost ground and moved from ahigher ranking in 1998 into the 121-125 group in2002:

The Top American Research Universities Page 23
the table on the following page indicates, 11 ofthese top 25 fell by at least one rank over the fiveyears included here.
Illustrating the remarkable competitivenessof this marketplace, note that even institutionsthat grew by more than 30%, or an average ofmore than 6% a year, lost rank. In researchuniversity competition, growth alone is not asufficient indicator of comparative success.Universities must increase their researchproductivity by more than those universitiesaround them increase or lose position withinthe rankings. Similar results appear fartherdown the ranking, as the table on page 25illustrates, for universities ranked between 75and 100 on federal research in 2002.
Note that, as mentioned above, the amountof positive change in federal research required toproduce an improvement in rank is considerably lessthan in the top 25. The percentage improvement toproduce a change in rank is also larger in most cases.Almost all universities in the top 100 of federalresearch expenditure show an improvement with theexception of North Carolina State, which reportedfewer federal research expenditures in 2002 than in1998. Growth alone does not keep a university evenwith the competition and, as is clear in these data, thecompetition is intense and demanding.
Similar exercises using the data published onTheCenter’s Web site can serve to highlight thecompetitive marketplace for any subset of institutionsincluded within The Top American Research Universi-ties. While we have emphasized the federal researchexpenditures in these illustrations, similar analysis willdemonstrate the competitiveness in the area of totalresearch expenditures, faculty awards, and the otherindicators collected and published by TheCenter.
Another perspective on the complexity of identify-ing and measuring universities’ national competitiveperformance appears when we examine the change inthe number of national awards won by faculty. Thelist of these awards is available in the Source Notessection of this report, and we have collected thisinformation systematically over the five years. How-ever, faculty awards reflect a somewhat less orderlyuniverse than we see in research expenditure data.The number of faculty with awards varies over time asuniversities hire new faculty, others retire or leave, theaward programs have more or less funding for awards,and the award committees look for different qualities
unevenly distributed. The following graph illustratesthe difference between each institution and the oneabove it for the institutions ranked between 3 and 25on federal research in 2002.
All of this explains why TheCenter groups institu-tions rather than focuses on each institution’s preciserank order. Even this method has its difficultiesbecause the differences between institutions on eachside of a group boundary may not be particularlylarge. Nonetheless, a method that groups universitiesand considers their performance roughly comparableis better than simple ranking that can imply an evenlyspaced hierarchy of performance.
When we review these data in search of an under-standing of the competitive marketplace of researchuniversities, we pay special attention to other charac-teristics of the data. Some universities have research-intensive medical schools; some institutions operate asstand-alone medical centers, and some research-intensive universities have no medical school. Overthe last five years at least, the federally funded researchopportunities available in the biological and medicallyrelated fields have grown much faster than have thosein the physical sciences. Some of the significantchanges observed in the last five years reflect thecompetitive advantage of institutions with research-intensive medical schools. However, not all medicalschools have a major research mission, but when theydo, and when the medical research faculty are of highquality and research oriented, the biological sciencesemphasis likely provides a significant advantage in thecompetition as seen in our 2001 report.
For example, among the top 25 institutions infederal research expenditures, all but two have medicalschools included in their totals. However, having amedical school is no guarantee, even in this topcategory, of meeting the competition successfully. As
Diff
eren
ce t
o N
ext
Hig
her-
Ran
ked
Inst
itutio
ns (x
$1,
000)
National Ranked, Federal Research Expenditures
Difference to Next Higher-Ranked InstitutionFederal Research Expenditures, 2002
(Institutions Ranked 3-25)
u
u
uu
u
u
u
uu
u
u
u
u
u
u uu
uu
u
u
u u
3 4 5 6 7 8 9 10 11 12 13 14 15 16 17 18 19 20 21 22 23 24 250
5,000
10,000
15,000
20,000
25,000
30,000
35,000
40,000
45,000

Page 24
at different times. Moreover, the number of awardswe capture also varies by year: in 1999 we identified2,161 faculty with awards that met our criteria, and in2003 this number had declined to 1,877. This is asmall number of awards for the 182 institutionsincluded in our group. The first 50 institutions in thelist, in both 1999 and 2003, capture more than 66%of these awards. In addition, ranking data are evenless useful here than in other contexts because manyuniversities have the same number of faculty memberswith awards and therefore have the same rank num-ber. A change in one faculty member with an awardcan move an institution some distance on the rankscale, as the chart on page 26 demonstrates for thefirst 10 in our list. The range of faculty awards in2003 for all universities in our more than $20 millionlist ranges from zero at the bottom of the list toHarvard’s 54 faculty awards. Even so, among the top10, seven have fewer awards and only three have moreawards in 2003. Another way of looking at these data
is to see what percentage of the total awards identifiedcorresponds to groups of institutions or individualinstitutions. In this case, while the top 50 capturemore than 66% of the awards, the 110 institutionswith 10 or fewer awards (they are 61% of all universi-ties in the list) have only 5.9% of the awards. Indeed,38% of the awards belong to the top 20 institutions.
Even among the top 20, we can see considerablechange. Four institutions in 2003 replaced fiveinstitutions in the top 20 in 1999 (the ties inaward numbers account for the difference betweenfive and four).
This view of university performance data over timehighlights one of the fundamental purposes of TheTop American Research Universities project. Byproviding a standard, stable, and verifiable set ofindicators over time, universities interested in theirperformance within the competitive marketplace ofresearch institutions can track how well they are doing
Institution
Baylor College of Medicine 20 148,865 134.6 20 *
University of Pittsburgh – Pittsburgh 10 138,402 82.1 13 *
Pennsylvania State University – University Park 5 92,314 56.3 21
University of California – Los Angeles 4 132,757 56.7 6 *
Columbia University 3 127,026 55.3 8 *
University of Pennsylvania 3 149,673 60.4 5 *
Washington University in St. Louis 3 116,268 62.1 14 *
University of Texas – Austin 2 54,076 32.8 23
University of Michigan – Ann Arbor 1 132,805 42.6 3 *
University of Washington – Seattle 1 144,768 42.3 2 *
Duke University 0 88,824 51.5 19 *
Johns Hopkins University 0 269,527 35.8 1 *
University of California – San Francisco 0 107,763 49.1 12 *
University of Wisconsin – Madison 0 104,490 43.4 9 *
University of Alabama – Birmingham -1 49,391 29.6 25 *
University of California – San Diego -1 96,280 36.6 7 *
University of Minnesota – Twin Cities -1 90,560 44.2 15 *
University of North Carolina -– Chapel Hill -1 83,066 48.4 22 *
Cornell University -2 66,391 32.5 17
Stanford University -2 84,194 24.6 4 *
University of Southern California -2 76,098 39.9 18 *
Harvard University -3 84,731 33.6 10 *
Yale University -3 69,258 33.8 16 *
University of California – Berkeley -4 45,550 26.5 24 *
Massachusetts Institute of Technology -6 19,668 6.3 11
Change in Federal Research Expenditures 1998-2002, Top 25 in 2002
Change Over Time
$ Change MedicalRank Change x 1,000 % Change Rank School *

The Top American Research Universities Page 25
relative to their counterparts and relative to themarketplace. They can see where their institution hasbeen and where its recent performance places it. Thedata do not identify the internal activities, incentives,organizational changes, and revenue opportunitiesthat explain the changes observed, but the data forceinstitutions to confront their relative achievementsamong their counterparts whose faculty compete inthe same markets.
Different institutions at different points in theirdevelopment or with different strategies for competi-tive success will use these data in different ways. Theywill design strategies for improvement or choose tofocus on activities unrelated to research as theirmission and trustees dictate. In making these deci-sions, TheCenter’s data provide them with a reliableand comparative framework to understand thecompetition they face in the research universitymarketplace.
Faculty Numbers
Even though the most important element inresearch university success comes from the faculty, thedata on individual faculty performance prove ex-tremely difficult to acquire. Ideally, we could count auniversity’s total number of research faculty. Then wecould calculate an index of faculty research productiv-ity. Such a procedure would allow us to compare thecompetitiveness of the faculty of each institutionrather than the aggregate competitiveness of theinstitution. In such an analysis, we might find thatthe individual research faculty at a small institutionare more effective and competitive per person thanthe research faculty at a large institution, even if theaggregate competitiveness of the large institutionexceeds that of the smaller university. Various re-searchers have attempted this form of analysis, but theresults have been less useful than anticipated.
The reason for the difficulty is simple. We do nothave an accurate, standard method for counting thenumber of research faculty at universities. The
Change in Federal Research Expenditures 1998-2002, Rank 75-100 in 2002National $ Change National
Rank Change x1,000 % Change Rank in 2002University of South Florida 32 48,178 134.1 77Dartmouth College 20 42,202 93.7 75Medical University of South Carolina 16 39,330 107.8 91University of Alaska – Fairbanks 16 34,664 110.0 99Mississippi State University 13 35,517 84.6 89University of Texas Health Science Center – San Antonio 9 31,807 61.2 78Medical College of Wisconsin 9 32,410 73.9 90Thomas Jefferson University 5 27,489 53.1 83University of Texas Medical Branch – Galveston 5 29,512 60.7 86University of Missouri – Columbia 5 32,294 71.1 88Utah State University 1 24,490 44.6 82Brown University 0 23,803 53.6 97Rockefeller University 0 23,714 54.1 98Indiana University–Purdue University – Indianapolis -1 22,151 38.5 81University of Georgia -3 23,374 42.7 87Iowa State University -5 20,223 39.5 94Florida State University -5 20,005 39.7 95Rutgers NJ – New Brunswick -6 19,024 30.6 80Virginia Commonwealth University -8 16,861 35.0 100Woods Hole Oceanographic Institution -12 13,693 21.1 84New Mexico State University – Las Cruces -14 13,727 24.3 96University of California – Santa Barbara -15 9,690 14.1 85Tufts University -18 12,069 19.7 93Georgetown University -21 2,286 2.7 76Virginia Polytechnic Institute and State University -22 242 0.3 79North Carolina State University -29 (4,329) -5.4 92
Institution
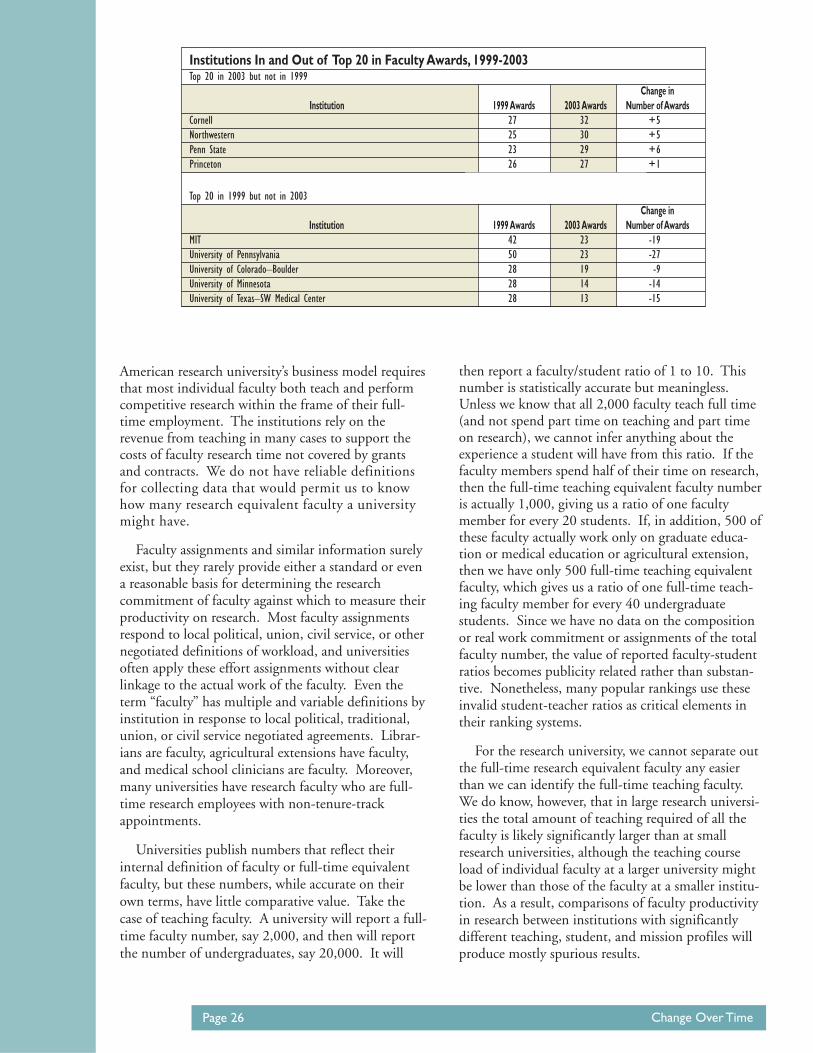
Page 26
American research university’s business model requiresthat most individual faculty both teach and performcompetitive research within the frame of their full-time employment. The institutions rely on therevenue from teaching in many cases to support thecosts of faculty research time not covered by grantsand contracts. We do not have reliable definitionsfor collecting data that would permit us to knowhow many research equivalent faculty a universitymight have.
Faculty assignments and similar information surelyexist, but they rarely provide either a standard or evena reasonable basis for determining the researchcommitment of faculty against which to measure theirproductivity on research. Most faculty assignmentsrespond to local political, union, civil service, or othernegotiated definitions of workload, and universitiesoften apply these effort assignments without clearlinkage to the actual work of the faculty. Even theterm “faculty” has multiple and variable definitions byinstitution in response to local political, traditional,union, or civil service negotiated agreements. Librar-ians are faculty, agricultural extensions have faculty,and medical school clinicians are faculty. Moreover,many universities have research faculty who are full-time research employees with non-tenure-trackappointments.
Universities publish numbers that reflect theirinternal definition of faculty or full-time equivalentfaculty, but these numbers, while accurate on theirown terms, have little comparative value. Take thecase of teaching faculty. A university will report a full-time faculty number, say 2,000, and then will reportthe number of undergraduates, say 20,000. It will
then report a faculty/student ratio of 1 to 10. Thisnumber is statistically accurate but meaningless.Unless we know that all 2,000 faculty teach full time(and not spend part time on teaching and part timeon research), we cannot infer anything about theexperience a student will have from this ratio. If thefaculty members spend half of their time on research,then the full-time teaching equivalent faculty numberis actually 1,000, giving us a ratio of one facultymember for every 20 students. If, in addition, 500 ofthese faculty actually work only on graduate educa-tion or medical education or agricultural extension,then we have only 500 full-time teaching equivalentfaculty, which gives us a ratio of one full-time teach-ing faculty member for every 40 undergraduatestudents. Since we have no data on the compositionor real work commitment or assignments of the totalfaculty number, the value of reported faculty-studentratios becomes publicity related rather than substan-tive. Nonetheless, many popular rankings use theseinvalid student-teacher ratios as critical elements intheir ranking systems.
For the research university, we cannot separate outthe full-time research equivalent faculty any easierthan we can identify the full-time teaching faculty.We do know, however, that in large research universi-ties the total amount of teaching required of all thefaculty is likely significantly larger than at smallresearch universities, although the teaching courseload of individual faculty at a larger university mightbe lower than those of the faculty at a smaller institu-tion. As a result, comparisons of faculty productivityin research between institutions with significantlydifferent teaching, student, and mission profiles willproduce mostly spurious results.
Change Over Time
Institutions In and Out of Top 20 in Faculty Awards, 1999-2003Top 20 in 2003 but not in 1999
Change in Institution 1999 Awards 2003 Awards Number of Awards
Cornell 27 32 +5Northwestern 25 30 +5Penn State 23 29 +6Princeton 26 27 +1
Top 20 in 1999 but not in 2003Change in
Institution 1999 Awards 2003 Awards Number of AwardsMIT 42 23 -19University of Pennsylvania 50 23 -27University of Colorado–Boulder 28 19 -9University of Minnesota 28 14 -14University of Texas–SW Medical Center 28 13 -15
The Top American Research Universities Page 27
The following table, taken from one of DeniseGater’s publications from TheCenter on this topic,illustrates this difficulty. Note that the definitions offaculty used here reflect three common methods ofcounting faculty. The first, labeled Salaries, comesfrom the federal government’s IPEDS Salaries surveythat includes a definition of full-time instructionalfaculty. Even though this definition applies to allreporting institutions, individual institutions fre-quently report this number using different methodsfor counting the faculty included. The seconddefinition of faculty, IPEDS Fall Staff, is a count usedby many universities to report the number of facultyon staff at the beginning of each academic year.However, the methods used to define “Staff” vary byinstitution. To help with this, institutions also reporta number related to “Tenure or Tenure Track Faculty,”in the Fall Staff survey which is the third method usedhere. Even with this definition, there are a variety ofdifferences in how universities report. The tableincludes a sample of institutions that report all threefaculty counts with each institution’s federal researchexpenditures as reported for 1998 (identified asFederal R&D Expenditures in the table). If we divideeach of the institutions’ federal research number bythe number of faculty reported under each definition,and then rank the per-faculty productivity, we get thewidely varying rank order seen in the table.
As the table shows, depending on the definitionused, the relative productivity per faculty variesdramatically, and any rankings derived from suchcalculations become completely dependent not onfaculty productivity itself but on the definitions usedin counting the number of faculty, and even the ranksbased on the same definition of faculty have littlevalidity because universities apply the standarddefinition in quite varying ways.
At the campus level, however, it is possible andoften very helpful to focus on individual colleges andeven departments or programs and compare indi-vidual faculty productivity. An engineering collegecould compare the research grant expenditures of itsfaculty to the research productivity of engineeringfaculty at other major institutions. Chemistry facultycan compare their publication counts or citations,historians can compare the book and scholarly articleproductivity, and similar, discipline-specific compari-sons can help institutions drive improvement. Thesemeasurements do not aggregate to an institutionaltotal, but they do provide campuses with a methodfor driving productivity increases. In addition,universities can compare the teaching productivity oftheir faculty across different institutions, but within
the same discipline. Political science departments cancompare the average teaching productivity of theirfaculty with the productivity of political sciencefaculty at other first-rank institutions.
These comparisons help establish standards forperformance and aid in achieving increased produc-tivity but, again, they do not aggregate into universitystandards very well because the appropriate teachingload in chemistry with its laboratory requirements issignificantly different from the teaching load inhistory. Moreover, institutional comparisons at thislevel of detail often fail because the composition ofinstitutional research and teaching work variesmarkedly. Campuses with many professional pro-grams may teach many more upper- than lower-division courses, campuses with significant transferpopulations will teach more upper-division courses,and campuses with small undergraduate populationscompared to their graduate populations will teachmore graduate courses. These differences affect allcomparisons at the institutional level that attempt toidentify efficiency or optimal productivity. Instead,for benchmarks of performance, institutions need tomake their comparisons at the discipline level.
Institutions often conduct peer-group comparisonsto benchmark their performance against appropriatecomparator institutions, but usually the participantsin these studies do so only on the condition that thedata remain confidential and that reports using thedata either rely on aggregate measures or reportindividual institutions anonymously. TheCenter’sexploration of comparisons involving engineering andmedicine will appear in further reports as the workconcludes.
Impact of TheCenter Report
Estimating the impact of a project such as this oneis challenging. Nonetheless, some indicators providea glimpse into the utility of these data. The reportappears in a variety of formats to reach the widestpossible audience. Some find the printed versionmost accessible; others visit the Web site to use thedata or download the report itself. Other Web sitesrefer to TheCenter’s data, and the staff participates inthe national conversation about measurement,accountability, and performance reflecting worksponsored by or inspired by TheCenter’s activities.
For example, over the first four years, we mailed alittle more than 3,000 copies of the report per year,usually with around 2,000 in the first mailing to

Page 28
universities included in the report and a range ofothers who have expressed an interest in beingincluded in the first mailing. The second thousandmailed responds to requests from institutions andindividuals. Sometimes these are for single copies andon occasion for multiple copies for use in retreats andseminars.
Another major engagement for the report takesplace through the Internet, and TheCenter’s Web sitehas a significant hit rate for such a specialized re-source. The first year, the site averaged 835 uniquehits per week, with 3,700 per month for the August-November period. About 89% of these hits camefrom the United States. In 2001, the Web presenceincreased with an average of 6,900 unique hits permonth in the same four-month time period as the2000 report. This increase also included an increasein foreign visitors, with Web visitors logged frommore than 107 countries. This pattern continued in2002, with a first four-month average reaching 8,000unique hits. The unique hit rate at this levelappears to have stabilized for the 2003 report.TheCenter staff also responds to hundreds ofinquiries via e-mail each year.
International interest in the report has surprised us,as we anticipated that these data would be of mostinterest to the American research university commu-nity. Nonetheless TheCenter received inquiries andrequests from Venezuela, Canada, the United King-dom, Spain, Sri-Lanka, Kenya, Japan, Sweden, India,and China. The following is a selection of visitors toTheCenter:
• September 2000, Rie Mori, National Institute ofAcademic Degrees, Japan
• July 2001, Peter Purdue, Naval PostgraduateSchool
• August 2002, Toyota Technical Center, USA
• October 2002, Representatives from Japan’s NewEnergy & Industrial Technology DevelopmentOrganization (NEDO); the University Administra-tion Services Department (Kawaijuku EducationalInstitution); and the Mitsubishi Research Institute
• March 2003, Dr. Hong Shen, Professor of Higher& Comparative Education, Vice Dean, School ofEducation, Huazhong University of Science &Technology, Wuhan, Hubei 430074, P.R.China.
Effect on Ranking, Using Different Faculty Counts to Calculate Federal R&D per FacultySelected Private Research Institutions (n = 25)
1998 Rank Rank UsingFed R&D Rank Using Fall Staff
Expenditures Using Fall Staff Ten/Ten($ thousands) Salaries Total Track
California Institute of Technology 177,748 1 1 1Yeshiva University 80,000 3 2 2Rockefeller University 43,845 11 4 3Massachusetts Institute of Technology 310,741 4 3 4Harvard University 251,876 10 6 5Stanford University 342,426 2 5 6Carnegie Mellon University 95,046 13 8 7University of Pennsylvania 247,914 8 11 8Case Western Reserve University 132,274 9 9 9Columbia University 229,723 22 12 10Tufts University 61,167 20 7 11Northwestern University 127,911 17 15 12Yale University 205,046 6 14 13Boston University 104,428 23 24 14Duke University 172,532 5 20 15University of Chicago 125,982 18 19 16Princeton University 69,005 21 9 17Cornell University, All Campuses 204,187 16 13 18University of Rochester 130,773 7 17 19Vanderbilt University 106,325 14 21 20Emory University 118,045 12 23 21Georgetown University 84,801 15 18 22University of Miami 101,492 19 22 23Brown University 44,412 24 15 24New York University 101,426 25 25 25
Change Over Time
Institution

The Top American Research Universities Page 29
TheCenter’s Top American Research Universitiesreport prompted comment and review in manypublications. The Scout Report included a reference,which undoubtedly increased the Web-based traffic,and The Chronicle of Higher Education citedTheCenter’s work in an article on research institutionaspirations. Newspaper stories (Arizona, New York,Indiana, Nebraska, Florida), including The New YorkTimes, featured in-depth discussion of the report andits methodology. TheCenter and its work appear inScienceWise.com, The University of Illinois CollegeRankings Web site, and the Association of Institu-tional Research resource directory, as well as in thehigher education sections of most Internet searchengines such as Google and Excite. As anotherexample of the international interest in this topic, theInternational Ranking of World Universities, availableonline, includes The Top American Research Universi-ties in its list of sources, even though this rankingsystem takes a somewhat different approach to thetask. The following table samples some of the manyinstitutions and organizations that use or cite The TopAmerican Research Universities report and data. Asearch through Google turns up many more thanthese, of course.
Association of American Universities: “About Research Universi-ties” website. [http://www.aau.com/resuniv/research.cfm]
Boston College: Research Guide: Educational Rankings. [http://www.bc.edu/libraries/research/guides/s-edurank/]
Case Western Reserve University: Ranks among the top 20private research universities nationally, according to TheCenterat the University of Florida. TheCenter ranks universities onnine indicators, including research support, significant awardsto faculty, endowment assets, annual private contributions,doctorates awarded, and average SAT scores. Case ranksamong the top 25 private universities on eight of the nineindicators. Among all research universities, public and private,Case ranks among the top 50 in seven of the nine categories.(The Top American Research Universities, August 2003). [http://www.case.edu/president/cir/cirrankings.htm#other]
Distance Learning, About: America’s Best Colleges and Universi-ties – Rankings. Top American Research Universities.Rankings of public and private research universities based onMeasuring University Performance. From TheCenter at theUniversity of Florida. [http://distancelearn.about.com/cs/rankings/a/univ_rankings_2.htm]
Feller, Irwin, “Virtuous and Vicious Cycles in the Contributionsof Public Research Universities to State Economic Develop-ment Objectives,” Economic Development Quarterly, Vol. 18,No. 2, 138-150 (2004) (Cited in) [http://edq.sagepub.com/cgi/content/refs/18/2/138]
Globaldaigaku.com: Study Abroad. The Top American ResearchUniversities 2002 (TheCenter Rankings). TheCenter includesonly those institutions that had at least $20 million in federalresearch expenditures in fiscal year 2000, and determines theirrank on nine different measures. [http://www.globaldaigaku.com/global/en/studyabroad/rank/list.html]
Midwestern Higher Education Compact: Midwest RanksProminently in Rating of America’s Top Research Universities.[http://www.mhec.org/pdfs/mw_top_univs.pdf ]
Scout Report, The: The Top American Research Universities2001 [Excel, .pdf]. An updated version of The Top AmericanResearch Universities has been released from Florida-basedresearch organization, The Center, which creates this reportannually. (The first edition of The Top American ResearchUniversities was included in the July 28, 2000 Scout Report.)[http://scout.wisc.edu/Reports/ScoutReport/2001/scout-010907-geninterest.html]
Shanghai Jiao Tong University: Institute of Higher Education,Academic Rankings of World Universities. [http://ed.sjtu.edu.cn/rank/2004/Resources.htm]
Southeastern Universities Research Association, Inc.: SURAMembership Statistics. February 2001, Compiled by the(SURA). Top American Research Universities. Source:TheCenter at the University of Florida. The TopAmericanResearch Universities, July 2000. [http://www.sura.org/welcome/membership_statistics_2001.pdf ]
Templeton Research Lectures, The Metanexus Institute: TheMetanexus Institute administers the Templeton ResearchLectures on behalf of the John Templeton Foundation. U.S.list of top research universities is taken from the LombardiProgram on Measuring University Performances, The TopAmerican Research Universities, 2002. [http://www.metanexus.net/lectures/about/index.html]
Texas A&M University: Florida Report Names Texas A&M Oneof Top Research Universities. 10/7/02. [http://www.tamu.edu/univrel/aggiedaily/news/stories/02/100702-5.html]
University of Arkansas: 2010 Commission: Making the Case.The Impact of the University of Arkansas on the Future of theState of Arkansas, Benchmarking. “… it is instructive tocompare more specifically the University of Arkansas andArkansas to the peer institutions and states in three categories:university research productivity, faculty quality, doctoral degreeproduction, and student quality; state population educationallevels and economic development linked to research universi-ties; and state and tuition support for public researchuniversities. The first objective can be achieved by using datafrom a recent report, The Top American Research Universities,published by TheCenter, a unit of the University of Florida.TheCenter’s ranking of top research universities is based on ananalysis of objective indicators in nine areas: [http://pigtrail.uark.edu/depts/chancellor/2010commission/benchmarking.html]
University of California—Irving: UC Irvine’s Rankings in TheTop American Research Universities Reports. [http://www.evc.uci.edu/planning/lombardi-0104.pdf ]
University of California—Santa Barbara: UCSB Libraries,Educational Rankings [http://www.library.ucsb.edu/subjects/education/eddirectories.html]
University of Cincinnati: Research Funding Hits Record High.UC Hits Top 20 in the Nation, Date: Oct. 23, 2001. TheUniversity of Cincinnati earned significant increases in totalexternal funding during the 2001 fiscal year, including morethan $100 million in support for the East Campus. The reportfollows UC’s ranking among the Top 20 public researchuniversities by the Lombardi Program on Measuring Univer-sity Performance. The program, based at the University ofFlorida, issued its annual report, The Top American ResearchUniversities, in July 2001. [http://www.uc.edu/news/fund2001.htm]
University of Illinois—Urbana-Champaign: Library. TopAmerican Research Universities. Methodology: This site offersan explanation of its rankings on a page titled Methodology.This report identifies the top public and private researchuniversities in the United States based upon nine quality
Page 30
measures. Universities are clustered and ranked according tototal and federal research funding, endowment assets, annualgiving, National Academy membership, prestigious facultyawards, doctorates awarded, postdoctoral appointees, and SATscores of entering freshmen. Also available are lists of the top200 public and private universities on each quality measure.The site includes other reports and resources on measuringuniversity performance. The report and Web-based data areupdated annually in mid-summer. [http://www.library.uiuc.edu/edx/rankgrad.htm]
University of Iowa: Report lists UI among top American researchuniversities (University of Iowa). [http://www.uiowa.edu/~ournews/2002/november/1104research-ranking.html]
University of Minnesota: Aug. 23, 2001 (University of Minne-sota) New Ranking Puts ‘U’ Among Nation’s Elite PublicResearch Universities [http://www.giving.umn.edu/news/research82301.html]
University of Nebraska—Lincoln: UNL Science News. NL EarnsSpot in ‘Top American Research Universities’ Ranking, Aug.30, 2000 [http://www.unl.edu/pr/science/083000ascifi.html]
University of North Carolina—Chapel Hill: A recent reportabout the top American research universities cited UNC-Chapel Hill as one of only five public universities ranked inthe top 25 on all nine criteria the authors used to evaluate thequality of research institutions. The other four universitieswere the University of California-Berkeley, the University ofCalifornia-Los Angeles, the University of Michigan-AnnArbor, and the University of Wisconsin-Madison. Updated 09/2004 [http://research.unc.edu/resfacts/accomplishments.php]
University of Notre Dame: Report on Top American ResearchUniversities for 2003 is Released, posted 12/04/03.The 2003Lombardi report on The Top American Research Universitiesis now available. It provides data and analysis on the perfor-mance of more than 600 research universities in America.Among the nine criteria used in the report are: Total Research,Federal Research, National Academy Members, and FacultyAwards. [http://www.nd.edu/~research/Dec03.html]
University of South Florida: USF is classified as Doctoral/Research Extensive by the Carnegie Foundation for theAdvancement of Teaching, and is ranked among the top 100public research universities in the annual report “The TopAmerican Research Universities.” [http://www.internationaleducationmedia.com/unitedstates/florida/University_of_southern_florida.htm]
University of Toronto: Governing Council, A Green Paper forPublic Discussion Describing the Characteristics of the Best(Public) Research Universities. Citation: E.g., in the UnitedStates: …., the rankings of John V. Lombardi, Diane D. Craig,Elizabeth D. Capaldi, Denise S. Gater, Sarah L. Medonça, TheTop American Research Universities (Miami: The Center, theUniversity of Florida), 2001. [http://www.utoronto.ca/plan2003/greenB.htm]
Utah State University: Utah State University, Research RankingTheCenter’s Report: The Top American Research Universities.TheCenter is a reputable non-profit research enterprise in theU.S., which focuses on the competitive national context formajor research universities. [http://www.tmc.com.sg/tmc/tmcae/usu/]
Virginia Research and Technology Advisory Commission:Elements for Successful Research in Colleges and Universities.This summary of descriptive and analytic information is basedon the findings of: (1) recent national scholarship on “topAmerican research universities;” [Citation is toTheCenter].[http://www.cit.org/vrtac/vrtacDocs/schev-researchelements-05-21-03.pdf ]
This visibility led to requests for TheCenter’s staff toaddress a wide range of audiences including universitygroups in Louisiana, South Carolina, Pennsylvania,and Massachusetts as well as invited presentations atinternational meetings in China and Venezuela.TheCenter’s staff also provided invited presentations tothe National Education Writers Association, theCouncil for Advancement and Support of Education,a Collegis, Inc., conference, the National Council ofUniversity Research Administrators, the Associationfor Institutional Research, the Association of Ameri-can Universities Data Exchange (AAUDE), andanother presentation at a Southern Association ofCollege and University Business Officers meeting.
Although we have received many commentsreflecting the complexity and differing perspectives oncomparative university performance, a particularlyinteresting study will appear in a special issue of theAnnals of Operations Research on DEA (Data Envelop-ment Analysis) on “Validating DEA as a RankingTool: An Application of DEA to Assess Performancein Higher Education” (M.-L. Bougnol and J.H.Dulá). This study applies DEA techniques to The TopAmerican Research Universities to test the reliability ofTheCenter’s ranking system and indicates that at leastin using this technique, the results appear reliable.
Future Challenges
Although this report concludes the first five-yearcycle of The Top American Research Universities, the co-editors, the staff, and our various institutional spon-sors believe that the work of TheCenter has proveduseful enough to continue. With the advice of ourAdvisory Board, whose constant support andcritiques have helped guide this project over thepast years, we will find appropriate ways to con-tinue the work begun here.
NotesTheCenter Staff and Advisory Board
Throughout the life of TheCenter, the followingindividuals have served on the staff in various capaci-ties, including the authors of this report: John V.Lombardi, Elizabeth D. Capaldi, Kristy R. Reeves,and Denise S. Gater. Diane D. Craig, Sarah L.Mendonça, and Dominic Rivers appear as authors insome or all of the previous four reports. In addition,TheCenter has enjoyed the expert and effective staff
Impact of TheCenter Report

The Top American Research Universities Page 31
assistance of Lynne N. Collis throughout its existence,the technical help of Will J. Collante for Web anddata support, and the many contributions of VictorM. Yellen through the University of Florida Office ofInstitutional Research. As mentioned in the text,financial support for TheCenter’s work comes from agift from Mr. Lewis M. Schott, the University ofFlorida, the University of Massachusetts, and the StateUniversity of New York.
The current Advisory Board to TheCenter has beenactively engaged with this project and its publicationsfor the five years of its existence. Their extensiveexpertise, their lively discussions at our meetings, andtheir clear critiques and contributions to our workhave made this project possible. They are: Arthur M.Cohen (Professor Emeritus, Division of HigherEducation, Graduate School of Education andInformation Studies, University of California, LosAngeles), Larry Goldstein (President, CampusStrategies, Fellow, SCT Consultant, NACUBO),Gerardo M. Gonzalez (University Dean, School ofEducation, Indiana University), D. Bruce Johnstone(Professor of Higher and Comparative Education,Director, Center for Comparative and Global Studiesin Education, Department of Educational Leadershipand Policy, University of Buffalo), Roger Kaufman(Professor Emeritus, Educational Phychology andLearning, Florida State University, Director, RogerKaufman and Associates, Distinguished ResearchProfessor, Sonora Institute of Technology), andGordon C. Winston (Orrin Sage Professor of PolitialEconomy, Emeritus, and Director, Williams Projecton the Economics of Higher Education, WilliamsCollege).
TheCenter Reports
The Myth of Number One: Indicators of ResearchUniversity Performance (Gainesville: TheCenter, 2000)engaged the issue of rankings in the very first reportthat discusses some of the issues around the Americanfascination with college and university rankings.Here, we describe the indicators TheCenter uses tomeasure research university performance, and in allthe reports we include a section of notes that explainthe sources and any changes in the indicators. The2000 report also includes the first discussion of thelarge percentage of federal research expenditurescontrolled by the more than $20 million group—adominance that remains, as demonstrated in the 2004report. A useful discussion of the most visible popularranking system is in Denise S. Gater, U.S. News &World Report’s Methodology (Gainesville: TheCenter,
2001, Revised) [http://thecenter.ufl.edu/usnews.html], and Gater, A Review of Measures Used inU.S. News & World Report’s “America’s Best Colleges”(Gainesville: TheCenter, 2002) [http://thecenter.ufl.edu/Gater0702.pdf ]. For a discussion ofthe graduation rate measure, see Lombardi andCapaldi, “Students, Universities, and GraduationRates: Sometimes Simple Things Don’t Work” (Ideasin Action, Florida TaxWatch, IV:3, March 1997).
Quality Engines: The Competitive Context forAmerican Research Universities (Gainesville: TheCenter,2001) [http://thecenter.ufl.edu/QualityEngines.pdf ]offers a detailed description of the guild structure ofAmerican research universities and discusses thecomposition, size, and scale of research universities.This report also reviews the relationship betweenenrollment size and institutional research perfor-mance, describes the impact of medical schools onresearch university performance, and displays thechange in federal research expenditures over a 10-yearperiod using constant dollars. The current report(2004) looks at the past five years and provides dataon eight of the nine indicators.
University Organization, Governance, and Competi-tiveness (Gainesville: TheCenter, 2002) [http://thecenter.ufl.edu/UniversityOrganization.pdf ]explores the organizational structure of public univer-sities, discusses university finance, and explores atechnique for estimating the revenue available forinvestment in quality by using an adjusted endow-ment equivalent measure. We also review here theimpact of enrollment size on disposable incomeavailable for investment in research productivity.Given the importance of revenue in driving researchuniversity competition, we also explore the impact ofrevenue including endowment income and annualgiving in this report. Our exploration of publicsystems and their impact on research performanceindicates that organizational superstructures do nothave much impact on research performance, which aswe identified in the report on Quality Engines dependson the success of work performed on individualcampuses. Investment levels prove much moreimportant. The notes to that report include anextensive set of references on university organizationand finance. A further use of the endowment equiva-lent concept, as well as a reflection on the use ofsports to differentiate standardized higher educationproducts, appears in our 2003 report on The SportsImperative mentioned below. See also Denise S.Gater, The Competition for Top Undergraduates byAmerica’s Colleges and Universities (Gainesville:TheCenter Reports, May 2001) [http://thecenter.
Page 32
ufl.edu/gaterUG1.pdf ], which provides a survey ofthe methods used in competition for undergradu-ate students along with a useful bibliography.
The Sports Imperative in America’s Research Universi-ties (Gainesville: TheCenter, 2003) [http://thecenter.ufl.edu/TheSportsImperative.pdf ] providesan extensive discussion of the dynamics of intercolle-giate sports in American universities, and focuses onthe impact of Division I-A college sports, particularlyfootball and the BCS, on highly competitive Ameri-can research institutions. The report also adapts theendowment equivalent technique described above tomeasure the impact of major sports programs on auniversity’s available revenue.
On the Value of a College Education
The literature on assessing the value of a collegeeducation is extensive. Lombardi maintains a course-related list of materials related to university manage-ment at An Eclectic Bibliography on Universities [http://courses.umass.edu/lombardi/edu04/edu04bib.pdf ]that captures much of this material, although theURL may migrate each year to account for updates.Some of the items of particular interest here are StacyBerg Dale and Alan B. Krueger, “Estimating thePayoff to Attending a More Selective College: AnApplication of Selection on Observables andUnobservables,” NBER Working Paper No. W7322(August 1999) [http://papers.nber.org/papers/w7322];James Monk, “The Returns to Individual and CollegeCharacteristics: Evidence from the National Longitu-dinal Survey of Youth,” Economics of Education Review19 (2000); 279-289; the National Center for Educa-tional Statistics paper on College Quality and theEarnings of Recent College Graduates (Washington,DC: National Center for Educational Statistics, 2000)[http://nces.ed.gov/pubs2000/2000043.pdf ], whichaddresses the question of the economic value of eliteeducational experience; Eric Eide, Dominic J. Brewer,and Ronald G. Ehrenberg, who examine the impactof elite undergraduate education on graduate schoolattendance in “Does It Pay to Attend an Elite PrivateCollege? Evidence on the Effects of UndergraduateCollege Quality on Graduate School Attendance,”Economics of Education Review 17 (1998); 371-376.Jennifer Cheeseman Day and Eric C. Newburger lookat the larger picture of the general return on educa-tional attainment across the entire population in “TheBig Payoff: Educational Attainment and SyntheticEstimates of Work – Life Earnings,” Current Popula-tion Reports (Washington: U.S. Census Bureau, 2002)
[http://www.census.gov/prod/2002pubs/p23-210.pdf ]. George D. Kuh’s longstanding work on thequality of the undergraduate experience is reflected in“How Are We Doing? Tracking the Quality of theUndergraduate Experience, 1960s to the Present,” TheReview of Higher Education, 22 (1999); 99-120.
On Institutional Improvement andAccountability
The scholarly and public commentary on improve-ment and accountability systems is also extensive.The course bibliography mentioned in the noteabove offers a good selection of this material. Asan indication of the large-scale concerns this topicprovokes, see, for example, Roger Kaufmann,Toward Determining Societal Value Added Criteria forResearch and Comprehensive Universities (Gainesville:TheCenter, 2001) [http://thecenter.ufl.edu/kaufman1.html] and Alexander W. Astin, Assessmentfor Excellence: The Philosophy and Practice of Assessmentand Evaluation in Higher Education (New York: ACE-Macmillan, 1991).
This topic is of considerable international interestas is visible in these examples. From the U.S. Com-mittee on Science, Engineering, and Public Policy, seeExperiments in International Benchmarking of U.S.Research Fields (Washington, DC: National Academyof Sciences, 2000) [http://www.nap.edu/books/0309068983/html/]. Urban Dahllof et al. give us theDimensions of Evaluation: Report of the IMHE StudyGroup on Evaluation in Higher Education (London:Jessica Kingsley, 1991) that is part of an OEDC,Programme for Institutional Management in HigherEducation.
The Education Commission of the States demon-strates the public insistence on some from of account-ability in Refashioning Accountability: Toward A“Coordinated” System of Quality Assurance for HigherEducation (Denver: Education Commission of theStates, 1997), and Lombardi and Capaldi include ageneral discussion of performance improvement andaccountability in “Accountability and Quality Evalua-tion in Higher Education,” A Struggle to Survive:Funding Higher Education in the Next Century, DavidA. Honeyman et al., eds., (Thousand Oaks, Calif.:Corwin Press, 1996, pp. 86-106) and a case study of aquality improvement program in their A Decade ofPerformance at the University of Florida, 1900-1999(Gainesville: University of Florida Foundation, 1999[http://jvlone.com/10yrPerformance.html].
Future Challenges

The Top American Research Universities Page 33
On the issues associated with using faculty dataand other inappropriate techniques for comparinguniversity performance, see Gater, Using NationalData in University Rankings and Comparisons(TheCenter 2003) [http://thecenter.ufl.edu/gaternatldata.pdf ], and her A Review of Measures Usedin U.S. News & World Report’s “America’s Best Colleges”(TheCenter 2002) [http://thecenter.ufl.edu/Gater0702.pdf ], and Gater and Lombardi, The Use ofIPEDS/AAUP Faculty Data in Institutional PeerComparisons (TheCenter 2001) [http://thecenter.ufl.edu/gaterFaculty1.pdf ].
For some additional examples of the discussion onuniversity improvement, see Lombardi, “Competingfor Quality: The Public Flagship Research University,”(Reilly Center Public Policy Fellow, February 26-28,2003, Louisiana State University [http://jvlone.com/Reilly_Lombardi_2003.pdf ] and his “UniversityImprovement: The Permanent Challenge,” (Preparedat the Request of President John Palms, University ofSouth Carolina, TheCenter 2000) [http://jvlone.com/socarolina3.htm] February 2000. For a discussion of a
particular effort to measure university performancethat emphasizes the comparison of colleges betweenuniversities rather than colleges within universities, seeLombardi and Capaldi, The Bank, an issue in theseries on Measuring University Performance [http://www.ir.ufl.edu/mups/issue_0997.htm].
Also of interest on the topic of improvement andaccountability are Lombardi, “How ClassificationsCan Help Colleges,” Chronicle of Higher Education (9/8/2000) [http://jvlone.com/chron090800.html];“Statewide Governance: The Myth of the SeamlessSystem,” Peer Review (American Association ofColleges and Universities, 2001) [http://jvlone.com/lombardiAACU2001.pdf ]; Generadores de Calidad:Los Principios Estratégicos de las UniversidadesCompetitivas en el Siglo XXI (presented at theSimposio Evaluación y Reforma de la EducaciónSuperior en Venezuela, Universidad Central deVenezuela, 2001) [http://jvlone.com/UCV_ESP_1.html English version at http://jvlone.com/UCV_ENG_1.html].