Comparison among High Dimensional Covariance Matrix Estimation ...
Covariance Matrix of the Matter Power Spectrum
Ryuichi Takahashi (Nagoya U.)
with N. Yoshida, M. Takada, T. Matsubara, N. Sugiyama,
I. Kayo, A.J. Nishizawa, T. Nishimichi, S. Saito, A. Taruya
ref: RT et al. 2009, arXiv:0902.0371
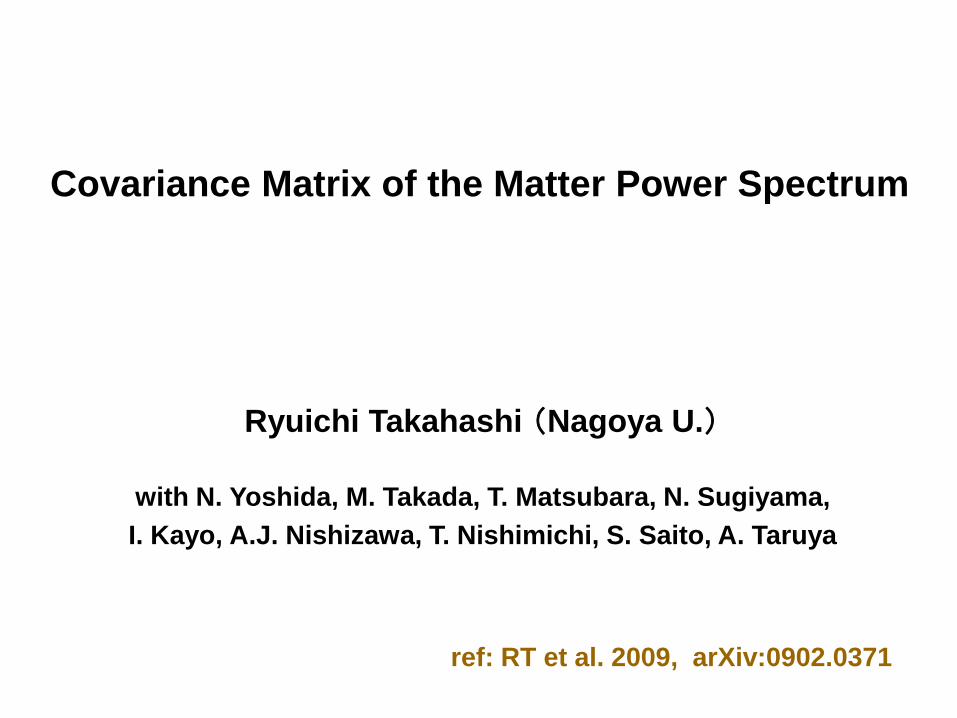
Dark energy
Negative pressure(P<0)
Accelerates the expansion rate
of the Universe
Its nature still elude us
Recent Cosmological observations
(CMB, large scale structure, SNIa)
reveal that ~70% of the cosmic
energy density is dark energy.
Big problem not only for cosmology but also physics
Maybe it is related to vacuum energy?
cosmic energy density
Its nature is revealed by astronomical observations

SDSS data
Measuring large scale galaxy distribution provides
a strong constraint on the nature of dark energy
peak at 100Mpc/h can be used as “standard ruler”
gala
xy c
orr
ela
tio
n f
un
cti
on
distance(Mpc/h)
100Mpc/h
(Eisenstein et al. 2005)

100Mpc/h
distance D
θ angle
measuring galaxy distribution
Mpc/h100D
Standard ruler

100Mpc/h
distance D
θ angle
dark energy density
measuring galaxy distribution
Standard ruler
Mpc/h100D
distance D
angle θ

100Mpc/h
θ
distance D
angle
dark energy density
measuring galaxy distribution
Standard ruler
Mpc/h100D
distance D
angle θ

100Mpc/h
θ
measuring galaxy distribution
Mpc/h100D
Directly measure the distance to the galaxies
Standard ruler
distance D
angle

Equation of state w (=pressure/density)
1
Pw
Dark Energy
similar to the cosmological constant (w=-1)
D
D
w
w
4
relation to the distance measurement accuracy
1at z

(WFMOS feasibility study report)
WFMOS
dis
tan
ce m
easu
rem
en
t accu
racy (
%)

Future & On going plans
WFMOS(Subaru & Gemini telescope, photometric)
Lyman-break galaxies at z~3
Emission line galaxies at z~1
FMOS(Subaru telescope, Near Infrared, Photometric)
HSC(Subaru telescope, Narrow band filter) 2011+
Lyα emitter at z=3 ~2% error Matsuda+
LRG(luminous red galaxies) at z=0.3-0.6
Hα emitter at z=1 Totani, Sumiyoshi+
Eisenstein+
SDSSⅢ(BOSS) 2009+
~1% error
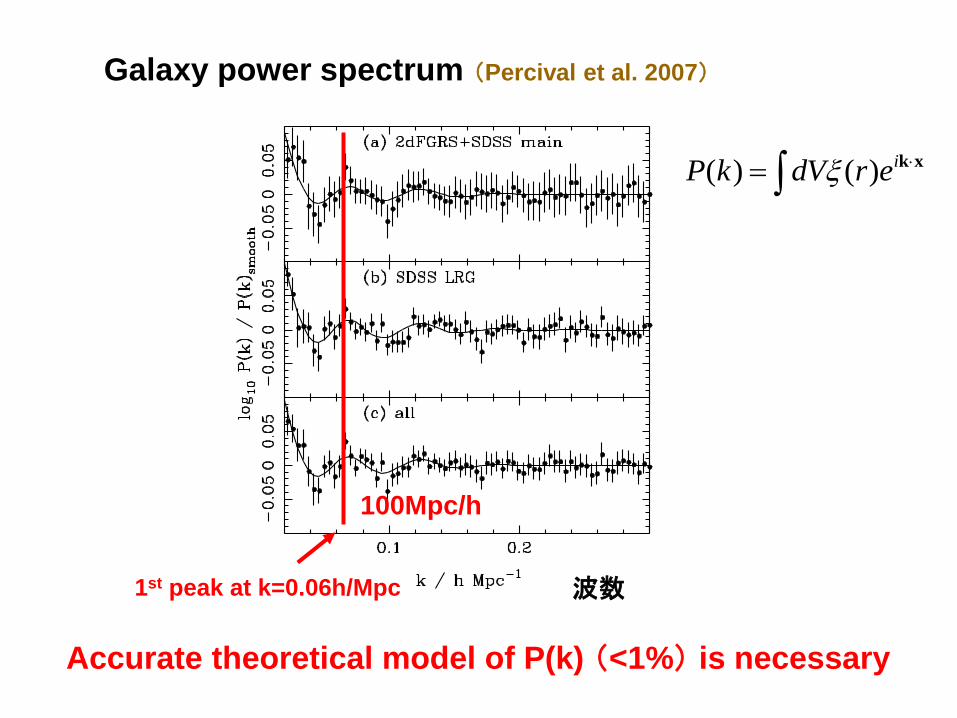
xkierdVkP )()(
Galaxy power spectrum (Percival et al. 2007)
波数
100Mpc/h
Accurate theoretical model of P(k) (<1%) is necessary
1st peak at k=0.06h/Mpc
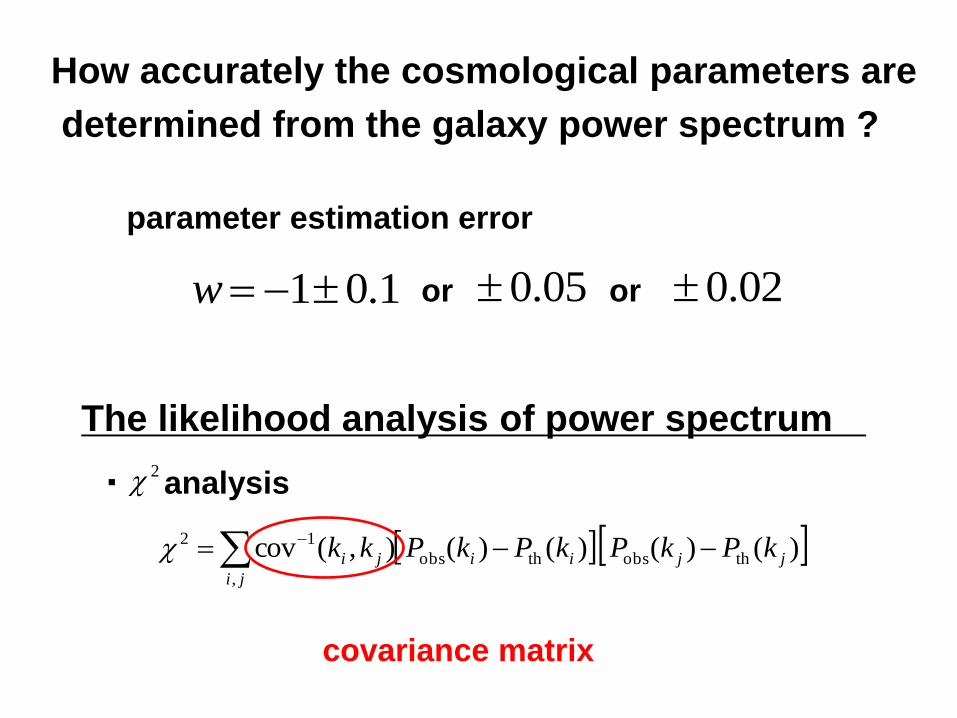
How accurately the cosmological parameters are
determined from the galaxy power spectrum ?
parameter estimation error
1.01w 05.0or
The likelihood analysis of power spectrum
・ analysis
)()()()(),(cov thobsthobs
,
12
jjii
ji
ji kPkPkPkPkk
2
02.0or
covariance matrix

three sources of statistical error
Volume of survey area (= number of Fourier modes)
Shot noise
Non-Gaussian error
error ∝ (volume)^-1/2
Correlation between different Fourier modes k via
non-linear gravitational evolution
Each mode k is not independent

Covariance matrix of P(k) between k1 and k2
)(ˆ)(ˆ)(ˆ)(ˆ),cov( 221121 kPkPkPkPkk
),(11
)(2
21,
2
21kkT
VnkP
Nkk
gk
)()()()(),( 22112
3
1
3
21
21
kkkkV
kd
V
kdkkT
kk
Nk : number of mode
T : trispectrum
(e.g. Scoccimarro, Zaldarriaga & Hui 1999)
kV1 non-Gaussian contribution arising
from mode-coupling shot noise
Gaussian term
volume
Non-Gaussian error
: power spectrum estimator in each realization
: mean power spectrum
)(ˆ kP
)(kP

5000 realizations
V=(1Gpc/h)^3 256^3 particles & mesh
PM(Particle-Mesh) simulations
)(ˆ1
)( kPN
kPi
i
r
i
ii
r
kPkPkPkPN
kk )()(ˆ)()(ˆ1
1),cov( 221121
Mean
Covariance
Largest realizations for BAO
Our data are publically available

64-bit PC cluster
Intel Xeon 3GHz
12 nodes×4 cpus
= 48 processes
Memory total 16GB×12
HDD ~20TB
At lab., Nagoya U.
12 nodes
code : Gadget2

)(ˆ kP
6 realizations
colored curves :
for each realization
thick black curve : mean P(k)
V=(1Gpc/h)^3

Variance of P(k)
solid curve:
perturbation theory
dashed curve:
halo model
Comparison with Analytical Models
symbols :
simulation outputs
(Scoccimarro et al. 1999)
(Cooray & Hu 2001)

correlation matrix

How many realizations we need ?
(Kayo et al. in preparation)
vertical axis:variance of covariance
solid line : theoretical prediction for Gaussian density fluctuation

How many realizations we need ?
200 realizations for 10% accuracy
800 realizations for 5% accuracy
rN
2
cov
covcov
2
2
2
cov
variance of variance
necessary number of galaxy mock catalogue
Nr : number of realizations
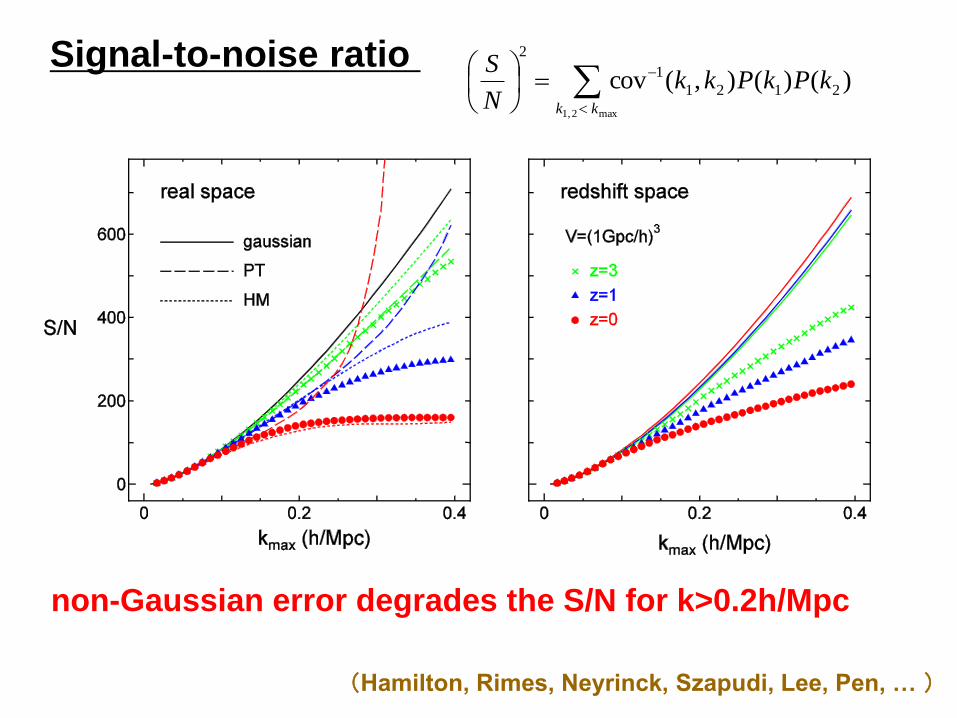
)()(),(cov 2121
1
2
max2,1
kPkPkkN
S
kk
Signal-to-noise ratio
non-Gaussian error degrades the S/N for k>0.2h/Mpc
(Hamilton, Rimes, Neyrinck, Szapudi, Lee, Pen, … )

)()(),(cov 2121
1
2
max2,1
kPkPkkN
S
kk
Signal-to-noise ratio
non-Gaussian error degrades the S/N for k>0.2h/Mpc
(Hamilton, Rimes, Neyrinck, Szapudi, Lee, Pen, … )
× factor 4
× factor 3

jikk
jixd
kdP
xd
kdPkkF
ln
)(
ln
)(),(cov 21
21
1
max2,1
2/11
ji
i
i Fx
x
),,,,,( 22
8 whhhnx cbSi
Parameter estimation
Fisher matrix
Gaussian error
assumption is OK
six cosmological parameters
solid curves : Gaussian error
symbols : with Non-Gaussian error
ratio = NG/G
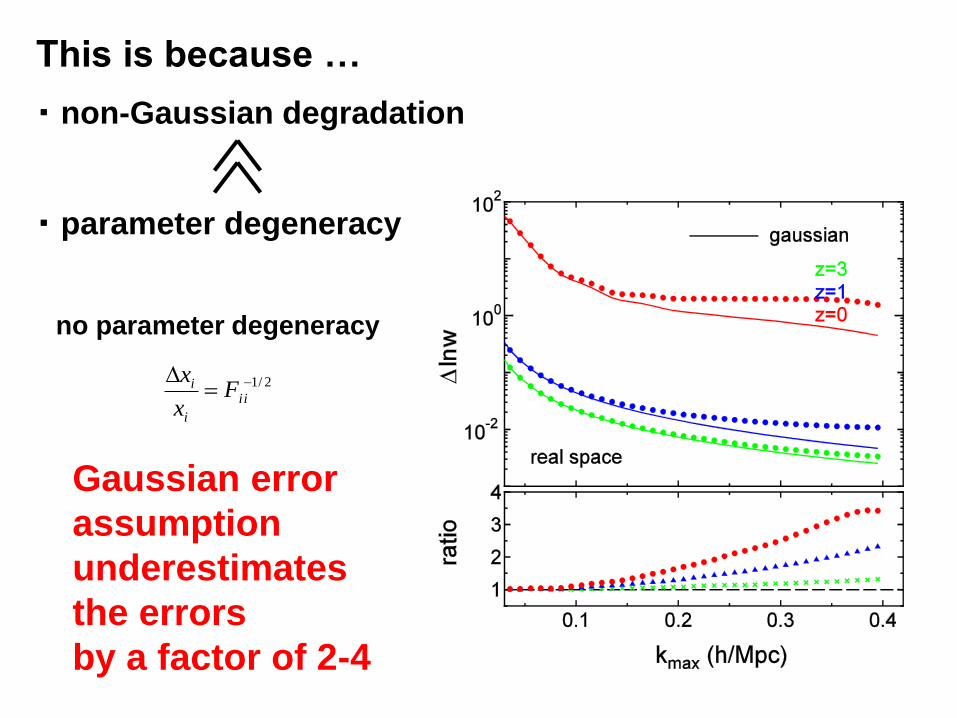
・ parameter degeneracy
・ non-Gaussian degradation
This is because …
2/1
ii
i
i Fx
x
no parameter degeneracy
Gaussian error
assumption
underestimates
the errors
by a factor of 2-4
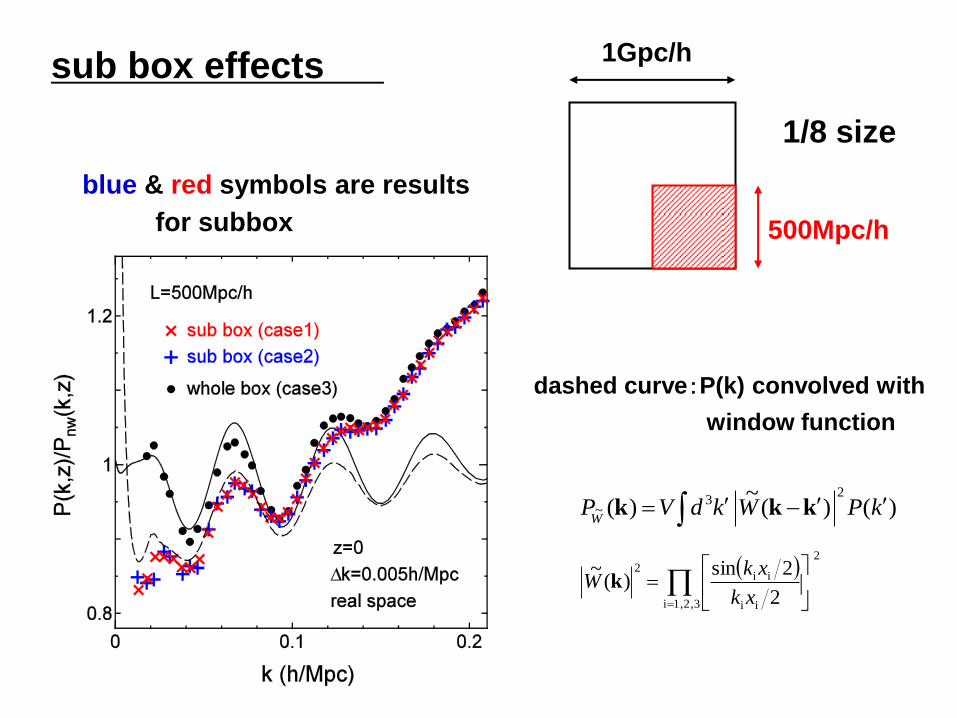
sub box effects
)()(~
)(2
3~ kPWkdVP
W kkk
1,2,3i
2
ii
ii2
2
2sin)(
~
xk
xkW k
1Gpc/h
500Mpc/h
1/8 size
blue & red symbols are results
for subbox
dashed curve:P(k) convolved with
window function

Beat-coupling (Takada & Kayo in preparation)
mode-coupling larger than subbox volume
)()()(21
1716
121111111
2
kPkPPV
),cov( 11 kk
L
L : size of subbox
S/N is further degraded by 30%

work in progress
L=1Gpc/h N=1024^3 TPM simulation
~ hundreds realizations
(M ~ 7×10^10 M_SUN/h)
Making halo catalogue
HSC Lyα emitter at z=3 (Matsuda +)
BOSS LRG(luminous red galaxies) at z=0.3-0.6
WFMOS Lyman-break galaxies at z~3
Emission line galaxies at z~1
FMOS Hα emitter at z=1 (Totani、Sumiyoshi+)
(Eisenstein +) (SDSSⅢ)

Summary
non-Gaussianity in the covariance matrix affects the S/N
and the parameter estimation for k>0.2h/Mpc
variance of angular averaged P(k) (monopole component)
in redshift space is larger than in real space by 16% (z=1),
20% (z=3) due to the redshift space distortion
probability distribution of is almost Gaussian even
in non-linear regime
variance of covariance decreases as where Nr
is the number of realizations
)(ˆ kP
2/1/2
rN

3rd order density perturbation
),(),()()(),( 321 akakkaDak
)()(),()( 112
3
2 kqqkqqFqdk
)()()(),,()( 1113
33
3 kpqpqkpqpqFpdqdk
*
31
2
2
2
1
2Re2
leading correction to the linear power spectrum
linear power spectrum leading correction term
(one-loop correction)
(Makino, Suto & Sasaki 1992; Jain & Bertschinger 1994)
)(lin kP
)()( 1322 kPkP

EdS 以外の宇宙モデル
近似:EdS モデルでの結果(上式)でスケールファクター a を
線形成長率 D(a) に変更
5.0
ln
lnM
ad
Ddf なら厳密に近似はOK
(e.g. Bernardeau, et al. 2002, Physics Reports)
)()()(),( 1322
4
lin
2 kPkPakPaakP
実際は 6.0
ln
lnM
ad
Ddf

ダークエネルギー入り宇宙で3次摂動まで計算
),(),(),(),(),( 3
qkqqkqqdk
k
),(),(),(),(2
3),(
),( 32
qkqqkqqdkHkH
kM
2
)(),(
pqp
pqp
22
2
2
)()(),(
qpqp
qpqp
V
Bernardeau 1994; Matsubara 1995 for lambda CDM model
基礎方程式 (連続の式&オイラー方程式) δ:密度場、 v:速度場
aawwaw a 1)( 0

relative errors
P22 P13
EdS model との相対誤差は <2% at z=0

ixd
kPd
ln
)(ln
derivative of P(k) 8
Sn
h
b
w
w
fiducial parameter %5

jikk
jixd
kdP
xd
kdPkkF
ln
)(
ln
)(),(cov 21
21
1
max2,1
2/11
ji
i
i Fx
x
),,,,,( 8 whnx wbSi
Parameter estimation
Fisher matrix
Gaussian error
assumption is OK
six cosmological parameters
8
Sn
h
b
w
w
solid lines : Gaussian error symbols : with Non-Gaussian error

・ parameter degeneracy
・ non-Gaussian contribution
This is because …
2/1
ii
i
i Fx
x
no parameter degeneracy
Gaussian error
assumption
underestimates
the errors
by a factor of 2-4
8
Sn
h
b
w
w

Covariance matrix の分散
error = 1/(number of realizations)^1/2
全非対角成分@初期条件(z=20)

100 400 4000
Number of realizations
diagonal off-diagonal

Non-Gaussian error in Weak lensing
(Cooray & Hu 2001; Takada & Jain 2008; Eifler, Schneider & Hartlap 2008)
Gaussian error の仮定は10-20%くらい誤差を過小評価
コバリアンスは誤差だけでなくベストフィット値にも影響(?)
Model A :
高田さんハローモデル
Model B :
simulation results in
Semboloni et al 2007
(Ichiki, Takada, Takahashi 2008)
CHFTLS WL data

64-bit PC cluster DE
Intel Xeon 3 GHz
10 nodes×4 cpus
HDD 150GB×10 + 480GB×4
+ 1TB×12
Memory total 16GB×10
At lab., Nagoya U.
code : Gadget2

),(2
),( ||
22
|| kkPN
kkP s
k
s
)(2
5
1
3
21
9
1
7
4
5
6
3
41
)(2
2
2
432
2kP
NkP s
k
s
2
2222
5
1
3
211
d
4324
2
9
1
7
4
5
6
3
411 d
)(1)(22 kPdkP rs
variance in redshift space
additional coefficient due to the redshift space distortion
LHS :
RHS :
in linear regime
angular
averaging
k
||k : line of sight direction
: perpendicular direction

Finger of god effect erases the variance
・in linear regime, simulation results reproduce the redshift
space distortion (red solid lines)
variance in real space & in redshift space
・in non-linear regime, the variances in redshift space do not
increase comparing to in real space
(Meksin & White 1999)
16% 20%

forecast for WFMOS survey
%1.3%80.0 wWFMOS1 z=0.5-1.3 V=4(Gpc/h)^3 b=1.3
WFMOS3 z=2.3-3.3 V=1(Gpc/h)^3 b=3 %0.6%1.1 w
stretch parameter α Measurement accuracy for
acoustic peak positions kk α=1 : fiducial
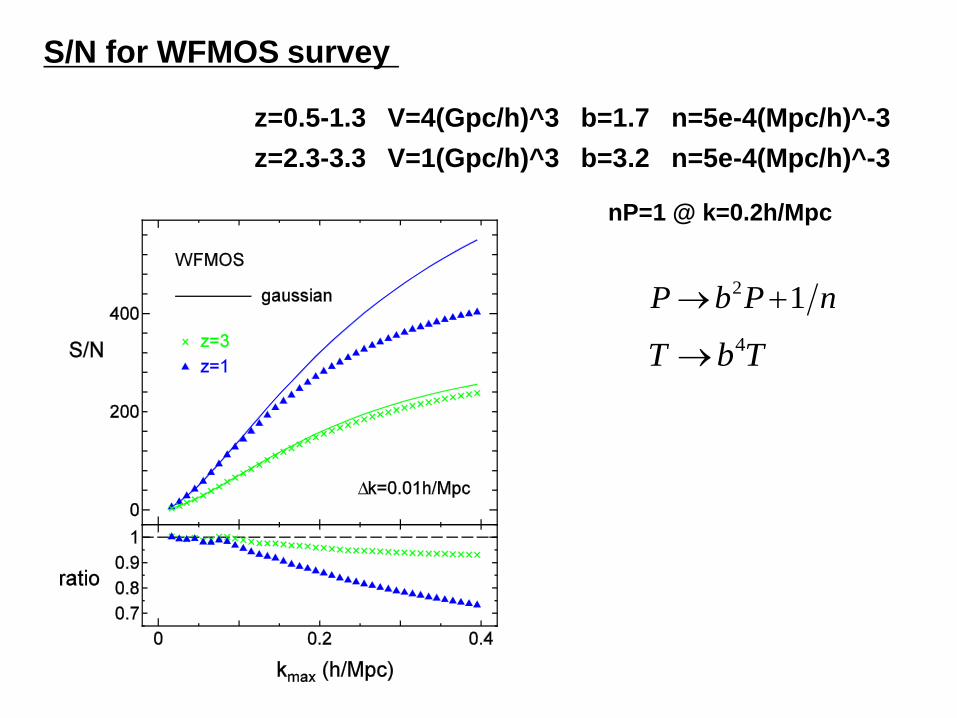
nPbP 12
TbT 4
z=0.5-1.3 V=4(Gpc/h)^3 b=1.7 n=5e-4(Mpc/h)^-3
z=2.3-3.3 V=1(Gpc/h)^3 b=3.2 n=5e-4(Mpc/h)^-3
S/N for WFMOS survey
nP=1 @ k=0.2h/Mpc

(Gaztanaga, Cabre & Hui 2008)
SDSS 75000 LRG @ z=0.15-0.47
lin
e o
f sig
ht (M
pc/h)
perpendicular (Mpc/h)
Galaxy correlation function in two dimension

distance D
θ angle
distance D(z) & Hubble rate H(z) are determined
)(/ zHz D
Galaxy correlation function in two dimension

Baryon Acoustic Oscillations
at z=1100
photon fluctuation baryon (proton & electron)
density fluctuation
CMB temperature
fluctuation
dark matter density fluctuation
Thomson scattering
gravitational interaction

Baryon Acoustic Oscillations
at z=1100
photon fluctuation baryon (proton & electron)
density fluctuation
CMB temperature
fluctuation
dark matter density fluctuation
Thomson scattering
gravitational interaction
Galaxy distribution
sound horizon at recombination 100Mpc/h

),cov(),cov(
),cov(),(
2211
2121
kkkk
kkkkr
off-diagonal elements
: correlation matrix
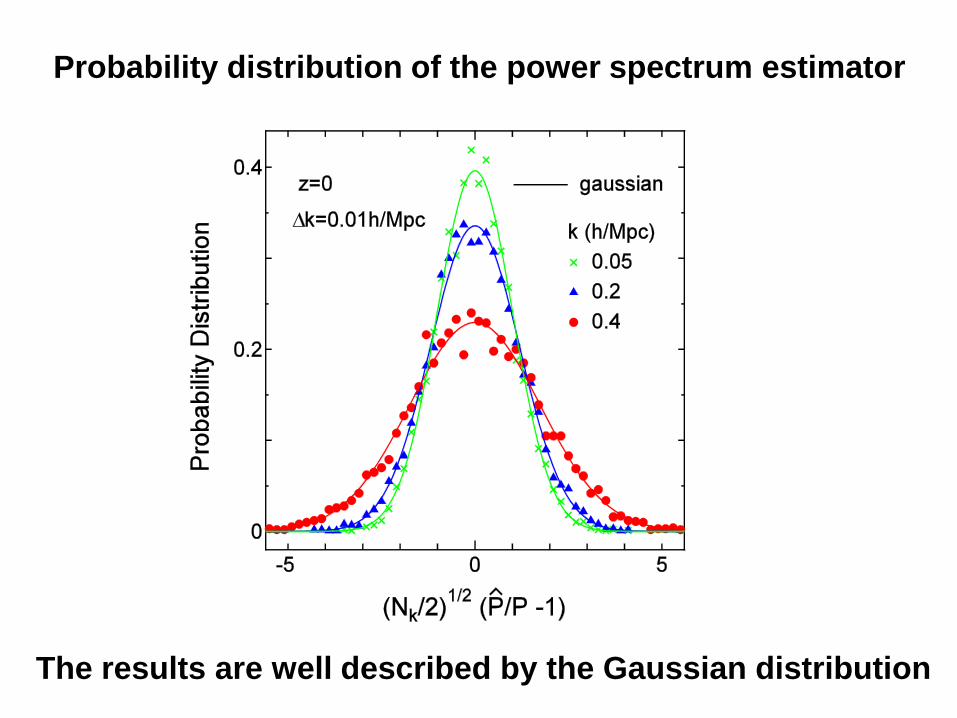
Probability distribution of the power spectrum estimator
The results are well described by the Gaussian distribution
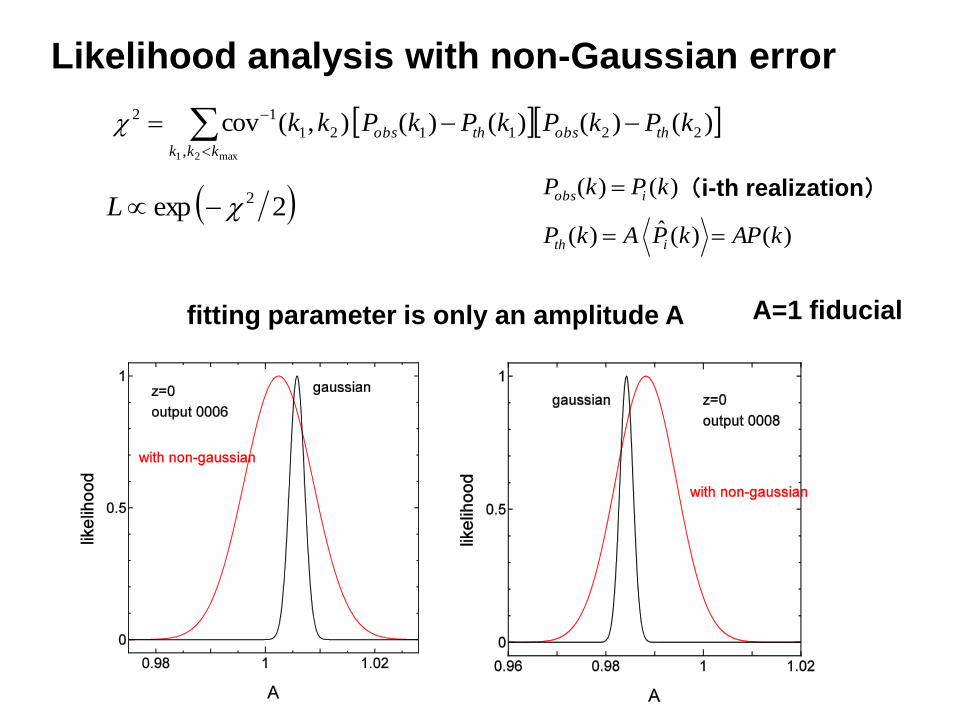
Likelihood analysis with non-Gaussian error
)()()()(),(cov 2211
,
21
12
max21
kPkPkPkPkk thobsthobs
kkk
2exp 2L)()(ˆ)( kAPkPAkP ith
A=1 fiducial
)()( kPkP iobs
fitting parameter is only an amplitude A
(i-th realization)