Couple’s Compatibility Midpoint Presentation
14
Couple’s Compatibility Midpoint Presentation Noaa Avital Katy Harrison Sharena Paripatyadar
-
Upload
shannon-adkins -
Category
Documents
-
view
34 -
download
0
description
Couple’s Compatibility Midpoint Presentation. Noaa Avital Katy Harrison Sharena Paripatyadar. The Problem. Online matching services have many matches for every person No simple way of seeing your compatibility with a match Difficult to compare matches Each site offers different dimensions - PowerPoint PPT Presentation
Transcript of Couple’s Compatibility Midpoint Presentation
Couple’s Compatibility Midpoint Presentation
Noaa Avital
Katy Harrison
Sharena Paripatyadar
The Problem
• Online matching services have many matches for every person
• No simple way of seeing your compatibility with a match
• Difficult to compare matches
• Each site offers different dimensions
• Pages upon pages of reading material
Our Project
• Building a system that creates a visualization for the compatibility of two people based on compatibility dimensions
• Visualization modified based on the best fit to the criteria used for compatibility matching
• Easy to compare multiple matches

The Process
• Created 3 Categories:– 1-4 Dimensions– 5-8 Dimensions– 9-20 Dimensions
• Brainstormed/prototyped 12 ideas for visualization of matches
• Narrowed down to top 6 for user testing

Top Visualizations
• 1-4 Dimensions
Bar Graph
Sliders with Whiskers
Sliders without Whiskers
Very Compat. Very Incompat.
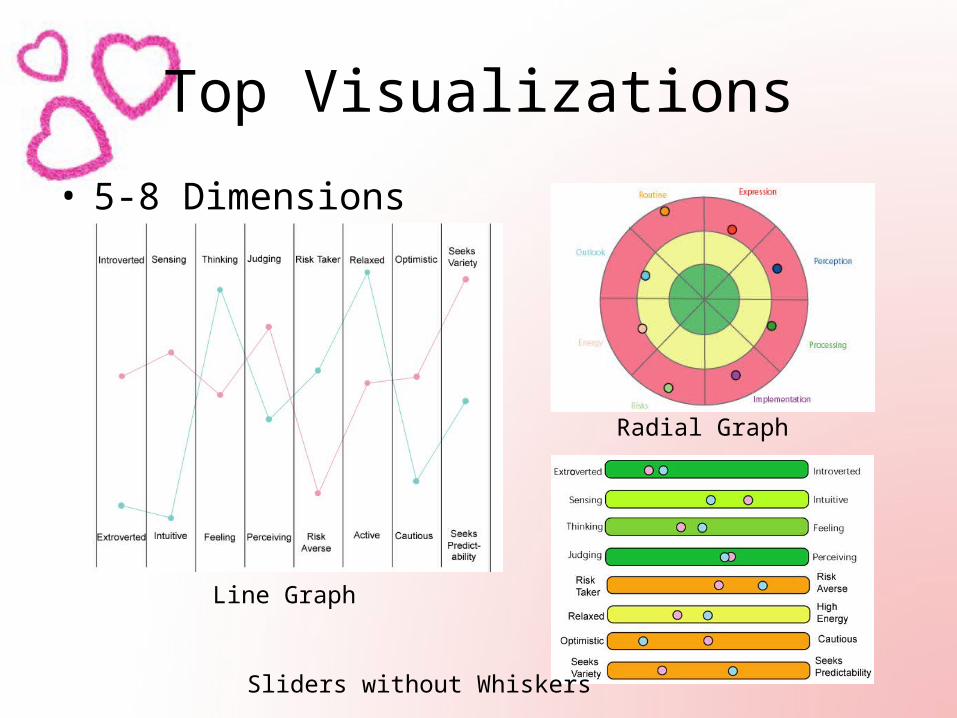
Top Visualizations
• 5-8 Dimensions
Line Graph
Sliders without Whiskers
Radial Graph
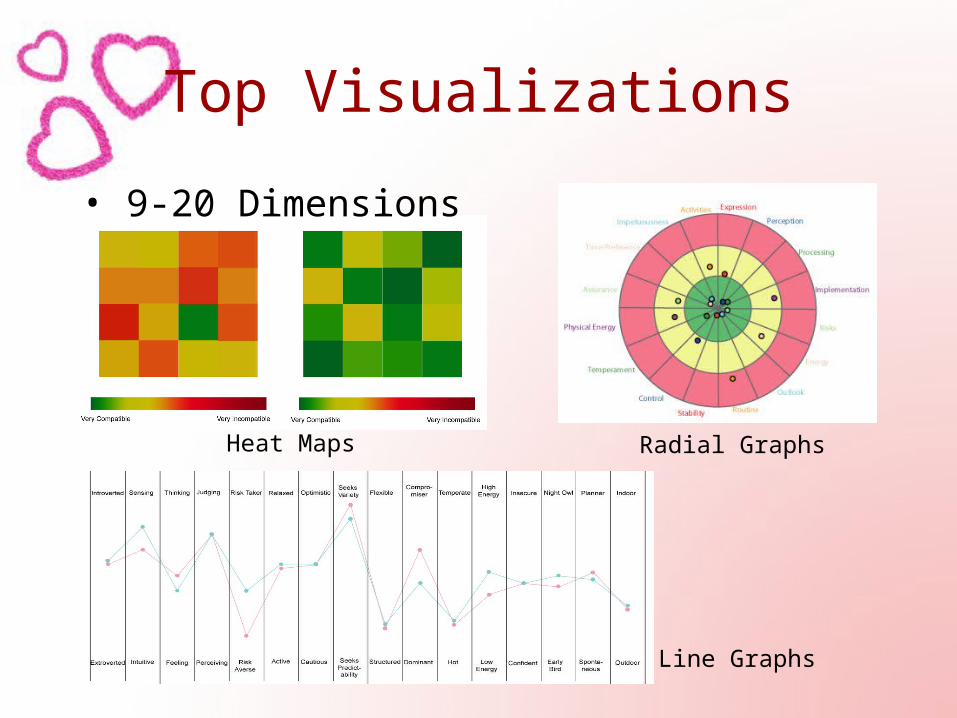
Top Visualizations
Heat Maps
• 9-20 Dimensions
Line Graphs
Radial Graphs
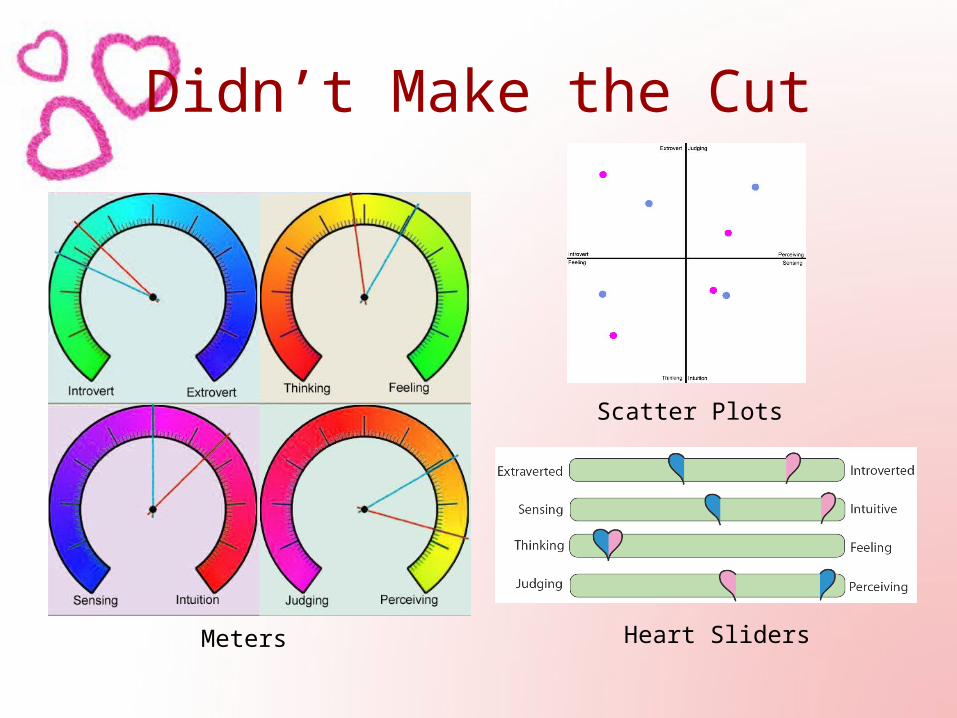
Didn’t Make the Cut
Meters
Scatter Plots
Heart Sliders
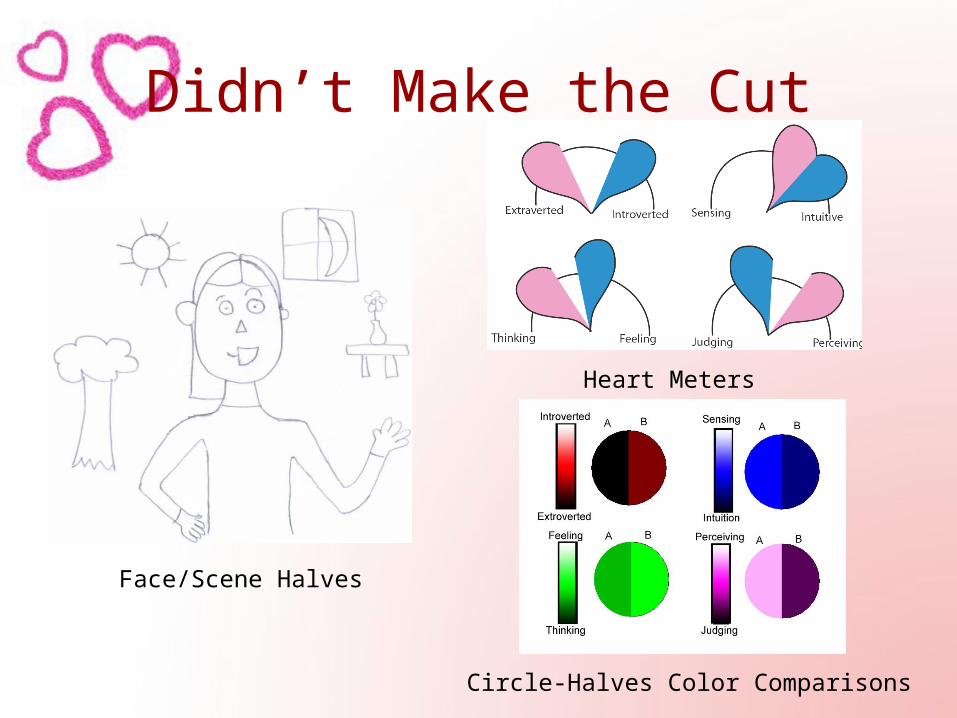
Didn’t Make the Cut
Circle-Halves Color Comparisons
Heart Meters
Face/Scene Halves
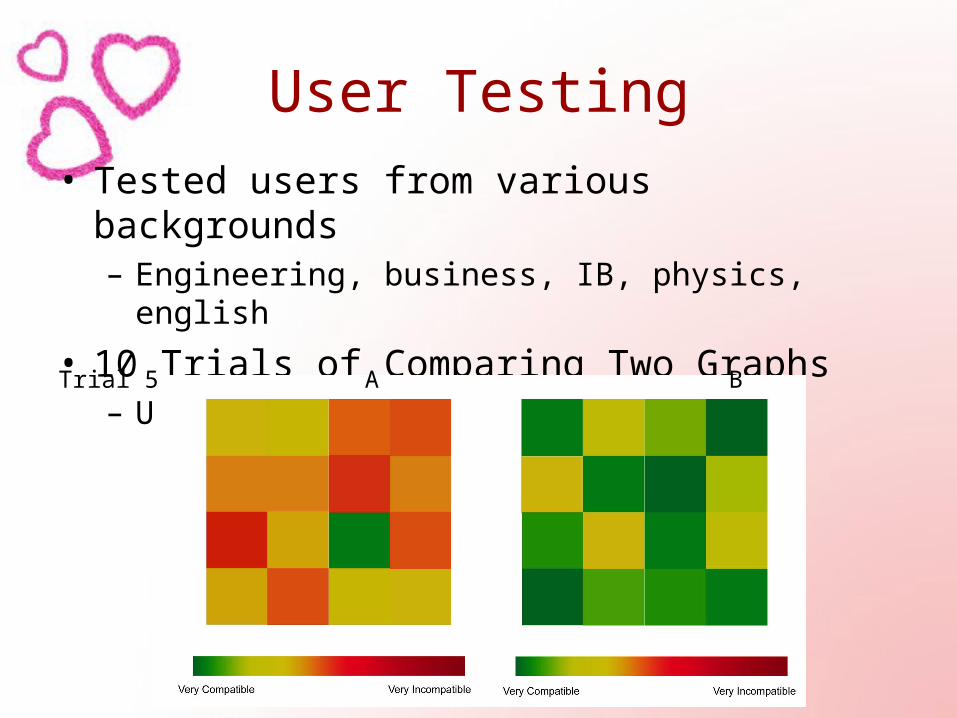
User Testing• Tested users from various backgrounds
– Engineering, business, IB, physics, english
• 10 Trials of Comparing Two Graphs– User chooses better match
Trial 5 A B
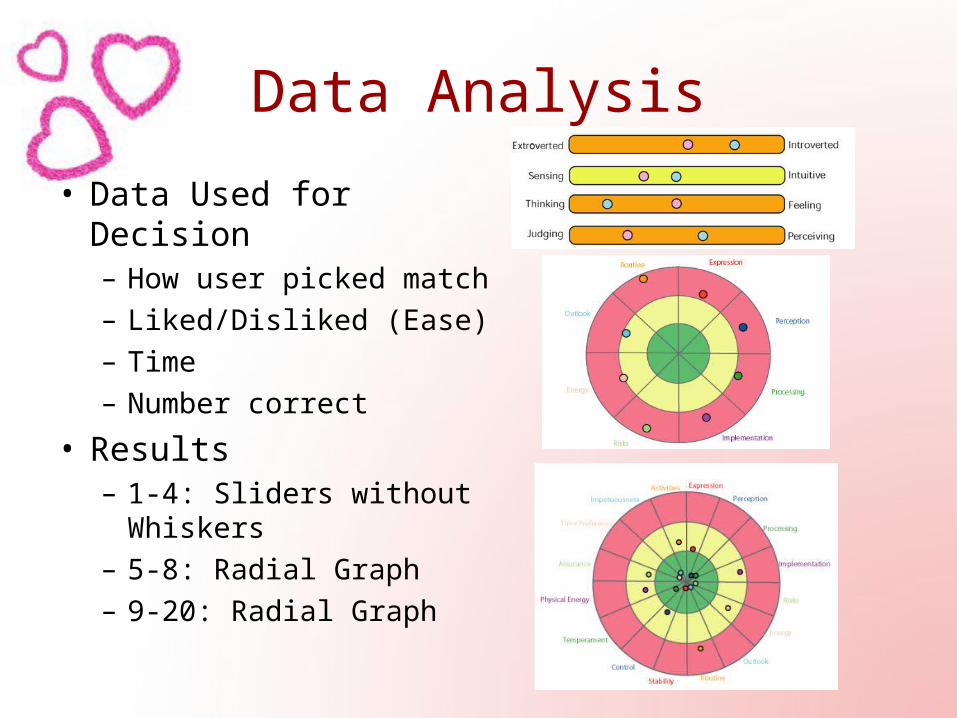
Data Analysis
• Data Used for Decision– How user picked match– Liked/Disliked (Ease)– Time– Number correct
• Results– 1-4: Sliders without
Whiskers– 5-8: Radial Graph– 9-20: Radial Graph

Implementation
• Web Interface Inputs– Number of dimensions– Dimension name and values– Range of results (Good/Med/Bad)– Enter Person A’s results– Enter Person B’s results
• Appropriate Image Generated
• Uses Processing Java Applet/HTML

The Code So Far
• Only number of dimensions and generated image
• Couple's Compatibility Website
The Plan
• Implementation of:– Remaining web interaction– Mapping function for results– 9-20 graphs– Zooming (Radial)
• Possible Features– Handling of 21+ dimensions– Comparison of 2+ people