Country WID Profile€¦ · Country WID Profile (Republic of Uzbekistan ) December 1999 Japan...
29
Country WID Profile (Republic of Uzbekistan) December 1999 Japan International Cooperation Agency Planning Department
Transcript of Country WID Profile€¦ · Country WID Profile (Republic of Uzbekistan ) December 1999 Japan...
Country WID Profile
(Republic of Uzbekistan)
December 1999
Japan International Cooperation AgencyPlanning Department
Country WID Profile(Uzbekistan)
Table of Contents
Abbreviation Page1. Basic Profile
1-1 Socio-Economic Profile................................................................................................ 11-2 Health Profile................................................................................................................ 21-3 Education Profile .......................................................................................................... 2
2.General Situation of Women and Government Policy on WID/Gender 2-1 General Situation of Women.......................................................................................... 3 2-2 Government Policy in the Fields of WID/Gender.......................................................... 6 2-3 National Machinery........................................................................................................ 7
3. Current Situation of Women by Sector
3-1 Education ....................................................................................................................... 8 3-2 Health ............................................................................................................................. 11 3-3 Agriculture, Forestry, Fisheries...................................................................................... 15 3-4 Economic Activities....................................................................................................... 18
4. WID/Gender Projects by Other Donors.................................................................................. 21
5. WID/Gender Information Sources
5-1 List of International Organizations and NGOs related to WID/Gender......................... 22 5-2 List of Reports and References related to WID/Gender................................................. 23
6. References .............................................................................................................................. 24
7. Definitions .............................................................................................................................. 25
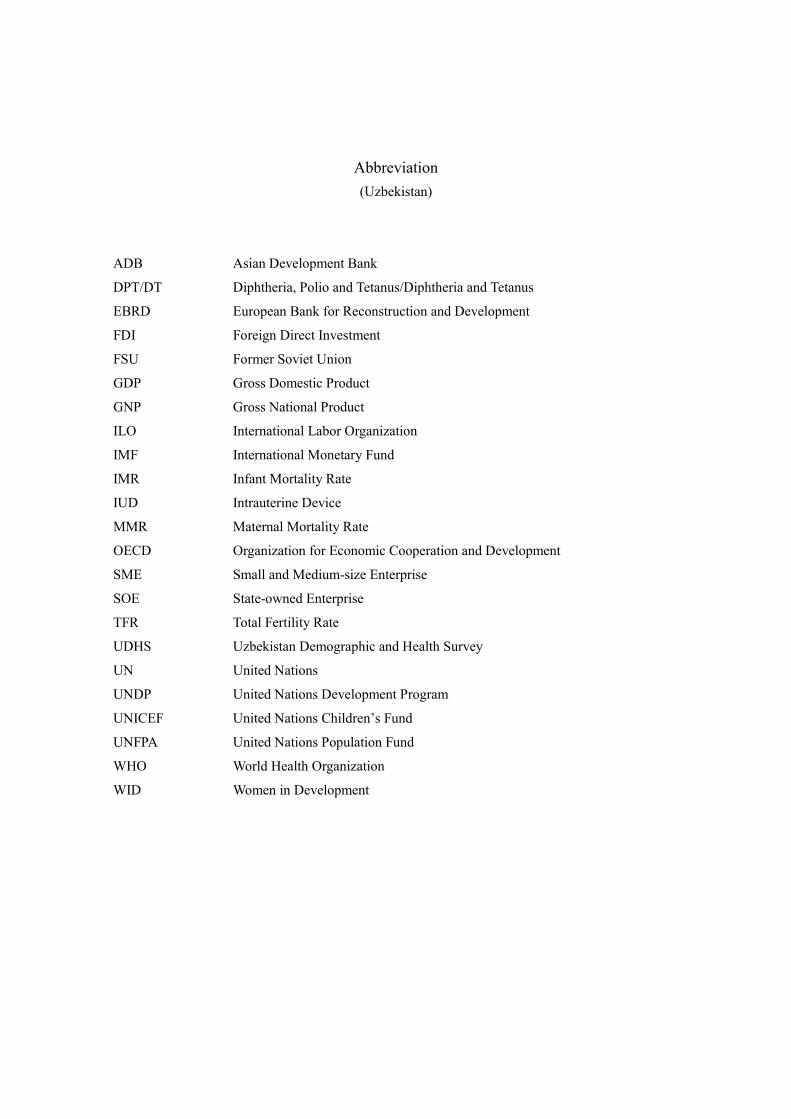
Abbreviation
(Uzbekistan)
ADB Asian Development Bank
DPT/DT Diphtheria, Polio and Tetanus/Diphtheria and Tetanus
EBRD European Bank for Reconstruction and Development
FDI Foreign Direct Investment
FSU Former Soviet Union
GDP Gross Domestic Product
GNP Gross National Product
ILO International Labor Organization
IMF International Monetary Fund
IMR Infant Mortality Rate
IUD Intrauterine Device
MMR Maternal Mortality Rate
OECD Organization for Economic Cooperation and Development
SME Small and Medium-size Enterprise
SOE State-owned Enterprise
TFR Total Fertility Rate
UDHS Uzbekistan Demographic and Health Survey
UN United Nations
UNDP United Nations Development Program
UNICEF United Nations Children’s Fund
UNFPA United Nations Population Fund
WHO World Health Organization
WID Women in Development

1. Basic Profile
1-1 Socio-Economic Profile
Socio-Economic Profile Ref.
Economic Indicators GNP/Capita (98) Growth rate of real GDP (98) Inflation Rate (98) Gini coefficient (96)
US$870 4.4% 17.7% 1,2
Public Sector (98) Health Education Social Welfare Defense Others
Expenditure to sectors 9.6% 7.2% 9.6% 4.2% (97) NA 4
Population (98) Total % of urban population Population growth rate (90-96)Total 23.5 million 38.2% 1,3
Women 50.4% 1
Industry/GDP (98) Agriculture Industry(Manufacture/Industry) Others
26.4% 15.0% 35.3% 2
Proportion of workers Agriculture Industry Service Aid/GNP
Total ('98) 39.4% 12.7% 8.1% NA 1,3
Women 35% 13% 1.8% 5
Labour Indicators Total No. (97) Unemployment R. Minimum wage Women/Total
Total 11,826 thousand 0.5% (98) 750 sum (98) NA 2
Women NA NA
Decision-making Women/Total Women/Total
Member of parliament 19/250 (98) Managers 17.5% (98) 6,7
Ministries 2/25 Technicians 51.0% 9,8
Deputy ministries 0/24 9
Law for Women Year Details
Marriage Law 1998 Family Code 5
Election Law NA
Law against Domestic Violence NA
Employment Equality Law 1995 5
Ratification and signature of international law for women Ratification Year
1995
Policy of WID Year Details
1995 5
1999 5
Governmental organization of WID
National Machinery
5
References
1) Country Brief: Uzbeksitan, http://www.worldbank.org, World Bank, 1999)
2) Country Economic Review: Uzbekistan, Asian Development Bank, August 1999
3) Country Profile: Uzbekistan 1998-99, the Economist Intelligence Unit
4) Uzekistan Social and Structural Policy Review, World Bank, 1999
5) Woman of Uzbekistan 1999
6)
7) Report on the Status of Women in Uzbekistan, UNDP, GID Unit, Center for Economic Research; Tashkent 1999
8)
9) JICA Uzbekistan Office Report
The National Platform for Action on the Improvement of Women's Status in Uzbekistan and on the Advancement of Womenin the Society, Women's Committee of Uzbekistan "Gender and Development" unit, Tashkent, November 2000
"Gender Equality in Uzbekistan: Status and Development Perspectives," conference materials, USAID/WinrockInternational; September 7-8, 2000
0.32
Republican Women's Committee of the Complex for Family, Maternity and Childhood Protection (1991)
2.3%
Labour Code
UN General Assembly on 18th December 1979 "Convention on Liquidationof All Forms of Discrimination Towards Women
The Decree of the President, "On Measures for Strengtheningthe Role of Women in State and Social Development of theRepublic of Uzbekistan"
The State Program "Measures for Strengthening Women'sStatus"
1

1-2 Health Profile
Health Profile Ref.
Life expectancy (96) Total 70.2 Population growth rate 2.3% (90-96) 1,2
Expansion of health serviceDoctor/1000 population
(89-94)3.5 Nurse and Midwife/1000 population 27.03 2,5
Government expenditure to health (% of GDP, 97) 3.3% 1,2Infant mortality rate(per1,000) % of the vaccinated 1-year-old children
Total 32.5 persons (96) BCG (98) 98% 1
Female NA DPT3 (98) 96% 3
Under-5 mortality rate (per1,000) Polio (98) 94% 3
Total 60 persons (98) Measles (98) 92% 3
Family planning Contraceptive rate 56% (98) Total fertility rate (98) 3
Births attendance rate 98% (96) Age at first marriage NA 4
Maternal anemia rate 61% (96) % of infants with low birth weight NA 4
Maternal mortality rate 12 persons per 0.1million (96) 1
Nutrition Oral rehydration therapy use rate 37% 3
Iodine deficiency NA Malnutrition: severe underweight 5% (98) 3
Community health service (98)
Access to safe water urban 99% rural 88% Access to adequate sanitation urban100% rural 99% 3
HIV/AIDS HIV infected (2001.1.1) AIDS cases (2001.1.1) 6
Statistics 2
1-3 Education Profile
Education Profile Ref.
Education system Compulsory education (12 year), Primary education (4 year)
Public expenditure on education % of GDP (97) 7.2% 1
Adult literacy rate (96) Total 99.1 1
by race
Primary education (98) Net enrollment ratio Female ratio of higher education
Male 83% education 24.6% 3,5
Female 83% humanities 39.9% 3,5
<Educational Issues> Rapid population growth social sciences NA
Secondary education (98) Gross enrollment ratio natural sciences engineering 10.4% 5
Male 99% medical 11.4% 3,5
Female 87% 3
<Educational Issues> Obsolete facilities and equipment of practical and technical education
Higher education (96) Enrollment ratio
Total 12% 1
Female/Total 39.4% 1
References
1) Uzekistan Social and Structural Policy Review, World Bank, 1999
2) Country Profile: Uzbekistan 1998-99, the Economist Intelligence Unit
3) Information Statistics: Uzbeksitan, http://www.unicef.org, 1999
4) Demographic and Health Survey 1996, Ministry of Health of the Republic of Uzbekistan, 1996
5) Women of Uzbekistan 1999
6) Information from the Ministry of Health of the Republic of Uzbekistan
3.6%
210
2

3
2. General Conditions of Women and Government Policy on WID/Gender
2-1 General Situation of Woman
General Situation of Woman
- The situation of women in Uzbekistan is of fewer disadvantages in the social, economic,and political stages due to the legacy of the Socialism during the FSU period.
- Like all FSU countries, Uzbekistan has impressive education and health indicators for acountry of its per capita income. Literacy rates are at OECD levels, enrollments arehigh, and gender differentials have not emerged as an issue (Uzbekistan Social andStructural Policy Review, World Bank, August 25, 1999).
In the 60-70s of the 19th century, a part of Central Asia was annexed to zarist Russia. In1924, within the Soviet Union, the Uzbek Soviet Socialist Republic was set up. In 1991following the break-up of the Soviet Union, Uzbekistan declared its independence. Afterindependence in 1991, the Government of Uzbekistan embarked on a process of gradualreforms toward a market economy and democratization.
Uzbekistan is a double-landlocked country located in the center of the Central Asia. In thenorth-east Uzbekistan shares borders with Kyrgystan; in the north and north-west – withKazakhstan, in the south-west – with Turkmenistan and in the south-east – with Tajikistan.In the south, there is a short border with Afghanistan. Since ancient times, the Uzbek landserved as a particular bridge between countries in the fields of commerce and culture.Ancient caravan routes passed through this country.
As of January 1, 1998, the population of Uzbekistan amounted to 23.5 million people. Thetotal territory of the country is 447.4 thousand square kilometers. The average density ofpopulation is 53.4 people per square kilometer, which is the highest density of population inCentral Asia. This figure becomes even more impressive, if one takes into account the factthat 71% of the territory consists of desert steppe. The density of population changesheavily depending on the territories (Report of the National Observatory, European TrainingFoundation, 1998)
In 1997, the number of the female population was 101.7% of the male population. Over the90s, the rate of population growth has been gradually decreasing; anyhow, the absolutegrowth is still high. The birth rate is also decreasing. In 1997, it was 26.0 (in 1985 – 37.4,in 1995 – 29.8). The rate of death slightly increased in 1997, if compared to 1990 (6.2 and6.1 respectively). In 1985, this indicator was 7.2 (Report of the National Observatory,European Training Foundation, 1998).
Uzbekistan is rich in natural resources such as coal, copper, gold, natural gas, oil, silver, anduranium, and with a well-educated population and qualified labor force it enjoys significanteconomic potential. Primary commodities, together with cotton fiber, account for about 75%of merchandise exports, with cotton alone accounting for 40%. Despite the difficult terrain(only 10% is cultivated), agriculture accounts for about 25% of GDP and employs about 40%of the labor force. In this context, the heavy use of agro-chemicals, the diversion forirrigation of huge amounts of water from the two rivers that feed the region (Amu Darya and
4
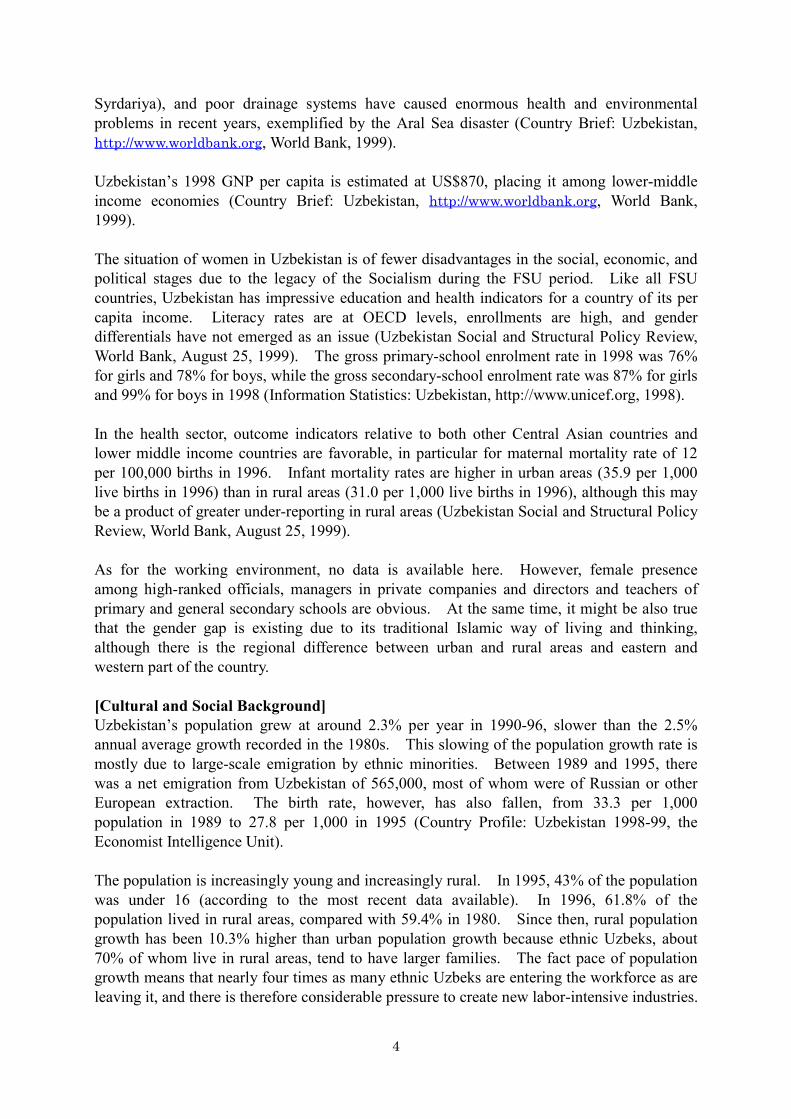
Syrdariya), and poor drainage systems have caused enormous health and environmentalproblems in recent years, exemplified by the Aral Sea disaster (Country Brief: Uzbekistan,http://www.worldbank.org, World Bank, 1999).
Uzbekistan’s 1998 GNP per capita is estimated at US$870, placing it among lower-middleincome economies (Country Brief: Uzbekistan, http://www.worldbank.org, World Bank,1999).
The situation of women in Uzbekistan is of fewer disadvantages in the social, economic, andpolitical stages due to the legacy of the Socialism during the FSU period. Like all FSUcountries, Uzbekistan has impressive education and health indicators for a country of its percapita income. Literacy rates are at OECD levels, enrollments are high, and genderdifferentials have not emerged as an issue (Uzbekistan Social and Structural Policy Review,World Bank, August 25, 1999). The gross primary-school enrolment rate in 1998 was 76%for girls and 78% for boys, while the gross secondary-school enrolment rate was 87% for girlsand 99% for boys in 1998 (Information Statistics: Uzbekistan, http://www.unicef.org, 1998).
In the health sector, outcome indicators relative to both other Central Asian countries andlower middle income countries are favorable, in particular for maternal mortality rate of 12per 100,000 births in 1996. Infant mortality rates are higher in urban areas (35.9 per 1,000live births in 1996) than in rural areas (31.0 per 1,000 live births in 1996), although this maybe a product of greater under-reporting in rural areas (Uzbekistan Social and Structural PolicyReview, World Bank, August 25, 1999).
As for the working environment, no data is available here. However, female presenceamong high-ranked officials, managers in private companies and directors and teachers ofprimary and general secondary schools are obvious. At the same time, it might be also truethat the gender gap is existing due to its traditional Islamic way of living and thinking,although there is the regional difference between urban and rural areas and eastern andwestern part of the country.
[Cultural and Social Background]Uzbekistan’s population grew at around 2.3% per year in 1990-96, slower than the 2.5%annual average growth recorded in the 1980s. This slowing of the population growth rate ismostly due to large-scale emigration by ethnic minorities. Between 1989 and 1995, therewas a net emigration from Uzbekistan of 565,000, most of whom were of Russian or otherEuropean extraction. The birth rate, however, has also fallen, from 33.3 per 1,000population in 1989 to 27.8 per 1,000 in 1995 (Country Profile: Uzbekistan 1998-99, theEconomist Intelligence Unit).
The population is increasingly young and increasingly rural. In 1995, 43% of the populationwas under 16 (according to the most recent data available). In 1996, 61.8% of thepopulation lived in rural areas, compared with 59.4% in 1980. Since then, rural populationgrowth has been 10.3% higher than urban population growth because ethnic Uzbeks, about70% of whom live in rural areas, tend to have larger families. The fact pace of populationgrowth means that nearly four times as many ethnic Uzbeks are entering the workforce as areleaving it, and there is therefore considerable pressure to create new labor-intensive industries.

5
The growing rural population is also putting pressure on the country’s already strained landand water resources (Country Profile: Uzbekistan 1998-99, the Economist Intelligence Unit).
More than 130 nationalities live in Uzbekistan. The main ethnic group is Uzbek (75.8%),followed by the Russian, Ukrainian, Tajik, Kazakh, Tatar and Karakalpak people. TheUzbek were the third-biggest ethnig group in the Soviet Union after Russians and Ukrainians.The official language is Uzbek (Report of the National Observatory, European TrainingFoundation, 1998).
The “Russian-speaking population” – a term which encompasses non-indigenous, non-Muslim groups including Russians, Ukrainians, Germans and Koreans – is in decline. Onlythe Koreans, who are often successful traders and businessmen, have not emigrated in largenumbers. Most of the “Russian-speakers” live in cities, particularly Tashkent. Data on theethnic breakdown in Uzbekistan are not easily accessible. The government massages theabsolute figures, and the position is complicated by the fact that in the past many people,especially Tajiks, came under pressure to declare themselves as Uzbeks. As a result, thenumber of Tajiks is thought to be greatly understated (Country Profile: Uzbekistan 1998-99,the Economist Intelligence Unit).
[Limited Sources of Information]The authorities’ refusal to release data makes it very difficult for international organizationswishing to publish data on Uzbekistan. No regular government statistical publications areavailable in Uzbekistan. Economic data are considered to be highly sensitive. Theoccasional figure is cited in official pronouncements, but data are never publicly available andare never produced in a standard format. For example, the contents of the national budgetand expenditures have never been disclosed to the public yet. Data from the World Bank,European Bank for Reconstruction and Development (EBRD) and OECD tend to rely heavilyon government figures, resulting in poorer quality and reliability. It is common for IMF,OECD, World Bank and EBRD data to be inconsistent (Country Profile: Uzbekistan 1998-99,the Economist Intelligence Unit)

6
2-2 Government Policy in the Fields of WID/Gender
Government policy in the fields of WID/Gender
- Under the influence of the transition to market economy, the government has takenmeasures of social policy in the field of support to the population and its protectionfrom negative effects of the reforming process.
- The social protection system, updated in 1994, was based on the principle of equity andtargeting children and families with low income.
[Policies of Social Protection]In Uzbekistan, the transition from planned socialist economy to market economy wasaccompanied, as in all other states that have chosen this way of development; by initialreduction of production, unemployment growth, decrease and stronger differentiation of lifestyle. Over the period of 1991-95, in the republic, the average money income per capita wasreduced by two times. An evident gap in the income level of population exists amongvarious regions, between towns and rural areas, among different social groups. According tothe report “On Human Development” prepared in Uzbekistan under the aegis of UNDP in1998, each fourth family (24.7%) of the total number of families, that consist of at least fivemembers, can be classified as poor. Poverty is more probable in the families with four andmore children (38.3%) and with 3 children (19.6%) (Report of the National Observatory:Uzbekistan, European Training Foundation, 1998).
In this situation, measures of social policy in the field of support to the population and itsprotection from negative effects of the reforming process acquire special importance. Oneof the crucial principles of the Uzbek model of transition to market economy is a strong socialpolicy. During the initial reforming phase, a wide range of various means and techniques ofstate regulation was used to adapt the people to new economic conditions. In particular,direct payments in form of regularly indexed salaries, pensions, grants, allowances andcompensation, as well as indirect payment in the form of exemptions and various subsidieswere practices. Another important direction of social protection of the population consistedin the implementation of measures aimed at the inner consumer market protection andmaintaining the level of consumption of main foodstuffs and non-food goods.
In 1994, the social protection system in Uzbekistan was radically changed. The updatedsocial policy was based on the principle of equity. Social protection became morepurposeful and targeted. Its major beneficiaries became children and families with lowincome. In Central Asia and, first of all, in Uzbekistan, a unique form of social self-organization, a sort of self-administration of citizens – “Makhallja” has existed since ancienttimes and has been maintained. Assistance through “Makhallja” resulted the simplest andmost effective mechanism; at “Makhallja” special funds were set up that are financed fromstate and local budgets, voluntary allocation of means by enterprises and organizations,entrepreneurial structures and private persons. On 1st January 1997, “Makhallja” wereentitled to register, determine the level of needs, assign and pay benefits to families withchildren. Formally, these functions were fulfilled by enterprises and social security bodies.The same year, over 40% of families received benefits. An average benefit per familyamounted to almost 900 sum, i.e. was increased by three times.
7
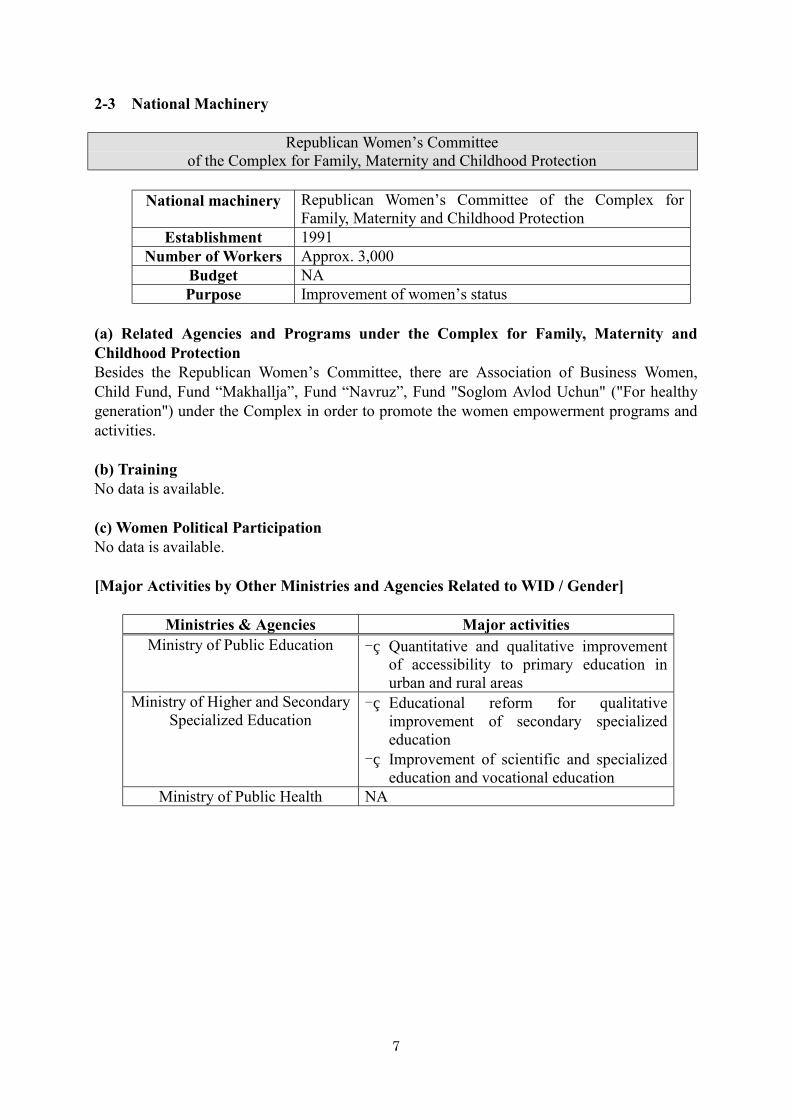
2-3 National Machinery
Republican Women’s Committeeof the Complex for Family, Maternity and Childhood Protection
National machinery Republican Women’s Committee of the Complex forFamily, Maternity and Childhood Protection
Establishment 1991Number of Workers Approx. 3,000
Budget NAPurpose Improvement of women’s status
(a) Related Agencies and Programs under the Complex for Family, Maternity andChildhood ProtectionBesides the Republican Women’s Committee, there are Association of Business Women,Child Fund, Fund “Makhallja”, Fund “Navruz”, Fund "Soglom Avlod Uchun" ("For healthygeneration") under the Complex in order to promote the women empowerment programs andactivities.
(b) TrainingNo data is available.
(c) Women Political ParticipationNo data is available.
[Major Activities by Other Ministries and Agencies Related to WID / Gender]
Ministries & Agencies Major activitiesMinistry of Public Education - Quantitative and qualitative improvement
of accessibility to primary education inurban and rural areas
Ministry of Higher and SecondarySpecialized Education
- Educational reform for qualitativeimprovement of secondary specializededucation
- Improvement of scientific and specializededucation and vocational education
Ministry of Public Health NA

8
3.WID/Gender Issues in Major Sectors
3-1 Education
Education
- Uzbekistan has impressive education indicators for a country of its per capita income.Literacy rates are at OECD levels, enrollments are high, and gender differentials havenot emerged as an issue
- Uzbekistan’s education system is not geared towards the demands of a moderneconomy. Set up in the Soviet era, the system is poorly organized and unable to copewith rapid population growth.
- Ethnic Uzbeks were poorly educated by Soviet national standards, and standards havefallen since independence.
[General Situation]Uzbekistan’s education system is not geared towards the demands of a modern economy.Set up in the Soviet era, the system is poorly organized and unable to cope with rapidpopulation growth. Nevertheless, in view of the country’s income level, Uzbeks are welleducated, with an illiteracy rate of just 3%. Ethnic Uzbeks were poorly educated by Sovietnational standards, and standards have fallen since independence. Scientific and technicaleducation has suffered a similar decline (Country Profile: Uzbekistan 1998-99, the EconomistIntelligence Unit).
Since its independence, the country had the 9-year compulsory education system (4-yearprimary education and 5-year junior secondary education). In order to improve the scientificand technical education in the secondary education and to produce more practical andacademic human resources, the government has commenced the new education reform since1998 and introduced the new compulsory education system of 12-years, which consists of 4-year primary education, 5-year general secondary education and 3-year secondary specializededucation. This education reform is to be promoted with the target year of 2005.
[Government Policy and Budget]Recent public expenditures reveal interesting characteristics and some shifts in the structureof education spending, both by level of education and type of expenditure. First, the level ofeducation spending (as a share of GDP as well as of total budgetary expenditures) has beenremarkably high and stable for a transition economy. During 1995-97, education recurrentspending accounted for 20 percent of total budgetary spending and around 7 percent of GDP.Even with the exclusion of capital expenditures, this was among the highest in the ECAregion, where the unweighted average of public education expenditure as a share of GDP in1996 was 4.8 percent, having fallen from 5.2 percent in 1995 (Uzbekistan Social andStructural Policy Review, World Bank, August 25, 1999).
Second, education spending has shifted gradually towards middle schools (i.e. compulsory 6-18 years old), which increased from around 44% to almost 57% of total public educationspending. This increase was at the expense of vocational and technical education (VET)(which fell from 20% to below 14% in the period), higher education (which fell from 8.6% to6.2%) and “other institutions” (10% to 7%) (Uzbekistan Social and Structural Policy Review,World Bank, August 25, 1999).

9
Third, the composition of expenditures has changed. Between 1995 and 1997, wage costsand scholarships rose from around 44% and 5% of the total, respectively, to just under 52%and 9%, respectively. Offsetting these increased shares were falls in the share spent onnutrition, from almost 19% to 10%, capital repair and inventory which fell from a combined5.9% to 3.6%, and “other” expenditures (Uzbekistan Social and Structural Policy Review,World Bank, August 25, 1999).
Table-1 Uzbekistan: Pattern of Education Spending 1995-971995 1996 1997
Level of Education Spending As share of GDP 7.2% 7.7% 7.2% As share of total budgetary 21.8% 21.2% 22.4%Expenditure Share by Level of Schooling Pre-school 18% 16% 17% Middle school 44% 52% 57% Higher 9% 8% 6% Vocational and Technical (VET) 20% 14% 14% Other 10% 9% 7%
Source: Ministry of Finance, Percentages may not sum due to rounding.
Looking towards the future, the government of Uzbekistan has major plans for reform of theeducation system, which are summarized in the National Program for Personnel Trainingapproved by the Oliy Majlis in 1997. The Program covers the entire education sector, andoutlines plans for reform over the short and long terms. The Program is important, in that itacknowledges the need for fundamental reorientation of the education system towards one,which is more suited to the needs of a market economy, and also promotes the role ofeducation in rebuilding national identity in the post-Soviet period.
[Primary, Secondary and Higher Education] Literacy rates are at OECD levels, enrollments are high, and gender differentials have notemerged as an issue (Uzbekistan Social and Structural Policy Review, World Bank, August 25,1999). The gross primary-school enrolment rate in 1998 was 76% for girls and 78% forboys, while the gross secondary-school enrolment rate was 87% for girls and 99% for boys in1998 (Information Statistics: Uzbekistan, http://www.unicef.org, 1998) (see Table-2).
Table-2 Uzbekistan: Education Outcome Indicators, 1996
Urban Rural Total
Literacy rate 99.7 98.6 99.1
Mean years of schooling 13.8 10.0 11.4
Education attainment index 0.933 0.875 0.895
Share of girls in total secondary enrollment 46.5%
Share of women in higher education 39.4%
Source: UNDP, 1997, Human Development Report
At the same time, enrollment data for recent years reveal significant downward shifts, which

10
are of concern (see Table-3). Points to note include: (i) the decline in pre-school enrollmentsfrom a low base. This is more dramatic when viewed over the longer term, as the declinefrom 1991-92 alone was 5 percentage points. This pattern of decline is typical in CentralAsia, as is the large differential between rural and urban enrollments, and the relatively moresevere decline in rural pre-school enrollments; (ii) the sharp decline in the share of 19 year oldcontinuing in full time education; and (iii) the decline in cohort share going into highereducation (Uzbekistan Social and Structural Policy Review, World Bank, August 25, 1999).
Table-3 Uzbekistan: Enrollment Trends by Age Group/Level, 1992-96
Level of system/age group 1992 1993 1994 1995 1996
Pre-school (0-6 years) 31 29 26 25 24
- urban 48 45 42 40 37
- rural 23 21 19 17 16
General and post-general (6-23) 57 59 51 50 47
- o/w share of 19 year olds in full
time education
31 26 26 25 21
Higher education 16 18 13 13 12
Source: Marnie, S. and Klugman, J., 1998, “Social Development in Uzbekistan”, ConsultancyReport for the ADB
[Culture and Religion in Education]The government of Uzbekistan has promoted to the “compulsory education in Uzbeklanguage” through teaching in Uzbek language and development of textbooks in Uzbeklanguage, although it still accept the flexibility of using local ethnic languages includingRussian, Tajik, Kalakalpak etc.

11
3-2 Health
Health
- Maternal Mortality Rate fell from 24.1 per 100,000 births in 1993 to 12 in 1996, andInfant Mortality Rate fell from 40.0 per 1,000 live births in 1993 to 32.5 in 1996.
- These improvements were made by wide dissemination of family planning methodand antenatal care among women of the reproductive age.
[General Situation]The standard healthcare in Uzbekistan has been adversely affected by the emigration ofdoctors from the Russian and other European communities, and by a drop in funding. Thegovernment claims that in 1989-94 there were on average 106 people per hospital bed and282 per doctor. According to the International Labor Organization (ILO) and the UN, thenumber of medical students fell from 4,800 in 1991 to just 1,500 in 1995, a drop of 69%.Data on healthcare expenditure are unreliable, but it is estimated that spending fell from 5.9%of GDP in 1991 to 4% of GDP in 1996. Hospital bed numbers are estimated to havedropped by 16% between 1990 and 1994 (Country Profile: Uzbekistan 1998-99, theEconomist Intelligence Unit).
Like other former Soviet republics, Uzbekistan is trying to reduce healthcare inefficienciesand costs by reducing in-patient care. Primary healthcare, particularly in rural areas, is nowreceiving more attention as less emphasis is put on hospital medicine. Maternal and Infantmortality rates are falling (see Table below). Contraception is more widely used, which hashelped reduce maternal deaths by extending the gap between pregnancies. Life expectancyis also rising (Country Profile: Uzbekistan 1998-99, the Economist Intelligence Unit).
Table Comparative Health Indicators for Uzbekistan (selected years)
Indicator UzbekistanOther
CentralAsia
Lowermiddleincome
1993 1996 1995 1995Life Expectancy a) 70.4 70.2 68 67 - Urban 71.7 71.5 - Rural 69.3 69.1Infant Mortality Rate (IMR)b) (per1,000 live births)
40.0 32.5 43 41
- Urban 40.4 35.9 - Rural 39.9 31.0Maternal Mortality Rate (MMR)(per 100,000 births)
24.1 12 79c) 165
Notes:a) Life expectancy for 1994 and 1996;b) IMR adjusted upward by 25% for Uzbekistan and Central Asia to compare to WHO
definition of live birth;c) MMR does not include Tajikistan, and uses 1993 data for Turkmenistan.Source: WDR various years; UNDP HDR various years; and World Bank Staff estimates

12
[Government Policy and Budget]The efficiency problems in the sector have been brought into sharp focus by the squeeze onpublic spending in recent years. Public health recurrent expenditures have fallen fromaround 4.7% of GDP in 1992 to only 3.3% in 1997, and is projected to stay at this level in1998. Real per capita spending in the sector has remained around 50% of 1990 levels since1994, having experienced a large phased decline between 1991 and 1993. Nonetheless, thesector has broadly held its own in terms of government spending priorities. In terms of theregional distribution of territorial health expenditures, Uzbekistan appears to have donesignificantly better than many of its FSU stable between 1991 and 1995 at 11-15%(Uzbekistan Social and Structural Policy Review, World Bank, August 25, 1999).
The government has recognized a number of the problems in the sector, and has respondedwith a health reform strategy. This is outlined in Presidential Decree “On the State Programof the Health System of the Republic of Uzbekistan” of November 1998. This formallyapproves the state program on sectoral reform for the period 1998-2005, developed by theRepublican Commission on Health Reforms. It is also supported by the World Bank’sHealth Project, which places strong emphasis on strengthening primary care, particularly inrural areas, and making it more cost-effective (Uzbekistan Social and Structural PolicyReview, World Bank, August 25, 1999).
[Child and Maternal Health]The 1996 Uzbekistan Demographic and Health Survey (UDHS) is a nationally representativesurvey of 4,415 women age 15-49, sponsored by the Ministry of health and funded by USAID.The following information about child and maternal health in Uzbekistan is prepared based onthe UDHS report.
FertilitySurvey results indicate a total fertility rate (TFR) for all of Uzbekistan of 3.3 children perwomen. Fertility levels differ for different population groups. The TFR for women inurban areas (2.7 children per women) is substantially lower than for women in rural areas(3.7). The TFR for Uzbeki women (3.5 children per women) is higher than for women ofother ethnicities (2.5). Among the regions of Uzbekistan, the TFR is lowest in Tashkent City(2.3 chileren per women).
The UDHS data show that fertility has declined in Uzbekistan in recent years. For example,fertility among 25-29 year-olds has fallen by one-third over the past 20 years. The decliningtrend in fertility can be seen by comparing the completed family size of women near the endof their childbearing years with the current TFR. Completed family size among women 45-49 is 4.6 children which is one child more than the current TFR.
Overall, one-third of nonfirst births (30%) in Uzbekistan take place within 24 months of theprevious birth. The median birth interval is 2.5 year. The median age at which women inUzbekistan begin childbearing has been holding steady at about 21.5. Most women havetheir first birth while in their early twenties, although about one-quarter of women give birthbefore age 20. One-half of married women in Uzbekistan (51%) do not want to have morechildren, and a large majority of women (75%) want either to delay their next birth by at leasttwo years (24%) or to stop childbearing altogether. These are the women who are
13
potentially in need of some method of family planning.
Family PlanningKnowledge of contraceptive method is high among women in Uzbekistan. Knowledge of atleast one method is 89%. High levels of knowledge are the norm for women of all ages, allregions of the country, all educational levels, and all ethnicities. However, knowledge ofsterilization was low; only 27% of women reported knowing of this method. Amongcurrently married women, 68% report having used a method of contraception at some time.The women most likely to have ever used a method of contraception are those age 30 andabove.
Overall, among currently married women, 56% report that they are currently using acontraceptive method. More than half (51%) are using a modern method of contraceptionand another 4% are using a traditional method. The IUD is by far the most commonly usedmethod; almost account for only a small amount of use among currently married women: pillsand condoms (2 % each), and injectables and female sterilization (1% each). Thus, thepractice of family planning in Uzbekistan places high reliance on a single method, the IUD,although the pill, condom and injectables are widely known.
The vast majority of women obtain their contraceptives through the public sector (98%): 55%from a government hospital, and 18% from a women’s consulting center. The source ofsupply of the method depends on the method being used. For example, most women usingIUDs obtain them at hospitals (58%) or women’s consulting centers (19%). Governmentpharmacies supply 26% of pill users and 90% of condom users. Pill users also obtainsupplies from women’s consulting centers or polyclinics (24%). Private sector provision ofcontraceptive is a relatively new phenomenon in Uzbekistan. The survey found that privatepharmacies accounted for only 3% of pill supplies. However, the private sector is expectedto become increasingly important.
Maternal and Child Health Care ServiceUzbekistan has a well-developed health system with an extensive infrastructure of facilitiesthat provide maternal care services. This system includes special delivery hospitals, theobstetrics and gynecology departments of general hospitals, women’s consulting centers, anddoctor’s assistant/midwife posts (FAPs). There is an extensive network of FAPs throughoutrural areas.
Virtually all births in Uzbekistan (94%) are delivered at health facilities: 94% in deliveryhospitals and less than 1% in either general hospitals or FAPs. Only 6% of births aredelivered at home. Almost all births (98%) are delivered under the supervision of medicallytrained persons: 94% by a doctor and 4% by a nurse or midwife.
The survey data indicate that a high proportion of respondents (95%) receive antenatal carefrom professional health providers: the majority from a doctor (85%) and a significantproportion from a nurse or midwife (10%). The general pattern in Uzbekistan is that womenseek antenatal care early and continue to receive care throughout their pregnancies. Themedian number of antenatal care visits reported by respondents is 8.
14
Information on vaccination coverage was collected in the UDHS for all children under threeyears of age. In Uzbekistan, child health cards are maintained in the local health carefacilities or day care centers rather than in the homes of respondents.
In Uzbekistan, the percentage of children 12-23 months of age who have received all WorldHealth Organization (WHO) recommended vaccinations is high (85%). BCG vaccination isusually given in delivery hospitals and was nearly universal (98%). Almost all children(100%) have received the first doses of polio and DPT/DT. Coverage for the second dosesof polio and DPT/DT is also nearly universal (98%). The third doses of polio and DPT/DThave been received by more than 94% of children. This represents a dropout rate of only 3and 5% for the polio and DPT/DT vaccinations, respectively. A high proportion of children(92%) have received the measles vaccine.

15
3-3 Agriculture, Forestry and Fisheries
Agriculture, Forestry and Fisheries - Agriculture remains the backbone of Uzbekistan’s economy, accounting for a quarter
of GDP, 60% of foreign exchange earnings, and 40% of employment. In addition,agriculture supports large food and nonfood processing industries.
- However, it greatly depends on the production of cotton and wheat, which has sufferedlow productivity.
- Farm restructuring and value-added agriculture-related industry are highly required inorder to cover the large labor force in rural areas.
[General Situation]The Government’s strategy in agriculture is to promote greater productivity and growth, inrecognition of agriculture’s major share in the economy. There is also a clear strategy tomove away from an agriculture-based economy into an industrialized economy. Theseobjectives assign an important role to the agricultural sector. Agriculture is simultaneouslyintended to grow, to become more efficient, to contribute to the creation of rural employment,and to provide resources for investment in other sectors of the economy. In a very broadsense these objectives can be internally consistent and reflect the true potential of the sector.However, the instruments used to pursue these objectives are internally contradictory, and therecord of achievement is mixed (Uzbekistan Social and Structural Policy Review, World Bank,August 25, 1999).
[Agriculture]Agriculture remains the backbone of Uzbekistan’s economy, accounting for a quarter of GDP,60% of foreign exchange earnings, and 40% of employment. In addition, agriculturesupports large food and nonfood processing industries. After declining sharply in 1996,agricultural production rebounded by 5.8% in 1997 primarily because of good weather.Cotton and grain output increased by 8.7% and 6.7%, respectively, compared with theirproduction levels in 1996. Agricultural production in 1998, however, grew by only 4% dueto a sharp 12% fall in the production of cotton (20% short of the targeted figure). Poorweather and the lack of effective incentives for producers were contributory factors.Nevertheless, grain output grew by 9% and production of vegetables and meat increased. Thisreflected the government’s policy to encourage greater domestic production of grain,horticulture products, and meat so as to reduce imports of those items (Country EconomicReview: Uzbekistan, Asian Development Bank, August 1999).
Cotton yields decreased from 2.7 tons per hectare in 1991 to 2.2 tons per hectare in 1998.While wheat yields almost doubled from 1.3 tons per hectare in 1991 to 2.5 tons per hectarein 1998, there were concerns about the government’s policy of achieving wheat self-sufficiency because the external supply of wheat is cheaper and more reliable. The flow ofresources into and out of primary agriculture places a strain on the budget and productivity,and raises questions about the efficient use of the large transfers granted to the state-ownedcotton-marketing agency. In the financial flows to and from the sector and the approaches tofarm restructuring and land reform are insufficient to support the growth of rural incomes andemployment. FDI in agriculture and agro-industries is still negligible, and although anumber of projects have been prepared, their implementation falls far below expectations.

16
Since independence, the total commitments of investments and credits to agriculture withsovereign guarantee reached $5 billion. But as of January 1998, the actual utilization ofthese resources amounted to only about $330 million (Country Economic Review: Uzbekistan,Asian Development Bank, August 1999).
[Farm Restructuring and Land Tenure]Since 1991, a number of changes have been introduced into the structure and organization ofagricultural enterprises in an effort to create a stronger sense of ownership on the part of theworkforce. The former state farms have been reorganized into various forms of non-statecollective enterprises. Most collective farms remain much as they were during the lateSoviet period. Various experiments to reconfigure the collectives to place greater autonomyat brigade level have been tried. These experiments are within the collectivist framework,and resemble similar experiments in the late 1980s. On some enterprises more fundamentalchanges have been introduced, also on an experimental basis. These include:- creation of joint stock companies (societies of shareholders), with non-land assets owned
in shares by the labor force;- the association of peasant farmers, in which the lands of the original collective are divided
among households but much of the cultivation is undertaken jointly;- the producers’ cooperative (shirkat) within which production assignments are contracted
out to constituent households (Country Economic Review: Uzbekistan, AsianDevelopment Bank, August 1999).
Key issues affecting rural employment and incomes are thus the extent to which approachesto farm restructuring match households with identified parcels of land, and the degree towhich they feel their tenure rights to the land are secure. Although the new Land Code,passed in 1998, has a number of positive features, it does not support changes in farmstructure and land tenure consistent with growth in incomes and rural employment. Keyissues are (i) the land tenure rights recognized in the law are not tradable, (ii) the rights ofenterprises are more secure than those of the constituent households of the enterprises, even ifthe households are allocated a parcel of land under a family contract. Both of these featuresreduce incentives for rural people to invest in their land to improve its productivity, or to shifttoward production of higher valued crops and products. Because the tenure rights are nottradable, land mortgage as an instrument of finance is not likely to develop, since acommercial lender would not be able to sell the security in case of default on the loan(Uzbekistan Social and Structural Policy Review, World Bank, August 25, 1999).
[Rural Standards of Living and Employment]Data on the living standards of rural residents are not available. A new household surveyis due to be launched which should provide an assessment of current living standards.The survey will not, however, provide insight into changes in living standards over time.Data on wages are also inadequate. Even though agricultural wages are reported to havefallen relative to other wages in the economy – from a level about one third above averagepublic sector wages in 1991 to less than half of average public sector wages in 1997 – wagedata may not fully reflect agricultural incomes. However, the resource transfers out ofagriculture, estimated above, imply downward pressures on living standards (UzbekistanSocial and Structural Policy Review, World Bank, August 25, 1999).

17
The government seeks to create employment in rural areas to respond to growth inpopulation and to address chronic problems of underemployment in agriculture.Improved investment in the health and education of rural people and better provision ofrural services, such as clean drinking water and piped gas are intended to make rural areasmore attractive places of live and to reduce internal migration to urban areas. Changes inthe organization of agricultural enterprises are intended to increase the sense of ownershipof agricultural producers, and to increase the efficiency of operation, thereby contributingto higher incomes and increased economic vitality in rural areas. So far the changes inorganization of enterprises have been quite modest and price and marketing policies haveseverely constrained income growth in agriculture. Experience in other countries hasshown that growth in agricultural earnings can be a catalyst for growth in ruralnonagricultural activities, such as rural services and small-scale industry. Conversely, it isdifficult to achieve growth in employment in rural activities other than agriculture whenagricultural earnings are declining (Uzbekistan Social and Structural Policy Review, WorldBank, August 25, 1999).
[Forestry and Fishery]No data is available.
18
3-4 Economic activities
Economic activities
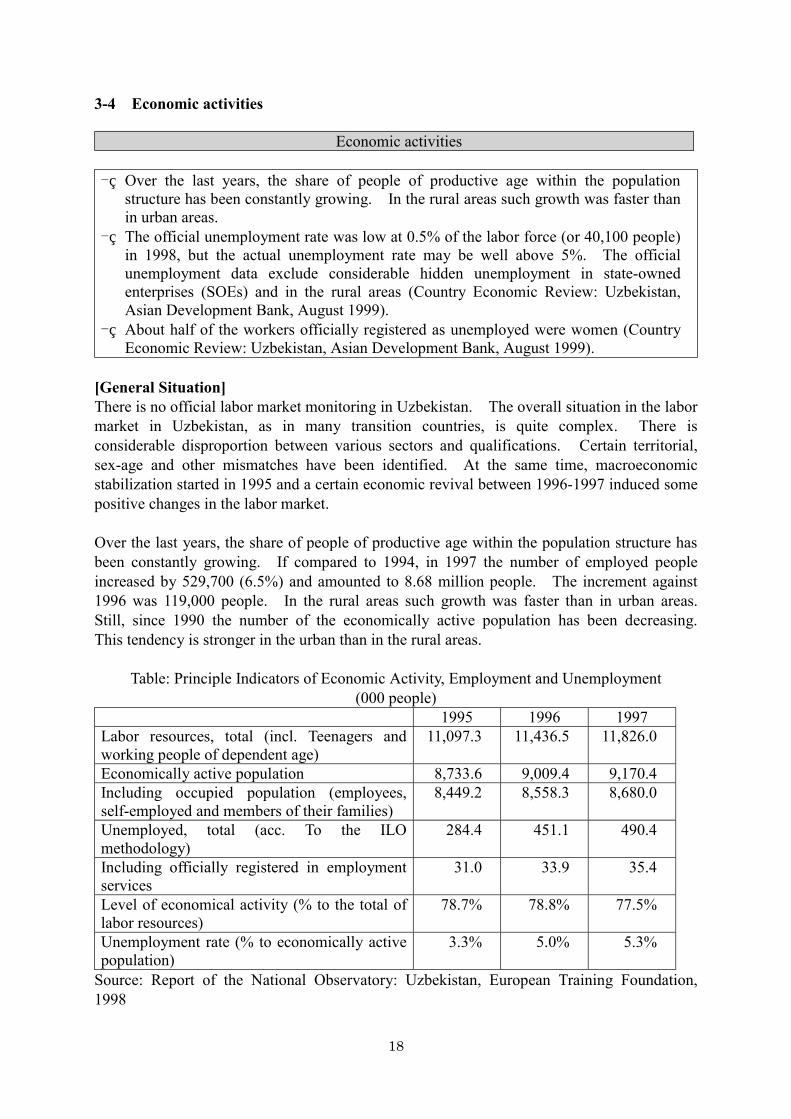
- Over the last years, the share of people of productive age within the populationstructure has been constantly growing. In the rural areas such growth was faster thanin urban areas.
- The official unemployment rate was low at 0.5% of the labor force (or 40,100 people)in 1998, but the actual unemployment rate may be well above 5%. The officialunemployment data exclude considerable hidden unemployment in state-ownedenterprises (SOEs) and in the rural areas (Country Economic Review: Uzbekistan,Asian Development Bank, August 1999).
- About half of the workers officially registered as unemployed were women (CountryEconomic Review: Uzbekistan, Asian Development Bank, August 1999).
[General Situation]There is no official labor market monitoring in Uzbekistan. The overall situation in the labormarket in Uzbekistan, as in many transition countries, is quite complex. There isconsiderable disproportion between various sectors and qualifications. Certain territorial,sex-age and other mismatches have been identified. At the same time, macroeconomicstabilization started in 1995 and a certain economic revival between 1996-1997 induced somepositive changes in the labor market.
Over the last years, the share of people of productive age within the population structure hasbeen constantly growing. If compared to 1994, in 1997 the number of employed peopleincreased by 529,700 (6.5%) and amounted to 8.68 million people. The increment against1996 was 119,000 people. In the rural areas such growth was faster than in urban areas.Still, since 1990 the number of the economically active population has been decreasing.This tendency is stronger in the urban than in the rural areas.
Table: Principle Indicators of Economic Activity, Employment and Unemployment(000 people)
1995 1996 1997Labor resources, total (incl. Teenagers andworking people of dependent age)
11,097.3 11,436.5 11,826.0
Economically active population 8,733.6 9,009.4 9,170.4Including occupied population (employees,self-employed and members of their families)
8,449.2 8,558.3 8,680.0
Unemployed, total (acc. To the ILOmethodology)
284.4 451.1 490.4
Including officially registered in employmentservices
31.0 33.9 35.4
Level of economical activity (% to the total oflabor resources)
78.7% 78.8% 77.5%
Unemployment rate (% to economically activepopulation)
3.3% 5.0% 5.3%
Source: Report of the National Observatory: Uzbekistan, European Training Foundation,1998
19
The highest employment rate is typical for the population between 35 and 44 years of age.More than 80% of this age group is employed. Among male population, this indicator iseven higher and amounts to 91%. The distribution of the employed among various branchesstill demonstrates a distorted structure of economy with a hypertrophied agricultural andservice sectors and a small industrial one (Report of the National Observatory: Uzbekistan,European Training Foundation, 1998).
[Industry]In 1997, industrial production increased by 2.2% mainly on account of the start-up of severalnew joint ventures for manufacturing television sets, video cassette recorders (VCRs), andautomobiles. The government’s efforts to stimulate the development of small and medium-size enterprises (SMEs) producing consumer goods and nonconsumption durable items werealso a contributory factor. However, the growth of industrial output slowed in 1998primarily because of the fall in the external demand for Uzbekistan’s major industrial exports(gold and gas), as well as the decline in their world prices. In addition, the relatively insipidgrowth performance of the sector resulted from structural rigidities in the economy, factormarket distortions, import compression by the government, and the slower growth of foreigndirect investment (FDI).
The performance of the industry subsectors varied. Production of oil, natural gas, cement,cotton fibers, and synthetic yarns expanded because of the government’s strong support. Inrecent years, the government made efforts to promote the development of these subsectorsthrough provision of budgets and directed bank credit on concessional terms. By contrast,output continued to decline in machinery, chemical fertilizers, steel, ferrous metal, paper, andsome consumer goods (e.g., cotton textile and dairy products). Overall, industry’s share ofGDP shrank from 26% in 1996 to 22.8% in 1998. There appears to be some rebound inindustrial production in the first half of 1999, with officially reported growth being 4.5%compared to the same period last year (Country Economic Review: Uzbekistan, AsianDevelopment Bank, August 1999).
[Employment and Wages]Economic recovery since 1996 has contributed to employment growth. The number ofemployed steadily increased from 8.1 million in 1994 to 8.7 million in 1998, an averagegrowth rate of 1.8% per annum. The government’s employment programs played acontributory role as more than 346,000 persons found jobs under the programs in 1997. As aresult of structural reforms, employment continued to shift from the public sector to thenascent private sector, particularly to the service sector. More than 90% of the employed arecurrently in the non-state sector and about 40% are self-employed. Employment growth wasrapid banking and insurance, retail, wholesale and catering trade. Those sectors were able toabsorb a large number of laborers because, being undeveloped during the FSU era, theyexpanded after the privatization of small enterprises was virtually complete. Employment inhousing services and the government also grew rapidly by 7.7% and 5.8% during 1994-1997.An estimated 55% of the employed population worked in the rural areas (Country EconomicReview: Uzbekistan, Asian Development Bank, August 1999).
The official unemployment rate was low at 0.5% of the labor force (or 40,100 people) in 1998,
20
but the actual unemployment rate may be well above 5%. The official unemployment dataexclude considerable hidden unemployment in state-owned enterprises (SOEs) and in therural areas. The SOEs and collective farms often retain surplus employees to avoid massivelayoffs and potential social unrest. In addition, many unemployed people were not officiallyregistered as such because of low unemployment benefits. About half of the workersofficially registered as unemployed were women (Country Economic Review: Uzbekistan,Asian Development Bank, August 1999).
To mitigate the social costs of the transition to a market economy, the government attemptedto create job opportunities in the rural areas and adjust the wages of public sector employees.A presidential decree issued only 1 July 1998 raised the wages of public sector employees by50% and pensions by 60%. The increase in wages will further raise real average wages.Nevertheless, these wage and pension adjustments will impose an additional fiscal burden onthe government since they have to be met from the state budget (Country Economic Review:Uzbekistan, Asian Development Bank, August 1999).

21
4. WID/Gender Projects
Project/ProgramsImplementing
Agency Donor DurationBudget(US$) Gender-related Issues
General
EducationSenior Secondary EducationProject
Ministry of Higherand SecondarySpecializedEducation
AsianDevelopmentFund
2000-2005 57,000,000 Improvement of secondaryspecialized education, curriculumdevelopment, teachers’ training
HealthUzbekistan-Health 1(@)
Water Supply, Sanitationand Health Project
Ministry of Health,Tashkent
Goskomprognostat,Mr. Alexander Mironenkov, 45A,Uzbekistan Str.Tashkent
World Bank
World Bank
Improve the quality and costeffectiveness of PHC, particularlyin rural areas by strengthening themanagement and financing of PHC.
Provision of safe drinking wateralong with the improved hygieneeducation and sanitation facilitiesand decrease water-borne diseases.
Agriculture, Forestry and FisheryInstitutional Support forSustainable AgriculturalDevelopment
Uzbekistan-KarshiPumping CascadeRehabilitation Project
Uzbekistan-CottonSub-Sector ImprovementProject
Ministry ofAgriculture andWater Resources
Ministry ofAgriculture andWater Resources
Government ofUzbekistan, StateCommittee forForecasting andStatistics
ADB
World Bank
World Bank
600,000 Strengthening the existing ruralbusiness advisory center to provideagribusiness advisory andagricultural extension services tothe project beneficiaries
To increase reliability, efficiencyand sustainability of pumped watersupply in the region where 1.5million people depend on thiswater source particularly fordomestic and industry purpose.
Support the government efforts atincreasing productivity in thecotton sector
Economic ActivitiesMineral Exploration in thesouthern Nuratau Apea
NationalCommittee ofGeology
JICA 1997~2000
OthersThe Study forimprovement ofmanagement and TariffPolicy in the Water SupplyServices
Furthering Policy Reformin the Railway Sector
Development of theInsurance Industry
Pilot Water SupplyEngineering Project
Ministry of MacroEconomy/Statistics, Ministry ofPublic Affairs
Uzbekistan TemirYullari
State InsuranceSupervision Board
Goskomprognostat
JICA
ADB
ADB
World Bank
1999~2000
600,000
300,000
Development of railway sector forfulfilling the main objectives ofsocio-economic development andpoverty reduction in areasunserved by the railway
Pilot project for community basedwater supply and distributionscheme
22
5 WID/Gender Information Sources
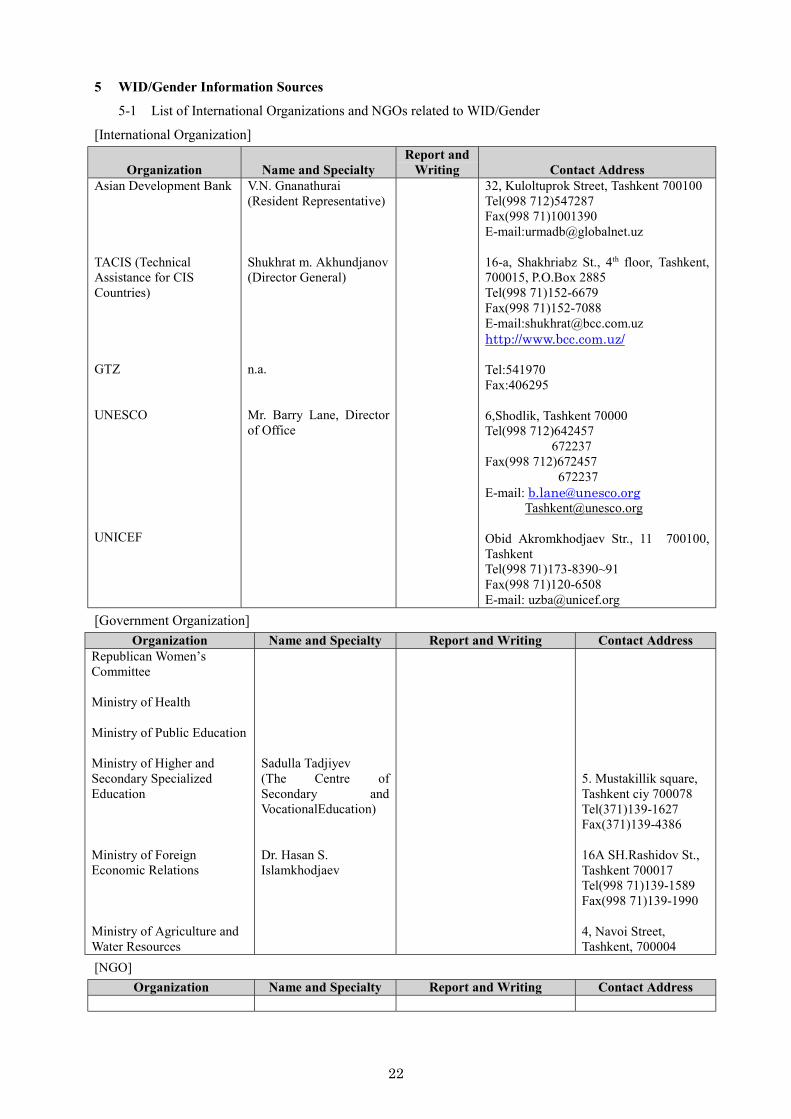
5-1 List of International Organizations and NGOs related to WID/Gender
[International Organization]
Organization Name and SpecialtyReport and
Writing Contact AddressAsian Development Bank
TACIS (TechnicalAssistance for CISCountries)
GTZ
UNESCO
UNICEF
V.N. Gnanathurai(Resident Representative)
Shukhrat m. Akhundjanov(Director General)
n.a.
Mr. Barry Lane, Directorof Office
32, Kuloltuprok Street, Tashkent 700100Tel(998 712)547287Fax(998 71)1001390E-mail:[email protected]
16-a, Shakhriabz St., 4th floor, Tashkent,700015, P.O.Box 2885Tel(998 71)152-6679Fax(998 71)152-7088E-mail:[email protected]://www.bcc.com.uz/
Tel:541970Fax:406295
6,Shodlik, Tashkent 70000Tel(998 712)642457 672237Fax(998 712)672457 672237E-mail: [email protected] [email protected]
Obid Akromkhodjaev Str., 11 700100,TashkentTel(998 71)173-8390~91Fax(998 71)120-6508E-mail: [email protected]
[Government Organization]
Organization Name and Specialty Report and Writing Contact AddressRepublican Women’sCommittee
Ministry of Health
Ministry of Public Education
Ministry of Higher andSecondary SpecializedEducation
Ministry of ForeignEconomic Relations
Ministry of Agriculture andWater Resources
Sadulla Tadjiyev(The Centre ofSecondary andVocationalEducation)
Dr. Hasan S.Islamkhodjaev
5. Mustakillik square,Tashkent ciy 700078Tel(371)139-1627Fax(371)139-4386
16A SH.Rashidov St.,Tashkent 700017Tel(998 71)139-1589Fax(998 71)139-1990
4, Navoi Street,Tashkent, 700004
[NGO]
Organization Name and Specialty Report and Writing Contact Address

23
5 WID/Gender Information Sources
5-2 List of Reports and References related to WID/Gender = Not available.
[Socio/Gender Analysis]
Title Author Year Available atUzbekistan Social and Structural PolicyReview
World Bank 1999 World Bank
Country Economic Review: Uzbekistan Asian Development Bank 1999 Asian Development BankCountry Profile: Uzbekistan 1998-99 The Economist Intelligence
Unit1998 The Economist Intelligence
UnitCountry Report 3rd Quarter 1998:Uzbeksitan
The Economist IntelligenceUnit
1998 The Economist IntelligenceUnit
Republic of Uzbeksitan – RecentEconomic Developments
International Monetary Fund 1998 International Monetary Fund
[Education]Title Author Year Available at
Report of the National observatory:Uzbekistan
European Training Foundation 1998 European TrainingFoundation
[Health]
Title Author Year Available atDemographic and Health Survey 1996 Institute of Obstetrics and
Gynecology, Ministry ofHealth of the Republic ofUzbeksitan
1998 Demographic and HealthSurveys, Macro InternationalInc.

24
6 Reference
Title Author Year Available atGeneralUzbekistan Social and Structural PolicyReview
World Bank 1999 World Bank
Country Economic Review: Uzbekistan Asian Development Bank 1999 Asian Development BankCountry Profile: Uzbekistan 1998-99 The Economist Intelligence
Unit1998 The Economist Intelligence
UnitCountry Report 3rd Quarter 1998:Uzbeksitan
The Economist IntelligenceUnit
1998 The Economist IntelligenceUnit
Republic of Uzbeksitan – RecentEconomic Developments
International Monetary Fund 1998 International Monetary Fund
EducationReport of the National observatory:Uzbekistan European Training Foundation 1998
European TrainingFoundation
HealthDemographic and Health Survey 1996 Institute of Obstetrics and
Gynecology, Ministry ofHealth of the Republic ofUzbeksitan
1998 Demographic and HealthSurveys, Macro InternationalInc.
25
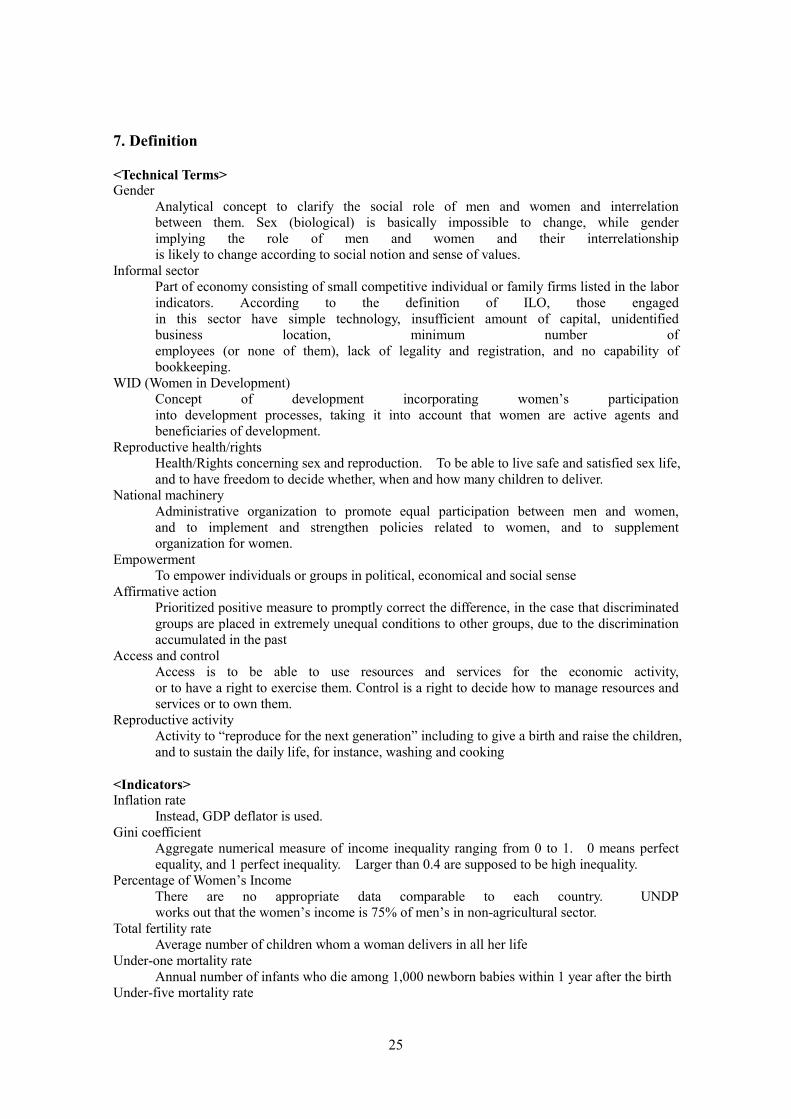
7. Definition
<Technical Terms>Gender
Analytical concept to clarify the social role of men and women and interrelationbetween them. Sex (biological) is basically impossible to change, while genderimplying the role of men and women and their interrelationshipis likely to change according to social notion and sense of values.
Informal sectorPart of economy consisting of small competitive individual or family firms listed in the laborindicators. According to the definition of ILO, those engagedin this sector have simple technology, insufficient amount of capital, unidentifiedbusiness location, minimum number ofemployees (or none of them), lack of legality and registration, and no capability ofbookkeeping.
WID (Women in Development)Concept of development incorporating women’s participationinto development processes, taking it into account that women are active agents andbeneficiaries of development.
Reproductive health/rightsHealth/Rights concerning sex and reproduction. To be able to live safe and satisfied sex life,and to have freedom to decide whether, when and how many children to deliver.
National machineryAdministrative organization to promote equal participation between men and women,and to implement and strengthen policies related to women, and to supplementorganization for women.
EmpowermentTo empower individuals or groups in political, economical and social sense
Affirmative actionPrioritized positive measure to promptly correct the difference, in the case that discriminatedgroups are placed in extremely unequal conditions to other groups, due to the discriminationaccumulated in the past
Access and controlAccess is to be able to use resources and services for the economic activity,or to have a right to exercise them. Control is a right to decide how to manage resources andservices or to own them.
Reproductive activityActivity to “reproduce for the next generation” including to give a birth and raise the children,and to sustain the daily life, for instance, washing and cooking
<Indicators>Inflation rate
Instead, GDP deflator is used.Gini coefficient
Aggregate numerical measure of income inequality ranging from 0 to 1. 0 means perfectequality, and 1 perfect inequality. Larger than 0.4 are supposed to be high inequality.
Percentage of Women’s IncomeThere are no appropriate data comparable to each country. UNDPworks out that the women’s income is 75% of men’s in non-agricultural sector.
Total fertility rateAverage number of children whom a woman delivers in all her life
Under-one mortality rateAnnual number of infants who die among 1,000 newborn babies within 1 year after the birth
Under-five mortality rate
26
Annual number of infants who die 1,000 newborn babies within 5 years after the birthMaternal mortality rate
Annual number of mothers who die among 100,000 cases of delivery because ofPercentage of births attended by trained health personnel
The rate of births with the help of doctors, nurses, midwives, trained health personnel,or trained traditional midwives
Percentage of infants with low birth weightThe rate of newborn children of which the birth weight is less than 2,500 grams
Oral Rehydration Therapy (ORT) use rateThe rate of using oral rehydrate salt or substitute solution forunder-five infants having diarrhea
Enrolment ratio of primary and secondary schoolTotal enrolment ratio (or gross enrolment ratio) is the rate of pupils going to schoolwith no respect to school age against population at the school age. Netenrolment ratio is the rate of pupils going to school at the schoolage against the people at the school age.