COUNTRY REPORT ON MARINE FARMING IN THE PHILIPPINES1...
25
COUNTRY REPORT ON MARINE FARMING IN THE PHILIPPINES 1 By: Westly R. Rosario 2 INTRODUCTION For the past several years, aquaculture has dominated the fisheries sector and was considered the forefront of the government’s food security and poverty alleviation programs. Seaweeds and milkfish are the top two commercially important species produced from aquaculture. Other species are tilapia, grouper, siganids, and mussels. With the vast growing population of the country, the need to expand aquaculture areas is necessary. From the traditional freshwater and brackish water ponds, now, to marine farming in fishpens and cages. The increasing volume of produce from cages compared to the modest production from fishponds has encouraged fish farmers to venture into water-based or off-shore aquaculture enterprise. The proliferation of fishpens and fishcages in shallow, narrow tributaries and rivers resulted to occasional fishkills. These structures have obstructed the tidal flow of freshwater into the brackishwater ponds, thereby affecting production. Moreover, polluted water caused by excessive feed inputs resulted to some extent of retardation in the growth of oysters. The continuous increase in the number of structures may have contributed to siltation in the aquaculture zones. The establishment of mariculture parks is foreseen to play a significant role in solving these negative impacts. It also aims to promote zoning in the municipal waters delineating areas for mariculture. and provide opportunities for marginal farmers to engage in off-shore fish cage operation. This paper will provide information on the current status and challenges in the establishment of mariculture parks- its management concepts, legal mandates, organization, technical services offered, opportunities, constraints and issues. ------------------ 1 Paper presented to the Regional Mariculture Workshop in Shenzhen China on March 6-11,2006 2. Center Chief, National Integrated Fisheries Technology Development Center, Bureau of Fisheries and Aquatic Resources, Dagupan City, Philippines. Telefax (63)(075)-523-0385; Email : [email protected]
Transcript of COUNTRY REPORT ON MARINE FARMING IN THE PHILIPPINES1...
COUNTRY REPORT ON MARINE FARMING IN THE PHILIPPINES1
By: Westly R. Rosario2
INTRODUCTION For the past several years, aquaculture has dominated the fisheries sector and was considered the forefront of the government’s food security and poverty alleviation programs. Seaweeds and milkfish are the top two commercially important species produced from aquaculture. Other species are tilapia, grouper, siganids, and mussels. With the vast growing population of the country, the need to expand aquaculture areas is necessary. From the traditional freshwater and brackish water ponds, now, to marine farming in fishpens and cages. The increasing volume of produce from cages compared to the modest production from fishponds has encouraged fish farmers to venture into water-based or off-shore aquaculture enterprise. The proliferation of fishpens and fishcages in shallow, narrow tributaries and rivers resulted to occasional fishkills. These structures have obstructed the tidal flow of freshwater into the brackishwater ponds, thereby affecting production. Moreover, polluted water caused by excessive feed inputs resulted to some extent of retardation in the growth of oysters. The continuous increase in the number of structures may have contributed to siltation in the aquaculture zones. The establishment of mariculture parks is foreseen to play a significant role in solving these negative impacts. It also aims to promote zoning in the municipal waters delineating areas for mariculture. and provide opportunities for marginal farmers to engage in off-shore fish cage operation. This paper will provide information on the current status and challenges in the establishment of mariculture parks- its management concepts, legal mandates, organization, technical services offered, opportunities, constraints and issues. ------------------ 1 Paper presented to the Regional Mariculture Workshop in Shenzhen China on March 6-11,2006 2. Center Chief, National Integrated Fisheries Technology Development Center, Bureau of Fisheries and Aquatic Resources, Dagupan City, Philippines. Telefax (63)(075)-523-0385; Email : [email protected]

OVERVIEW OF THE PHILIPPINE FISHERIES
Contribution to World Production
The Philippine Fisheries ranked 8th among the top producing countries in the World with its total production of 3.62 million metric tons of fish crustaceans, mollusks and aquatic plants in 2003. The production constitutes 2.5% of the total world production of 146.27 million metric tons (FAO website).
The Philippine aquaculture production of 0.459 million metric tons in 2003 is
11th in the world sharing 1.1% to the total global aquaculture production of 42.3 million metric tons amounting to about 600 million dollars in terms of value. (FAO website)
The Philippines is also the world’s 2nd largest producer of aquatic plants
(including seaweeds) having produced a total of 0.989 million metric tons or nearly 8% of the total world production of 12 million metric tons (FAO website). Table 1. Five Year Fish Production, Trend 2000 – 2004
Quantity % Increase Value % Increase Year (MT) (Decrease) ('000 P) (Decrease) 2004 3,926,173.36 8.48 138,846,377.29 15.83 2003 3,619,282.38 7.41 119,866,326.00 5.83 2002 3,369,524.00 6.41 113,258,218.00 5.90 2001 3,166,530.00 5.79 106,944,716.00 8.44 2000 2,993,332.00 2.38 98,622,134.00 6.82
Source: Philippine Fishery Profile 2004
Figure 1. Five Year Fish Production, Trend 2000 - 2004
Five Year Fish Production, Trend 2000-2004
-500,000.00
1,000,000.001,500,000.002,000,000.002,500,000.003,000,000.003,500,000.004,000,000.004,500,000.00
2004 2003 2002 2001 2000
Year
Quantity (MT)

Contribution to National Economy, 2004
The fishing industry contributed 2.3% and 2.4% to the country’s Gross Domestic Product (GDP) equivalent to some P111B and P48B for current and constant prices, respectively.
The industry’s contribution to the Gross Value Added (GVA) in Agriculture,
Fishery and Forestry Group is 14.9% (P111 B) and 21.6% (P48.7B) out of the total P742B and P225B at current and constant prices, respectively. It has the largest share next to agricultural crops.
The fishing industry provided employment to more than 1.6 million labor
force nationwide (NSO 2002 Census for Fisheries). Of the total labor force, 1.3 million are employed in the municipal fisheries, 226,195 in commercial fisheries, and 16,497 in aquaculture sector.
Performance of the fishing industry
In 2005, the total fisheries production reached 4.16 million metric tons.
The aquaculture sector provided the highest share of 38.5%, while commercial and municipal fisheries contributed 30.8% and 30.6%, respectively.
Fisheries production grew from 4.13 million metric tons in CY2001 to 3.13
million metric tons in CY 2005. Average annual production growth rate within the period was 3.648 million metric tons.
From 2001 – 2005, the contribution of aquaculture to total fish production increased steadily from 38.5% in 2001 to 45.5% for a five year average contribution of 41.6% to the total production. In comparison, commercial and municipal fisheries production have similar contributions of about 29% and 28%, respectively to the total fish production (Table2). Within the aquaculture sub-sector, production grew at an average of 11.6% per year between 2001 and 2005. The highest annual growth rate in fish production through aquaculture was recorded in 2005 with a 10.4% increase over the year 2004.
Fishcage62%
Fishpen38%
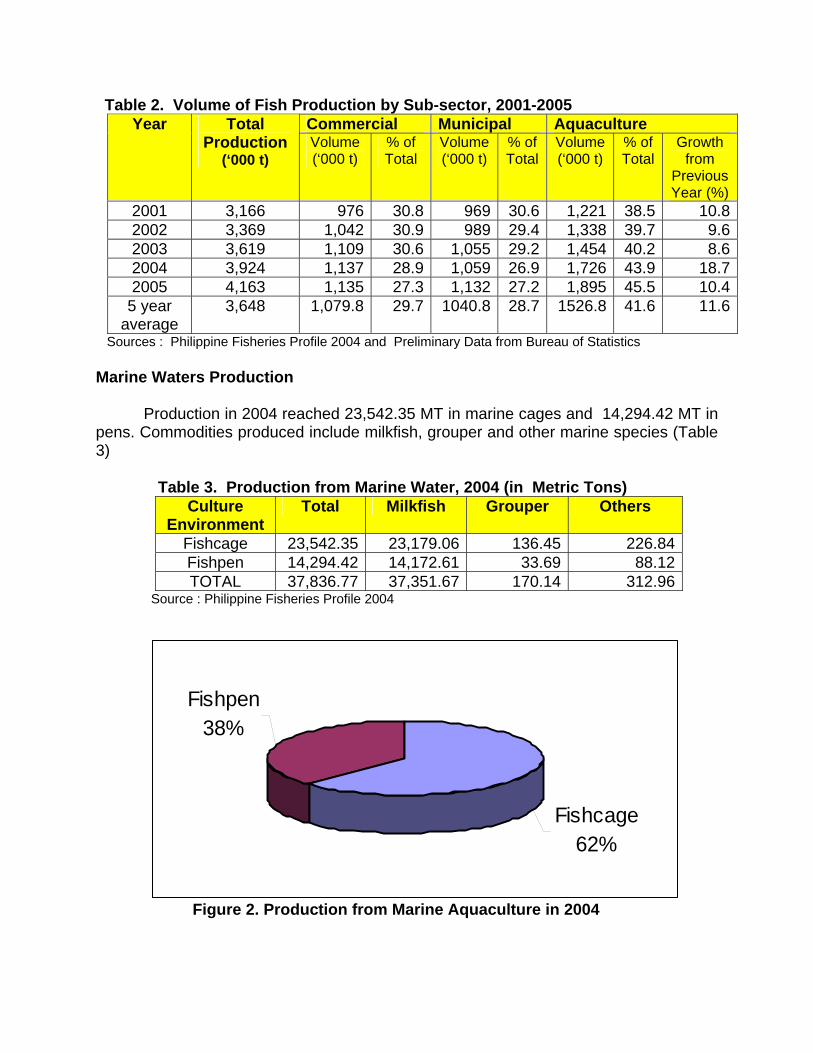
Table 2. Volume of Fish Production by Sub-sector, 2001-2005 Commercial Municipal Aquaculture Year Total
Production (‘000 t)
Volume (‘000 t)
% of Total
Volume (‘000 t)
% of Total
Volume (‘000 t)
% of Total
Growth from
Previous Year (%)
2001 3,166 976 30.8 969 30.6 1,221 38.5 10.82002 3,369 1,042 30.9 989 29.4 1,338 39.7 9.62003 3,619 1,109 30.6 1,055 29.2 1,454 40.2 8.62004 3,924 1,137 28.9 1,059 26.9 1,726 43.9 18.72005 4,163 1,135 27.3 1,132 27.2 1,895 45.5 10.4
5 year average
3,648 1,079.8 29.7 1040.8 28.7 1526.8 41.6 11.6
Sources : Philippine Fisheries Profile 2004 and Preliminary Data from Bureau of Statistics Marine Waters Production
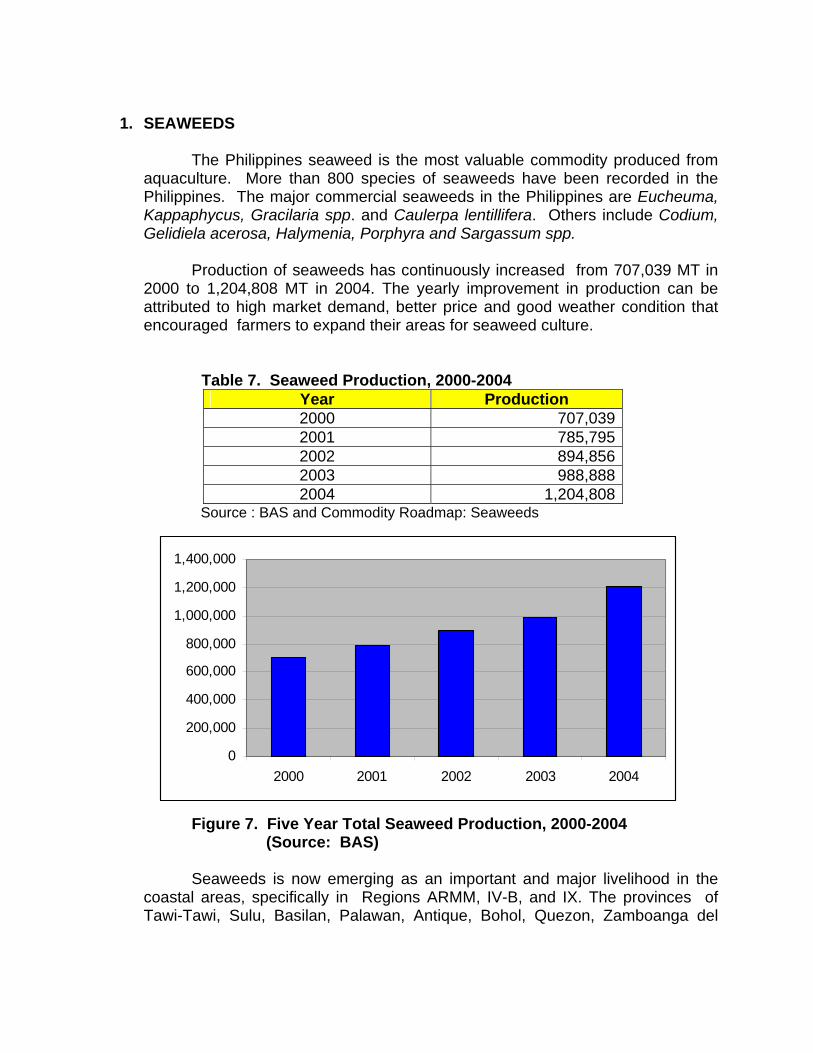
Production in 2004 reached 23,542.35 MT in marine cages and 14,294.42 MT in
pens. Commodities produced include milkfish, grouper and other marine species (Table 3) Table 3. Production from Marine Water, 2004 (in Metric Tons)
Culture Environment
Total Milkfish Grouper Others
Fishcage 23,542.35 23,179.06 136.45 226.84Fishpen 14,294.42 14,172.61 33.69 88.12TOTAL 37,836.77 37,351.67 170.14 312.96
Source : Philippine Fisheries Profile 2004
Figure 2. Production from Marine Aquaculture in 2004

Tilapia
Others
Tiger Prawn
W.Shrimp &Endeavor Prawn
M ilkf ish
Brackishwater Production
For the year 2004, production from brackishwater fishponds was 253,848.52 MT, bulk of which was the production of milkfish. Fishpen recorded a production of 4,499.50 MT, while fishcages at about 4,205.71 MT. Commodities from brackishwater production are milkfish, tiger prawn, white shrimp and endeavor prawn, tilapia and other species (Table 4). Table 4. Production from Brackishwater, 2004 (in Metric Tons)
Culture Environment
Total Milkfish Tiger Prawn
W.Shrimp &
Endeavor Prawn
Tilapia Others
Fishpond 253,848.52 200,530.90 35,916.52 2,029.60 9,045.93 6,325.57Fishcage 4,205.71 4,056.08 115.90 33.73Fishpen 4,499.50 4,388.30 97.30 13.90TOTAL 262,553.73 208,975.28 35,916.52 2,029.6 9,259.13 6,373.20
Source : Philippine Fisheries Profile, 2004
Figure 4. Production from Brackishwater, 2004 (in Metric Tons)

0
50,000
100,000
150,000
200,000
250,000
300,000
350,000
400,000
450,000
500,000
I II III IV-A IV-B V VI VII VIII IX X XI ARMM
Mariculture Production
Regional production from mariculture yields a total of 1,235,761.09 MT. Seaweeds contributed the largest share of 97.5%. The rest are contributed by oysters and mussels with percentage shares of 1.3% and 1.2%, respectively (Table 5). Regional production trend showed that ARMM remained to be the highest contributor of mariculture products, followed by Regions IV-B and IX, respectively (Figure 5). Table 5. Production from Mariculture, 2005 (in Metric Tons)
Region Total Oyster Mussels Seaweeds I 2,704.65 2,677.15 - 27.50II 325.50 319.00 - 6.50III 6,772.77 6,147.10 598.30 27.37
IV-A 30,008.44 343.44 4,227.00 25,438.00IV-B 329,140.43 - - 329,140.43
V 17,748.99 47.02 735.17 16,966.80VI 62,971.60 5,354.73 6,633.25 50,983.62VII 83,594.05 187.94 - 83,406.11VIII 16,213.00 2.00 2,840.00 13,371.00IX 155,102.67 312.21 4.50 154,785.96X 39,155.64 - - 39,155.64XI 1,670.36 524.72 - 1,145.64
ARMM 472,514.80 - - 472,514.80 Source : Philippine Fisheries Profile 2004 Figure 5. Total Production from Mariculture, 2005 (in Metric Tons)

Milkfish17%
Tilapia0%
Others6%
Seaw eeds77%
Commodities
The top three major aquaculture commodities are seaweeds, milkfish and tiapia. Seaweeds recorded the highest and constituted 70.2% of the total aquaculture production. Milkfish ranked second with a share of 15.9% followed by tilapia with 8.5%. The rest contributed 5.4%.
Table 6. Major Species produced in Aquaculture Fisheries, 2004 Species Quantity (Metric Tons) Percent (%)
Seaweeds 1,204,807.56 70.2
Milkfish 273,593.36 15.9
Tilapia 145,86.36 8.5
Others 92,757.38 5.4
Total 1,717,026.66 100
Source : Philippine Fisheries Profile 2004 Figure 6. Major Species produced in Aquaculture Fisheries
(in metric tons) 2004
0
200,000
400,000
600,000
800,000
1,000,000
1,200,000
1,400,000
2000 2001 2002 2003 2004
1. SEAWEEDS
The Philippines seaweed is the most valuable commodity produced from aquaculture. More than 800 species of seaweeds have been recorded in the Philippines. The major commercial seaweeds in the Philippines are Eucheuma, Kappaphycus, Gracilaria spp. and Caulerpa lentillifera. Others include Codium, Gelidiela acerosa, Halymenia, Porphyra and Sargassum spp.
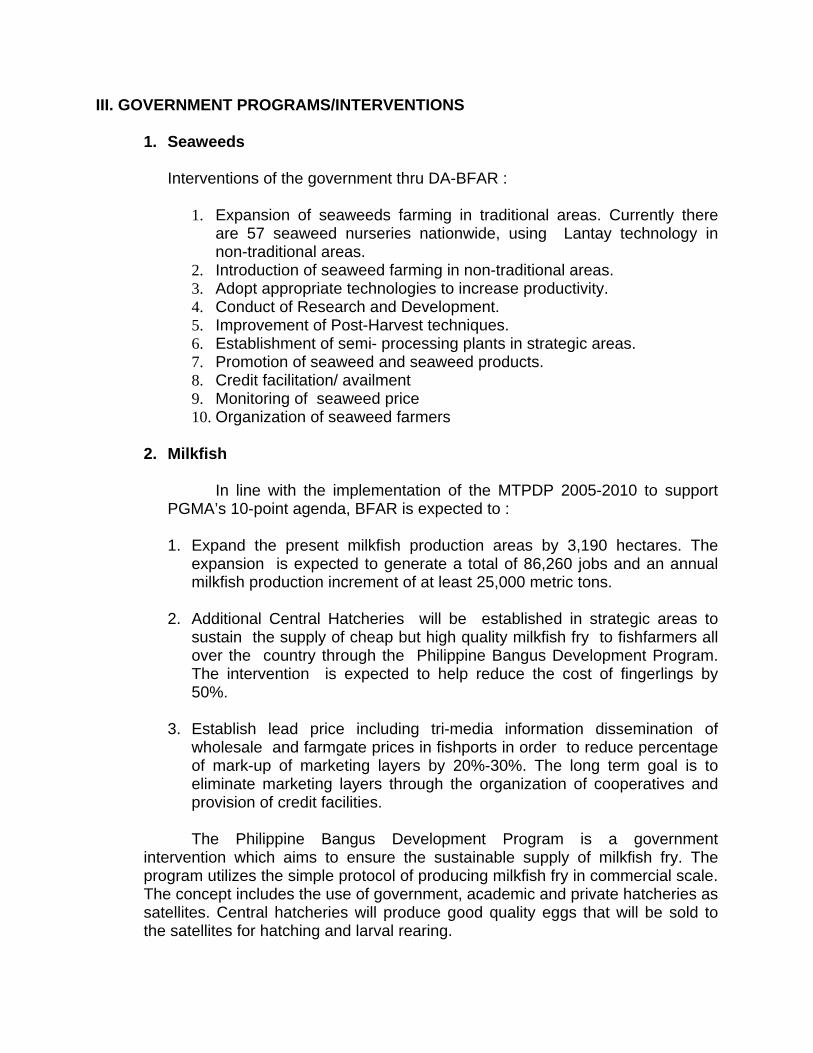
Production of seaweeds has continuously increased from 707,039 MT in 2000 to 1,204,808 MT in 2004. The yearly improvement in production can be attributed to high market demand, better price and good weather condition that encouraged farmers to expand their areas for seaweed culture. Table 7. Seaweed Production, 2000-2004
Year Production 2000 707,039 2001 785,795 2002 894,856 2003 988,888 2004 1,204,808
Source : BAS and Commodity Roadmap: Seaweeds Figure 7. Five Year Total Seaweed Production, 2000-2004
(Source: BAS)
Seaweeds is now emerging as an important and major livelihood in the coastal areas, specifically in Regions ARMM, IV-B, and IX. The provinces of Tawi-Tawi, Sulu, Basilan, Palawan, Antique, Bohol, Quezon, Zamboanga del

Norte, Camarines Sur, Eastern Samar, Surigao del Sur, Zamboanga Sibugay, Lanao del Norte and Maguindanao are potential areas for seaweed culture.
Seaweeds contributed 31% to the total 2004 fisheries production.
Kappaphycus alvarezii and Euchema denticulatum are the major species cultivated. The culture methods used by farmers are fixed bottom monoline and floating monoline.
The seaweed industry employs between 100,000–120,000. Of the total
individuals employed, 90% are seaweed farmers and the rest are seaweed processors and traders. Sixty-five percent (65%) of the total production are processed into semi-refined chips/carrageenan, 13% are exported raw (dried), and the remaining 22% are processed into refined carrageenan.
The Philippines is one among the top producers of seaweeds in the world, specifically the red seaweeds – next to China and Japan. In 2004, about 24.8 million MT valued at 1.2 billion pesos was exported to USA France, Korea, China and Hongkong.
Problems /Constraints/Gaps Local
• Pollution in production areas • Inadequate supply of dried seaweeds for processing leading to
processors’ losses • Peace and order situation in seaweed-producing areas • Diseases affecting seaweeds (ice-ice) • Inconsistency of the quality due to adulteration with foreign materials to
the processed product.
Global • Increasing competition in Eucheuma production with other countries such
as Malaysia, Indonesia and Africa.
2. MILKFISH
Milkfish is an important aquaculture commodity. For the past five years, production has steadily increased from 194,023 metric tons in 2000 to 269,930 metric tons in 2004 with an average annual growth rate of 8.7.
Harvests from the different culture environments were as follows:
Freshwater contributed 10% to the total milkfish production. Brackishwater recorded the highest share of 77.4% due improved technology such as increase in stocking density and expansion of operations. In addition, the marine fishcages and fishpens contributed 12.6%.

0
50,000
100,000
150,000
200,000
250,000
300,000
2000 2001 2002 2003 2004
Table 8. Milkfish production, 2000-2004 Year Production
2000 194,023
2001 225,337
2002 231,968
2003 246,504
2004 269,930
Source : Commodity Roadmap : Milkfish
Figure 8. Fivel Year Total Milkfish Production - 2000-2004 (Source BAS) Base on regional milkfish production and requirements in the year 2004,
regions I, III, IV-A & B, VI, IX, XI and XII recorded a surplus in milkfish production. and incurred deficit in regions II, NCR, V, VI, VII, VIII, X, ARMM and CARAGA. However, based on the national production, a surplus of more than 100,000 metric tons was determined (Table 9).

Table 9. 2004 Milkfish Production and Requirements at 1.98 kg per capita
consumption.
Region Population a Productionb (MT)
Consumption (MT)
Gap
CAR 1,529,425 I 4,422,483 48,634.3 8,756.5 39,878.1II 3,032,872 240.4 6,005.1 (5,764.7)III 8,297,012 58,794.0 16,428.1 42,365.9
NCR 11,070,287 3,160.0 21,919.2 (18,759.2)IV-A 10,940.575 32,665.9 21,662.3 11,003.6IV-B 1,612,601 3,582.7 3,192.9 389.8
V 5,079,867 1,669.9 10,058.1 (8,388.2)VI 6,778,143 63,991.7 13,420.7 50,571.0VII 5,970,149 7,582.0 11,820.9 (4,238.9)VIII 4,058,787 2,362.4 8,036.4 (5,674.0)IX 3,452,079 9,776.3 6,835.1 2,941.2X 3,013,186 5,907.4 5,966.1 (58.7)XI 5,771,878 12,446.9 11,428.3 1,018.6XII 2,910,459 13,311.7 5,762.7 7,549.0
ARMM 2,330,394 2,004.6 4,614.2 (2,609.6)CARAGA 2,393,402 3,799.7 4,738.9 (93902)TOTAL 82,663,599 269,930.2 163,673.9 109,284.5
Sources : a/ - NSCB b/ – BAS preliminary data (2004)
Commodity Roadmap : Bangus Problems :
• Degradation of quality fingerling stocks due to inbreeding. • Insufficient supply of quality bangus fry in far flung areas. • High cost of farm inputs and poor quality feeds. • Lack of manpower to effectively transfer technology to the municipal level. • Marketing layers which stand between producer and consumer; and • Lost opportunities to participate in global market for value-added products.
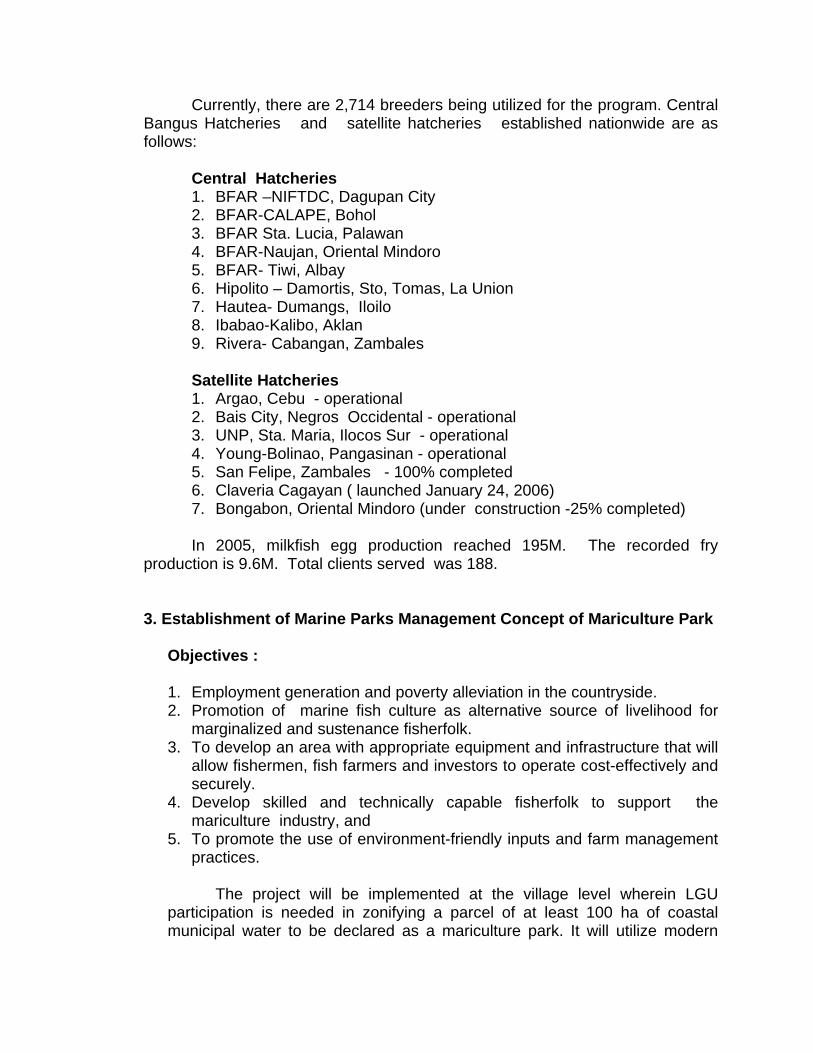
III. GOVERNMENT PROGRAMS/INTERVENTIONS
1. Seaweeds Interventions of the government thru DA-BFAR :
1. Expansion of seaweeds farming in traditional areas. Currently there
are 57 seaweed nurseries nationwide, using Lantay technology in non-traditional areas.
2. Introduction of seaweed farming in non-traditional areas. 3. Adopt appropriate technologies to increase productivity. 4. Conduct of Research and Development. 5. Improvement of Post-Harvest techniques. 6. Establishment of semi- processing plants in strategic areas. 7. Promotion of seaweed and seaweed products. 8. Credit facilitation/ availment 9. Monitoring of seaweed price 10. Organization of seaweed farmers
2. Milkfish
In line with the implementation of the MTPDP 2005-2010 to support
PGMA’s 10-point agenda, BFAR is expected to : 1. Expand the present milkfish production areas by 3,190 hectares. The
expansion is expected to generate a total of 86,260 jobs and an annual milkfish production increment of at least 25,000 metric tons.
2. Additional Central Hatcheries will be established in strategic areas to
sustain the supply of cheap but high quality milkfish fry to fishfarmers all over the country through the Philippine Bangus Development Program. The intervention is expected to help reduce the cost of fingerlings by 50%.
3. Establish lead price including tri-media information dissemination of
wholesale and farmgate prices in fishports in order to reduce percentage of mark-up of marketing layers by 20%-30%. The long term goal is to eliminate marketing layers through the organization of cooperatives and provision of credit facilities.
The Philippine Bangus Development Program is a government
intervention which aims to ensure the sustainable supply of milkfish fry. The program utilizes the simple protocol of producing milkfish fry in commercial scale. The concept includes the use of government, academic and private hatcheries as satellites. Central hatcheries will produce good quality eggs that will be sold to the satellites for hatching and larval rearing.
Currently, there are 2,714 breeders being utilized for the program. Central Bangus Hatcheries and satellite hatcheries established nationwide are as follows:
Central Hatcheries 1. BFAR –NIFTDC, Dagupan City 2. BFAR-CALAPE, Bohol 3. BFAR Sta. Lucia, Palawan 4. BFAR-Naujan, Oriental Mindoro 5. BFAR- Tiwi, Albay 6. Hipolito – Damortis, Sto, Tomas, La Union 7. Hautea- Dumangs, Iloilo 8. Ibabao-Kalibo, Aklan 9. Rivera- Cabangan, Zambales
Satellite Hatcheries 1. Argao, Cebu - operational 2. Bais City, Negros Occidental - operational 3. UNP, Sta. Maria, Ilocos Sur - operational 4. Young-Bolinao, Pangasinan - operational 5. San Felipe, Zambales - 100% completed 6. Claveria Cagayan ( launched January 24, 2006) 7. Bongabon, Oriental Mindoro (under construction -25% completed)
In 2005, milkfish egg production reached 195M. The recorded fry
production is 9.6M. Total clients served was 188.
3. Establishment of Marine Parks Management Concept of Mariculture Park Objectives : 1. Employment generation and poverty alleviation in the countryside. 2. Promotion of marine fish culture as alternative source of livelihood for
marginalized and sustenance fisherfolk. 3. To develop an area with appropriate equipment and infrastructure that will
allow fishermen, fish farmers and investors to operate cost-effectively and securely.
4. Develop skilled and technically capable fisherfolk to support the mariculture industry, and
5. To promote the use of environment-friendly inputs and farm management practices.
The project will be implemented at the village level wherein LGU
participation is needed in zonifying a parcel of at least 100 ha of coastal municipal water to be declared as a mariculture park. It will utilize modern

floating cages to tolerate up to 2-3 meters wave action and to last at least five (5) years with little maintenance. A component of the park is an Executive Management Council (EMC) that governs the establishment of a grid-type “community” storm mooring system and cluster of marine sea cages. Aside from providing the necessary security for the cages and during seasonal rough weather, a standardized mooring facility is expected to help prevent problems on uncontrolled growth and expansion, encroachment, entanglement of moorings and navigational hazards. Features :
• Multi-product onshore warehouse, cold storage and ice plants facility, service as well as ferry boats.
• Sufficient navigational lanes and communal mooring system. • Internal and external security. • Well-defined sites for investment category for small, medium and
large–scale investor. • Ready available mooring support services for small scale operators. • Availability of seeds and feeds supplier, cage fabricator and
manpower services. Benefits to the LGU per hectare 1. Mayor’s /Business Permits
P1,500/mooring space/year x 30 spaces/ha P45,000 2. Executive Management Council Rentals
P5,000/mooring space/year x 30 spaces/ha P150,000 3. Employment Benefits
Direct Indirect Caretaker (60) Security (2) Maintenance (5)
Cage fabricators (360) Mooring development (15) Fry producer (133) Transport and Handling (5,346)
4. Other Business/permits
- Value-adding (Bangus Deboning) - Cage suppliers - Feed suppliers - Fish Dealers - Warehouse - Ice plant and cold storage - Bangus hatchery operations - Bangus nursery operations

Legal Mandates 1. Republic Act No. 8550
i. Section 47: Code of Practice for Aquaculture (FAO 214) ii. Section 51: License to operate Fish Pen, Fish Cage, Fish Traps
and other Structures for Fish Culture and other Fishery Products iii. Section 53: Grant of Privileges for Operation for Fish Pens,
Cages, Corrals/Traps and similar structures iv. Section 54: Insurance for Fish Pond, Fish Cages and Fish Pens
(FAO 215) v. Section 55: Non-Obstruction to Navigation (FAO 216) vi. Section 56: Non-Obstruction to Defined Migratory Paths (FAO
217) vii. Section 57: Registration of Fish Hatcheries and Private
Fishponds etc. (FAO 218)
2. DA-DENR Joint Memorandum Order No. 01 (series of 2000) • Article III, Sec. 3. Code of Practice for Aquaculture • Article IV, Sec. 1.a.3-4-5. Zonation of existing or potential areas for
mariculture, sea farming or sea ranching operations; navigational lanes and passage in fishery areas; migration paths of migratory fishes
3. Municipal Fisheries Ordinance
• Municipal Resolution declaring, reserving or segregating an area for Mariculture Zone (in coordination and collaboration with DENR/FARMC)
• Stipulations of fees and rentals (Mayors Permit/Annual Lease)
C. Development Process • Site Selection and Prioritization • Pre-Assessment of Site Suitability • Public Hearing/Consultations • Municipal Resolution • Municipal Ordinance • Development Plan • RRA/EIA • Organization of EMC • Detailed Survey/ECC • Subdivision Plan • Installation Layout (Mooring/Cages) • Training/IEC • Lease/Permit Issuance • Operation and Management • Regular Monitoring (Physico-Chemical)

Figure 9. Organizational Structure and Functions
• DA as the Executing Agency • BFAR-SEAFDEC-LGU Signatories of the MOA • EMC-Executive Management Committee
Takes charge for the over-all administration of the Marine Park Project • BFAR-RD coordinates with the EMC on day-to-day operations • RD as Project Management Unit (MPMU) Project Manager • Project Management Unit (MPMU) implements the day-to-day
operations of the MP.
DA
SEAFDEC BFAR CO LGU
BFAR RD EMC
EMC Secretariat
MP PMU
Admin & FinanceServices
TechnicalServices
Maintenance Services
SecurityServices
L O C A T O R S

TECHNICAL SERVICES Table 10. Technical Assistance
Project Operations Unit Project Assistance/Information, Education Component Unit
1. Oversee the project staff assigned
at the project site 2. Implement all projects at the BFAR
R&D Area Develop/implement work plan
for every project Assign appropriate project staff,
including on-the-job trainees Implement project monitoring
and evaluation Implement researches
3. Render technical assistance to locators at different stages of project development, such as:
Project installation Grow-out/culture techniques Harvesting Post harvest activities
4. Render services as resource persons during dialogues/conferences, trainings and other related activities
5. Provide technical back staff to the EMC during project deliberation and conferences
1. Recommend guidelines for the Project
Operations 2. Prepare Management Plan and
program for the future development and long term sustainability of the Mariculture Park.
3. Production of Project Operation Manual
4. Develop brochures for the whole MP 5. Develop manuscript for R&D results 6. Develop new project proposals and
implement pilot models at the BFAR R&D Area
7. Provide assistance in the preparation of locators business plan outline
8. Provide assistance to locators documentation requirements (mayor’s permit/lease agreement)
9. Assist for other information needs of the locators
10. Act as resource persons during community dialogues, conferences, trainings and other related activities
11. Develop IEC materials
Management and Operation
• Hatchery and Nursery • Species Selection • Species Selection • Cage Maintenance • PCP-Environmental Impact Monitoring • Harvest and Post-Harvest

STATUS OF MARICULTURE PARKS Table 11. Status of Mariculture Parks SITE/LOCATION STATUS REMARKS Samal Island Mariculture Park
- Launched and established last August 11, 2001 in Davao. Now on its 3rd year of operation (4 locators, 4 cooperatives and cluster of fisherfolks 11 cages all engaged in semi-intensive polyculture system (bangus)
- Fully operational with BFAR Demo cages and 3 locators in full operation. BFAR techno-demo cages now contain 3,000 pcs. Pompano, 2,000 pcs snapper and 2,500 pcs, grouper fingerlings. Another 12m x 12m cage has been set for seeding.
- Reestablished 26 mooring lines in the mariculture park. - Constructed and deployed 32 units (2x2) square cages
owned by Coral Aqua Ventures stocked with high value species. For recreation purposes, they planned to combine their cages with floating cottages and restaurants for the public while promoting eco-tourism in the area. Maintained 57 compartments and re-stocked with various high value species like abalone, cobia, snapper and grouper.
- Most locators harvested and re-stocked their cages with fingerlings. Jorona Aquaventures opted for staggered harvesting to be processed in their own processing plant.
- Corona Aquatic Resources Trading was consistent with their fish processing activities and expansion program. Two units of 19m x18m cages were each stocked with 25,000 bangus fingerlings. Other newly constructed cages were stocked with bangus and pompano. Nine units of cages with stocks are now available while fabrication of additional cages is on-going to meet the 30-unit targets.
- Monteverde Aquaventures resumed its operation with one unit 10m x10m cage ready for re-installation. Seeding has been scheduled in July 2005.
- GE cattle Trading’s three units of 10m x 10m cages ready for seeding , while fabrication of additional units is on-going. The constructed floating house has been scheduled for installation.
- Individual fish cage operators and fisherfolk in the vicinity now maintain a substantial number of siganid fingerlings for the investors.
- LGU failed to provide parcel of land for warehouse and auxiliary service area. More locators are encouraged.

SITE/LOCATION STATUS REMARKS Masinloc-Palauig, Zambales
- MOU with DA-BFAR/LGUs and SEAFDEC signed January 2002. Municipal resolutions endorsed by respective Sangguniang Bayan, RRA/Profile completed. Boundaries and bouys established.
- Final copy of the Environmental Impact Statement (EIS) submitted to the EMB-DENR Central Office for review an Inventory of existing fish cage units was made on March 30 2004 together with the current water quality assessment on the proposed site . The ECC granted to BFAR was, however cancelled.
NIPAS exclusion request endorsed to DENR. Awaiting Municipal Ordinances from both municipalities and layout/development plan prepared by Region III.
Subic-Morong, Mabayo Cove
Public consultation with local officials conducted awaiting formal endorsement to SB of Morong, Site assessment conducted by Region III.
8 locators visited the site. LGU decided to operate and manage the site on their own administration
Silangun Bay, Zambales
Survey assessment jointly conducted by BFAR-NDCP team, MOA formally signed between AFP-NDCP and DA-BFAR last 13 February
Implementation/development plan prepared. Detailed RRA conducted jointly by BFAR-Philippine Navy and NDCP. Operation and management to be privately administered by a corporation.
Honda Bay, Palawan
Site to be identified by Reg. IV For implementation
Ragay Bay, Camarines Sur
Survey assessment jointly conducted by BFAR-LGU team. Profile and development plan prepared by the LGU.
For implementation
Sto. Tomas Cove, La Union
Launched and established last Oct. 17, 2002 in Sto. Tomas, La Union
Twenty seven investors were awarded with Mariculture Zone Economic Agreement.
Region 1
- Assessed 16 sites for proposed seaweed mariculture zones in the four provinces of Region 1.
- Established seven seaweed mariculture zones in Pasuquin and Badoc, Ilocos Norte; Cabugao, Santiago and San Esteban, Ilocos Sur; Dasol and Balaoan Pangasinan.
Tilik Cove, Lubang Island
Survey assessment jointly conducted by BFAR-LGU team last Oct. 20, 2003
Ordinance drafted by LGU. Limited sites suitable for Mariculture Project.
SEAFDEC-AQD Igang, Guimaras Sub-province
Mariculture Park Pilot-Demo and Training Project fully operational
JMANTTP Prototype Mariculture Park

SITE/LOCATION STATUS REMARKS Samar-Leyte - existing Mariparks established in Leyte as of 2004
- 2 new areas proposed in Biliran and Tacloban - 3 existing Mariparks established in Samar - 2 proposed new sites in Quinapondan and Marabut,
Samar
- 8 Mariculture Zone Established
- 42 Units of Cages installed
- Production of 2005:255 MT
- Average/Production/Unit 7.5-8 MT
Malajog,Calbayog Nothern Samar and Basey Eastern Samar
- Eleven BFAR demo cages (nine units square and two units circular) maintained at the mariculture parks located. Forty seven cages (32 square GI pipes, 4 units circular and 11 units square) installed by investors while regular technical assistance was provided by BFAR.)
MARICULTURE Park Region VIII Existing
• Malajog,Calbayog Nothern Samar (300 has.) • Basey Eastern Samar (400 has) • Merida, Leyte • Ormoc Bay, Northern Leyte (600 ha., Launched December 7, 2005) • Ormoc/ Merida Mariculture Zone (100 ha.) • Babatngon, Leyte ( 950 ha., Launched December 27, 2004) • Sta. Rita, Mariculture Park, Western Samar (500 ha.) • Liloan, Sagud Bay, Southern Leyte (75 ha., Launched July 30, 2004) • San Jose City , Northern Samar (3,150 ha., Launched June 30, 2004) • Lawaan, Eastern Samar (Launched August 4, 2004)
Proposed
• Biliran/Leyte, Leyte • Quinapondan Mariculture Zone, Eastern Samar • Marabut, • Tacloban, Leyte
Sea Cages
• Established 8 mariculture zones • No. of established cages : 142 units • Production as of 2004 : 255MT • Average production/unit: 7.5 – 8MT

Challenges and Opportunities
• Macro-Scale Benefits Food Security Employment Generation Long Term Sustainability
• Micro-Scale Benefits
Ancillary Services (seed stocks, ice-plant, cold storage, feed warehouses, ports, etc)
Post-Harvest facilities, road and transport access Lesser investment Cost Amenities (water supply, power supply, communications, Guard house,
working platforms) Full security Revenue Assurance to LGUs
• Other Opportunities
Tax incentives (ITH) Crop Insurance Choice of commercially important species Market assurance Fish Health Management services ISO/HACCP standards Programmatic Compliance to DENR (EIA/EIS/ECC) Other livelihood opportunities

Production Cost (Fry Culture Type)
Cage Culture Assumption Stocking rate = 50 m2 Survival rate = 80% FCR = 1.7 Size at harvest = 3.5 pc kg2 Wholesale price = P60.00 kg2 A. Construction cost: (10m x 10m) (20m x 10m) (20m x 20m) (50m x 20m) Area = 100 m2 200 m2 400 m2 1,000 m2 PE net P 7,200 P 13,050 P 18,000 P 32,000 PE rope 600 840 1,080 1,200 Kawayan 2,000 3,000 3,500 5,000 Labor cost 1,000 1,500 2,000 2,500 Miscelaneous 500 750 1,000 1,250 Total = P 11,300 P 19,140 P 25,580 P 41,950 B. Production and marketing costs: Fingerlings @ P3.00 P 15,000 P 30,000 P 60,000 P 150,000 Feed pellet @ P14.20 27,592 55,184 110,344 275,896 Harvesting cost (2% GS) 1,372 2,743 5,485 13,715 Marketing cost (5% GS) 3,429 6,859 13,713 34,287 Miscellaneous (5%) 2,370 4,739 9,477 23,695 Depreciation cost 2,825 4,785 6,395 10,488 P 52,588 P 104,310 P 205,414 P 508,081 C. Calculation of benefits: Production output 1,143 kg 2,286 kg 4,571 kg 11,429 kg Gross sale (GS) P 68,580 P 137,160 P 274,260 P 685,740 Net profit P 15,992 P 32,850 P 68,846 P 177,659 P 46.00 P 45.63 P 44.94 P 44.46
Break-even price to pay total cost
876 kg 1,739 kg 3,424 kg 8,468 kg
Break-even production to cover total cost
RR - 30.40%- 31.50%- 33.50%- 34.97%

Issues on Environmental Degradation
Over the last few years, the rapid development of marine fish cage and fishpen culture in certain areas of the Philippines have lead to unsustainable production. In 2002 for example, fishkills occurred in milkfish culture areas in Pangasinan and tilapia areas in Taal Lake. Possible reasons for these fishkills are : euthrophication, over production , overstocking of cages and pens, toxic algae tide or algal bloom, poor production management and reduction of water refreshment due to poor zoning and regulation.
In 2005, a study on Environmental Monitoring and Modelling of Aquaculture Areas was conducted. The primary objective was to undertake an environmental survey of the risk areas and adapt a mathematical model based on MOMS developed by Norway for the prediction of impact of the fish cages on the recipient water. The study was implemented in collaboration with AKVAPLAN NIVA and NORAD (Norwegian Agency for Cooperation and Development).
The survey was conducted in Bolinao marine waters, Dagupan City River
system and Taal Lake during summer, rainy an cold seasons. The following activities were done:
• Detailed survey of production in the area (including physical area, production, statistics, etc)
• Analysis of the bathymetry • Profiling of temperature, salinity, and oxygen levels through the water • Sediment analysis • Survey of current speed and direction • Recording of tidal range observation • Monitoring of wind direction, frequency and speed.
Initial results of the survey in Bolinao showed that there are 460 fish cages, 266
fishpens and 254 mussel farms. Soil samples taken by grabs are grey to black in color and has H2S smell.
Results of the survey in Dagupan showed that there are 124 fishcages, 553
fishpens, 528 fish traps, and 94 oyster farms. Soil samples taken by grabs has no smell, has grayish silty sediment. Oysters were found to abound in the river.
Initial Findings:
• Food conversion rate was varied and relatively poor (1.5 to 3:1) • Impact was relatively high in areas where there are large numbers of
fishcages • Impact was relatively low in areas where there is a mix of fish and
mollusc culture (fed species and extractive species) • Carrying capacity was not related to numbers of structures but on fish
production

• Carrying capacity varied through the year depending on other factors (dynamic)
Initial Recommendations:
• Come up with constructive and implementable recommendations that allow efficient production and minimize impact. Example is the use of feeding trays. In this way a farmer has better food conversion rate (more fish per kilo of feed) and there is less impact on the environment (reduction of nutrients and organic material released to the environment.
“ONE SERIOUS LIMITATION OF MARICULTURE IS THAT THE FEED REQUIRES FISH PROTEIN AS A MAJOR COMPONENT. THUS IT REQUIRES THREE KILOGRAMS OF FISH TO PRODUCE ONE KILOGRAM OF SALMON UNDER MARICULTURE CONDITION”
DENR Requirements (EIA/EIS/ECC) Illegal fishing activities (Dynamite and Cyanide fishing) Inputs = Outputs (Options for Project Sustainability)
“FOR ONE TON OF FISH PRODUCED, EXPECT ONE TON BY-PRODUCT OF WASTE MATERIALS”

CONCLUSIONS With the increasing population, the government has to choose between food security/sustainability vs. environmental protection/conservation. The government has to decide which areas to regulate for mariculture and which areas to allow open access to fishfarming. Another issue to consider is zonation vs. degradation. Mariculture areas should be identified but properly regulated to prevent degradation of the rivers and seas.
Government policies /regulations has to be put in place to prevent environmental degradation thereby sustaining production. Research and development should focus in determining the carrying capacity of water. The Local Government Units should ensure that their fishery ordinances are strictly enforced giving emphasis the interest of the less fortunate fishfarmers. REFERENCES :
1. Philippine Fisheries Profile, 2004. BFAR 2. Milkfish Commodity Roadmap. BFAR 3. Commodity Roadmap : Seaweeds. BFAR 4. Status and Challenges in the Establishment of Mariculture Parks by Dr. Nelson
A. Lopez. BFAR 5. Preliminary Data on the Volume of Production by Sub-sector and Region. BAS 6. Report on the Philippine Bangus Development Program. BFAR-NIFTDC 7. The Mariculture Zone in Region 8 (Brochure). BFAR-Region 8. Tacloban City 8. What is Mariculture Park? . DA-BFAR 9. Proposal to Undertake Environmental Monitoring and Modelling of Aquaculture in
the Philippines. BFAR-NIFTDC. 10. Environmental Monitoring and Modelling of Aquaculture in the Risk Areas of the
Philippines (EMMA): Preliminary Report. October 2006