Indirect-Cost Management Guide - Defense Acquisition University

RTO-MP-096AC/323(SAS-036)TP/27
NORTH ATLANTIC TREATY ORGANISATION
RESEARCH AND TECHNOLOGY ORGANISATION
BP 25, 7 RUE ANCELLE, F-92201 NEUILLY-SUR-SEINE CEDEX, FRANCE
RTO MEETING PROCEEDINGS 96
Cost Structure and Life Cycle Cost (LCC)for Military Systems(Structures de couts et couts globaux de possession (LCC)pour systemes militaires)
Papers presented at the RTO Studies, Analysis and Simulation Panel (SAS) Symposiumheld in Paris, France, 24-25 October 2001.
Published June 2003
Distribution and Availability on Back Cover
RT
O-M
P-0
96

This page has been deliberately left blank
Page intentionnellement blanche

RTO-MP-096AC/323(SAS-036)TP/27
NORTH ATLANTIC TREATY ORGANISATION
RESEARCH AND TECHNOLOGY ORGANISATION
BP 25, 7 RUE ANCELLE, F-92201 NEUILLY-SUR-SEINE CEDEX, FRANCE
RTO MEETING PROCEEDINGS 96
Cost Structure and Life Cycle Cost (LCC) forMilitary Systems(Structures de couts et couts globaux de possession (LCC) pour systemesmilitaires)
Papers presented at the RTO Studies, Analysis and Simulation Panel (SAS) Symposiumheld in Paris, France, 24-25 October 2001.
The Research and TechnologyOrganisation (RTO) of NATO
RTO is the single focus in NATO for Defence Research and Technology activities. Its mission is to conduct and promotecooperative research and information exchange. The objective is to support the development and effective use of nationaldefence research and technology and to meet the military needs of the Alliance, to maintain a technological lead, and toprovide advice to NATO and national decision makers. The RTO performs its mission with the support of an extensivenetwork of national experts. It also ensures effective coordination with other NATO bodies involved in R&T activities.
RTO reports both to the Military Committee of NATO and to the Conference of National Armament Directors. It comprises aResearch and Technology Board (RTB) as the highest level of national representation and the Research and TechnologyAgency (RTA), a dedicated staff with its headquarters in Neuilly, near Paris, France. In order to facilitate contacts with themilitary users and other NATO activities, a small part of the RTA staff is located in NATO Headquarters in Brussels. TheBrussels staff also coordinates RTO’s cooperation with nations in Middle and Eastern Europe, to which RTO attachesparticular importance especially as working together in the field of research is one of the more promising areas of initialcooperation.
The total spectrum of R&T activities is covered by the following 7 bodies:
• AVT Applied Vehicle Technology Panel
• HFM Human Factors and Medicine Panel
• IST Information Systems Technology Panel
• NMSG NATO Modelling and Simulation Group
• SAS Studies, Analysis and Simulation Panel
• SCI Systems Concepts and Integration Panel
• SET Sensors and Electronics Technology Panel
These bodies are made up of national representatives as well as generally recognised ‘world class’ scientists. They alsoprovide a communication link to military users and other NATO bodies. RTO’s scientific and technological work is carriedout by Technical Teams, created for specific activities and with a specific duration. Such Technical Teams can organiseworkshops, symposia, field trials, lecture series and training courses. An important function of these Technical Teams is toensure the continuity of the expert networks.
RTO builds upon earlier cooperation in defence research and technology as set-up under the Advisory Group for AerospaceResearch and Development (AGARD) and the Defence Research Group (DRG). AGARD and the DRG share common rootsin that they were both established at the initiative of Dr Theodore von Karman, a leading aerospace scientist, who early onrecognised the importance of scientific support for the Allied Armed Forces. RTO is capitalising on these common roots inorder to provide the Alliance and the NATO nations with a strong scientific and technological basis that will guarantee asolid base for the future.
The content of this publication has been reproduceddirectly from material supplied by RTO or the authors.
Published June 2003
Copyright RTO/NATO 2003All Rights Reserved
ISBN 92-837-0034-1
Printed by St. Joseph Print Group Inc.(A St. Joseph Corporation Company)
1165 Kenaston Street, Ottawa, Ontario, Canada K1G 6S1
ii
Cost Structure and Life Cycle Cost (LCC)for Military Systems(RTO MP-096 / SAS-036)
Executive Summary
Costs have long since become a major issue in military systems analysis. Attention is not limited to theacquisition costs alone, but encompasses all costs involved in the use and disposal of systems.Concepts such as Life Cycle Cost (LCC), Whole Life Cost (WLC), Cost of Ownership (COO) or TotalOwnership Cost (TOC) are more and more frequent in any document dealing with system analysis.Most nations have developed and use their own definitions, methods and tools, which may causeproblems when it comes to working together at multinational level. This is why a study has beenundertaken under the auspices of NATO to harmonise the most important aspects of LCC. The studycarried out by the technical team SAS-028 covered three concurrent areas: the cost breakdownstructure that defines and organises all cost elements to be considered, the boundaries of those costelements defined by LCC, TOC, COO and WLC and the uses of those concepts (economic or financialanalysis, optimisation, etc.) by decision makers.
The symposium focused on these and other objectives for the introduction of Life Cycle Management(LCM) and the need for an action plan for the near, medium and long term to be carried out under theguidance of a higher NATO authority. The need for accurate objective based Cost estimation wasclearly identified as a requirement to meet the future estimation and forecasting challenges, and theutilisation of both commercial and non-commercial practices and the consideration of total life costingwas considered essential if the life cycle process was to be shortened. Clear differences were identifiedbetween these two (commercial, defence) paradigms and various successful costing models werepresented. These models, whether developed independently or jointly, may differ in structure butclearly show similarities in some of the identified cost drivers. Further, they clearly demonstrate thatthere is a great deal of expertise and experience being gained throughout the NATO community, andtheir presentation at a single forum give nations the opportunity to present their own practices andexperiences, thus fostering exchange of information among the NATO and partner communities, and tostrengthen LCC studies in multinational projects.
iii

Structures de couts et couts globaux depossession (LCC) pour systemes militaires
(RTO MP-096 / SAS-036)
Synthese
Les couts sont depuis longtemps l’un des principaux enjeux de l’analyse des systemes militaires. Laquestion n’est pas limitee aux seuls couts d’acquisition mais englobe l’ensemble des couts associes al’exploitation et a la mise au rebut des systemes. Des concepts tels que le cout du cycle de vie (LCC),le cout sur toute la duree de vie (WLC), le cout de possession (COO) et le cout global de possession(TOC) sont cites de plus en plus frequemment dans les documents traitant de l’analyse des systemes.La plupart des pays ont developpe leurs propres definitions, methodes et outils, ce qui risque de poserdes problemes lorsqu’il s’agira de travailler en commun au niveau international. Une etude a donc etelancee, sous l’egide de l’OTAN, afin d’harmoniser les aspects les plus importants du LCC. L’etuderealisee par l’equipe technique SAS-028 a porte sur trois domaines concurrents, a savoir : La structurede ventilation de couts qui definit et constitue le cadre de l’ensemble des elements de cout a prendre enconsideration, les limites de ces elements de cout telles que definies par LCC, TOC, COO et WLC,ainsi que la mise en œuvre de ces concepts (analyses economiques et financieres, optimisation, etc..)par les decideurs.
Le symposium a privilegie ces questions, ainsi que la mise en application de la gestion du cycle de vie(LCM) et la necessite de prevoir un plan d’action a court, a moyen et a long terme, a executer sous ladirection des autorites superieures de l’OTAN. Les participants ont clairement identifie le besoin dedisposer d’une methode d’estimation de couts basee sur les objectifs, afin de pouvoir relever les futursdefis dans les domaines de l’estimation et la prevision De meme, il a ete considere primordiald’adopter des pratiques commerciales et non commerciales et de prendre en compte les couts du cyclede vie global pour ecourter le processus du cycle de vie. Des differences notables entre ces deuxparadigmes (commercial, defense), ont ete identifiees et differents modeles d’evaluation de coutsreussis ont ete presentes. Ces modeles, developpes soit independamment, soit conjointement, memes’ils sont structures differemment, montrent des similitudes marquees du point de vue de certainsgenerateurs de couts bien definis. En outre, ils fournissent la preuve de l’ampleur de l’experience et descompetences qui sont en train d’etre acquises par les pays de l’OTAN. Leur presentation dans un forumunique donne aux pays membres l’occasion de presenter leurs propres pratiques et experiences,favorisant ainsi un echange d’informations entre les pays de l’OTAN et ceux du Partenariat pour laPaix. De tels echanges serviront a confirmer l’interet des etudes LCC dans le contexte de projetsmultinationaux.
iv
Contents
Page
Executive Summary iii
Synthese iv
Theme/Theme vii
Reference
Generic Cost Breakdown Structure 1by G. Seguin
Life Cycle Cost, Total Ownership Cost and Whole Life Cost 2by M.C. Smit
The Use of Life Cycle Cost and Nature of Decisions 3by A. Ozkil
Life Cycle Management in NATO 4by E. Fajardo, R. Herreman, G. Glenister, S. Di Cicco and C. Bouman
Life Cycle Costing in a Commercial Style Accounting Regime as it Impacts U.K. MoD 5by J. Burridge
Cost Estimating and Forecasting in the New Era of Smart Procurement 6by B.J. Hilton
Innovations and Improvements in Cost Information Management 7by D.M. Robinson
Visibility and Management of Operating and Support Costs (VAMOSC) Management 8Information System
by L.P. Cheshire
OSCAM – Simulating Operation and Support Costs Using System Dynamics 9by J. Burridge and J. Coyle
Life Cycle Cost Simulation in Defence Planning 10by J. Komarek
L’elaboration de modeles specifiques a la DGA 11(Specific model development for the French procurement)
by A. Capy and C. Pereira
A Software Support Cost Model for Military Systems 12by J. Gibbs
Life Cycle Cost Procurement Techniques 13by A. Ozkil
Experience navale francaise nationale et en cooperation concernant le LCC et le Cost 14Structuring(Naval Experience Concerning LCC & Cost Structuring)
by P. Garnier
v
LCC Analysis for the Replacement of the Dutch F-16 15by R.C.T. de Haas, M.C. Smit and K.I.M. de Zeeuw
Application de modeles de couts a un systeme de transmission 16(Cost Models applied to a transmission system)
by M.-P. Pez, E. Arbaretier and S. Pierron
Monolith Composite Structures – Trend for Creation Low Life Cycle Cost Airframes 17by N.W. Pkhaladze and G.O. Rusiashvili
The NATO Research & Technology Organization (RTO) – Overview 18by C. Mounier
Strategic Cost Model to Support High Level Operational Analysis 19by D. Barradale
Realistic Cost Estimates for Acquisition Programs: CAIG Perspectives 20by R. Burke
Overview of the Symposium Topics 21by G. Seguin
Discours de cloture 22(Closing remarks)
by B. Besson
vi

Theme
Costs have long since become a major issue in military systems analysis. Attention is not limited to theacquisition costs alone, but encompasses all costs involved in the use and disposal of systems. Conceptssuch as Life Cycle Cost (LCC), Whole Life Cost (WLC), Cost of Ownership (COO) or Total OwnershipCost (TOC) are more and more frequent in any document dealing with system analysis.
Most nations have developed and use their own definitions, rnethods and tools, which may cause problernswhen it cornes to working together at multinational level. This is why a study has been undertaken underthe auspices of NATO to harmonise the most important aspects of LCC.
The study carried out by the technical team SAS-028 covered three concurrent areas: the cost breakdownstructure that defines and organises all cost elements to be considered, the boundaries of those cost elementsdefined by LCC, TOC, COO and WLC and the uses of those concepts (economic or financial analysis,optimisation, etc.) by decision rnakers.
The first objective of the Symposium is to present the findings of SAS-028 to NATO and Partnership forPeace (PfP) nations. The second objective is to give nations the opportunity to present their own practicesand experiences, thus fostering exchange of information among countries, and to strengthen LCC studies inmultinational projects.
Theme
La question des couts est devenue, depuis longtemps, l’un des elements majeurs dans l’analyse dessystemes militaires. L’attention ne se porte pas seulement sur les couts d’acquisition, mais aussi surl’ensemble des couts associes a l’utilisation et a l’elimination des systemes. On voit de plus en plus souventapparaıtre, dans tous les documents en anglais traitant de l’analyse des systemes, des concepts tels que leLife Cycle Cost (LCC), le Whole Life Cost (WLC), le Cost of Ownership (COO) ou le Total OwnershipCost (TOC), auxquels correspondent a peu pres, en francais, les concepts de cout global de possession(CGP), de calcul des couts sur l’ensemble de la duree de vie ou de cout du cycle de vie.
La plupart des pays ont elabore et utilisent leurs propres definitions, methodes et outils, ce qui peutentraıner des problemes lorsqu’il s’agit de mener des travaux en commun au niveau international. C’estpourquoi une etude a ete entreprise, sous l’egide de l’OTAN, en vue d’harmoniser les aspects essentiels duCGP.
L’etude, realisee par l’equipe technique SAS-028, couvrait trois domaines paralleles : structure deventilation des couts, definissant et organisant tous les elements de cout a prendre en compte; limites de ceselements de cout definies par les concepts de LCC, WLC, COO et TOC; et utilisations de ces concepts(analyse economique ou financiere, optimisation, etc.) par les decideurs.
L’objectif principal du Symposium sera de presenter les conclusions du SAS-028 aux pays membres del’OTAN et aux pays membres du Partenariat pour la paix (PPP). Le second objectif sera a la fois de donneraux pays l’occasion de presenter leurs propres pratiques et leur experience, favorisant ainsi les echangesd’informations entre eux, et de developper les etudes sur le CGP dans les projets multinationaux.
vii

This page has been deliberately left blank
Page intentionnellement blanche
1-1
Generic Cost Breakdown Structure
Gérard SeguinDGA/DPM/MCO/EL26, Boulevard Victor
00460 ArméesFrance
In the interests of readability and understandability, it is RTO policy topublish PowerPoint presentations only when accompanied by supportingtext. There are instances however, when the provision of such supportingtext is not possible hence at the time of publishing, no accompanying text
was available for the following PowerPoint presentation.
Paper presented at the RTO SAS Symposium on “Cost Structure and Life Cycle Cost (LCC) for Military Systems”, held in Paris, France, 24-25 October 2001, and published in RTO-MP-096.

This page has been deliberately left blank
Page intentionnellement blanche

2-1
Life Cycle Cost, Total Ownership Cost andWhole Life Cost
M.C. SmitTNO-FEL
P.O. Box 968642509 JG The Hague
The Netherlands
In the interests of readability and understandability, it is RTO policy topublish PowerPoint presentations only when accompanied by supportingtext. There are instances however, when the provision of such supportingtext is not possible hence at the time of publishing, no accompanying text
was available for the following PowerPoint presentation.
XXXXXXXXXXXXXXXXXXXXXXXXXXXXXXXXXXXXXXXXXXXXXXXXXXXXXXXXXXXXXXXXXX
Paper presented at the RTO SAS Symposium on “Cost Structure and Life Cycle Cost (LCC) for Military Systems”, held in Paris, France, 24-25 October 2001, and published in RTO-MP-096.

This page has been deliberately left blank
Page intentionnellement blanche
3-1
The Use of Life Cycle Cost and Nature of Decisions
Maj. Altan Özkil (MS in OR)Turkish General Staff HeadquartersScientific Decision Support Center
General Analysis Team Leader06100 Bakanlıklar, Ankara, Turkey
Introduction
The use of life cycle cost must, whatever the phase of a programme, inform the
process by which managers can bid for future expenditure, manage existing budgets
and make the best decisions on options presented to them. Most of the major costs
determining decisions are made during the initial phases of the Defense Program
Management. In this early decision period, the type of system technology procured, the
basic design, the support system and the maintenance concept are determined.
Decisions made in the early phases of any particular defense program freeze up to
eighty percent of the potential life cycle cost of the aforementioned defense program.
For this reason, it is essential that detailed and accurate assessments of anticipated
costs must be made as early as possible.
The general use of life cycle cost
There are two main purposes for using life cycle cost as a decision support tool
for the program managers, analysts, project and team leaders etc. One of the main
purposes is to use life cycle cost in economic appraisal and the other purpose is
financial appraisal.
� Economic Appraisals are generally undertaken by organizations and Government
bodies with an eye to the ‘well being’ of that organization or country as a whole.
As such they address opportunity costs (alternative use of assets or resources)
but usually not simple transfer payments such as national taxes that ‘move
around’ the economy. Economic analysis may be simply summarized as
Paper presented at the RTO SAS Symposium on “Cost Structure and Life Cycle Cost (LCC) for Military Systems”, held in Paris, France, 24-25 October 2001, and published in RTO-MP-096.
3-2
addressing the costs and benefits of options to the national coffers and is not,
necessarily, therefore concerned about precisely which part of the Department’s
budget is impacted. Any common costs not impacting the decision may be
excluded to simplify, and hence reduce the costs of, the exercise.
� Financial Appraisals however include all cash flows and transfer payments and
hence assess affordability. In financial appraisal, costs need to be split by budget
holder, so they know their contribution, by phase to understand the significance
over the life cycle and by major ‘input’ cost category (manpower, stocks
purchased, in year expenses etc).
These two types of appraisal, although different, are not exclusive. They can
make LCC a management and engineering tool with which to forecast and optimize the
costs of a system. Whatever the type of use, the predictive use of LCC represents its
principal interest.
LCC must be used as a benchmark against which options can be measured for
‘value for money’ during the acquisition process, bearing in mind that the greatest
opportunities to reduce LCC usually occur during the early phases of the programme. It
follows LCC is used as a decision and optimization criterion in the search of the best
compromise between time, cost and performance.
The general phases in the use of LCC
Early in the project life cycle, studies need to address the capability gap, the
numbers of equipment or platforms required and the technologies that can help to fill the
gap at lowest cost. This requires a ‘strategic’ approach that can provide a capability to
look at the ‘big picture’. At this phase in the life cycle it is unlikely that the costs can be
identified in a great deal of detail, rather an understanding of the ‘big hand-falls’ in terms
of primary CBS elements and the uncertainty surrounding these figures is required.
3-3
Once a project team has been formed and given a user requirement, the focus
turns to the performance, cost and time envelope of various options that will meet the
requirement. Forecasts of costs for new equipment and platforms are needed. This
requires an approach and tools/models that have a holistic view and can provide a ‘what
if’ capability. The CBS can be developed and extended to reflect the acquired
knowledge of the expected system characteristics.
When the preferred generic option (e.g. develop a new vehicle) is identified,
industry is generally asked to compete for its supply. Assessments of these bids are
based on life cycle cost analysis and need to address economic and financial
treatments. Cost figures need to compliant with rules set by Governments on investment
appraisal set out by central Government (usually the country’s Treasury department)
and at the same time provide the data by which budgets can be agreed for the long-term
operation and support of the assets. At this stage the CBS should be fully developed
such that all cost elements are identified.
For in-service equipment a forecast of the costs for the remaining life are
required. Whilst any in-service equipment, not nearing the end of its service life is
generally considered to be in the middle of the ‘bathtub’ in respect of reliability, major
cost drivers are driven by ‘change milestones’ caused by events such as overhaul,
deployment, updates and safety reviews. Towards the end of equipment life, ageing
effects may increase support costs or reduce availability. Not all equipment goes out of
service on a particular date so phasing out expenditure depends on the introduction
profile of new equipment or capability. Delays to new equipment can result in extra funds
being required to continue support of legacy equipment. These costs need to be
addressed and budget adjustments calculated.
In summary, it is not possible or desirable to collect and analyze information at
the same level of detail throughout the life cycle although there should be a common
thread in terms of programme phases, main CBS groupings and resource consumption.
3-4
Economic Appraisal
Economic appraisals lead to selection of a preferred alternative for a project. After
completing the cost and benefit estimates for each alternative, the individual responsible
for a program or project will establish priorities and identify his or her own preferred
alternatives by making comparisons of the costs and benefits of the feasible alternatives
with respect to the status. The results of the comparison and a recommendation will be
presented to the decision makers.
As a rule, the preferred alternative will be the alternative that provides the
greatest amount of benefits in relation to its cost. In situations where it is difficult to
quantify benefits and measures of effectiveness, it is important to provide as much
useful information as possible so that a decision can be made as to which alternative
yields the most benefits. These usually take the form of a cost benefit analysis or cost
effectiveness analysis.
A cost benefit analysis is an exercise in which all of the costs and benefits of an
activity are quantified and valued in monetary terms. It is therefore possible to evaluate
and compare options and see if the benefits exceed the costs i.e. ‘send to save’.
Benefits, such as reduced loss of life, may be set against expenditure although there
may be religious and political objections to this approach.
A cost effectiveness analysis compares the costs to be expended (often
discounted in later years to reflect the national time preference when spending money
obtained through taxation) with the effectiveness of alternate ways of meeting an
objective. By combining the analysis a measure of cost effectiveness can be obtained
that can be used to decide between options.
In both cases it is possible to address just the marginal cost change from the
‘status quo’ if the other fixed costs apply equally to all options. It is important not to
assume cost savings that cannot be realistically achieved. Where alternatives have
differing economic lives, the analyst must determine whether the longest or shortest life

3-5
or some other time period is to be used as a basis for comparison, and make an
adjustment for unequal life.
There are a variety of quantitative methods and techniques available for
comparison purposes when performing an economic appraisal. These methods and
techniques provide a more definitive basis in the ranking of alternatives. Quantitative
analysis of costs and benefits and the resultant ranking of alternatives can be performed
by discounted and undiscounted methods and techniques. Some of these methods and
techniques are as follows: Benefit cost ratio analysis, the break-even analysis, the
savings investment ratio analysis, the savings investment ratio analysis, net present
value, rate of return.
Financial Appraisal
The control of costs requires knowledge of current and, probable, future
expenditure against assets and services. Because financial appraisal deals with budgets
it is important that it is comprehensive in its coverage. Any cost breakdown structure
must capture all costs.
Each nation will have their own financial control systems and these will demand
different cost elements. Any CBS must therefore be as consistent as possible with each
national system.
In financial appraisal it is not appropriate to employ discounting but it is important
to consider all of the resources consumed in meeting an objective and any taxes that fall
to a Department’s budget. These will vary by country and need to be identified
separately.
Two approaches are generally employed. Financial accounting deals with day-to-
day budget control and is concerned with detailed costs. It may be less concerned with
equipment costing and does not usually provide data that can be easily related to
equipment’s CBS. Management accounting takes the same basic data but permits day-
3-6
to-day project control and decision support. This is where an equipment CBS is most
appropriate.
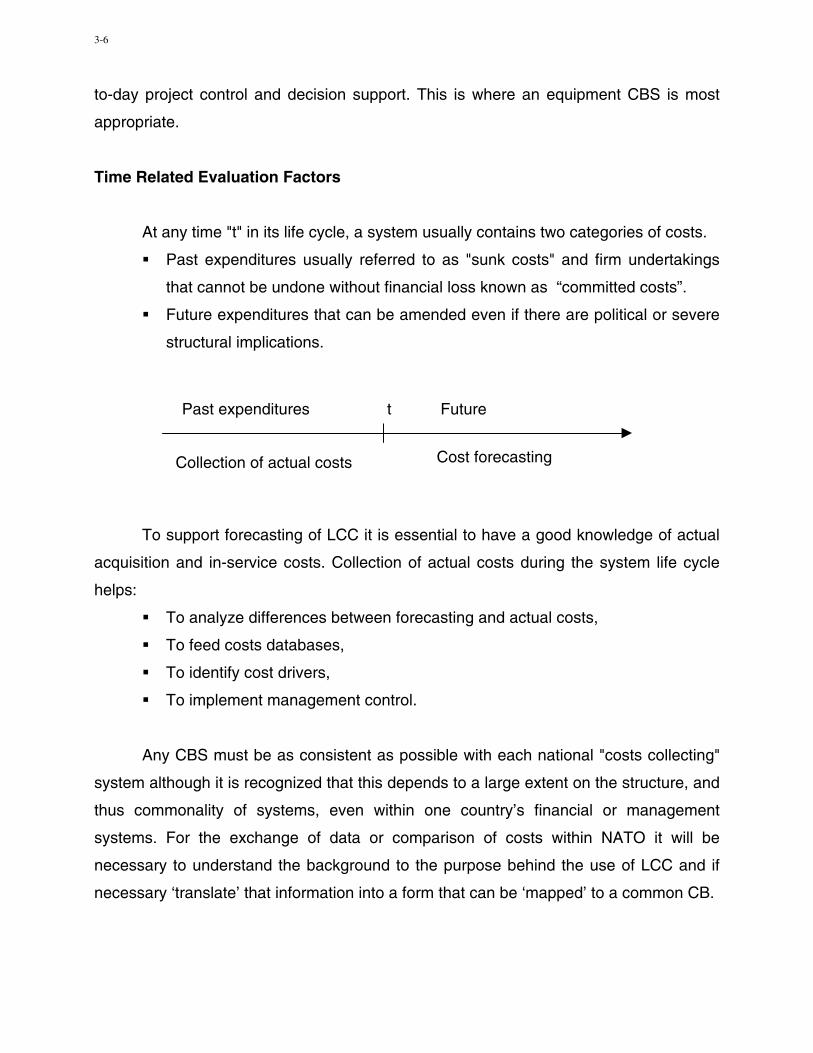
Time Related Evaluation Factors
At any time "t" in its life cycle, a system usually contains two categories of costs.
� Past expenditures usually referred to as "sunk costs" and firm undertakings
that cannot be undone without financial loss known as “committed costs”.
� Future expenditures that can be amended even if there are political or severe
structural implications.
To support forecasting of LCC it is essential to have a good knowledge of actual
acquisition and in-service costs. Collection of actual costs during the system life cycle
helps:
� To analyze differences between forecasting and actual costs,
� To feed costs databases,
� To identify cost drivers,
� To implement management control.
Any CBS must be as consistent as possible with each national "costs collecting"
system although it is recognized that this depends to a large extent on the structure, and
thus commonality of systems, even within one country’s financial or management
systems. For the exchange of data or comparison of costs within NATO it will be
necessary to understand the background to the purpose behind the use of LCC and if
necessary ‘translate’ that information into a form that can be ‘mapped’ to a common CB.
Collection of actual costs
Past expenditures Future
Cost forecasting
t
3-7
The Use of LCC in Project Management
Project Initiation Phase
The project initiation phase identifies a shortfall in capability. This shortfall is
detailed in some necessary documents. Upon the approval of the shortfall by the
management, the project will be initiated and the project planning will be started.
Project Planning and Development Phase
People try to identify options available to meet the need, analyze these options
and plan the activities for the next phases. One of the major functions performed during
the Project Planning and Development Phase is a review and comparison of options to
determine the single or possibly two or three most attractive solutions that could satisfy
the need.
Life Cycle Costing is the method used to quantify the relative costs to acquire and
operate each option. This analysis will develop the costs for each option. This could be
the first estimate of Life Cycle Cost (LCC). The first estimate of LCC is based upon a
comprehensive statement of requirement in mission terms and an outline of a solution.
Such an estimate is strictly an indication of the total project cost and completion date.
After this preliminary evaluation, a Program Planning Proposal (PPP) is prepared.
The PPP identifies resources required in broad terms and is equivalent to a pre-
feasibility study. Following approval of PPP, a Project Development Study is performed.
This more detailed study analyses the various options of meeting the need in more detail
in areas such as: capability, life cycle costs, personnel, technology and overall impact on
DND. Upon the completion of these analyses, the second estimate of LCC is derived.
The second estimate of LCC is based on the general description of the end item
sought, on production/construction experience, on the market conditions or on system
concept or preliminary design and analysis of its cost and schedule conducted by
experienced personnel. This second estimate of LCC would be sufficient for making the

3-8
correct investment decision. This estimation is used in preparing of Program
Development Proposal. Whenever management approves it, the project definition phase
begins.
Project Definition Phase
This phase involves a more detailed analysis of the preferred option, or additional
options if required. The option(s) is analyzed to determine the probability of meeting the
project requirements in relation to cost, time and performance. As well, the next phase,
Implementation, is planned in detail.
From this analysis, the third estimation of LCC is prepared. It is based upon data
(relative to cost, timing and production or construction) of quality. This estimation should
provide for the establishment of realistic project objectives sufficiently accurate to obtain
effective project approval.
The report concerning the project definition phase and the third estimate of LCC
are used to prepare Program Change Proposal. When it is approved, the project
implementation phase begins. The Project Implementation Phase is the final phase of
the acquisition environment.
The Use of Life Cycle Cost in Acquisition Process
The defense planning activities begin with the identification of a need and
continue through to the implementation of the most effective method of meeting that
need. A project is initiated in response to a need to meet some capability, which is not
being met. As this process progresses from the concept phase through planning
development and definition, a number of factors must be considered, including meeting
the mission requirements, time, socio-economic factors and cost.
A system life cycle usually consists of four phases. These are conception,
acquisition, in-service and disposal.
3-9
During the conception phase, our concern is about the magnitude of life cycle
costs, the technical feasibility of the proposed maintenance concept, the potential risks
involved in any specific option and for assistance in performing various trade-off
analyses. There may not be a great amount of detail available on the systems, but
through various data banks and LCC models, we will be able to assist in determining
estimates for costs in areas such as personnel, facilities, support equipment, spare
parts, publications, training and training equipment, technical data, etc.
During the acquisition stage, LCC expert evaluates the contractor's submissions
to validate the LCC and R&M data and begins monitoring the support system to ensure
its effectiveness.
During the in-service stage, the LCC manager continuously monitors the system's
effectiveness by comparing the previously estimated values of LCC with the actual
values incurred to identify trends and possible problem areas, and to determine causes
and interrelated effects.
In the disposal stage, we must determine the most cost-effective and
operationally effective alternative. This involves using LCC to compare options to
modify, rebuild or replace the system. If the system is to be replaced, the LCMM
reviews the support system elements, which may be reassigned, and the most cost-
effective disposal method for the non-usable elements.
The Use of Life Cycle Cost in Defense Planning
The techniques of LCC are used to assist the project managers and various
levels of decision-makers in making the most cost-effective decisions based upon data,
which has been collected and analyzed in a logical and coherent manner. The data
from the LCC analysis is used for;
� Long Term Defense Planning,
� Comparison of Competing Projects,
� Comparison of Logistic concepts,
3-10
� Decisions About Replacing Aging Equipment,
� Selection Between Competing Contractors.
LCC may consider non-cost related factors, which may influence decision. These
factors include political decisions based on socio-economic benefits; safety related
decisions, which may preclude using certain cost-saving material procedures; and legal
requirements imposed upon the use or maintenance of a system.
Long Term Defense Planning
Long term defense planning, beyond ten years, requires careful analysis of all
quantifiable factors which may impact the system under review, whether this is the
complete defense services program or a specific project such as new ships. Most major
new projects require more than five years from the start of the initial needs analysis to
the actual acquisition of the system, and the system's operation and support costs must
be borne by DND for between fifteen and twenty-five years. Therefore, accurate
estimation of life cycle costs is a major responsibility of DPMS planners.
LCC techniques force the user to accurately define the various phases of the
project. This definition requires an analysis of the work to be performed, the
deliverables, and the cash flow and management requirements to control project. To
determine the work to be performed, the project planners must prepare a work
breakdown structure (WBS) or each phase of the project and integrate this with all
related work breakdown structures. This procedure ensures that all applicable cost/work
areas will be considered in the next stage of the procedure, which is estimating the costs
for each work package. This WBS forms the foundation for the budgeting process. The
principal cost categories should continue to be used for cost tracking over the entire life
cycle of the system.
Each work package in the WBS must have an identifiable output, which can be
assigned an estimated cost and a time frame for completion of that output. This relates
expected costs to specific phases of a project and provides a cost profile of when project
3-11
costs are expected to occur. In summary, the use of LCC techniques in long term
defense planning will:
� Define details of activities in specific phases of a project (WBS),
� Relate expected costs to specific phases of a project (Cost Allocation)
� Provide a cost profile of when costs are expected to occur (Cash Flow
Projections).
Comparison of Competing Projects
The comparison of competing projects is an ongoing exercise as a number of
projects attempt to obtain limited funds. The comparison of competing projects includes
the determination of which option is the effective in a particular project. The philosophy
concerning the application of LLC techniques is the same for every option.
LCC provides a rational, logical and supportable comparative technique for the
estimation of the total cost of ownership of different options. When comparing different
system options, the most cost-effective technique is to analyze and consider only those
aspects of a system, which are different. The use of scarce resources to analyze
factors, which will have no bearing or impact on the final decision, is not cost effective.
As LCC forces the user to plan more deeply and do more analysis with hard data, the
actual differences between system options will become more apparent and allow a more
rational analysis to be done.
Comparison of Maintenance Concepts
The maintenance concept is the basis for all aspects of the total support system.
It determines where items will be repaired, removed and stored; who will be responsible
for performing specific maintenance actions; what personnel an skills will be used; and
who will manage the support system and all of its components.
The maintenance concept used on any particular system has a large effect on the
maintenance resources required to support the system. LCC allows a planner to

3-12
evaluate the effect of different maintenance concepts on any particular system option or
analyze the effects of a particular system's support requirements on an established
maintenance concept.
Some of the major factors considered in a maintenance concept are:
• The operational scenario of the system,
• Available resources such as funding, skilled personnel, etc.
• Sources of supply, both military and civilian,
• Cooperative logistic agreements proposed or in place,
• Technology of system,
• The applicability of the established maintenance concept.
LCC allows the planner to compare different maintenance concepts and
determine what cost effect the concepts may have. Once again, it is most cost effective
to compare only the difference between the concepts and not consider the total life cycle
costs at this point in the analysis.
Replacing Aging Equipment
As equipment ages, the support of that equipment tends to become increasingly
expensive. At some point in time a decision must be made to either rebuild/refit the
equipment or explore alternative methods of meeting the operational requirement. This
decision is necessary when it has been determined that the present system either
cannot meet the operational needs or the support costs are too great to continue
carrying the present system in the inventory.
Life cycle costing is the optimum method used to address the three possible
options available in resolving this scenario.
� The first possibility is to examine the support costs being incurred and determine
if these costs may be reduced through the use of more advanced maintenance
techniques or better support planning and operation.

3-13
� The second possibility is to determine the benefits, which may be realized by
performing a rebuild/refit on the system to incorporate subsystems, which will
reduce the maintenance and support system demands.
� The third and final possibility is to assess the impact on support system resource
demands, which may result from replacing the old system with a new system,
designed to reduce the support requirements needed to maintain the new system.
In essence, the life cycle costing approach provides the planner or life cycle
manager with the tools required to make sound, rational decisions to determine which of
the possible alternatives under consideration is the most cost effective.
Selection Between Contractors
The cost of operating and supporting a system is, in most cases, significantly
greater than the cost of acquiring it. For this reason, the post-acquisition costs have
become an increasingly important component of the evaluation of potential contractors'
proposals.
Contractors are being required to provide data on expected support costs either
as estimate figures or as contractually guaranteed cost figures. The evaluator, planner
or manager must determine when it is to the their advantage to require a contractor to
provide either estimated data or contractually guaranteed data. Before a data
requirement is imposed on the contractor, the manager must determine the specific cost
data required, the amount of detail necessary and the degree of accuracy desired.
The contractor incurs a cost increase when data must be contractually
guaranteed. This cost is directly related to the level of risk inherit to the provision of
such data. If the data is guaranteed and the guarantee can be enforced, then the
manager has relatively little analysis to do to confirm its accuracy; however, if the data is
merely estimated, the manager must then have the means of evaluating the data and
determining its accuracy in their needs.
3-14
When the data is to be used for the evaluation of proposals submitted by competing
contractors, the manager's needs may only include data concerning the differences
between the various alternatives and not the absolute costs for each alternative.
As a result, it is obvious that the techniques of life cycle costing can be used by the
Life Cycle Manager as prime method for carrying out planning and management
responsibilities.

4-1
Life Cycle Management in NATO
Emilio Fajardo, Robert HerremanGraeme Glenister, Sergio Di Cicco
Cornelis BoumanNATO CALS Office
NATO HQBoulevard Léopold III
1110 Brussels, Belgium
SummaryTraditionally, NATO acquisition and logistics have operated through a series of relativelyindependent processes and organisations. The November 99 CNAD meeting (Conference ofNational Armaments Directors) confirmed a recommendation from the NATO ArmamentReview (NAR) to create a Life Cycle Working Group.
This working group has adopted Life Cycle Management (LCM) principles and has acceptedthe following mission statement for its work:“To propose guidance in the area of Life Cycle Management to CNAD by providing:A study of the basic elements (principles and definitions) needed to define a NATO-policy onLCM and a framework (high level process model) and a proposal to move forward."
This paper gives an overview of the contents of the report, which among others mentions theobjectives for introducing LCM in NATO.
Furthermore a definition for LCM is given and reasons are given why LCM might provide uswith the necessary changes in our organisations to meet the demands of our war fighters andother stakeholders.
It is clear that managing the total life cycle in organisations means the integration of theacquisition and logistic processes. However implementing LCM in an organisation is notdone without the necessary preparation. A number of key enablers need to be in place beforeany implementation can even start.
An important enabler is “a unified business process methodology” which gives us the tool todevelop a common framework to describe the life cycle of a system by a complete set of well-defined processes and associated terminology. Based on this a life cycle management modelis presented.
Although the work that has been done by the Life Cycle Working Group is of greatimportance it cannot stop here. In order to take LCM forward in NATO the Life CycleWorking Group recommends an action plan for the near, the medium and the long term to becarried out under the leadership of a high NATO authority.
In order to make the transformation to LCM a success for NATO the Life Cycle WorkingGroup has recommended to CNAD to investigate the broadest possible participation of otherorganisations in NATO. Furthermore a high level Committee under CNAD should investigatein close co-ordination with SNLC and NC³Board how these actions for the near, medium andlong term can effectively be implemented in NATO.
The NADREPs (National Armaments Directors Representatives) on behalf of the CNADhave approved at their 12th March 2001 meeting the Life-Cycle WG report and the NCMBwas tasked to continue this important work and to act upon the given recommendations.
Paper presented at the RTO SAS Symposium on “Cost Structure and Life Cycle Cost (LCC) for Military Systems”, held in Paris, France, 24-25 October 2001, and published in RTO-MP-096.
4-2
IntroductionTraditionally, NATO acquisition and logistics have operated through a series of relativelyindependent processes and organisations. The delivery of materiel and services have focusedon each element of the process (e.g., supply, maintenance, transportation, procurement, andfinance), each operating independently but interfacing at appropriate points along the deliverypath. At the same time, diverse organisations were responsible for stand-alone portions of thelogistics process. This approach has resulted in sub-optimal efficiency of the total process,some duplication of effort, and management and technical solutions oriented to individualsegments of the process. A focus on customer requirements and satisfaction has been absentor, at best, dependent on each logistics sub-process or organisation's perception of customerneeds.
The November 99 CNAD meeting (Conference of National Armaments Directors) confirmeda recommendation from the NATO Armament Review (NAR) to create a Life Cycle WorkingGroup. From NAR report AC/259-D/1792 dated 22 November 1999, we quote:"… the concept addressed by the NATO Armaments Review covers the optimisation of allaspects of a defence system’s performance over its whole life cycle, including those activitiesrelating to in-service support. In order to further elaborate this concept it would be desirableto develop both a policy and a model. This might then suggest that the CNAD’s PhasedArmaments Programming System (PAPS) could, if appropriate, take into account these lifecycle support considerations. A Life Cycle Working Group will develop these products andprovide its report to the autumn 2000 CNAD meeting."
This working group identified that through adoption of Life Cycle Management (LCM)principles; NATO can develop a more integrated, efficient, and customer-oriented logisticsprocess.
Based on this, the Life Cycle Working Group accepted that the following mission statementfor its work:“To propose guidance in the area of Life Cycle Management to CNAD by providing:A study of the basic elements (principles and definitions) needed to define a NATO-policy onLCM and a framework (high level process model) and a proposal to move forward."
Is there a need for improvement?The preliminary findings of the Life Cycle Working Group identified that Projects seldommeet the requirements of all stakeholders. The main reasons for this are deep-seated in ourorganisational culture which could be summarised in the following three main categories:• Poor management: Some of the shortcomings often encountered in our defence
organisations are insufficient resources at the early procurement stages of projects. At thesame time they are subject to cumbersome approval processes, rigid procedures,ineffective incentives available to outside contractors and to NATO/MoD staff, contractconditions that often discourage innovative solutions, defence industry’s restructuring,companies merging or allying both nationally and internationally and finallyconcentration on delivering short term, mostly financial, benefits.
• Ill defined roles and responsibilities of the stakeholders: There is seldom a clear singlecustomer within NATO or MOD for equipment projects. A number of processes likedefining the requirement for equipment, researching potential technologies, managingprocurement projects and supporting equipment throughout its life are executedseparately within NATO/MOD and furthermore not enough authority is delegated tothose managing all the various stages of the equipment life cycle.
• Difficulties of technology insertion: Defence equipment is becoming increasinglycomplex and diverse, while the product life of current High Tech equipment has anestimated stable baseline of not more than 12 to 18 months for manufacturing and another36 to 48 months for sustainment. This relatively short product life cycle has an impact on
4-3
spares levels and needed support equipment and requires planned technology updatesthrough technical refresh and technology infusion.
The Life Cycle Working Group has found that many nations have identified the sameproblems as are stated above. They have taken action to correct those: for example, SMARTPROCUREMENT and the creation of a single Defence Logistics Organisation in theUK MOD and the LIFE CYCLE INTEGRATION-initiative in the US DoD. Also the DefenceCapability Initiatives (DCIs) and the NATO Armaments Review (NAR) has identified theneed to establish closer collaborative links between all interested parties in the developmentand use of the Defence Systems.
Those initiatives all have in common a consistent focus on the System’s Life Cycle. It is thegroup's firm belief that NATO should also develop a similar improvement program with at itscore, Life Cycle Management (LCM).
Where should NATO go and what should be its objectives?The earlier list of symptoms is only a preliminary analysis of where our Organisation goeswrong. However before embarking on a major change program involving Life CycleManagement, CNAD will have to convince everybody in NATO to introduce LCM.
As part of any further initial steps towards introducing the concepts of LCM, NATO shouldmake an analysis of its business and identify and quantify if possible the benefits. The latterwill build a real case for change, which will contribute greatly to the definition of whatchanges are needed and for measuring accomplishments.
The objectives for introducing LCM in NATO should be:• To establish a life cycle partnership between all stakeholders in a project.• To have a total and shared view on the objectives of a project.• To create seamless life cycle management processes that extend from mission analysis to
product disposal.• To ensure continuous technology refreshment by stressing preference for commercial and
non-developmental solutions to mission needs.
What are the benefits of LCM to NATO?LCM in itself will provide a "total", collective and shared view of the objectives of theproject, especially - what and who is it for - and thus ensure complete customer satisfaction.This means that within LCM, the objectives of each phase in the life cycle will be definedcontributing to that overall success and how they need to interact; that is, cascading theobjectives and ensuring all future activity still contributes to deliver the defined return(s). Thiswill be done through careful Mission and Investment Analysis:• A strong capability for mission analysis will look forward in time to identify and
prioritise needs before they become operational problems. We absolutely need to have aclear long-term vision of the way in which we expect our forces and their methods ofoperation to develop.
• A strong capability for investment analysis will ensure rigorous and impartial treatment ofalternative strategies for satisfying mission need, while also achieving "buy-in" from theusers who must live with the solution and the providers who deliver it.
But what is Life Cycle Management?At its first meeting the Life Cycle Working group identified that to understand the scope ofLife Cycle management in NATO one will have to define the term “System”:
“An integrated composite that consists of one or more processes, hardware, software,facilities and people, that provide a capability to satisfy a stated need or objective”.
4-4
Keeping in mind the definition above the Life Cycle Working Group agreed on the followingdefinition for “Life Cycle Management”:
“The management of a system, applied throughout its life, that bases all decisions on theanticipated mission-related, political, social and economic aspects of the system Life Cycle.”
The study was focused on the mission-related and economic considerations. The duration orextent of the life cycle depends upon fulfilling the intended need, the complexity of thesystem, the environment in which it operates, and its life cycle cost.
Life Cycle Management will assure that the business processes and procedures used acrossprojects are consistent and that there is effective sharing and co-ordination of resources,information and technology. Life Cycle Management is a holistic approach used to describeall the strategic, organisational and technological tasks that should assist in correcting theflaws of our current logistics systems, which were identified earlier in the second paragraphof this paper. The focus on Life Cycle Management will provide an optimal adjustment of ourorganisation, our business processes and our information systems to the demands of the warfighters and all other stakeholders.
Managing the total life cycle means the integration of the acquisition and logistic processes.
Has LCM any relationships with other disciplines?The Life Cycle Management approach clearly brings together (elements of) other disciplinessuch as:• Systems Engineering and Integration (SE&I) which is a collaborative process to derive,
evolve, and verify a life cycle balanced system solution that satisfies customer needs andexpectations. SE&I provides a structured approach, typically consisting of hardware,software or networking, in a heterogeneous environment to meet business challenges, inother words LCM in the design and development of a system.
• Logistics that is defined by NATO as the science of planning and carrying out themovement and maintenance of forces. This definition clearly stipulates the pre-eminenceof support to the war fighter. However in the broader context of Life Cycle Management,logistics could be considered as the life cycle management of resources for systems andoperations.
• Total Quality Management (TQM) has the aim to ensure that each activity contributes toachieving the key objectives of the business and is carried out effectively (ref 8). WithinNATO's Quality Management System this is done by integrating working processes,optimising internal and external interfaces, and developing good commercial relationshipswith industry (ref 9). Those are the essential elements of LCM.
• Supply Chain Management is a new business strategy that is getting a lot of attention inour industries which can be defined as (ref 10) - co-ordinating, scheduling and controllingprocurement, production, inventories and deliveries of products and services tocustomers. It includes all the steps you do everyday in your administration, operations,and logistics department(s): Processing information from your customers to suppliers.The Supply Chain itself is considered to be all inter-linked resources and activitiesneeded to create and deliver products and services to customers.
• Integrated Logistics Support (ILS) is a management function that provides planning,funding, and functioning controls which help to assure that the system meets performancerequirements, is developed at a reasonable price, and can be supported throughout its lifecycle. It is an integral part of LCM and supports Logistics and SE&I.
• Concurrent Engineering is a systematic approach to creating a product design thatconsiders all elements of the product life cycle from conception of the design to disposalof the product. And in doing so defines the product, its manufacturing processes, and allother required life cycle processes such as logistic support. It can be considered as theapplication of LCM during the Design Phase.

4-5
What are the enablers to make LCM a success in NATO?What are the key enablers in a strategy to implement LCM successfully in an organisationlike NATO? The Life Cycle Working Group has recognised that it is important to assure thatall of the enablers should be looked upon as being mutual supporting, and that the real benefitis achieved by closely integrating them.
It is just a summary of a few of the enablers towards lowering the total ownership costs whileat the same time satisfying the war fighter's operational and readiness requirements. TheWorking group considered them as particularly important and each should be assigned toanalytical teams for further evaluation and defining ways to accelerate implementation inNATO.
Many of the enablers have already been discussed and recommended for implementation byvarious NATO-groups. One of the firsts steps in a strategy for LCM-implementation shouldbe to map:• NATO-initiatives against those enablers,• the enablers against the Strategic objectives to-be-determined in a NATO-vision on LCM,• the NATO initiatives against the various-groups and/or organisational units concerned.This might lead to assigning some of the work of the analytical teams to existent NATOWorking Groups and focussing the work on the strategic objectives.
To make a success of introducing LCM in NATO the following environmental factors willneed to be in place:• Implementation of a unified business process methodology: The research and findings
from the last 20 years (CALS, EC/EDI, CIM, BPR, TQM, and others) have shown theneed to analyse why and what an organisation does before embarking into any changeprocess. Also it is necessary to relate the things one organisation does to what is done inanother organisation. Therefore a uniform business process methodology across the wholeof NATO, industry, business partners and supplier base or in other words the stakeholdersshould be developed and implemented. This will lead to a series of more integrated andseamless business practices in a virtual business environment or extended enterprise. Thiswill be supported by business systems that provide full support for the war fighter acrossmultiple functional areas like logistics, and procurement and acquisition.The use of a international standard such as Standard 15288 - Life Cycle Management,System Life Cycle Processes - from the International Organisation for Standardisation(ISO), and discussed under Chapter 5, as a framework will be a step in that direction.
• Implement Change Management: The implementation of LCM will affect the wholeorganisation. It is the ultimate responsibility of senior management to align theorganisation's people and culture to the new LCM-strategy. It is a complex and difficulttask. Lessons from the past teach us that, in general, insufficient attention is given tomanaging resistance and to skill people to operate in the new environment. Indeed:- Employees must do different things, make different decisions and perform in different
ways.- New networks of suppliers, manufacturers, distributors and customers will have to be
forged.- Suppliers will have to react with their own change process.- Alliance partners will need to share the same vision.- New infrastructure across these networks must be built or reconfigured including
computer systems, distribution centres, factories and support organisations.To make matters more challenging, this must all be achieved in a framework ofcontinuous operations: systems cannot be shut down while we remodel.
• Implementation of an Information Policy: A typical Supply Chain has two sub-chains.The first sub-chain is the product supply chain. The second sub-chain, the informationchain, is more complex and more difficult to grasp.The critical logistics issue is how to make sure the right information is available in time,at the right level of the organisation and at the right level of detail needed for effective

4-6
decision making. Therefore NATO will have to agree on a Reference Model forInformation Management. This is a description of all of the possible softwarecomponents, component services (functions), and the relationships between them (howthese components are put together and how they will interact).Integrated systems further assume some level of agreement on data definition, meaningand context, agreement on common, reusable business objects (or network service), acommon business language and agreement on common interfaces. One of the underlyingdata-modules is the product engineering data. Also in that field ideally the product datarepresentation should conform to a single standard. Two standards are emerging here: theObject Management Groups Product Data Management (ref.5) enablers and theInternational Standard Organisation's Standard for the Exchange of Product Data (STEP,ref.6).A concerted effort is needed to define and implement an Information Policy that ensuresthat NATO's IT investment priorities cover the exigencies of implementing the LCM-concept. The challenge is the timely and accurate access and integration of logistics dataacross units and combat support agencies throughout the world providing reliable assetvisibility and access to logistics resources in support of the war fighter.
• Development of Performance Measurement Systems: US Air Force Chief of Staff Gen.Michael E. Ryan said "Now, quite honestly, if you can't describe it, and then measure it,we probably ought to question whether we ought to be doing it".This fundamentally describes why we need Performance Measurement. Measurementneeds to be viewed as a process for obtaining vital insight into the progress, products,and/or processes of the project or system being developed and used. This insight helps thedecision maker to make more informed decisions, identifying deviations from plansearlier, thus allowing mid-course corrective actions when it is less expensive to makethem.At all levels, managers should be able to evaluate their actions and productivity.Managers have to know if a program is on schedule or at risk. If a program is not onschedule, managers need to know that problems have been resolved and that the programwill meet desired objectives.The performance measurement system should provide descriptions of the key elements toevaluate each business area and process and should be linked to the overall planningsystem. The key to satisfying this requirement is the ability to deliver summarised datathat directs managers to areas that require further investigation.Performance Measurement should be an essential part of our change-to-LCM-strategy,where the measurement process needs to be viewed as a process for obtaining vital insightinto the progress toward implementation of LCM.
• Implementation of an Improved Requirement Management: The management anddevelopment of large complex systems presents many challenges to system managers likethe ability to ensure that the needs of the users are satisfied and to ensure easymaintenance and enhancement during their deployed lifetime. These systems oftenchange and evolve throughout their life cycle: this makes it difficult to trace theimplemented system against original and evolving user requirements.Requirements establish an understanding of the user's needs, and also provide the finalyardstick against which the final result is measured. Requirements management consistsof information capture, information storage and management, and informationdissemination. Key to the success of any requirement management process is requirementtrace-ability. Requirement trace-ability is a technique used to establish and maintainrelationships between requirements and design and implementation of a system in order tomanage the effect of change and ensure the success of the delivered systems. Everysystem-characteristic should be traceable to the user needs: this is an essential element ofa Quality Management System and therefore of LCM.
• Application of Advanced Cost Management Techniques: Defence managers need toknow their costs and be motivated to improve quality and reduce costs. Efficient andeffective product support requires the ability to view costs from a variety of perspectives(e.g., by weapon; organisation; ownership; base or installation; mission area or warfaretask; and function, process, or activity). Project Managers need accurate product costing

4-7
(that links Operation & Support costs to weapon systems) to select a provider amongorganic and commercial organisations. Supply Chain Managers will need accurateproduct costing to establish optimum network configurations to develop plans to integratevendor and organic activities. NATO must develop plans to implement life cycle costingto support those managers.All NATO services and Agencies should therefore be encouraged to share resources anddevelop a common framework of terms and definitions for activities performedthroughout NATO. Common definitions for functions and processes will enablebenchmarking and sharing of best practices and serve as a foundation for moresophisticated modelling. The concept of Total Cost of Ownership should be an integralpart of the way to manage systems.
• Implementation of Total Asset Visibility (TAV): This is the capability to provide userswith timely and accurate information on the location, movement, status, and identity ofunits, personnel, equipment, and supplies. It also includes the capability to act upon thatinformation to improve overall performance of NATO's logistics practices. TAV shouldinclude in process, in-storage, and in-transit business processes. In-process assets areitems that are being either repaired or procured.Without this visibility, redundant materiel orders, inaccurate personnel accounting, and ageneral lack of confidence in the dependability of the logistics and personnel pipelineswill continue to plague our forces.
What might a Life Cycle Management Modelin NATO look like?
The Life Cycle Management Model is aimed at establishing a common framework fordescribing the life cycle of a system by a complete set of well-defined processes andassociated terminology. The processes may be applied throughout the life cycle for managingand performing the conception, development, production, utilisation, support and retirementof systems. This is accomplished through the involvement of all interested parties with theultimate goal of meeting NATO/NATO Nation’s needs and achieving satisfaction of all thestakeholders.The Model may be used:• By an organisation to establish an environment of desired processes that can be
supported by an infrastructure of methods, procedures, techniques, tools and trainedpersonnel. The organisation may then employ this environment to run and control itsprojects and progress systems through their life cycle phases.
• By a project/system, within an organisation to select, structure, employ and perform theelements of the established environment. This mode may be used also to assessconformance of the project/system with the declared, established environment.
Keeping in mind what is stated above it is easy to see that system life cycle management canbe partitioned into two distinct but interrelated aspects:• Phases in the time domain; the partitioning of the system life cycle management into
phases is based on the practicality of doing the work in small, understandable, timelysteps. They, in addition, help to address uncertainties and risk associated with cost,schedule general objectives and decisions factors.
• Processes in the function domain; the partitioning of the system life cycle managementinto processes is based on the principles of modularity (maximal cohesive functionsminimal coupling among processes) and of responsibility (a process is under aresponsibility).
4-8
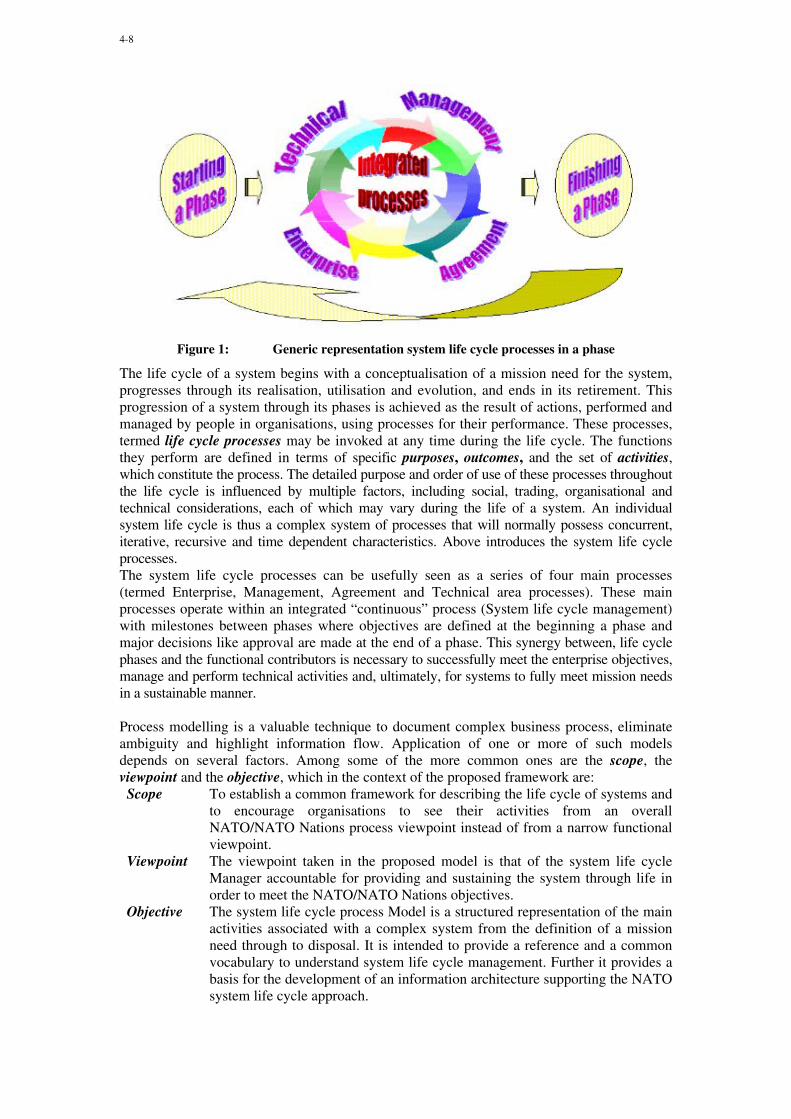
Figure 1: Generic representation system life cycle processes in a phase
The life cycle of a system begins with a conceptualisation of a mission need for the system,progresses through its realisation, utilisation and evolution, and ends in its retirement. Thisprogression of a system through its phases is achieved as the result of actions, performed andmanaged by people in organisations, using processes for their performance. These processes,termed life cycle processes may be invoked at any time during the life cycle. The functionsthey perform are defined in terms of specific purposes, outcomes, and the set of activities,which constitute the process. The detailed purpose and order of use of these processes throughoutthe life cycle is influenced by multiple factors, including social, trading, organisational andtechnical considerations, each of which may vary during the life of a system. An individualsystem life cycle is thus a complex system of processes that will normally possess concurrent,iterative, recursive and time dependent characteristics. Above introduces the system life cycleprocesses.The system life cycle processes can be usefully seen as a series of four main processes(termed Enterprise, Management, Agreement and Technical area processes). These mainprocesses operate within an integrated “continuous” process (System life cycle management)with milestones between phases where objectives are defined at the beginning a phase andmajor decisions like approval are made at the end of a phase. This synergy between, life cyclephases and the functional contributors is necessary to successfully meet the enterprise objectives,manage and perform technical activities and, ultimately, for systems to fully meet mission needsin a sustainable manner.
Process modelling is a valuable technique to document complex business process, eliminateambiguity and highlight information flow. Application of one or more of such modelsdepends on several factors. Among some of the more common ones are the scope, theviewpoint and the objective, which in the context of the proposed framework are:Scope To establish a common framework for describing the life cycle of systems and
to encourage organisations to see their activities from an overallNATO/NATO Nations process viewpoint instead of from a narrow functionalviewpoint.
Viewpoint The viewpoint taken in the proposed model is that of the system life cycleManager accountable for providing and sustaining the system through life inorder to meet the NATO/NATO Nations objectives.
Objective The system life cycle process Model is a structured representation of the mainactivities associated with a complex system from the definition of a missionneed through to disposal. It is intended to provide a reference and a commonvocabulary to understand system life cycle management. Further it provides abasis for the development of an information architecture supporting the NATOsystem life cycle approach.

4-9
The generic and simple structure of the high level Model, shown below, has been used as thebasis of the system life cycle Model. In the report (1) the Model has been expanded to showmore clearly the detailed processes and breakdown of activities and the main inputs andoutputs. Each life cycle process can be invoked, as required, at any time throughout the life cycleand there is no definitive order in their use. The structure of presentation in Figure 1 above doesnot therefore imply any precedence or sequence of application of the processes. The grouping(area processes), however, does reflect underlying models used in this document.
Typically, organisations distinguish between different areas of managerial responsibility andactions. Together, these areas contribute to the organisation’s overall capability to operate.Within each organisation, a co-ordinated set of those area processes contribute to the effectiveacquisition, use and support of systems and by doing so contribute to achieving the overallorganisation goals. This Model is based on the four primary organisational areas ofresponsibility, represented by the top level processes (see also Figure 2):• The Enterprise process ensures that the needs and expectations of the organisation’s
interested parties are met. They manage the organisation’s activities required toimplement a system life cycle approach within the organisation, defining the strategy tobe prosecuted and providing the necessary organisational support to the implementationprocess. They also provide a structured approach for defining specific organisation’sinvestment in response to a mission need, ensuring the satisfaction of the organisationoverall objectives.
• The management process evolves plans to accomplish project/system objectives, assessactual achievement and progress against the plans and control execution of them throughcompletion. Unfortunately, they tend to operate within a discontinuous and changingenvironment, will be enacted by different stakeholders, performing multiple roles atdifferent times and in most cases they have different, perhaps conflicting, businessobjectives. The challenge is how to optimise them to meet the overall project/systemobjectives. Integration management process is than required to ensure that the variousmanagement processes elements are properly co-ordinated. It involves making trade-offsamong conflicting objectives and alternatives.
• The Technical Process defines the actions that transform the needs of stakeholders firstinto a product and then, by applying that product, to providing a service as, when andwhere needed in order to achieve stakeholders satisfaction.
• The agreement process is than used to achieve inter- and intra-organisation tradingbetween different areas of responsibility.
Figure 2: The high level Life Cycle Management Model

4-10
What is happening in NATO: Present and future?Life Cycle thinking is not entirely new in NATO. The concepts have been adopted by severalactivities. The most important ones are described hereafter:
The SNLC is the lead committee of DCI SL9, which looks to improve procedures for co-operative logistics planning and management and enhanced co-ordination between therelevant planning disciplines. An Ad-hoc Working Group led by SILCEP and withparticipation of other NATO groups (NC³A, NATO CALS, NAMSA, etc…) is developing aNATO Policy on Co-operation in Logistics.
The Group of National Directors for Quality Assurance (AC/250) has not only been focusedon Quality, but through it's work and through the International Standardisation Organisation,considers the Process Approach as a main principle to Quality Management. In its newAQAP-100 (Allied Quality Assurance Publication – 100) it recommends that theorganisations of the life cycle participants should establish, document, maintain and improveeffective and economical processes for each life cycle phase. Organisations can useinternational standards, as appropriate, to align and tailor the applicable processes with theorganisation's structure, goals and business strategy. These standards may also contain thecriteria that confirm the successful execution of the processes.
SAS-028 is a Task Group under the SAS-panel (Studies, Analysis and Simulation - panel) ofthe Research and Technology Agency (RTA). This SAS-panel has recognised the need for animproved Life Cycle Cost Model with the ability to view costs from a variety of perspectivesand tasked the mentioned Task Group to develop a generic life cycle cost breakdownstructure with associated definitions.
As a result of the NATO Armaments Review (NAR) initiative, the NATO Committee forArmaments Co-ordination (NCAC) has been created. This committee is pursuing better co-ordination among armaments-related activities and programmes, by examining theConsolidated Alliance Capability Goals (CACGs) and the development of Alliance Co-ordinated Armaments Requirements (ACARs). By better Requirement Management thiscommittee wants to improve visibility on armaments programmes.
The NATO CALS Management Board (NCMB) has given us a focus on Information and hasat all times championed the need for a consistent definition of information needs to supportthe Management of the System Life Cycle.A special NCMB working group on Metrics has laid the foundation for consistentPerformance Measurement in NATO.
The Life Cycle Working Group has specifically addressed the difficulties in the managementand engineering of complex systems. Almost every present-day system contains, is modelledby, and/or is supported by computer technology. This increasing utilisation of the computerhas led to new opportunities but also to new problems. There are several factors contributingto these problems. Some are due to the inherent differences between hardware, software andhumans. Others are essentially due to a lack of harmonisation and integration of the involveddisciplines such as science, engineering, management and finance. As a result, the workinggroup has felt it necessary to demonstrate the need for a common framework to be used toimprove communication and co-operation between diverse disciplines and so enable modernsystems to be created, utilised and managed in an integrated, coherent fashion. The Life CycleManagement Process Model (tailoring of the draft ISO 15288 – Life Cycle Management –System Life Cycle Processes) provides such a common framework.
4-11
How could LCM be taken forward in NATO?LCM will need a holistic approach, involving the whole Alliance. So it is very important tohave:• Senior management involvement.• A clear vision on what to achieve with LCM in NATO.• The whole NATO organisation targeted for Life Cycle Management, which means the
change to LCM, being an overall approach, can not be delegated to a single office.
So the Life Cycle Working Group recommends an action plan for• The near term: From previous paragraphs in this paper it should be clear that there are
two issues which need to be addressed most urgently to introduce successfully theconcept of LCM:- NATO must be perfectly clear about what it want to be achieved by the introduction
of LCM. What is its scope: NATO HQ, the Agencies, or all NATO projects?- A common framework of terms and definitions for activities performed throughout
NATO: Is NATO going to adopt the developments in the InternationalStandardisation Organisation?
Therefore the Life Cycle Work-Group has proposed the following actions to be taken byNATO:- To establish a policy framework for LCM under the responsibility of a Senior
Management Committee (SMC) for Life Cycle Management by developing cleartargets for Life Cycle Management in NATO. This SMC should be lead by a highNATO authority, having direct impact on the NATO-organisation. It is recommendedthat the SMC be supported by a group of experts drawn from the areas of CNAD,SNLC and NC³Board. This committee should do the following with the above results:♦ They should seek endorsement by NATO top management and formalise them as
a NATO Publication.♦ They should organise a NATO-wide conference on LCM where NATO presents
the vision of LCM and where participants form techniques and methodologies toimplement LCM.
- To establish a terminology framework by setting up a team to further investigate theuse of the draft ISO15288. This team must convince the whole organisation of thebenefits of this standard to be. It must investigate its impact on other NATOpublications.
• Medium term: The SMC must set priorities for introducing LCM in NATO. They mightwant to investigate re-structuring of NATO HQ organisation and might want to establishWorking Groups to align organisational functions with Life Cycle Processes. Thereforethe SMC should:- Start with setting up a Team to develop a set of Life Cycle Management Guidelines
regarding :♦ The complete tailoring of ISO 15288 and document it as an STANAG.♦ The Revision of NATO’s Phased Armaments Programming System (PAPS).♦ The targets for Life Cycle Management in NATO (i.e. Performance
Measurements, Information Management, Life Cycle costing, etc.) and formalisethem as NATO Publications
- Secondly organise training and workshops on Life Cycle Management to:♦ advertise above products,♦ provide awareness on tools and enablers,♦ instruct the personnel and provide the adequate skills; the aim is to form teams,
which can implement LCM in specific projects.- And finally should seek the implementation of its products in Pilot Programs.
• Long term: The SMC should use Performance Measurements to monitor implementationsand to adjust targets of Life Cycle Management. And last but not least the SMC shouldmonitor new developments in technology and Business Management.

4-12
The final recommendations to CNAD by the Life Cycle Working Group in order to make thetransformation to LCM a success for NATO are:• To investigate the broadest possible participation of other organisations: all NATO HQ
Divisions, the NATO Agencies, NIAG, and most of the WG working under NATOauthority. Therefore CNAD should task the NATO CALS Management Board to presentthis report to SNLC and NC³Board and distribute the report to all the NATO stakeholdersinvolved in Life Cycle processes.
• To task a high level Committee under CNAD to analyse this report and in particularinvestigate, in close co-ordination with SNLC and NC³Board, how these actions for thenear, medium and long term could effectively be implemented in NATO.
What are the present activities?The report “Life Cycle Management in NATO” (1) is the result of the work of CNAD’s LifeCycle Working Group led by the NATO CALS Office (under the auspices of the NATOCALS Management Board). The CNAD, through their NADREPs (National ArmamentsDirectors Representatives) who have approved at their 12th March 2001 meeting the Life-Cycle WG report and the related recommendations, has tasked the NATO CALSManagement Board to continue this important work and:• present this report to the SNLC and the NC3 Board and to distribute the report to all
relevant NATO stakeholders involved in Life Cycle processes;• investigate, in close co-ordination with other appropriate NATO bodies, how the roadmap
for implementation of Life Cycle Management proposed in the report (see paragraphabove) can be effectively implemented in NATO.
References1. “Life Cycle Management in NATO”, a report to the Conference of National Armament
Directors, 25 September 2000, edition 12. “UK Strategic Defence Review”, supporting Essay on "Procurement and Industry",
http://www.mod.uk/policy/sdr/essay10.htm3. "Optimising Return at the Programme Level: Through-Life Management", a paper for
APLS/CALS Europe 99, Tony Munton, IBM Consulting Group.4. “UK SMART Procurement Handbook”, http://www.mod.uk/policy/spi/handbook/front.
htm5. PDM Enablers - Joint Proposal to the OMG in Response to OMG Manufacturing Domain
Task Force RFP 1 - Doc mfg/98-01-01 - http://cgi.omg.org/cgi-bin/doc?mfg/98-01-01.6. ISO 10303 - Industrial automation systems and integration.7. AAP-20 - Handbook on the Phase Armaments Programming System (PAPS)8. "Implementing Total Quality Management" - Lesly & Malcolm Munro-Faure - Pitman
Publishing - 1992.9. The NATO Policy on an Integrated Systems Approach to Quality through the Life Cycle -
AQAP100-Ed3.10. "Supply Chain Management: Where Today's Businesses Compete" - By Bill Hakanson -
Supply-Chain Council - http://www.ascet.com/ascet/wp/wpHakanson.html.11. "A roadmap to change" - by B. Herreman - available from the NATO CALS office.12. "A new way of Working - Managing Defence Systems in the Information Age" - A
NATO CALS Publication. - June 1999.13. "Product Support for the 21st Century" - Report of US DoD - July 1999.

5-1
Life Cycle Costing in a Commercial Style Accounting Regimeas it Impacts U.K. MoD
Julian Burridge1
SPS/CF/DEV&POLMail Point 187, Elm 1b
DPA - MoDAbbey Wood, Bristol
BS34 8JHUnited Kingdom
SUMMARY
This paper reviews the drive towards commercial style accounting in the UK MoD and the requirements forlife cycle costing. It then discusses the thrust towards whole life costs and how this is defined in the UK. Themeaning of Cost Of Ownership, economic and financial appraisal is explained and what steps are required suchthat the various required outputs can be derived. Newly developed tools and processes are described that willhelp the MoD to realise the objectives of improving decision making and budgeting.
BACKGROUND
1. Way back in 1995 the UK’s Chancellor of the Exchequer issued a White Paper "Better Accounting for theTaxpayer's Money". In accordance with the White Paper, accounting and reporting changed for mostgovernment departments. From 2001 planning and control was to be on a resource cost rather than ‘just’ acash basis to get better visibility of consumption. This was introduced under the title of ResourceAccounting and Budgeting (RAB).
2. The main thrust was to introduce commercial style accounting, used by industry for many years, intogovernment organisations. However, the sheer scale of the Ministry of Defence's activities, the range ofpurchases, number of assets, their use and management, provides a huge challenge when introducingresource accounting. Indeed the National Audit Office’s Comptroller and Auditor General’s report2
showed that there were still areas of progress to be made.
3. All Governments Departments including the MoD will show year on year what has been achieved(outputs) against specific objectives and the costs of doing so. They will produce an Operating CostStatements, Balance Sheets, Cash Flow Statements, Main Objective Analysis, Output and PerformanceAnalysis. With the introduction of RAB, the Treasury wants MoD to focus on the cost of resources used asthey accrue and not just the cash spent in pursuit of the Department's objective(s) over a given period oftime.
4. What is more, the organisation needs to be able to measure the net worth of assets as part of the overallfinancial management. Assets are therefore re-valued annually and to make sure that these valuations arecorrect, every five years an independent review is undertaken (a 5 yearly review is currently underway atthis time that will value half a million items of equipment). This review identifies gross replacement costsemploying at least two different valuation methods.
1 The author is grateful for contributions from Duncan Barradale of DSTL and Wing Commander Barney Hubble of theDLO WLC IBT2 Report of the Comptroller and Auditor General on the Accounts of the Ministry of Defence : Departmental ResourceAccounts 1999-2000 issued February 2001
Paper presented at the RTO SAS Symposium on “Cost Structure and Life Cycle Cost (LCC) for Military Systems”, held in Paris, France, 24-25 October 2001, and published in RTO-MP-096.
5-2
5. Smart Acquisition (SA), formerly known as Smart Procurement, was introduced into the MoD followingthe Strategic Defence Review to emphasise a whole-life approach in requirement setting, procurementmanagement, support management, disposal and whole life costing. Projects are now managed byIntegrated Project Teams (IPTs) who are empowered to manage their projects whilst bringing together themain stakeholders. These IPTs are ‘suppliers’ of capability (usually by bringing into service new ships,aircraft etc.). They have clearly identified Capability ‘customers’ within MOD headquarters who providefunding and direction to the IPT for all procurement stages of the project life cycle. The EquipmentCapability Customer (ECC) is responsible for developing and managing a balanced and affordableequipment programme. To do this properly requires a high level overview of the Department’s whole lifecosts. A Second ‘Customer’ has responsibility for ensuring that the Directors of Equipment Capability(DECs) are provided with appropriate guidance on all components of delivering military capability. Theyalso have responsibility for defining outputs from the IPT and monitoring them, during the in-serviceproject stage. In SA there should be a greater willingness to identify, evaluate and implement effectivetrade-offs between system performance, whole-life costs, annual cost of ownership and time.
6. All of the above impacts life cycle costing because financial analysis on a RAB basis introduces a numberof challenges. To operate effectively there needs to be an understanding of all budgets impacting platformson a regular and consistent basis.
COMMERCIAL STYLE ACCOUNTING
7. Cash accounting provides only a simplistic view of the financial position. To trade off betweendepartments and agencies requires information that can only be provided by full resource accounting sinceit allows managers to take a broader view of their finances. It also allows them to assess more clearly thefinancial implications of their plans and operational decisions. A ‘notional’ charge, Interest On Capital(IOC), currently at 6%, ‘encourages’ groups to reduce their holdings and transfer ownership of assets asquickly as possible to the user. Users need to identify surplus items to reduce their IOC costs and accrualaccounting means that costs are accounted for when committed not when bills are paid (naturally billpayments are still important so both are recorded). The Government will, in due course, controlDepartmental (including MoD) spending on a RAB basis.
TERMINOLOGY: LIFE CYCLE COSTING, WHOLE-LIFE COSTING, COST OF OWNERSHIP,TOTAL OWNERSHIP COSTS
8. Life Cycle Costing has been used for many years to describe the process by which costs associated witheach phase of an equipment’s life, development, procurement, operation, support and disposal are broughttogether to address questions of ‘best buy’. Affordability however was judged against cash budgets that, byand large, were set for periods far less than the anticipated lifetimes of equipment. Currently the equipmentprogramme covers 10 years in detail while the Short Term Plan (in RAB format) only looks forward 4years.
9. When RAB was introduced it was anticipated that full cost communication would be achieved. Once allcontributors to the costs of acquisition were known, direct costs (e.g. buying the equipment and spares)plus attributed costs (e.g. share of dockyard facilities, Service manpower etc.) could be combined. Thesecosts, because of the inclusion of ‘indirect’ (to specific fighting equipment) elements, are considered to be‘whole life costs’. In other words they would represent closer to 100% of the attributable, to a capability orequipment, costs. By combining the ‘attributable’ elements the cost of role capable force elements couldbe determined. Unfortunately this can not be currently achieved in an automatic process through thefinancial system which reports costs ‘vertically’. Each budget holder, in an organisation, reports costs‘upwards’ but not necessarily their contribution to equipment or force elements. To do this a number ofinitiatives have been put in place and the following paragraphs discuss these.
10. In the Defence Procurement Agency a computer tool set called ASPECT (A Set of Performance EnhancingComputer Tools) enables procurement teams to manage their projects. It is an integrated package ‘glued’together from Commercial Off The Shelf (COTS) Tools like Oracle Purchasing. One of the latest releases(Release 4), the finance package, allows IPTs to manage their equipment costs on an accruals and cash

5-3
expenditure basis. As such it allows for the allocation of resources to work breakdown structures andrecords both accruals and cash expenditure. At present ASPECT is rolled out to the teams in DPA but it isanticipated that it will be made available to in-service project teams once funds are made available. Ascreen from Cost View is shown below.
11. The Total Ownership Cost (TOC) concept as produced by NATO group 63, seeks to widen the scope andcoverage of costs rather like COO but (naturally) not including the UK approach to financial reporting.
12. In the UK therefore Whole-Life Costing can be thought of as an umbrella process for all the activities suchas budgeting, investment appraisal, decision support etc. that require a life cycle costing exercise. Cost OfOwnership which is consistent with RAB will provide a summary of life cycle costs by platform, fromwhich affordability can be assessed. It is therefore planned to be the primary metric used to for newprogramme approvals and current (in-service) equipment projects.
INTRODUCING COST OF OWNERSHIP
13. The UK have set out to satisfy these requirements by using the annual ‘Cost Of Ownership' (COO) as thepreferred WLC metric as it allows an annual, comparable measure of performance as well as theconstruction of a lifetime cost figure. The main benefits of forecasting, monitoring and managing COOfrom ‘prediction to actuals’ is that it contributes to the optimisation of military output by improving theDepartments view of the overall costs of proposed solutions to meet military capability. It should improvethe assessment of affordability through-life, leading to more informed decision-making. It should alsoenhance the Department's ability to make decisions - trading-off cost, time and performance betweenindividual equipment projects within, or across several, capability areas.
3 NATO GROUP 6 Specialist Team on Ship Costing
5-4
THE ORGANISATIONS INVOLVED
14. Since the majority of whole life costs are expended in the operation and support phase of a programme theDefence Logistic Organisation have taken the role as ‘Champions of WLC’. Working under a Whole LifeCost Steering Group the community is working towards improvements in methods and tools. The WLCIntegrated Business Team is charged with introducing the COO methodology over the next 18 months andthe largest MoD equipment projects will be reporting their through life COO in the Major Projects Reportfor 2002 onwards. SPS as part of the Defence Procurement Agency supports project teams and Centrecustomers with Combined Operational Effectiveness & Investment Appraisal (COEIA), investmentappraisals, modelling and budgeting. The Defence Science and Technology Laboratory (DSTL) AnalysisGroup help the ‘Centre’ i.e. central customer, with studies to address such issues as balance of investment(e.g. the right mix of Unmanned Air Vehicles (UAVs) and ground based surveillance vehicles).
TECHNICAL ISSUES
15. Life Cycle Costs have been considered key to procurement decisions for many years in a number ofNATO countries. Whilst resources in terms of people and cash were considered, often only the marginal(difference) costs between options have been considered. Firstly, because of the practical need to set asidesufficient funds to pay industry for Tanks, Aircraft and Ships and the spares and maintenance required tosupport them. Secondly because Defence Ministries are large organisations it has been difficult to gatherdata on resource consumption or communicate costs effectively between budget holders.
16. Economic Appraisals undertaken by Government bodies such as MoD, ‘are concerned with the well-beingof the country’4. As such they address opportunity costs (alternative use of assets or resources) but notsimple transfer payments such as taxes (e.g. Value Added Tax) that ‘move around’ the economy.Economic analysis may be simply summarised as addressing the costs and benefits of options to ‘UK Ltd’and is not, necessarily, therefore concerned about precisely which part of the Department’s budget isimpacted. Any common costs not impacting the decision may be excluded to simplify, and hence reducethe costs of, the exercise.
17. Financial Appraisals however include all cash flows and transfer payments and hence assess affordability.In the UK, Cost Of Ownership will provide this viewpoint. In financial appraisal, costs need to be split bybudget holder, so they know their contribution, by phase to understand the significance over the life cycleand by major ‘input’ cost category (manpower, stocks purchased, in year expenses etc).
18. Provided that in any assessment of options there is an affordable option (comparing COO for the new andexisting capability will provide this check) then the IA should be able to identify any alternatives that offerbetter value for money. In the UK the primary means of distinguishing between options is costeffectiveness. The chart below shows four options with point estimates and ellipses that representuncertainty in the costs and effectiveness forecasts.
4 Joint Services Publication number 507 : MoD Guide to Investment Appraisal and Evaluation

5-5
0
10
20
30
40
50
60
70
80
90
100
0 50 100 150 200
COST IN £M
Effe
ctiv
enes
s (%
)
Option 1
Option 3Option 2
Option 4
Requirement
Budget
19. Like industry the MoD will continue to use both economic and financial appraisal techniques.
REQUIREMENTS FOR TOOLS AND PROJECT PHASES
20. The move to Cost Of Ownership will help to provide data on existing platforms and hence informmodelling. To support the initiative new tools and approaches have or are being developed. They need tobe directed and designed at the whole life cycle of equipment and capability.
21. Early in the project life cycle, studies need to address the capability gap, the numbers of equipment orplatforms required and the technologies that can help to fill the gap to offer best value for money. Thisrequires strategic cost models that can provide a capability to look at the ‘big picture’.
22. Once a project team has been formed and given a user requirement, the focus turns to the performance,cost and time envelope of various options that will meet the requirement. Forecasts of costs for newequipment and platforms are needed. This requires models that have a holistic view and can provide a‘what if’ capability.
23. When the preferred option is identified, industry is generally asked to compete for its supply. Assessmentsof these bids are based on life cycle cost analysis and need to address economic and financial treatments.Cost figures need to compliant with rules on Investment Appraisal set out by the Treasury and at the sametime provide the data by which budgets can be agreed for the long term operation and support of the assets.
24. For in-service equipment a forecast of the costs for the remaining life are required. Whilst any in-serviceequipment, not nearing the end of its service life is generally considered to be in the middle of the‘bathtub’ in respect of reliability, major cost drivers are driven by ‘change milestones’ caused by eventssuch as overhaul, deployment, updates and safety reviews. Towards the end of equipment life, ageingeffects may increase support costs or reduce availability. Not all equipment goes out of service on aparticular date so phasing out expenditure depends on the introduction profile of new equipment orcapability. Delays to new equipment can result in extra funds being required to continue support of legacyequipment. The following are necessary considerations to establish the nature of each cost element whenmaking the forecast:
Is it?
• Substantially constant regardless of operation and support volumetric changes• Simply related to operation and support volumetric changes (may use scaling factors)• Complex relationship due to changing patterns and cost drivers over time (e.g. maintenance concept
changes, ageing effects, etc.)
5-6
• Periodic, event driven, recurring or non recurring (e.g. mid life updates, refits, deployment changes,peace keeping etc.)
• Changing over time (e.g. ageing)• Step changes (macro economic impacts)
OUTPUT (ACTIVITY) COSTING AND INPUT COST CATEGORIES
25. The number of potential activities performed in development, production, operation and support etc. maybe considered almost infinite e.g. Prototype manufacture, Maintenance at 1st line, Basic Training, PostDesign Support, Storage, Recruitment etc. In the UK a generic Cost and Resource Breakdown Structure(CRBS) has been promulgated to provide a consistent set of activities for equipment cost forecasts.
26. In support based organisations, overheads are often a major part of the total cost (as they now are inmanufacturing). Any traditional costing system which recovers overheads only in proportion to directlabour costs or time may be of limited use as a management tool because activities other than direct labourmay be more closely linked to the generation of costs. In Activity Based Costing (ABC) costs are linked toproducts via the most appropriate ‘cost drivers’ not solely by direct labour. Once Activity Based Costing isfully operational it may prove possible to generate cost drivers from this data.
27. Contributing elements of input cost (i.e. resources consumed in producing the activities) can be reduced tojust 9 categories.
• Manpower expenditure (internal staff)• Payments on contract• Development expenditure and intangible assets• Assets in the Course Of Construction (ACOC)• Other fixed assets• Capital spares purchase (e.g. spare aeroplane engines)• RMC (Raw Materials and Consumables) GWMB (Guided Weapons, Missiles and Bombs) purchase• Stock and RMC purchase• Other expenditure
28. To enable COO figures to be compiled therefore, translations between activities and input cost categoriesneed to be achieved. Whilst in many cases, this is a reasonably mundane exercise, a number of activitiesare a combination of various cost inputs.
TOOL SETS
29. This part of the paper will cover tools that can assist in the process and will describe/demonstrate theiroperation and applicability to project phase.
30. COO TEMPLATE. This is used as a depository of costs from various sources and allows a CostOf Ownership to be compiled for complete platforms and Force Elements. These include Activity BasedCosting (ABC) Output costing tools and direct user entry from business plans etc. The screen shot belowshows a data entry screen for Flag Officer Surface Flotilla’s contribution during the CADMID phase ofManufacture to (say) Type 42 Destroyers.
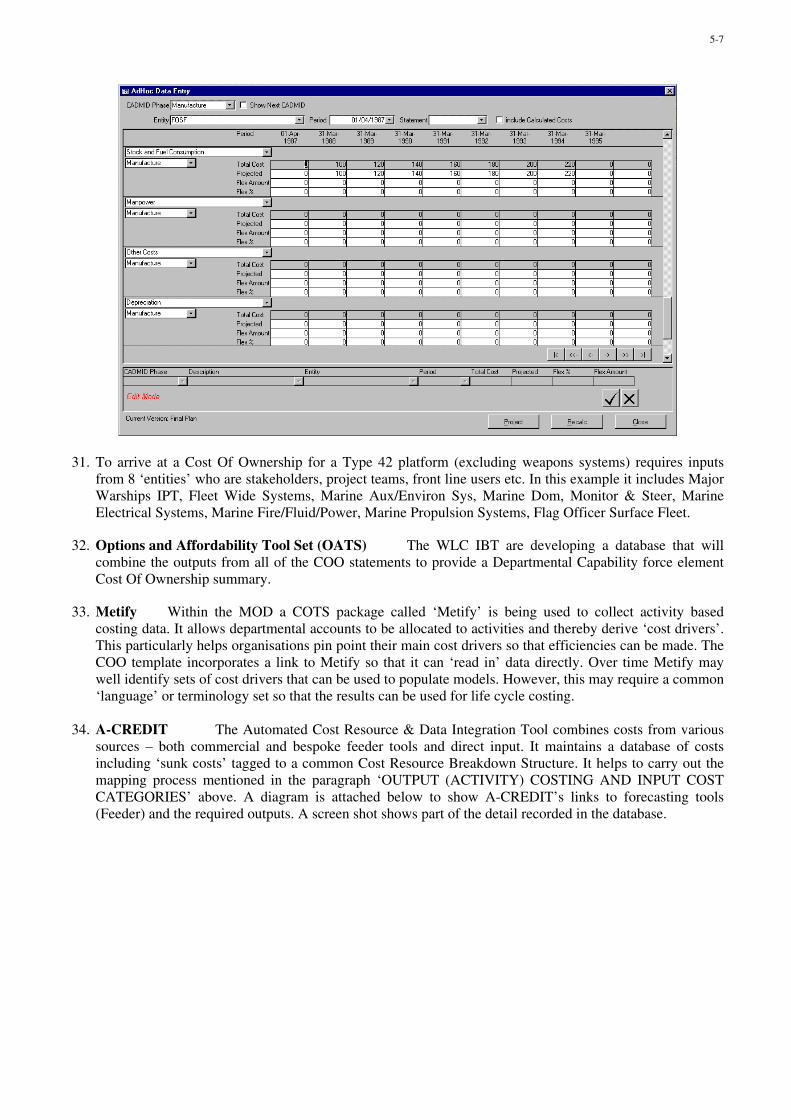
5-7
31. To arrive at a Cost Of Ownership for a Type 42 platform (excluding weapons systems) requires inputsfrom 8 ‘entities’ who are stakeholders, project teams, front line users etc. In this example it includes MajorWarships IPT, Fleet Wide Systems, Marine Aux/Environ Sys, Marine Dom, Monitor & Steer, MarineElectrical Systems, Marine Fire/Fluid/Power, Marine Propulsion Systems, Flag Officer Surface Fleet.
32. Options and Affordability Tool Set (OATS) The WLC IBT are developing a database that willcombine the outputs from all of the COO statements to provide a Departmental Capability force elementCost Of Ownership summary.
33. Metify Within the MOD a COTS package called ‘Metify’ is being used to collect activity basedcosting data. It allows departmental accounts to be allocated to activities and thereby derive ‘cost drivers’.This particularly helps organisations pin point their main cost drivers so that efficiencies can be made. TheCOO template incorporates a link to Metify so that it can ‘read in’ data directly. Over time Metify maywell identify sets of cost drivers that can be used to populate models. However, this may require a common‘language’ or terminology set so that the results can be used for life cycle costing.
34. A-CREDIT The Automated Cost Resource & Data Integration Tool combines costs from varioussources – both commercial and bespoke feeder tools and direct input. It maintains a database of costsincluding ‘sunk costs’ tagged to a common Cost Resource Breakdown Structure. It helps to carry out themapping process mentioned in the paragraph ‘OUTPUT (ACTIVITY) COSTING AND INPUT COSTCATEGORIES’ above. A diagram is attached below to show A-CREDIT’s links to forecasting tools(Feeder) and the required outputs. A screen shot shows part of the detail recorded in the database.
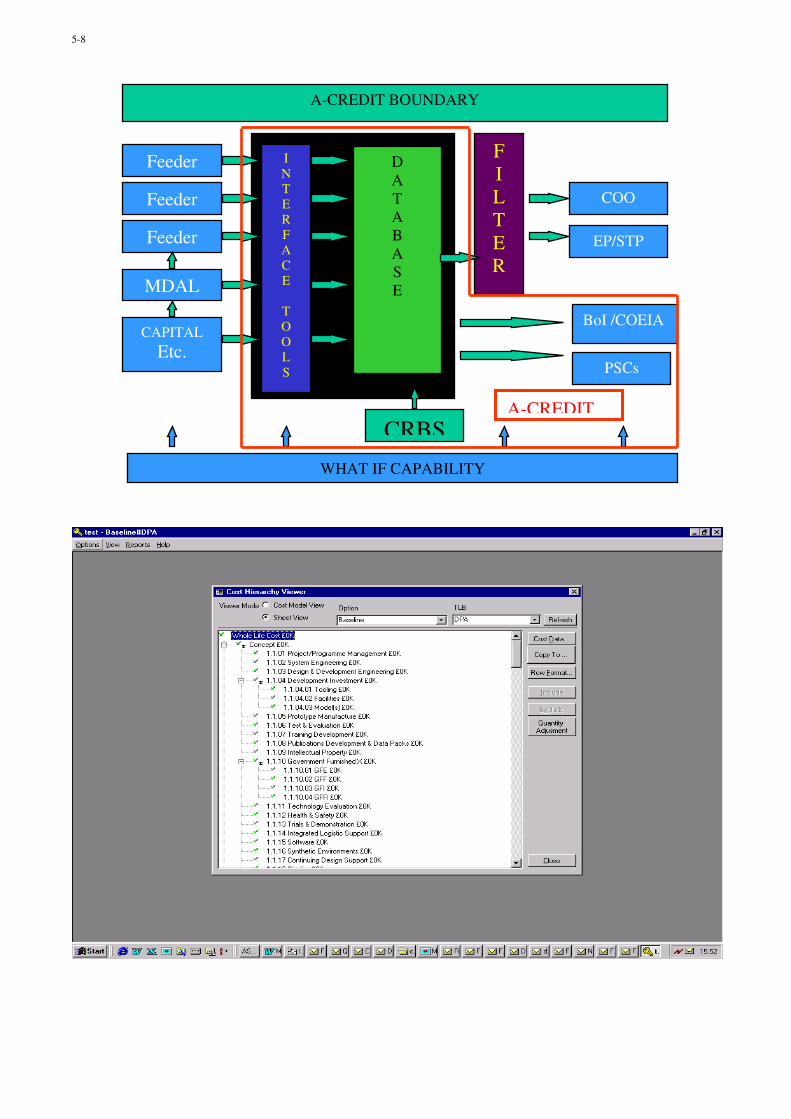
5-8
A-CREDIT BOUNDARY
Feeder
Feeder
Feeder
CAPITAL
Etc.
MDAL
INTERFACE
TOOLS
FILTER
DATABASE
CRBS
BoI /COEIA
COO
EP/STP
PSCs
WHAT IF CAPABILITY
A-CREDIT
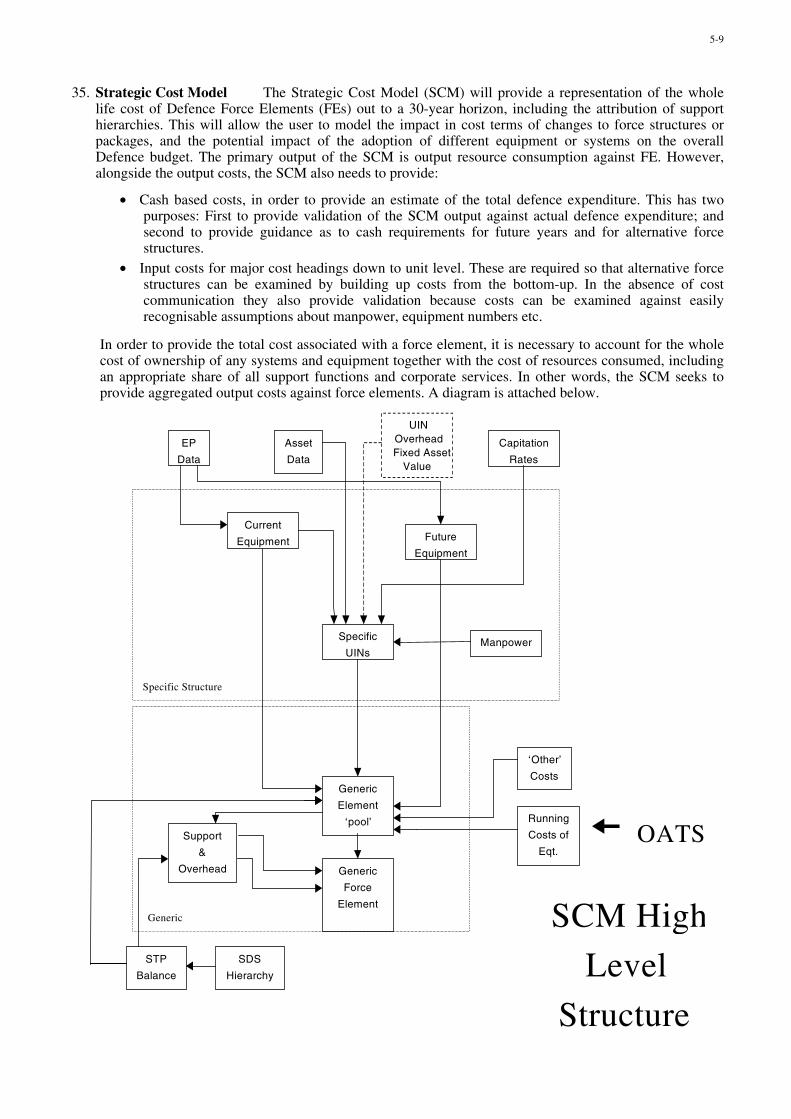
5-9
35. Strategic Cost Model The Strategic Cost Model (SCM) will provide a representation of the wholelife cost of Defence Force Elements (FEs) out to a 30-year horizon, including the attribution of supporthierarchies. This will allow the user to model the impact in cost terms of changes to force structures orpackages, and the potential impact of the adoption of different equipment or systems on the overallDefence budget. The primary output of the SCM is output resource consumption against FE. However,alongside the output costs, the SCM also needs to provide:
• Cash based costs, in order to provide an estimate of the total defence expenditure. This has twopurposes: First to provide validation of the SCM output against actual defence expenditure; andsecond to provide guidance as to cash requirements for future years and for alternative forcestructures.
• Input costs for major cost headings down to unit level. These are required so that alternative forcestructures can be examined by building up costs from the bottom-up. In the absence of costcommunication they also provide validation because costs can be examined against easilyrecognisable assumptions about manpower, equipment numbers etc.
In order to provide the total cost associated with a force element, it is necessary to account for the wholecost of ownership of any systems and equipment together with the cost of resources consumed, includingan appropriate share of all support functions and corporate services. In other words, the SCM seeks toprovide aggregated output costs against force elements. A diagram is attached below.
EP
Data
Current
Equipment Future
Equipment
Asset
Data
Specific
UINsManpower
Running
Costs of
Eqt.
Generic
Element
‘pool’
Generic
Force
Element
SDS
Hierarchy
STP
Balance
Support
&
Overhead
UINOverheadFixed Asset
Value
Capitation
Rates
Specific Structure
Generic
‘Other’
Costs
SCM High
Level
Structure
OATS

5-10
CONCLUSION
36. Introducing commercial style accounting into life cycle costing is not going to be a simple process.However some good progress has been made and this paper shows some of the newly developed tools andtechniques that will support the process. It is recognised by all concerned that there is a substantialinvestment in training, tool support and resources to operate and maintain the databases and systems put inplace. However, despite the large size of the Department much progress has been made whilst, at the sametime, realising savings in internal operating costs expected from the taxpayer as a result of the ending ofthe cold war, the so called ‘peace dividend’.
British Crown Copyright August 2001
The views expressed are those of the author and do not necessarily represent those of the UnitedKingdom Ministry of Defence
6-1
Cost Estimating and Forecasting in theNew Era of Smart Procurement
Dr Brian John HiltonSenior Lecturer
Cranfield UniversityRMCS, Shrivenham
Swindon, Wilts SN6 8LAUnited Kingdom
Tel. 44-1793-785456Fax. 44-1793-785771
Abstract
This paper reports on research 1on the future cost estimating and forecasting challenges facing defense andaerospace. It shows that cost estimation is now a critical and changing capability for the UK Aerospace and Defenseindustries. As defense changes and downsizes projects are more infrequent, more risky, more dependent on newprocesses and support systems all less permissive of high error rates and profit margins. MoD and industry areresponding by restructuring their processes, focussing on new business opportunities and widening the scope of costinformation and support. Critical to this is support for Integrated Product Teams (IPTs) in estimating trade-offsbetween design and supply chain and ownership costs.
Our work suggests significant added value from joint research by academia and industry. Traditional techniques forusing data in Cost Estimating Relationships (CERs) do not take into account the simultaneous interaction betweendesigning to deliver a particular through life capability to an available budget when one is willing to trade-offaffordability against capability, reliability and support costs.
Our work explores the potential of best commercial practice in production and distribution to contribute to lowercost military capability. Strenuous efforts are being made on this, “smart procurement”. If successful this will havea significant impact on cost and so estimating.
Our work distinguished between three levels of impact by:-
1) utilizing modern international distributional networks available to all2) using modern "lean" techniques within organizations3) introducing new production process and materials
If defense manufacturing could work on a shorter cycle of flow based procurement, say over 5 to 10 years, thingscould change dramatically. The current cycle is 15-20 years using batch procurement. This batch procurementcycle has high initial costs followed by considerable inventory, updating and sustainment costs. Best moderncommercial procurement practice requires a flow of frequently purchased reliable equipment requiring less in-service support. Could this be achieved in defense? Until now no investment has been made in the costingresources to test this hypothesis. We provide a theoretical basis for doing so
However, defense departments are monoposonistic buyers driven by political and military, not commercial,imperatives. It is thus difficult to envisage how they can access all the benefits of commercial practice. The paperconsiders the potential impact in principle of these methods on defense procurement costs and so estimates. It thenhypothesises on the means by which the results desired might be achieved given the described constraints. A lack ofhistorical defense data on the impact of these methods is a barrier to defense based research. The consequence is
1 conducted over 1999-2000 for the UK MoD and the UK Engineering and Physical Sciences Research Council (EPSRC)
Paper presented at the RTO SAS Symposium on “Cost Structure and Life Cycle Cost (LCC) for Military Systems”, held in Paris, France, 24-25 October 2001, and published in RTO-MP-096.

6-2
that estimators have to use commercial analogies. These then have to be modified to recognize the non-competitiveness of the defense context.
Specific new areas of research suggested by all this would be:
1) The extent to which commercial practice can work in military procurement;
2) To model the impact of processes on cost, as opposed to capability on cost;
3) The support implication of Commercial Off The Shelf (COTS) components and systems
INTRODUCTION
The private commercial sector is adopting new approaches to the management of design,development and production. These have led to new product and process technologies. These useand produce value within a new revolutionary framework. This crucially impacts on cost (Delbridge,and Lowe, 1996). Can it be applied to defense? If so, how will this impact on defense costs and socost estimating? This paper sets out to answer these questions.
In commerce one does not have to contend with defense’s endemic and extensive systems integrationproblems. One also does not have its peculiarity of politically driven monopsonistic demand. A keyissue for defense today is thus the extent to which it can adopt best commercial practice and cut costsdespite these barriers to its use. The benefits achievable in the wider industrial context are alreadyevident (Womack and Jones 1996). They are considerable as a consequence of faster developmentand more capability deliverable per dollar. However can one expect these benefits to be fullyachievable in defense given its technical and socio-political context? The present administration isthe US’s DoD clearly believes they can (Cohen, 1997).
The approach used is prevalent throughout the Atlantic community. It has acquired the name “SmartProcurement” (SP). This exploits what in commerce has become the philosophy of “leanproduction”. This seeks to lean out production costs by auditing productive activity against thecriteria set by the value it adds for the final customer. The argument is that if an activity does notadd such value then it should cease. In defense the value added is the state’s wish to maximize itspotential to use lethal force per dollar spent to legitimate political ends.
Philosophically and practically “lean production” requires customers’ demands to pull productiondown through a well specified energy minimizing flow of activities. Each should add customervalue. There should be no local accumulation of energy absorbing stock. This is distinct fromsupply driven systems. These achieve economies of scale by pushing production up through asequence of costly energy batch processes designed to maximize the rate of flow through each
So as to minimize unit processing costs. This is only achievable at the expense of large pools ofstock waiting for processing at the rate are required to minimize processing costs within each stage.To achieve its ends SP must therefore ensure it:
1) Creates a steady flow of demand not infrequent, stock creating, batches of it.
2) Adds value to politically useful military operational capability in each procurement stage:research, development, manufacture, use and disposal
To achieve these SP has to be integrated with the operational context in which the materiel of warwill ultimately be consumed. It therefore needs to synchronize procurement with the needs ofmilitary operations across the envisaged spectrum of possible conflict.

6-3
In effect this means that SP, like the "battle space" it is now envisioned supporting by the"Revolution in Military Affairs"(RMA), needs to be based on the integration of systems across. Thisis what we might call the "battle-sphere": the weapons systems and their users, the battle-space inwhich they are used in conjunction with other systems and the industrial, research and social systemsthat enable all this to occur. In the defense industrial context supporting the RMA it is thus essentialthat the design, production, storage and disposing of weapons systems optimizes political-militaryvalue across their whole life cycle.
This paper sets out to categorize the changes catalyzing SP and highlight their potential impact oncost. It will consider also their likely rate of propagation given current constraints and defense’scapacity to ease them. Our focus is the agenda thus implied for cost estimating professionals. Theevidence used is all in the public domain. This seems to indicate that the historical cost base onwhich current estimates are constructed is fast being eroded. This means the profession has todevelop new approaches, it is, but are they coming on fast enough?
The whole basis of SP is that costs can be cut using commercial sources and methods particularly ifdefense accepts commercial not military specifications. Then “Commercial Off The Shelf” (COTS)“Dual Use” technology can be exploited. Then it is argued the commercial sectors, for its ownbenefit will absorb a significant proportion of development costs. We shall explore whether this is areasonable expectation?
Lean manufacturing and distribution networks encapsulate the philosophy of “lean thinking”commerce uses to achieve the described ends (Womack and Jones 1996) This incorporates Just inTime logistics (JITs), low inventories, zero delivery defects, flexible small batch production and soco-operation throughout a supply chain where products are designed not only for use but for limitingthe consumption of non-renewable raw materials, manufacture, reliability, ease of servicing andultimately disposal. This requires the chain from raw material extraction to re-use or disposal as asingle system over which all costs should be minimized no matter by whom born (McDuffle andHelper, 1997). A key issue for this to be achievable is incentive. The pay-off may be in one part ofthe network but additional costs in another. These network components are likely to be underdifferent ownership and so control.
The distributed processing and flexible military fighting procedures on which the RMA is based arefundamental to this paper. The digitized battle-space brings changes doctrinally and technically.These challenge the cost estimator even before we look into the process of manufacture and supply.Integrated "Command and Control" C2 makes it possible to economize on one platform’s capabilityby using the capacity of another. To this can be added stealth and total battlefield visibility.Together these create a huge increase in military productivity allowing the use of massive destructivepower from a safe platform of action, e.g. Apache Longbow. This complicates cost and operationaleffectiveness analysis not least by hugely increasing the logistic burdens required to sustain thefighting power now capable of deployment.
This new battle-space is more sparsely populated with human beings. This has deep implications forthe nature of warfare and so costs. We can now take people away from many of the hazards of war.These lower costs by eliminating the need for the protection currently built into each platforminvolved in combat. This is already reality for reconnaissance with the increased use of drones.
It is now possible to make a choice as to whether target acquisition, or even attack, should bemanaged on or off a weapons platform. It is envisaged that an army unit could lay of an attackinstantaneously to an, artillery battery, a helicopter, a fixed wing aircraft, a ship's guns a few miles ofthe coast or a submarine based cruise missile 500 or 600 miles way. This has significant implicationsfor the wider international marketability and so cost sharing possible for a weapon system. Aweapon system that relies on expensive centrally provided off-platform command, control, guidanceand computation or acquisition technology will not be widely affordable. For example on the joint
6-4
US UK JASF a US design decision that increased its weapons load at the expense of onboardcommand and control would leave JASF’s other customer, the UK, with a problem. Have a platformonly useable in a combined US/UK operation or accept a bill, financial or military, to integrate UKSTA technology onto a consequently less lethal platform.
These operational implications of new technology should be seen in conjunction with the problemsfor the SP concepts of evolutionary development based on incremental technological insertion.
The idea is that this would allow military technology to stay in step with the now faster advancingcivil, COTS, technology. SP seems to believes that technology insertion and so the incrementallyprocurement of capability can be achieved at the same time as one lengthen the time a platformconcept remains in use. This lessens technological risk. It also spreads development and set up costsout over time and more extended, but individually smaller, production runs. This attenuatesestimating errors. Error bounds grow exponentially on extrapolation. In IT product life-cycles are aslittle as eighteen months. Technological and therefore cost extrapolations can then be limited to asimilar period.
In the described circumstances it is clear that costing by analogy must be problematic. First if defensehas not yet used a commercial practice no direct historical basis exists in defense from which toconstruct an estimate. Second if commercial data were used directly the very different marketstructures from which it springs must throw doubts on its defense relevance.
With no "actual" costs to measure estimates must use analogy. There are four bases for this. Eachhas virtues. Each has problems. They are: -
1) the past,
2) experience elsewhere,
3) a plan extrapolating from the former two,
4) creative vision not evidently rooted in experience.
Our argument suggests that future cost estimates can be based only on the last. This requires thesimulation of the processes of production, distribution and war fighting, i.e. "syntheticenvironments." However these are rarely created from imagination they are generally embedded in asubstantive matrix of practice. These model what might be possible as opposed to what isdemonstrable so. Research exists on this in the USA 2.
In thinking about cost in the holistic imaginative way we have described acquisition costs clearly cannot be separated from other costs up and down stream. However even when taking this very broadbrush view of a project envisaged one would still have failed to take account of significant costs. Onecould wrongly consider acquisition in isolation from other costs. Many of the changes we haveoutlined are not found at the level of project costs nor even in the historically evident overhead of theorganizations in which it is embedded. Significant socio-economic changes, effecting costs, are alsooccurring at the industrial and infra structural level. We thus have to consider the effects of thechange described on the cost environment at three levels: societal, the enterprise and the project. Wewill deal with each in turn.
First there exists an increasingly sophisticated global network of industrial support activity providingfinance, research and development, design, production, distribution and marketing for all types ofproducts and enterprises. We need to consider the impact on defense project costs of this increasinglysophisticated low cost global commercial support infrastructure.
2 NASA is funding a cost estimating project based Weaks and Barrett (1998).
6-5
Second defense production is increasingly a process where the key inputs are produced by manydistinct entities. The final result is merely integrated together by one, in the defense case, the “primecontractor”. The delivered result is thus produced by a secondary, “virtual”, organization for whichthe prime contractor is merely the impresario.
Thirdly we need to take cognizance of the impact of new materials and production and developmentmethods on directly attributable project cost.
This paper considers the impact on cost of change at each of the above levels. After consideringthese it takes cognizance of the extent they can penetrate defense. We then consider what barriersexist to their implementation in defense and how these can be lowered before exploring theirsignificance for estimating. Japanese companies led by Toyota 3 have demonstrated that all this canwork. In the defense context we have to ask: -
1) Are there defense examples that can form the basis of estimates?
2) Will the new destroy the estimating utility of existing knowledge?
3) Will "smart procurement" lead to a seamless join between commercial and defense practicemaking analogies from commerce sufficient to defense need?
Even the strongest advocate of SP could not expect affirmative answers to all of these. Amonopsonistic buyer, such as a defense department, dealing with a few large prime contractors, cannot put itself in a position analogous to that pertaining in a commercial competitive market. If itcould, cost estimating would be an irrelevance. The best estimate would be market price. We arethus left with the question of how one might adjust analogues from the commercial world, based onlean manufacturing and JITs experience, to the monopsonistic reality of defense
THE IMPACT OF INFRASTRUCTURE CHANGE ON COST
General Nature of Infrastructure Changes
The impact of infrastructure change on the costs of commodities such as food, clothing, cars and IThas been large.4 The INTERNET and associated e-commerce are fundamentally changinginfrastructure costs forever.
The word processing system and computer on which this paper is written is indicative of suchbusiness process changes. An icon at the top of the page can be clicked to allow what is written to beinstantaneously transmitted across the world using the modem card inserted into a slot at the side ofthe machine. This electronic communication is cheaper and incomparably faster than the mail itreplaces.
The technical limitations to the universality of its use are slight. Inexpensive truly mobile phones donot yet exist but soon they will. However even now an oilman working a field in Siberia, twohundred miles from a phone line, can have a daily satellite video conference with his partners onWall Street regarding their customers demands that day. This determines how much oil he pumps.Oil need only flow from the well head when such demand “metaphorically” pulls it from the ground.This obviates the need for extensive tank farms at wellheads, ports, oil refineries and deliverycenters.
The global co-ordination of production and distribution now possible eliminates the need forsignificant stock. This includes that in the process of distribution, i.e. in large expensive high-risk oil
3 “The Machine that Changed the World”, Womack, Jones, & Roos (1990).4 In defense jargon, multi-layered Integrated Logistics Support (ILS) is fundamental to best practice.
6-6
tankers. Such infrastructure change has a dramatic impact on cost and choice. The competitivepricing it ensures lowers costs further. This creates an even greater demand for variety of types,means, sources, and quality of supply.
The commercial distribution and electronic data interchange systems making such value addedpossible is too expensive for states to replicate. United Parcel Service’s (UPS) aircraft fleet is thebiggest in the world. They are major truck and warehouse owners. Their volume of business ensuresunit costs lower than anything achievable even by government
Good in-house orchestration of logistics can produce world beating competitive advantage. One caseis that of Caterpillar’s success in its fight for market dominance against Komatsu of Japan (Bartlett,1991). Komatsu set out to beat Caterpillar in the supply of large construction machines; comparablein their chassis and power trains to the heavy armor used by the military. Arguably Komatsu'sequipment became as good, or even better than Caterpillar's. However they did not displaceCaterpillar from its lead position. Caterpillar had and has a highly effective distribution chain. Thisintends that spare’s be deliverable anywhere on the surface of the globe occurs within 48 hours.Civil engineering contractors faced with hefty penalty clauses or oil companies not pumping oil cannot afford unavailable equipment. Komatsu has failed to match this service and so has failed todisplace Caterpillar from its lead.
Caterpillar’s success has not escaped the attention of others: for example the UK company LandRover. Their commercial market place overlaps Caterpillar’s. They now use Caterpillar’sdistribution system. In commercial games of war, errors may not lead to death but they can causebankruptcy.
Commercial survival now depends on design trading-off and the cost of after-sales support.Komatsu's failure to overtake Caterpillar underlines this.
Modern supply and distribution allows one to operate wherever in the world it is best to do so. In thelimit with stabilized demand one need carry no stock outside that in the delivery pipeline and onlymanufacture products in response to specific demand. This requires a new approach tomanufacturing, “lean manufacturing” - the topic of section 4.
However for such technological advance to be sustained at the rate now evident requires processcontrol concentrated in a few suppliers, e. g. UPS, INTEL and Microsoft. They achieve scaleeconomies (volume over time) and scope (volume over space) leveraging low unit costs sustained bya steady pull of demand. This supports the huge initial investments in IPR, people, plant andequipment corporations like INTEL, Microsoft, UPS and Caterpillar need.
To minimize risks such companies take an incremental approach to product development. The aim isa payback period of not more than 2-3 years. A developmental revolution is not possible on such alife cycle. Intel’s 84X86 series of microprocessors and Microsoft’s MS-DOS/ Windows series areboth examples of the benefits of such evolutionary development.
The Impact of Infrastructure Induced Change on Defense Costs
The infrastructure changes described impact on costs in many ways, including the cost of costing5.Software production is now geographical dispersed. The DOD's "Defense Reform Initiative"(Cohen, 1997) insists the US government use UPS and Federal Express' systems in preference to itsown.
Part of the recent administrative reforms of the US DoD has encouraged the materiel commands ofall three services to base much of their procurement systems on "electronic commerce" (Cohen
5 The author is aware of a small consulting firm exists producing software cost estimating tools, one partner lives nearDanebury, USA, one in Brighton, and an other in Munich.
6-7
1997). This allows orders to be sent direct to suppliers. They then deliver direct to military units.This saves on DoD owned storage and distribution systems. A recent paper6 indicated cost savingson retail stock (about 1/12 of DoD stocks) of $40 for every $1 spent on UPS or FedEx.
For defense to access these advantages it needs to use Commercial Off The Shelf (COTS) items. Oneconomies of scale grounds alone these can be so much cheaper than tailor made defense items thatthe argument for COTS is compelling. It is already accepted as the source of many electroniccomponents.
Cost and Security Limitations to the Use of Infrastructure Change in Defense
However, adapting COTS to defense can be more expensive than working to a defense specification.COTS also raise security issues on two counts, security of information and security of supply.
On the latter consider the case of DOD’s use of UPS or FedEx. This does not compromise the US’snational security. These suppliers sustain most of their substantial assets and staff on US territory.In the event of war these can be requisitioned and conscripted. A small country wishing to ensure itcan control its distribution and supply system in war may wish to deny defense access to such anapproach. The result is then likely to be lower quality and higher costs.
On the former information security is costly, e.g. vetting, firewall construction, etc. Even without thisdefense might wish to deny itself access to cost effective practices used by commercial softwarefirms, e.g. outsourcing to India. In addition the technical challenges in the commercial sector arenow significant so increasingly high quality staff now often choose commercial over defense work.
Possible Actions to Exploit the Benefits of Such Changes Without the Costs
In total war, reliance on traditional systems must be in doubt. Arguably they trap defense into usingexpensive outmoded systems that may now be penetrated, or out performed, by cheaper commercialones. As indicated in the absence of direct action to the contrary, generic commercial componentsare now so much cheaper that it is hard to avoid incorporating them in military systems. Thisgenerally puts defense costs on the same downward trend observable for production generally.
In operations less than war the practical advantages of such systems may outweigh their securitydisadvantages. In the Gulf War PCs were bought off the shelf. In Bosnia commercial trucking isused regularly and the American’s have used commercial communication systems.
THE VIRTUAL ORGANISATION AND COSTS
Introduction
Systemic thinking also impacts on the organization of production, the key idea being the "virtualorganization". This is manifest in the role now seen for prime contractors.
The globalising business process linking distinct production capacities together, as already described,underpins the “virtual organization”. Cheap physical distribution coupled with highly efficientcommunication makes a widely distributed stockless network of manufacturers possible.
The Virtual Organization A Simple Example
Illustrative of this is the portable computer this paper is produced on. This was “made available” bya Taiwanese company, Twinhead. It was assembled and distributed in the UK. The screen wasproduced by Cirrus Logic in the USA, the hard-drive by Toshiba in Japan. The floppy was made inTaiwan and the modem in the USA by Apex Data. The microprocessor is an INTEL Pentium
6-8
manufactured who knows where. The mouse is made in Mexico. The software comes from all overthe world but is integrated by Microsoft of Seattle USA.
Twinhead may or may not conceive of this package. However, they are the impresarios delivering it.The machine was ordered to an idiosyncratic individual specification on a Monday morning. Themachine did not exist then nor were all the parts available to manufacture it. That evening the UKassembly and distribution center ordered the parts needed by FAX. Their suppliers then dispatchedthese parts by UPS, DHL, FedEx, etc. The next day they began to arrive. Assembly was started. Asmore parts arrived the machine grew closer to completion. Late Wednesday pre-delivery testingbegan. This was completed on the Thursday. UPS were then contacted to pick up the fully testedmachine. It was delivered lunchtime Friday. This is “lean enterprise”. It is entirely demand-pull.The final product nor the parts to make it did not exist together until the customer demanded it.
By changing to demand pull for parts in the US, Toyota has reduced the time from manufacture todelivery from 11 to 2.5 months. For Toyota in the USA, 98% of car servicing and repair iscompleted within 1 day. In Japan itself, 98% of repair and maintenance actions are completed within2hrs of demand using only 60% of the stock held in the US. (Womack and Jones, 1996)
Two Basic Features of the Successful Virtual Organization
Two key features that seem to lead to commercial success within the framework of the virtualorganization are partnership sourcing (PS) and a commitment to outsource non-core business. Allactivity within an organization’s boundary uses up senior management time. Optimality requires thatthis be focused on a business's core skill areas. Management attention directed away from such coreareas of activity defocuses on organization clarity of purpose and ultimately results. Markets, it isargued, produce very high-powered incentives to performance. A competitive market can ensure thecheap high quality supply of many non-core products and services. Arguably market incentivespolice achievement better than managerial effort, misdirected from what should be its main effort,the organizations core area of competence.
A set of skills core to an organization’s ethos can always be identified, (for an organization), eg.buying and retailing, everything else can be out-sourced to advantage specialists, each with their owncore skills. Each member of a production and distribution network hones its core skills to a level ofperfection not achievable in a vertically integrated organization. This ensures the right high qualityproducts get to customers economically. In such a network each player is a high performer in hisown right and uses his management to maintain focus on core activities only.
To ensure effectiveness in this process partnership sourcing (PS) is often used. This is designed toensure that value is added continuously throughout in a supply chain. This requires trust between allthose involved. This vitally includes the final customer. Post purchase customer utility is seen to beas important as a sale. If one were to competitively auction each link in a supply chain, one woulddestroy rather than create trust and so adds to cost. On the other hand in a vertically organizedsystem, less able people tend to be recruited to non-core activities. Logically one would then expecttheir skills to be lower and managerial acuity in dealing with them less evident and so costs higherthan might otherwise be the case. Evidence on this is limited. The converse has been the principalfocus of research, i.e. what is the configuration of successful companies (Fruin, 1992).
In private sector virtual organizations professional purchasing management is a core skill. Effectivepartnership sourcing is a key part of that. Professional buyers choose a supplier on professionalgrounds based on critical performance criteria and endeavor to stay loyal to him no matter what. If asupplier is bad he is helped to improve before serious consideration is given to replacing him. Thisapproach has proved cheaper than trust destroying compulsory competitive tendering (CCT).
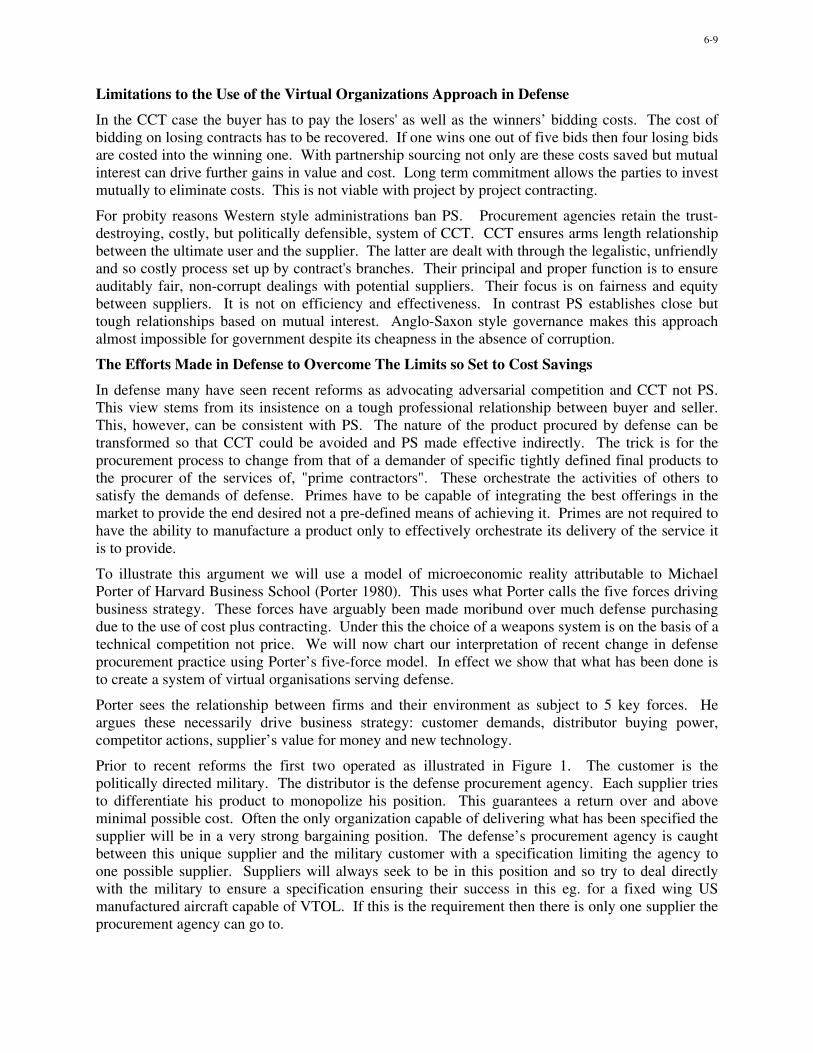
6-9
Limitations to the Use of the Virtual Organizations Approach in Defense
In the CCT case the buyer has to pay the losers' as well as the winners’ bidding costs. The cost ofbidding on losing contracts has to be recovered. If one wins one out of five bids then four losing bidsare costed into the winning one. With partnership sourcing not only are these costs saved but mutualinterest can drive further gains in value and cost. Long term commitment allows the parties to investmutually to eliminate costs. This is not viable with project by project contracting.
For probity reasons Western style administrations ban PS. Procurement agencies retain the trust-destroying, costly, but politically defensible, system of CCT. CCT ensures arms length relationshipbetween the ultimate user and the supplier. The latter are dealt with through the legalistic, unfriendlyand so costly process set up by contract's branches. Their principal and proper function is to ensureauditably fair, non-corrupt dealings with potential suppliers. Their focus is on fairness and equitybetween suppliers. It is not on efficiency and effectiveness. In contrast PS establishes close buttough relationships based on mutual interest. Anglo-Saxon style governance makes this approachalmost impossible for government despite its cheapness in the absence of corruption.
The Efforts Made in Defense to Overcome The Limits so Set to Cost Savings
In defense many have seen recent reforms as advocating adversarial competition and CCT not PS.This view stems from its insistence on a tough professional relationship between buyer and seller.This, however, can be consistent with PS. The nature of the product procured by defense can betransformed so that CCT could be avoided and PS made effective indirectly. The trick is for theprocurement process to change from that of a demander of specific tightly defined final products tothe procurer of the services of, "prime contractors". These orchestrate the activities of others tosatisfy the demands of defense. Primes have to be capable of integrating the best offerings in themarket to provide the end desired not a pre-defined means of achieving it. Primes are not required tohave the ability to manufacture a product only to effectively orchestrate its delivery of the service itis to provide.
To illustrate this argument we will use a model of microeconomic reality attributable to MichaelPorter of Harvard Business School (Porter 1980). This uses what Porter calls the five forces drivingbusiness strategy. These forces have arguably been made moribund over much defense purchasingdue to the use of cost plus contracting. Under this the choice of a weapons system is on the basis of atechnical competition not price. We will now chart our interpretation of recent change in defenseprocurement practice using Porter’s five-force model. In effect we show that what has been done isto create a system of virtual organisations serving defense.
Porter sees the relationship between firms and their environment as subject to 5 key forces. Heargues these necessarily drive business strategy: customer demands, distributor buying power,competitor actions, supplier’s value for money and new technology.
Prior to recent reforms the first two operated as illustrated in Figure 1. The customer is thepolitically directed military. The distributor is the defense procurement agency. Each supplier triesto differentiate his product to monopolize his position. This guarantees a return over and aboveminimal possible cost. Often the only organization capable of delivering what has been specified thesupplier will be in a very strong bargaining position. The defense’s procurement agency is caughtbetween this unique supplier and the military customer with a specification limiting the agency toone possible supplier. Suppliers will always seek to be in this position and so try to deal directlywith the military to ensure a specification ensuring their success in this eg. for a fixed wing USmanufactured aircraft capable of VTOL. If this is the requirement then there is only one supplier theprocurement agency can go to.

6-10
Figure 1Porter’s Five Forces
(The First Two ineffective prior to reform)
The most important counter to monopolization by differentiation is the "cardinal points"specification. This specifies what is to be achieved not the means. This opens up crediblecompetition to different technological solutions. A prime does not have to have all the skills requiredto deliver only the ability to orchestrate the activities of those who have. The defense procurementprocess then purchases an entirely new product, "prime contractorship". This is a generic not aproduct specific skill. Defense thus outsources the orchestration of procurement. This product issuch that a number of organizations have the capacity to deliver it. This undermines differentiated,and so monopolized, supply. The consequence is that the procurement agency now faces a numberof potential suppliers. This increases the credible competition faced. This effect is amplified by theexistence of alternative technological solution to cardinal points specifications. This introducespotential credible competition from new technology. The defense procurement process thus specifieswhat is required rather than how and by whom it is produced. This changes the whole structure ofthe relationship between a defense department and industry. It inevitably alters contractor conductand behavior. In so doing the performance obtainable for a given price/cost is improved. By thesemeans multiple competitive sources of supply can be created even for development work or newsystems. Figure 2 illustrates:
Figure 2Porter’s Five Forces Initial Four in Operation
This allows cost plus contracting to be ended. With competitive tendering, fixed prices can be thenorm. This has a virtuous incentive effect. Non competitive bidding leads to cost plus contracts, i.e.the supplier, audited by defense, calculates the cost of what is produced and gets a “fair” percentagereturn on that level of cost. This provides an incentive for activities to be brought in house thatincrease costs. With no fixed percentage return on cost there is no incentive to maximize them, by
DefenseFirms
DistributionProcurement
Agency
CustomerMilitary
Differentiation1 Supplier
DefenseFirm
DistributionProcurement
CustomerMilitary
CompetitionMany Suppliers
Substitutesfrom otherSuppliers
Multiple Primes & ForeignCompetitors
Substitutionfrom new
Technology
Scope for NewTechnology to Enter The
CORE
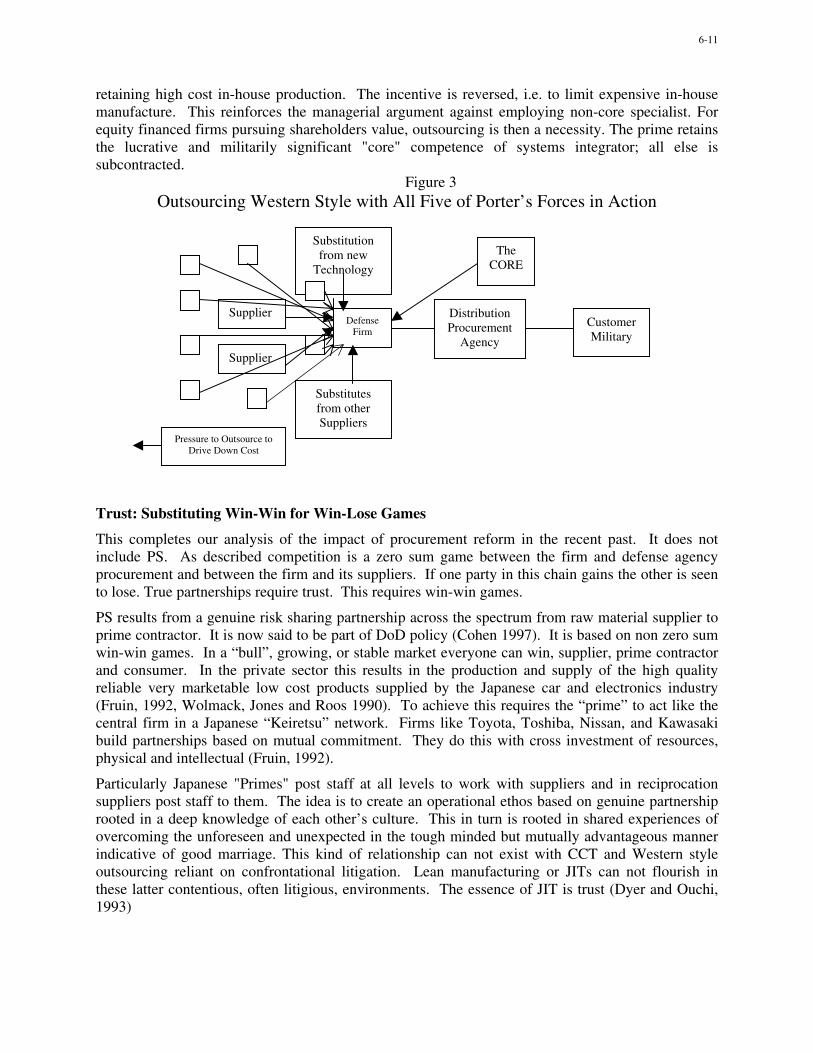
6-11
retaining high cost in-house production. The incentive is reversed, i.e. to limit expensive in-housemanufacture. This reinforces the managerial argument against employing non-core specialist. Forequity financed firms pursuing shareholders value, outsourcing is then a necessity. The prime retainsthe lucrative and militarily significant "core" competence of systems integrator; all else issubcontracted.
Figure 3Outsourcing Western Style with All Five of Porter’s Forces in Action
Trust: Substituting Win-Win for Win-Lose Games
This completes our analysis of the impact of procurement reform in the recent past. It does notinclude PS. As described competition is a zero sum game between the firm and defense agencyprocurement and between the firm and its suppliers. If one party in this chain gains the other is seento lose. True partnerships require trust. This requires win-win games.
PS results from a genuine risk sharing partnership across the spectrum from raw material supplier toprime contractor. It is now said to be part of DoD policy (Cohen 1997). It is based on non zero sumwin-win games. In a “bull”, growing, or stable market everyone can win, supplier, prime contractorand consumer. In the private sector this results in the production and supply of the high qualityreliable very marketable low cost products supplied by the Japanese car and electronics industry(Fruin, 1992, Wolmack, Jones and Roos 1990). To achieve this requires the “prime” to act like thecentral firm in a Japanese “Keiretsu” network. Firms like Toyota, Toshiba, Nissan, and Kawasakibuild partnerships based on mutual commitment. They do this with cross investment of resources,physical and intellectual (Fruin, 1992).
Particularly Japanese "Primes" post staff at all levels to work with suppliers and in reciprocationsuppliers post staff to them. The idea is to create an operational ethos based on genuine partnershiprooted in a deep knowledge of each other’s culture. This in turn is rooted in shared experiences ofovercoming the unforeseen and unexpected in the tough minded but mutually advantageous mannerindicative of good marriage. This kind of relationship can not exist with CCT and Western styleoutsourcing reliant on confrontational litigation. Lean manufacturing or JITs can not flourish inthese latter contentious, often litigious, environments. The essence of JIT is trust (Dyer and Ouchi,1993)
DefenseFirm
DistributionProcurement
Agency
CustomerMilitary
Substitutesfrom otherSuppliers
Substitutionfrom new
Technology
TheCORE
Supplier
Supplier
Pressure to Outsource toDrive Down Cost
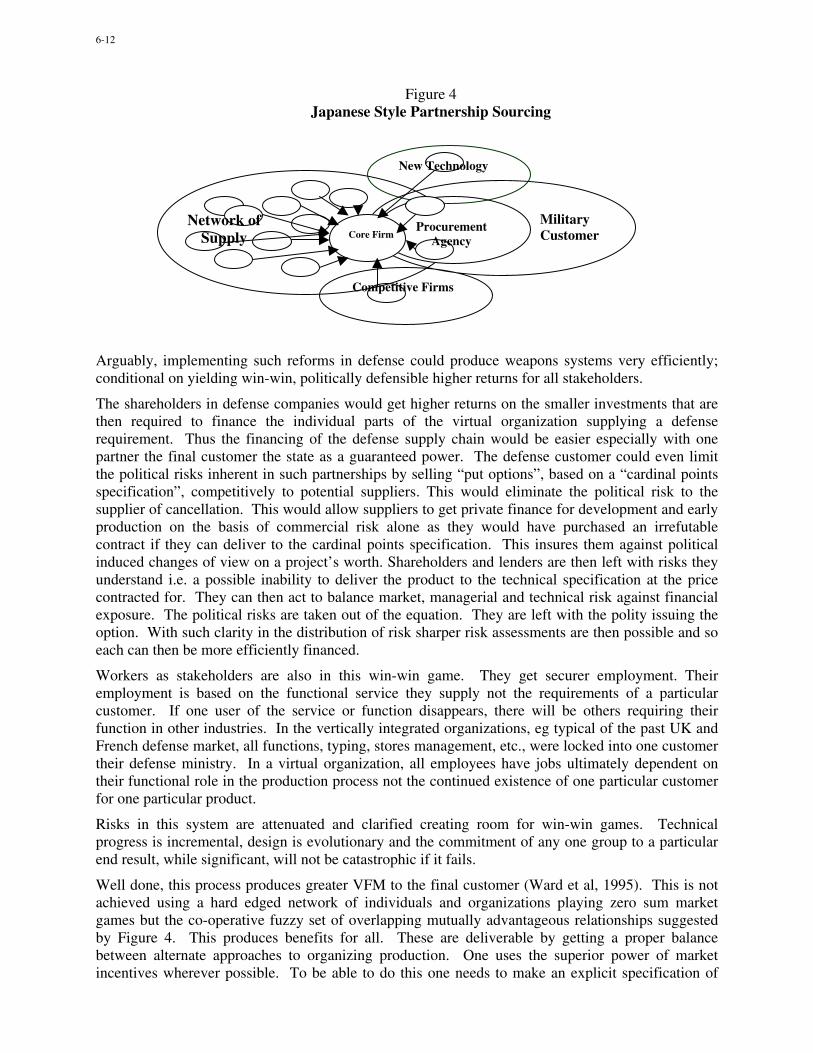
6-12
Figure 4Japanese Style Partnership Sourcing
Arguably, implementing such reforms in defense could produce weapons systems very efficiently;conditional on yielding win-win, politically defensible higher returns for all stakeholders.
The shareholders in defense companies would get higher returns on the smaller investments that arethen required to finance the individual parts of the virtual organization supplying a defenserequirement. Thus the financing of the defense supply chain would be easier especially with onepartner the final customer the state as a guaranteed power. The defense customer could even limitthe political risks inherent in such partnerships by selling “put options”, based on a “cardinal pointsspecification”, competitively to potential suppliers. This would eliminate the political risk to thesupplier of cancellation. This would allow suppliers to get private finance for development and earlyproduction on the basis of commercial risk alone as they would have purchased an irrefutablecontract if they can deliver to the cardinal points specification. This insures them against politicalinduced changes of view on a project’s worth. Shareholders and lenders are then left with risks theyunderstand i.e. a possible inability to deliver the product to the technical specification at the pricecontracted for. They can then act to balance market, managerial and technical risk against financialexposure. The political risks are taken out of the equation. They are left with the polity issuing theoption. With such clarity in the distribution of risk sharper risk assessments are then possible and soeach can then be more efficiently financed.
Workers as stakeholders are also in this win-win game. They get securer employment. Theiremployment is based on the functional service they supply not the requirements of a particularcustomer. If one user of the service or function disappears, there will be others requiring theirfunction in other industries. In the vertically integrated organizations, eg typical of the past UK andFrench defense market, all functions, typing, stores management, etc., were locked into one customertheir defense ministry. In a virtual organization, all employees have jobs ultimately dependent ontheir functional role in the production process not the continued existence of one particular customerfor one particular product.
Risks in this system are attenuated and clarified creating room for win-win games. Technicalprogress is incremental, design is evolutionary and the commitment of any one group to a particularend result, while significant, will not be catastrophic if it fails.
Well done, this process produces greater VFM to the final customer (Ward et al, 1995). This is notachieved using a hard edged network of individuals and organizations playing zero sum marketgames but the co-operative fuzzy set of overlapping mutually advantageous relationships suggestedby Figure 4. This produces benefits for all. These are deliverable by getting a proper balancebetween alternate approaches to organizing production. One uses the superior power of marketincentives wherever possible. To be able to do this one needs to make an explicit specification of
Competitive Firms
New Technology
Core FirmProcurement
Agency
MilitaryCustomer
Network ofSupply
6-13
what is to be delivered preferably in cardinal point terms. This is not possible where the requirementis tacit and so not measurable. Then one has to use a hierarchical delivery system. This has togenerate internal incentives for each function based on loyalty to the organization (Williamson,1993) not a specific well defined result delivered. This is costly. It has to be expensively based onthe development of teams rooted in mutual trust and tacit understanding. If this is disturbed in anyway performance will be damaged in a non directly observable manner. The virtual organization is ahybrid of market and hierarchical supply. Hybrids are arguably more robust than what spawns them.However, they cannot propagate. They need the systemic separateness of their constituent partnersto exist at all.
Bringing Defense Closer to the Virtual Organization
Further steps in this process of reform have been put in place and just beginning to be put in place inthe UK under their Strategic Defense Review (MOD SDR 2F3/7) in the US under the DefenseReform Initiative (Cohen, 1997). Two strategies exist for the achievement of this final step. The firstattempts to de-politicize the financing of development and commercial risk. The second sets out tode-bureaucratize the financing of state activity using what is called "Public Private Partnership"(PPP) in the UK This aims to allow the private sector to use its incentive systems to provide capitalto satisfy military requirements in partnership with the polity. Carefully designed, such systemsenable government to contract out the risks the state is not well equipped to handle eg. those ofownership, technical or commercial, while retaining those it is equipped to deal with, e.g. thepolitical. In the limit such partnerships lead to the private sector retaining ownership of systems andso leases rather than sell them. In peace these would be directed in use by the military and maintainedin a fit state by the lessor. In war the public sector would command and direct their use as well asassume the risk of loss with maintenance still perhaps in private “sponsored reserve” hands. This hasthe advantage of military C2 unencumbered with non-fighting non-core consideration of thesupportability and maintainability of deployed equipment. The logisticians job, whether full timeprofessional military or outsourced sponsored reserves, is to deliver what is practicable as invisiblyas possible to the fighting commander whose main effort is fighting within the constraints set by timeand available material.
The second goes further. It attempts to underpin the above by introducing private sector accountingand budgeting practice into the state. The DoD originally called its approach to this DefenseBusiness Operating Funds (DBOF) (DOD, 1995) in 1997 renamed and expanded as Working CapitalFunds (WCFs) for which the SofS for Defense awarded his Hammer price for smashing costs in 1998(DoD, 1998). This is an internal DoD regulated market set up between the front line and supportfunctions. Military or state owned suppliers of training and maintenance compete with private sectorsuppliers. In the UK MoD finance staff calls this "playing shops". It makes those exercising militaryjudgment directly accountable for the full cost of their decisions by simulating high-powered marketincentives.
In the UK a more all embracing concept is proposed "Resource Accounting and Budgeting" (RAB).This makes accountable individuals aware of the full costs or their decisions by communicating it tothem. By doing this it is hoped those exercising military judgment will use support functions moreeconomically as they will have a better understanding of the impact of their decisions on the full costof their actions. At present a commander has no incentive other than expensively generatedbureaucratic direction to limit his use, or abuse, of the equipment under his command. With costcommunication it is hoped behavior will change for the better.
In illustration currently spares are supplied free at the point of use. A tank engine may cost$500,000. To a commander it is free. To train a driver to use this power train less abusively has areal opportunity cost to a commander, the loss of the driver on a course. Without cost information
6-14
and outside bureaucratic regulation the commander is "better" to use tank spares at $500,000 than totrain drivers at a smaller cost.
The question to be addressed here is whether communicating this cost through the hierarchy, as in theUK, or making commanders, as in the US system, directly accountable for it in a budget produces themost efficient result. Accounting alone, what the UK MoD calls the “Initial Capability” (IC) of theiraccounting and budgeting project only informs commanders of these full cost. Little evidence existsto show that knowing how much something costs is sufficient to alter behavior. Experience, and apriori analysis, suggests it will not do so without a considerable investment down through thehierarchy in staff motivation and associated organizational development. This is needed to engenderthe attitudes and culture required to ensure resources are used in the communal rather than individualinterest. In the absence of such an incentive system or an alternate market one behavior is unlikely tochange. If these two approaches de politicization and commercialization of defense accountingengender a significant cost differential between efficient and inefficient predicts ultimately they maybe made effective. If this occurs they will have a profound effect on future costs and so add to thecost estimator’s problems.
It is precisely because relationships between decision and cost can be vague that industryincreasingly uses Activity-Based Costing (ABC) (Johnson and Kaplan, 1987). This creates a basisfor optimizing incentive by developing a clear understanding of the relationship between decisionsand resulting costs. Traditional absorption costing only measures the direct costs of activity, it thenpro rates overheads. This is now seen as insufficient. When traditional absorption costing wasconceived directly attributable costs could be as much as 80% of all costs. Nowadays many directcosts are outsourced and much remaining cost is the overhead of using communal resources, e.g.computing power, rather than cost attributable to a specific product. ABC arguably provides one witha more comprehensive understanding of cost and what drives it throughout the value chain. Thisenables one to highlight far better than previously accretions of cost driven by wasteful supply,production and distribution systems.
A problem then exists in managing resources internally. If the bulk of the cost of a small itemproduced for a particular customer is in the IT department that processes the order, organizesdelivery and invoices for the service then those costs need to be allocated to the activity causing theiroccurrence. This is servicing the customer and not manufacturing the product. It is customer activitythat drives cost, not production management. It is a lot cheaper in terms of order processing toprovide a large number of parts infrequently to a customer than it is to supply a small numbersregularly. There comes a point when the cost of doing this exceeds manufacturing costs. It is thisthat should influence decision making not the cost of manufacture.
Thus, both the PPP and RAB have built into them incentives to contain or lower support costs.
LEAN ENTERPRISE AND THE BASIS FOR COST SAVINGS AT THE ENTERPRISE ANDPROJECT LEVELS
Consideration of Commercial Best Practice in Lean Production
The modern industrial world spurred by the lowering of infrastructure costs and the possibilities ofthe virtual organization is moving to the “lean enterprise”. This is already occurring in defensecompanies independent of government encouragement. This approach derives from 40 years ofsuccess in Toyota, arguably the most productive high quality car producer in the world.
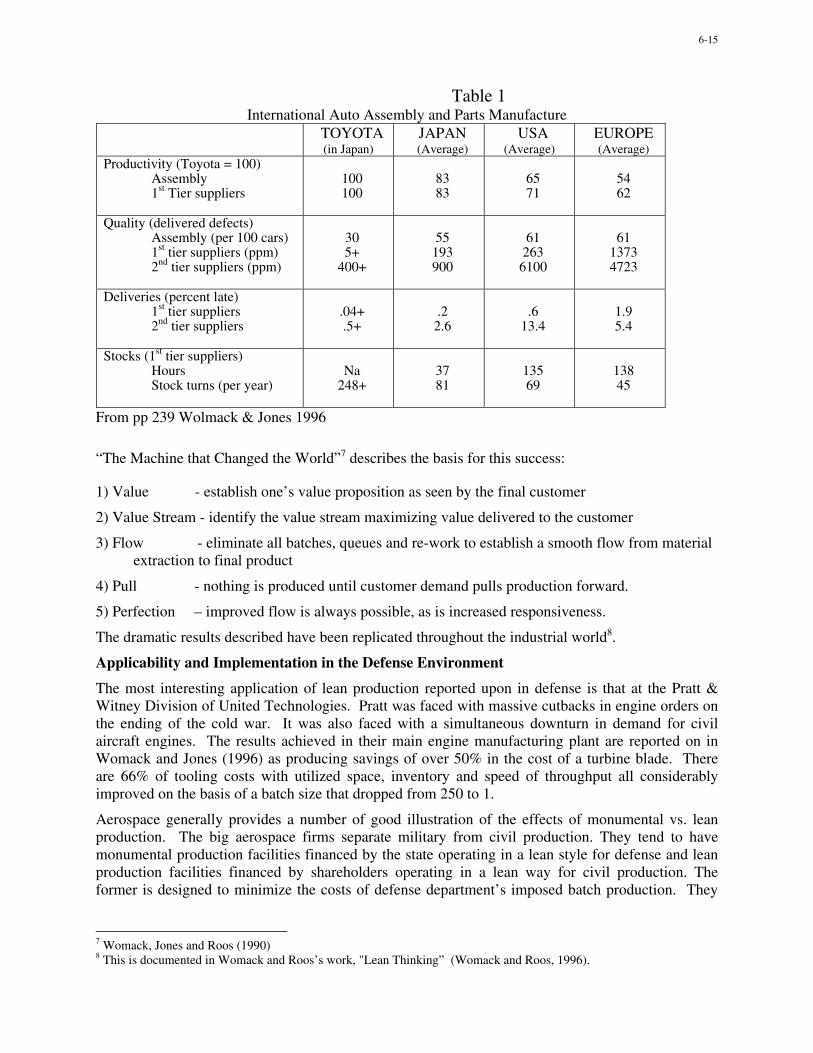
6-15
Table 1International Auto Assembly and Parts Manufacture
TOYOTA(in Japan)
JAPAN(Average)
USA(Average)
EUROPE(Average)
Productivity (Toyota = 100)Assembly1st Tier suppliers
100100
8383
6571
5462
Quality (delivered defects)Assembly (per 100 cars)1st tier suppliers (ppm)2nd tier suppliers (ppm)
305+
400+
55193900
612636100
6113734723
Deliveries (percent late)1st tier suppliers2nd tier suppliers
.04+.5+
.22.6
.613.4
1.95.4
Stocks (1st tier suppliers)HoursStock turns (per year)
Na248+
3781
13569
13845
From pp 239 Wolmack & Jones 1996
“The Machine that Changed the World”7 describes the basis for this success:
1) Value - establish one’s value proposition as seen by the final customer
2) Value Stream - identify the value stream maximizing value delivered to the customer
3) Flow - eliminate all batches, queues and re-work to establish a smooth flow from materialextraction to final product
4) Pull - nothing is produced until customer demand pulls production forward.
5) Perfection – improved flow is always possible, as is increased responsiveness.
The dramatic results described have been replicated throughout the industrial world8.
Applicability and Implementation in the Defense Environment
The most interesting application of lean production reported upon in defense is that at the Pratt &Witney Division of United Technologies. Pratt was faced with massive cutbacks in engine orders onthe ending of the cold war. It was also faced with a simultaneous downturn in demand for civilaircraft engines. The results achieved in their main engine manufacturing plant are reported on inWomack and Jones (1996) as producing savings of over 50% in the cost of a turbine blade. Thereare 66% of tooling costs with utilized space, inventory and speed of throughput all considerablyimproved on the basis of a batch size that dropped from 250 to 1.
Aerospace generally provides a number of good illustration of the effects of monumental vs. leanproduction. The big aerospace firms separate military from civil production. They tend to havemonumental production facilities financed by the state operating in a lean style for defense and leanproduction facilities financed by shareholders operating in a lean way for civil production. Theformer is designed to minimize the costs of defense department’s imposed batch production. They
7 Womack, Jones and Roos (1990)8 This is documented in Womack and Roos’s work, "Lean Thinking” (Womack and Roos, 1996).

6-16
use specialist but expensive tools. Civil plants achieve optimality by using flow production so as tominimize tooling costs.
In defense the prior commitment of the customer, to purchasing aircraft in large batches allows theaerospace firms to calculate set-up tooling and production costs on a known production run. Theythen minimize production costs for the ordered batch size. They also get the government to financeany tooling costs. Their viability is conditional on this state finance of batch production.
In the civil case the number of aircraft to be built is problematic. Any estimate that can be made of arecovery rate on tooling must therefore also be problematic. Production then has to be flexible. Astooling has to be financed at the expense and risk of the shareholders civil aircraft plants are designedto minimize set-up and tooling costs.
The consequences of the above are:1) military plants have low unit cost recovery rates on tooling relative to labor rates.
2) civil plants have high unit cost recovery rates on tooling relative to low labor rates.
Each type of plant thus has its own distinct comparative advantage. However, civil plants due to thecommercial imperative of their market place tend to have an absolute advantage in both. "Dual-use"production, in the same plant, of military and civil aircraft is thus only possible at the margin. Thevery different capitalization rates required would otherwise results in excessive cross subsidization.In the past it has been possible to de-merge civil from military production to the absolute costdisadvantage of the latter and so the taxpayer. In doing so one has been able to add shareholdervalue. Cost plus defense contracts produce good low risk returns and the civil business does not haveto carry any of the overheads.
However much of the enabling technologies now used in defense are "dual-use" and driven by civilcommercial imperatives not defense military or political ones. As we have seen these are drivingindustry to global outsourcing. The economies possible using commercial infrastructure aimed atsupporting everyone’s product are huge. This is the basis of the current revolution incommunications, transportation and information technology. These are all “decreasing cost ”industries.(Begg, Fischer and Dornbusch, 1987) What the economic textbooks call naturalmonopolies i.e. the organization with the largest demand and most fully utilized capacity can out-compete all others. The result is lower and lower unit cost and faster and faster delivery. This makesit possible for everyone to confidently operate with lower inventories and outsourced supply asdescribed earlier and facilitates the ease of creating the virtual organizations we have described andsets everything up for the lean enterprise structure of production described here. In the new globalworld economy inventory can be speedily acquired reliably and at low cost just in time (JIT) to fitproduction schedules.
Limitations as to Applicability in Defense
This approach does have its limitations even in commerce (Levy, 1997). In defense securityconsiderations may lead to more costly solution. The advantages of lean systems can be swallowedup in costly contingent inventory or reversionary capabilities (Cusumano, 1994) if confidence doesexist in speedy re-supply in case of need as is the case in defense.
In commerce firms limit the impact of such uncertainty by limiting development and productioncycles to be as little as 18 months. These of course limits one to pretty modest improvements intechnology from cycle to cycle but these do accumulate in a compound manner pretty quickly over adecade or so. Defense currently has a 10 to 20 year cycle. This is likely to get longer consequent tothe post Cold War decline in defense industrial demand. With traditional thinking, this leads toslower, longer procurement cycles and in the absence of any obvious direct threat, contingent stocks

6-17
and in-service support are cut and or outsourced. While this is presented as consistent with “leanthinking” it is not embedded, as it is in the commercial sector, in a system ensuring responsive re-supply when required. It is to how that might be achieved in defense that we now turn.
Approaches to Overcoming Limitations
The preceding arguments make it clear that in the new age the environment for the arms industry haschanged significantly.
1. There are ever-shorter product life cycles for the “dual-use” technology that defense has come torely, on both technological and cost grounds, especially in the electronics industry
2. There are ever-longer procurement cycles for high technology weapons that increasinglyincorporate commercial off the shelf (COTS) products that then need to be expensivelyintegrated into the high technology weapons systems now in vogue.
One suggested solution to this is to evolve systems with incremental technology insertion (Cohen1997, Ch14, Goal 1). This is a partial move from batch to flow and so lean production. However,modular insertion in a highly integrated system can be very expensive given the massivereconfiguration that may be required. Modern production techniques make it possible to considersubstituting small batch more frequently purchased equipment, i.e. more flow like manufacture as adirect substitute for in-service support and maintenance.
The key to "Lean Production" is constant production rates throughout the system fuelled byincreasing or at least unvarying demand. “Lean production” identifies the “takt” time, i.e. the rate atwhich one has to produce to satisfy demand it does not focus on minimizing the unit costs of toolingand machine time for a given batch. To use it defense has to find a way to generate steadier demand.The a priori cost advantages are already clear from our previous arguments.
Post Cold War warning times for military deployment are longer and arguable more controllable thanin the past. In the Cold War a huge army was pre-positioned in Germany ready to fight ideally at afew weeks notice but ready to act on a shorter time scale, days or even hours. With the scenariosnow being considered production rates can in theory be slowed right down when conflict is not in theoffing and speeded up when a distant prospect of a deployment arises. If at the same time theequipment replacement cycle could be shortened one could then make a strong moves towards leanproduction. The idea would be to sustain productive capacity over time. This coupled with a shorterprocurement period would enable the defense technology cycle to be brought more closely into linewith developing commercial ones. Spares would then be available from production. The need tohold large stocks would go.
However, this creates logistical support problems. It would entail initially replacing older equipmentat a slower but probably more affordable rate. This means having weapons of different marks inservice at the same time. However this configuration problem is already reality for many weaponssystems currently in service. Much of this has been retrofitted with enhancements as and when it hasproved possible.
In addition modern military equipment is already becoming ever more reliant on COT's IT. This hasvery fast development and production timescale. When a COTS components fails it generally cannotbe replaced with its like but by the latest similar COTS item designed independently of the widersystem into which it needs to be integrated. Costly re-design and integration is then an inevitablecost anyway. It therefore seems sensible to build the process of doing this systematically into thestructure of ones through life procurement process in a lean manner.
To achieve this one would require a cardinal points specification covering development, acquisition,utilization and disposal as the basis of all defense contracts. This would leave the commercialsupplier, ideally seen as in partnership with defense, to trade-off reliability, with in-service support
6-18
with sustainability, i.e. design costs, with more frequent more costly support with costly stocks ofmateriel. With such a contract on offer, contractors might find it cheaper to keep production linesopen working at slower rates rather than produce everything including a lifetime supply of spares andammunition in one huge batch at the beginning of a weapons systems working life. Defensecurrently orders equipment and materiel in large volume over a short span of years. Spares andmunitions for support and sustainment are bought up front and stored for the life of a project. Suchcosts are significant. So is the waste that occurs because estimates of usage prior to in-serviceexperience are inevitably wrong. This leads to large eventually redundant stock holdings oralternatively very extensive re-contractors to replace out of stock items. A further downside is thatgiven that the costs of running out of sustainment in combat are so high contingent over-provision isalmost inevitable. Prior to the US’s introduction of revolving funds and the recent capitalization ofthe UK MOD’s accounts there was no proper means for accounting for these inventory carryingcosts. The material bought, although often never used, was, under cash accounting, effectivelywritten off on purchase and its costs as inventory never subsequently accounted for.
However the concern today is not that we may have too much but that faced with a war we may haveinsufficient stock to sustain a campaign. However even now using the traditional batch system onefaces this prospect. Any production line will probably have been closed many years before a conflictoccurs. It may then be impractical, never mind expensive, to open it up again on any useful time-scale. By the time it was possible the war might be over with lives, sovereignty or crucial interestslost.
Serious problems thus exist for both technology updating and sustainment. If manufacturing capacityis not kept in being, a problem exists for defense that needs to be addressed urgently. This cannot besolved cheaply, as seems to be currently thought by un-integrated technology insertion, re-constitution of production facility or technology demonstrators. If industry could contract to supplythe availability of a military capability, this pessimistic outlook might be changeable. To achieve thiswe need to avoid contracting for a pre-specified platform to a specific design supplied with a hugestock of spares.
Modern warfare requires rapid deployment and high mobility with a sustainable high tempo ofoperations. This requires the very latest in technology. To support such a capability one might findthe most cost effective way to achieve it was to sustain manufacturing capacity with smaller ordersover a longer period of time. This would eliminate much of the support infrastructure now needed tosustain defense. Lean production might then seem a sensible and practical basis on which toestablish defense production.
To gain the full benefits of the commercial best practice we have described defense restructuringneeds to be considered systemically. Part of this is to see the defense industry as organized toprovide a manufacturing capacity as a direct substitute for support. It would first have to establishdemand pulled flows of value for defense products not batch pushed supply. This requires majorchanges in procurement, financing and military practice. If equipment management and war-fightingdoctrine does not change significantly defense will not be able to access the potential cost savings wehave described.
If defense manufacturing could work on a shorter cycle of flow based procurement say over 5 to 10years rather than the current 15-20 year of batch procurement things could change dramatically. Thecurrent batch thinking requires high initial purchase costs followed by considerable inventory,updating and sustainment costs. Best modern commercial procurement involves the frequentpurchase of reliable equipment requiring less in-service support. Could this be achieved in defense?Till now no one has invested the costing resources to test this hypothesis. This paper has been writtento provide a theoretical basis for doing so.

6-19
Consider the UK’s purchase of Apache Longbow. If the requirement could be met by buildingaround 70 new aircraft at the rate of 10 a year every 7 years over the proposed 30 year life of theairframe would costs rise, stay the same or fall as compared to building 70 only. The latter need tobe disassembled, rebuilt and upgraded throughout their life. With the former approach one creates theessential requirement for a lean system a regular flow of demand. This would allow development,tooling and set-up costs to be spread over 210 helicopters produced in a steady flow over 30 yearsrather than 70 in a batch produced over two or three years. As indicated above the cost benefitanalysis of such an approach is yet to be done however, a priori, savings seem possible from lowerinventory, update and support infrastructure costs. To achieve this result a partnership contract wouldbe needed over a very long period of time. The contract would not be for the manufacture of aspecified number of aircraft but for a specified number of aircraft continuously updated andserviceable on the flight line throughout the proposed lifetime of the system. The shorter productioncycle we have suggested would allow evolutionary fully integrated updates to be planned on a sevenyear cycle producing three marks of the aircraft over its lifetime. The financial benefits of such ascheme would be enhanced if a second hand market could be created in advance for the retiringearlier marks of aircraft. The need to hold a large inventory could be eliminated perhaps. Parts wouldbe in continuous production over the life of the system. The need for third or fourth linerefurbishment could also be eliminated as new could replace old and much of the supportinfrastructure, of technical training staff recruitment and personnel and inventory managementcurrently carried as an overhead by the military could be done away with.
The scenario described substitutes flow production for maintenance and sustainment stocks. Thisinvolves manufacturing at a rate that builds up a restructured inventory of equipment slowly androtates older, or, damaged, equipment out of service to be refurbished and replaced in the line ofbattle with new, not refurbished equipment.
Fixed price or firm downward negotiable prices on procurement need to be the norm for this toachieve the results hypothesized. Such contracts would provide incentives for generic parts to beoutsourced to industry. It discourages in-house production by eliminating the gains from cost plus.
This is conditional on the political realism of allowing commercial rates of return and underwritinglong term contracts. One would have a core defense industry with a low internal cost base and ahighly competitive infrastructure based on "dual use" activity.
The long term political benefits of a more fragmented, commercially based market extended in scopeto cover activity currently carried out by staff either within defense departments or in primes couldbe considerable. These benefits would be in terms of enhanced industrial, and social, stability.People's jobs will depend on the functionality of the products or services they supply not therequirements of one particular customer, defense. A defense industrial infrastructure so freed fromdependence on the vagaries of the political process clearly has utility.
Such a system of procurement would also increase the use of what Williamson has called "highpowered market incentives" (Williamson, 1991). Outsourcing blurs the boundary between the firmand the market (Dietrich, 1992, Blois, 1972). In so doing it exposes generic infrastructure supportproviders to the risks of wider competition in the market place while leaving the political andmilitary risks associated with conflict and contingent preparation to handle it with the state.
CONCLUSION: IMPLICATIONS FOR COST ESTIMATING
Opportunities exist to improve the public and private parts of defense provided understandableadministrative, political and military cultural blocks to change can be removed. These barriers arereal. If the move to value adding flow production is to be possible these need to be removed or

6-20
eased. If realistically they can only be eased rather than eliminated they will encourage rather thandeliver lean production. However, the benefits to defense of the virtual organization and a cost-effective global industrial infrastructure should still lower defense costs without such radicalinnovations.
It is clear that no matter what, the future will radically differ from the past. New cost estimatingtechniques will be needed to cope with the resulting devaluation of historical databases.
If flow production is the end state then cost estimating becomes easier. In the limit all the resourcesto produce an item are brought together in one continuous flow production cell. This ensures thatmany costs are prices on inbound outsourced supplies priced by market competition. The rest aredirect and observable as incurred. Cost measurement is then easier.
However cost forecasting becomes more difficult. New materials and production methods implynew cost structures. The change described intend to impact costs and performance. Given the lackof existing benchmarks new estimating techniques are needed. Among these could be syntheticmanufacturing environments. Work on this, in the cost estimating sphere, has begun. NASA withGE is funding an engine costing initiative to transfer an existing piece of software, the IntegratedSupportability Analysis and Cost System (ISACS) developed under UNIX, to a Windows NT/95public domain environment (Weaks & Barrett, 1998). ISACS allows what if modeling of the impactof engine design changes on lifecycle costs. One can therefore use it to trade-off the engines ratedpower output against in service support costs. In the UK the lean manufacturing initiative is fundingCranfield University to develop life cycle cost estimating techniques producing composite aero-structures.
The above initiatives are all aimed at getting over the problems for estimating costs where newprocesses are used. Lean production is not new. It has been successful in the private sector. As wehave seen Pratt and Witney have already publicly reported the effects of its use. Lean production,ironically based on old-fashioned batch thinking, is already in place in military aircraft production.But until defense gets away from the defense financed anti-lean batch mentality there is little hope ofachieving the savings already achieved in civil aerospace. These changes will not occur as long asdefense departments are willing to fund the cost base underpinning the old approach. The existingmentality is underpinned in aerospace by civil aerospace’s losses and until recently militaryaerospace’s profitability.
At what speed can all this be achieved? The evidence is on short time scales Womack and Jones(1996) report 30% savings inside 6 months of starting, followed by a further 35% savings inside 2years, followed on by continuous further proportionate cost savings and productivity and qualityimprovements over succeeding years. Such publicly reported results have, as we have seen, beensupported by experience at, at least, one US defense manufacturer, Pratt and Whitney. So it isreasonable to presume that there is no reason why they cannot be accessed generally. Clearly thiswill not be possible without a radical re-think of the defense enterprise seen holistically from factoryto foxhole. To get demand pulling flow requires defense procurement to be spread out over time.This requires the relation between military doctrine and industrial production to be thought throughvery carefully indeed. The military are uncomfortable with JITs. However, it was the basis for bothUS and British airforce operations in World War II, i.e. to work twenty-four hours a day every dayand drop ordinance on Germany at its rate of production.
A key failure of much recent defense support thinking is that it has not dealt well with sustainability.In the Cold War we operated on the basis of a short conventional war with high rates of materialconsumption. When stocks were exhausted we would simply use nuclear weapons. This is notrealistic for the wars contemplated now. Defense departments now seem intent on having smallerstocks of smarter more expensive weapons. With current batch thinking these can not be re-orderedwhen used in less than five years. This does not compute militarily. What happens when your stock
6-21
of smart weapons is exhausted and the enemy is not defeated? For this reason alone defense needsflow thinking with shorter production, development and in service life cycles. Only then can lowcost, investment and production rates be in tune with the possible rate of use of technologicallyadvanced weapons. This requires PDS and configuration management to be more technicallysophisticated than it is at the moment. With proper JITs support this is possible. This is a challenge tothe cost estimator and forecaster who will then have to extrapolate from commercial experience.
The raises a second order problem for the estimator. The defense market can never replicate thecompetitive environment commercial companies operate in. One will have to assess the impact of amonopolistic defense industrial structure on the realizable cost savings from lean manufacturing.
It is clear the future provides a real challenge for the cost estimator. Synthetic environments will needto be part of the tool kit as will an understanding of the process of industrial change both from aproduction engineering and economic perspective.
References
Cohen, W. S. 1997. "Defense Reform Initiative Report", DoD.
Bartlett, C. A. 1991."Caterpillar-Komatsu", Case Study from Harvard Business Review.
Begg, D. Fischer, S. and Dornbusch, R., 1987"Economics", 2nd edition, McGraw Hill BookCompany.
Binmore, K. And Dasgupta, P. 1991, Economic Organizations as Games, Palgrave.
Blois, K. J. 1972."Vertical Quasi-Integration, Journal of Industrial Economics, Vol. 20, 253-271.
Cusamano, M. 1997. “The Limits of Lean”, Sloan Management Review, Winter, 94-102.
Dietrich, M. 1992. "The Economics of Quasi-Integration", Paper Malvern Political EconomyConference, August.
DoD, "Defense, 1998. Working Capital Fund Team Wins Hammer Award", Press Release, Dec.
Dyer, J. and Ouchi, W. 1993. “Japanese Style Partnerships: Giving Companies a Competitive Edge”,Sloan Management Review, Fall.
Fruin, M. 1992. “The Japanese Enterprise System: Competitive Strategies and Co-operativeStructures”, Clarendon Press.
Johnson H. and Kaplan, 1987. R. “Relavance Lost – The Rise and Fall of Management Accounting”,Harvard Business School Press.
Levy, D. 1997. “Lean Production in the International Supply Chain”, Sloan Management Review,Winter.
McDuffle, J. P. and Helper, S. 1997. “Creating Lean Suppliers: Diffusing Lean Production Throughthe Supply Chain”, California Management Review, Vol. 39, No. 4, Summer.
6-22
MOD, Strategic Defense Review Study 2F3/7 1998. “Smart Procurement: Final Report”, Issue 1, 19January.
Oliver, N. Delbridge, R. and Lowe, J. 1996 .“Lean Production Practices: International Comparisonsin the Auto Components Industry”, British Journal of Management, Vol. 7, SpecialIssue, S29- S44, March.
Porter, M. 1980. “Competitive Strategy”, The Free Press.
Ward, A. Liker, J. Cristiano, J and Sobek, D. 1995. “The Second Toyota Paradox: How DelayingDecisions Can Make Better Cars Faster, Sloan Management Revue, Spring.
Weaks, C. & Barrett, D., 1998. "The Use of Synthetic Environments in Cost Estimating", paperConference of the International Society for Parametric Analysis, Toronto.
Womack, J. P & Jones, D. T. 1996. Lean Thinking, Simon and Schuster, New York.
Womack, J. P, Jones, D. T. & Roos D. 1990. The Machine that Changed the World”, Simon andSchuster, Maxwell MacMillan International, Oxford.
Williamson, O. 1975. Markets and Hierarchies: Analysis and Antitrust Implications. New York, FreePress.
Williamson, O. 1985, The Economic Institutions of Capitalism, Free Ideas, New York.
Williamson, O. 1991. “Comparative Economic Organisations: The Analysis of Discrete StructuralAlternatives”, Administrative Science Quarterly, Vol. 36, 269-296, June.
7-1
Innovations and Improvements inCost Information Management
David M. Robinson, CDFMLieutenant Colonel, U.S. Marine Corps
Director, Contractor Cost Data Reporting Project Office1800 Defense Pentagon, Room BE779
Washington, DC 20301-1800USA
This presentation outlines the status of weapon system cost reporting in the U.S.Department of Defense (DoD), including an overview of DoD cost reporting history and adescription of the major reengineering effort that began in the mid-1990s. In addition, it willsummarize the planned expansion of the Contractor Cost Data Reporting (CCDR) system into amore comprehensive, life-cycle cost data and document retrieval tool, called the DefenseAutomated Cost Information Management System.
The DoD has been collecting cost data from the defense manufacturing industry since1942, when it began purchasing large quantities of aircraft. There were a number of reportsdeveloped during the 1940s and 1950s that focused primarily on the aircraft and missileindustries; however, cost collection was not done uniformly or with any industry-wide standardsmaking comparisons of data rather difficult. Cost reporting continued to be refined during the1960s and into the early 1970s until the DoD developed its current Contractor Cost Data Reportsystem.
The CCDR system was a set of documents that standardized cost reporting across alldefense industries and became the major source of independent cost data for DoD analysts. However, in the early 1990s, the CCDR system came under significant criticism from both theDoD Inspector General and defense industry manufacturers for being inaccessible, unreliable,and overly burdensome. In response to these criticisms the DoD created the CCDR ProjectOffice and empowered it with three objectives: make old data available electronically over theWorld Wide Web; collect and distribute new data using the Internet; and, reduce the financialand administrative burden of cost reporting to the defense industry.
Examination of the existing cost reporting requirements revealed duplication of effort andunnecessary levels of detail in many of the reports. Much of the problem was addressed by usingexternal sources for some of the data required, allowing for elimination of whole reportingformats and streamlining of others. In addition, the level of cost reporting detail was reduced tobe more consistent with information already being gathered internally by industry.
Next, in order to get information about CCDRs and cost reporting into the hands of DoDanalysts, a public access web site was developed which contains the latest policies, procedures,and directives, as well as on-line tutorials and software tools. In addition, electronic security ofcompetition sensitive, proprietary cost information was of paramount concern to the defenseindustry. In response, the DoD developed a system that both meets industry’s need for securedata submission and meets the Government’s need to tightly control access to the data.
Paper presented at the RTO SAS Symposium on “Cost Structure and Life Cycle Cost (LCC) for Military Systems”, held in Paris, France, 24-25 October 2001, and published in RTO-MP-096.
7-2
Currently, phase-one of the cost reporting system is complete with approximately 36,000paper records scanned into a document database and with all new contracts requiring electronicsubmission of cost reports from manufacturers. These documents are accessible through theInternet to authorized Government users who have registered to use the system. The system isdesigned to allow full-text, content searches of the scanned images and data based on userdefined criteria, greatly improving functionality for the user.
Everyone who interacts with the system must first complete a security registrationprocess. This applies to both contractors and government users. In addition, there are twodistinct hardware and software firewalls embedded in this system, with an internally operatedfirewall layered on top of the standard DoD firewall as a second set of protections, blocking allbut authorized users from accessing the system.
Using this system, defense contractors create the reports and submit them, through theInternet over secured connections, to a data processing server where they are checked for quality.Once complete, reports are put into the database and made available to users. Authorized usersfollow the same secure connections to access the database search engine and retrieve thedocuments they need.
With the on-line system established and available to users, the CCDR Project Officecontinues to manage several ongoing programs. These include electronic archiving of CCDRs asthey are submitted, actively collecting cost data on major acquisition programs, and ensuringquality standards are applied to reports as they are submitted. In addition, the Project Officeprovides training to both government and industry users of the system, and works closely withthe defense industry to vet issues and concerns about cost reporting requirements.
The DoD recognized that the on-line CCDR system was a tremendous improvement incost data availability, but that it could also be configured to deliver a whole host of other costrelated information to its users as well. With that in mind, the Project Office established a newobjective; to develop system capabilities to provide users with easy and relatively comprehensiveaccess to larger quantities of cost information resources. To do this, improvements were made toboth the public information web site and the secure site search capabilities. Control of some ofthe OSD internal cost related activities was transferred to the CCDR Project Office which is nowincorporating them into the existing on-line system.
Development and integration of a new Cost Research Document Retrieval System is nowcomplete. This second module of the CCDR system provides users simultaneous access to anexpansive library of cost documents and to the CCDR data using the same search algorithm. Development has also begun on system interfaces that will allow users to access the operatingand support cost systems being maintained by the individual military services.
As new capabilities are integrated into the current system, it has evolved into what isbeing called the Defense Automated Cost Information Management System or DACIMS.DACIMS users will be able to go to one secure location through the Internet, and, using a singlesearch engine interface, locate and retrieve multiple types of cost data and information on a givenprogram. Those cost related systems that are internal to OSD will be integrated into theDACIMS configuration, while other systems, which are maintained by either the militaryservices or other DoD departments, will have electronic interfaces established with DACIMS. These interfaces will give users easy access to and the ability to retrieve data from these systemsthrough DACIMS without actually making them an integral part of DACIMS.

7-3
The resulting DACIMS configuration will allow the DoD and the CCDR Project Officeto make positive strides toward improving cost information availability within the DoD. Thisimprovement in cost information access should in turn improve the quality of weapon systemcost estimates over time.

This page has been deliberately left blank
Page intentionnellement blanche
8-1
Visibility and Management of Operating andSupport Costs (VAMOSC) Management Information System
Leonard P. CheshireNaval Center for Cost Analysis
Nebraska Avenue Complex4290 Mount Vernon Drive NW Suite 18200
Washington, DC 20393-5444USA
EXECUTIVE SUMMARY
The Visibility and Management of Operating and Support Costs (VAMOSC) program is the most completesource of operating and support (O&S) cost data available to the three U.S. Military Services (Army, Navy andAir Force). Under the general VAMOSC umbrella, each of the services has developed its own system based onthe OSD Cost Analysis Improvement Group (CAIG) cost element structure documented in DoD 5000.4M,entitled "DoD Cost Analysis Guidance and Procedures". The program includes the Navy's VAMOSC system,managed by the Naval Center for Cost Analysis (NCCA), the Air Force's system, known as Air Force TotalOwnership Cost (AFTOC) and managed by the Air Force Cost Analysis Agency (AFCAA), and the Army'sOperating and Support Management Information System (OSMIS), managed by the Cost and EconomicAnalysis Center (CEAC). These Service programs track the O&S costs for major weapon systems and somesub-systems using data drawn from their respective reporting organizations. Typical users of VAMOSCinclude estimators, financial programmers and logisticians.
All three Service systems face challenges to standardize cost elements and be able to validate these costsagainst financial data by appropriation. Each of the Service VAMOSC systems currently reports O&S costs ina format somewhat different from the CAIG O&S cost element structure. There is a continuing need toimprove data sources to ensure that weapon system life cycle costs (LCC) are fully reported in a more timelyfashion. Ideally, "real time" reporting of data is desired, but that is a very difficult goal to achieve. At present,Navy VAMOSC data is reported once a year. As enhancements and improvements are made, costcomparisons across Services will be easier as the systems, sources and coverage of the CAIG cost elementstructure are made more uniform.
Bearing in mind OSD's larger concern with the VAMOSC systems of all three Services, the purposes of thispaper are to focus on the U.S. Navy's VAMOSC database, discuss its strengths and weaknesses andconcentrate on its usefulness to the cost estimating discipline. O&S costs constitute a large proportion of thetotal LCC of Naval weapon systems. In a recent analysis, NCCA determined that O&S costs account for aboutone-third of electronic systems LCC, one-half of aircraft LCC and two-thirds of ships LCC. We have longrecognized the prominence of O&S costs as a major component of total costs, but for many years the U.S.Navy concerned itself primarily with the development and production costs of weapon systems. Today, tenyears after the end of the Cold War, we are placing renewed emphasis on controlling and reducing O&S costs.
In order to control and reduce O&S costs, we must have reliable data as to what those costs actually are, andsome fundamental precepts of economic decision-making must be adhered to. If the Navy wished to considerdecommissioning a number of ships and aircraft squadrons, the only costs relevant to such a decision would bethose that will actually disappear if the platforms are taken out of service. Similarly, only those incrementalcosts incurred by bringing new weapons systems into the inventory are relevant to a decision to expand Navalforces. Therefore, this implies the necessity to collect actual O&S costs by weapon system, i.e., by individualship, major ship system and aircraft type/model/series.
Paper presented at the RTO SAS Symposium on “Cost Structure and Life Cycle Cost (LCC) for Military Systems”, held in Paris, France, 24-25 October 2001, and published in RTO-MP-096.

8-2
Navy VAMOSC is a web-enabled Management Information System that collects and reports U.S. Navy andU.S. Marine Corps (USMC) weapon system direct O&S costs, some indirect costs and some related non-costdata, on an annual basis. The VAMOSC system stores data collected from 125 sources. Coverage of activeships extends from FY84 through FY00, ships' systems from FY86 through FY00, aircraft from FY86 throughFY00, aircraft systems from FY96 through FY00, missiles and torpedoes from FY92 through FY00 andUSMC ground systems from FY98 through FY00.
The U.S. Navy's VAMOSC Management Information System is highly relevant to the theme of the NATORTA Symposium on Cost Structure and Life Cycle Cost for Military Systems. As noted, O&S costs constitutea significant portion of life cycle costs, and VAMOSC is the only source of historical O&S costs for U.S.Navy ships, aircraft and other weapons systems. The resources devoted by the U.S. Navy towards theestablishment and maintenance of an Oracle-based relational database accessible through the Internet havedefinitely advanced the state-of-the-art in estimating O&S costs.
VISIBILITY AND MANAGEMENT OF OPERATING AND SUPPORT COSTS (VAMOSC)MANAGEMENT INFORMATION SYSTEM
ABSTRACT
In the past, decision makers in the U.S. Navy focused largely on development and procurement costs todetermine the inventory of ships, aircraft and other weapon systems to be acquired and operated. However, inrecent years the cost of operating and maintaining these systems has become a primary factor in the acquisitiondecision-making process for determining force levels and composition of the U.S. Navy. As a result, greatemphasis has been placed on the development, maintenance and availability of comprehensive databases forestimating operating and support (O&S) costs.
The Navy's Visibility and Management of Operating and Support Cost (VAMOSC) Management InformationSystem displays O&S costs and related information (e.g., operating hours, manning) about ships, aircraft,ordnance and tracked/wheeled vehicles. This information is contained in an Oracle relational database in ahierarchical cost element structure, by fiscal year. Depending on the specific system, this database contains upto 15 years of data collected annually from about 125 different sources.
The objectives of the VAMOSC system are:
• To provide visibility of O&S costs for use in cost analysis of major defenseacquisition programs and force structure alternatives in support of the Planning,Programming and Budgeting System (PPBS) process and satisfy the Congressionalrequirement that DoD track and report O&S costs for major acquisition programs.
• To provide visibility of critical maintenance and support costs at the subsystem levelin sufficient detail to promote cost-conscious design and configuration management ofnew and fielded defense programs.
• To provide visibility of O&S costs so they may be managed to reduce and controlprogram life-cycle costs.
• To improve the validity and credibility of O&S cost estimates by establishing a widelyaccepted database, thereby reducing the cost and time for collecting these defenseprogram O&S costs for specific applications.
The VAMOSC database was initiated in 1975 with a mandate to collect, process and display actual historicalcosts by platform and weapon system; thus, primarily direct costs are included. With minor exceptions, noallocated costs or indirect costs are included. Historically, VAMOSC data were used predominantly todevelop the O&S cost portion of LCC estimates for future weapon systems. Today, the VAMOSC database is
8-3
becoming an integral part of Navy efforts to understand better and reduce the Total Ownership Cost (TOC) ofexisting and future weapon systems. Navy VAMOSC is currently available to government and industry usersby several means, but access is increasingly made directly to the Oracle relational database using a webbrowser software.
The purposes of this paper are to present an overview of the U.S. Navy's VAMOSC program, provide detailedinformation on the various databases that comprise VAMOSC, discuss current and future VAMOSCimprovement efforts and demonstrate the utility of VAMOSC data in structuring cost estimating models, suchas the Operating and Support Cost Analysis Model (OSCAM).
As a record of actual historical O&S costs of ships, aircraft, ordnance, and ground systems that are used forcost estimating purposes, the U.S. Navy's VAMOSC database is highly relevant to the symposium theme of"Cost Structure and Life Cycle Cost for Military Systems" and specifically relates to the Database topic.
HISTORY OF VAMOSC
For many years the U.S. Navy, like the Army and Air Force, had no system for the collection of actual O&Scosts by weapons system, i.e., by individual ship, aircraft type/model/series, missile system, torpedo system ormajor ship and aircraft sub-system. Navy O&S costs associated with weapons systems are funded largelythrough the Operations and Maintenance, Navy (O&MN) and Manpower, Navy (MPN) appropriations. For anumber of years in the 1960's and 1970's, the Navy developed O&S cost factors for the O&MN and MPNappropriations. Using budget data, these factors were generated through a process that identified some directO&MN and MPN expenses to specific platforms and allocated all remaining O&MN and MPN to individualship platforms and aircraft type/model/series as indirect costs.
The direct cost factors were somewhat useful for cost estimating, but had the disadvantage of being based onprogramming estimates, not actual return costs. O&S cost estimates based on indirect cost factors were notvery useful for decision-making purposes, because they were allocated fixed costs. It became apparent that adatabase containing only direct assignable O&S costs by platform was needed.
In order to provide more useful O&S cost data, in 1975 the U.S. Deputy Secretary of Defense directed theServices to collect actual weapons systems O&S costs by platform and system. This directive wasimplemented through the Visibility and Management of Operating and Support Costs (VAMOSC) program,the most complete source of O&S cost data available to the three U.S. Military Services (Army, Navy and AirForce). Under the general VAMOSC umbrella, each of the services has developed its own system based on theOSD Cost Analysis Improvement Group (CAIG) cost element structure documented in DoD 5000.4M, entitled"DoD Cost Analysis Guidance and Procedures". The program includes the Navy's VAMOSC system,managed by the Naval Center for Cost Analysis (NCCA), the Air Force's system, known as Air Force TotalOwnership Cost (AFTOC) and managed by the Air Force Cost Analysis Agency (AFCAA), and the Army'sOperating and Support Management Information System (OSMIS), managed by the Cost and EconomicAnalysis Center (CEAC).
From 1975 to 1992, the Navy, like the Army and Air Force, pursued its individual VAMOSC system andmade its own decisions regarding the structure, financing and management of the program. During this periodof time, VAMOSC was not centrally managed by the Navy, but was divided into two segments, ships andaircraft, under the Naval Sea System Command (NAVSEASYSCOM) and the Naval Air Systems Command(NAVAIRSYSCOM), respectively.
A top-level management review was undertaken in 1991, resulting in some major changes. In 1992 the Officeof the Secretary of Defense for Program Analysis and Evaluation (OSD(PA&E)) assumed responsibility forVAMOSC administration of all three Services. Concurrent with this development, the Navy centralized itsmanagement of VAMOSC under the Naval Center for Cost Analysis (NCCA).

8-4
In addition to administrative and managerial changes, the top-level review also mandated certain technical andprocedural changes to improve the system. To address these issues, OSD (PA&E)) and the Service VAMOSCProgram Management Offices established a Functional Process Improvement Program (FPIP). To carry outspecific initiatives, a VAMOSC Improvement and Enhancement Working (VIEW) Group was formed. Thegroup primarily consists of representatives from PA&E, NCCA, the Army Cost and Economic Analysis Center(CEAC) and the Air Force Cost Analysis Agency (AFCAA). The VIEW Group's guiding principles for theFPIP and the future of VAMOSC are as follows:
"VAMOSC will be an integrated Department-wide O&S cost collection and reporting system.VAMOSC will provide easily accessed, timely, accurate O&S metrics and cost data, bothdirect and indirect, down to and including components, associated to selected materielsystems, to authorized customers. VAMOSC will be an open architecture environment (e.g.,data warehouse) incorporating standard data definitions and information sharing acrossDepartment activities. Data will be based on "actuals" that can be traced to specificorganizations that incurred the costs. The systems will support life cycle cost (LCC)management and the Planning, Programming, Budgeting System (PPBS) process. The levelof cost coverage will meet user needs."
There have been significant improvements to the VAMOSC systems of the three Services, but not all of theproblems discussed earlier have been solved. The Services' systems face challenges to standardize costelements and be able to validate these costs against financial data by appropriation. Each of the ServiceVAMOSC systems currently reports O&S costs in a format somewhat different from the CAIG O&S costelement structure. There is a continuing need to improve data source issues to ensure that weapon systemLCC are fully reported in a more timely fashion. Ideally, "real time" reporting of data is desired, but that is avery difficult goal to achieve. At present, Navy VAMOSC data is reported once a year. As enhancements andimprovements are made, cost comparisons across Services will be easier as the systems, sources and coverageof the CAIG cost element structure are made more uniform.
Efforts will continue to realize more completely the guiding principles of the VIEW Group. However, evenwith its known deficiencies, we can definitely state that VAMOSC is the most complete source of O&S costdata available to the three U.S. Military Services. It tracks O&S costs for major weapon systems and somesub-systems using data drawn from the Services' reporting systems. Typical users of VAMOSC includeestimators, financial programmers and logisticians.
The following chronology summarizes the most important events relating to the establishment and evolution ofthe U.S. Navy's VAMOSC into its present status.
1975 U.S. Deputy Secretary of Defense directed Services to collect actual weaponsystems O&S costs
1976 Chief of Naval Operations initiated Navy and Marine aircraft data systemmanaged by the Naval Air Systems Command
1977 Chief of Naval Operations initiated the Navy ship data system managed by theNaval Sea Systems Command
1984 DoD established VAMOSC Steering Committee to formulate policy for the program
1988 Senate Appropriations Committee directed Services to develop VAMOSC capability
1992 Responsibility for VAMOSC executive oversight and administration assigned to OSD CAIG;management of Navy VAMOSC assigned to NCCA
8-5
1996 OSD CAIG established the VAMOSC Improvement and Enhancement Working (VIEW)Group, consisting of representatives from PA&E, NCCA, CEAC and AFCAA
1997 Navy VAMOSC moved to electronic database environment
2001 Navy VAMOSC is fully web based
VAMOSC USERS
Historically, Navy, Marine Corps, OSD and industry cost analysts used VAMOSC data predominantly todevelop the O&S cost portion of LCC estimates for future weapon systems. Today, the VAMOSC database isbecoming an integral part of Navy efforts to understand more completely and reduce the Total Ownership Cost(TOC) of legacy and future weapon systems. Specifically, VAMOSC is being used to develop the O&Sportion of TOC baselines and to identify significant cost elements that might represent cost reductionopportunities. The VAMOSC data developed by the DoD Components are the authoritative source for reliableand consistent historical O&S cost information about major defense programs. Therefore, it is incumbent uponthe Navy to make VAMOSC data as accurate as possible. VAMOSC is being used for a wide variety ofapplications, including cost analysis, cost research, cost modeling and simulation and defense initiatives suchas the Quadrennial Defense Review. Other uses include:
• Derive and/or validate O&S costs of defense programs within the acquisition process.
• Assist in design tradeoff analyses of defense programs and subsystems.
• Assist in the development of modifications and new management techniques forcontrolling O&S cost for defense programs.
• Support the development of programs and budgets for both existing and futuredefense programs as part of the PPBS process.
• Provide a basis for, or validation of, O&S cost factors used to establishstandards for cost estimating.
• Assist operations and management of DoD Component organizations at alllevels.
The Navy VAMOSC database is available to government and industry users by several means. Frequent usersquery the Oracle relational database directly using a web browser software. There are approximately 450users who access the database directly. Infrequent users prefer to request specific data directly from NCCAvia the web site. This avenue precludes the need for the user to have a working knowledge of how theaforementioned database query software operates. Government and contractor users are typically provideddifferent levels of VAMOSC data access, as the database contains business sensitive information. Efforts arecurrently underway to increase the weapon system and cost element coverage, cost element visibility,timeliness and accessibility of VAMOSC data.
VAMOSC COMPONENTS
Five major areas constitute the Navy VAMOSC database: ships, ships' systems, aviation, Marine Corpsground systems, and weapons, i.e., missiles and torpedoes. When VAMOSC was initiated in the mid-seventies, there were only two components, ships and aircraft. As user requirements grew over time,VAMOSC was expanded to incorporate the other areas now covered by the system. The following tablesummarizes the current content of the Oracle-based VAMOSC database. Hard copy data for ships and aircraftexist for years prior to the time shown in the table.

8-6
VAMOSC SYSTEM COVERAGENo. of
System/Platforms
FYs
Ships (by hull) Active Ships Naval Reserve Force (NRF) Military Sealift Command (MSC)
675 51425
84-0089-0093-00
Ships' Systems (entire Cost Element Structure (CES) coverage)Ships' Systems (O&I level maintenance, by Equipment Identification Code (EIC))
65
1000s
86-00
91-00
Aviation Aircraft (entire CES by Type/Model/Series Aircraft Subsystems (O&I level maint. by EIC)
1721000s
86-0096-00
Weapons Air-Launched Missiles Surface-Launched Missiles Torpedoes
17 9 4
92-0092-0092-00
U.S. Marine Corps Ground Systems 176 98-00
VAMOSC UNIVERSES
A number of different reports are generated for the VAMOSC areas shown above. These reports containingvarious levels and aggregation of data are referred to as "universes". A universe is a logically organizedgrouping of sets of data inside a larger database to help provide intuition and structure to the process ofextracting data from the database. The following table lists all available universes with a brief description ofeach. Additional information can be obtained from the NCCA VAMOSC web site.
DESCRIPTION OF VAMOSC UNIVERSES
Ships Data and Ships DataSummary Universes
The most popular universe, Ships Data, covers both activeships and Naval Reserve Force (NRF) ships which were incommission for either the full fiscal year or for part of thefiscal year. NRF data are available on line for FY98 throughFY00. There are a total of 115 cost elements, including costsfor manpower, fuel, ordnance, maintenance, modernization,other support, and training. There are also 23 non-costelements, including data on steaming hours, barrels of fuel,man-days, ship status, percent of FY, number of ships, andnumber of personnel.
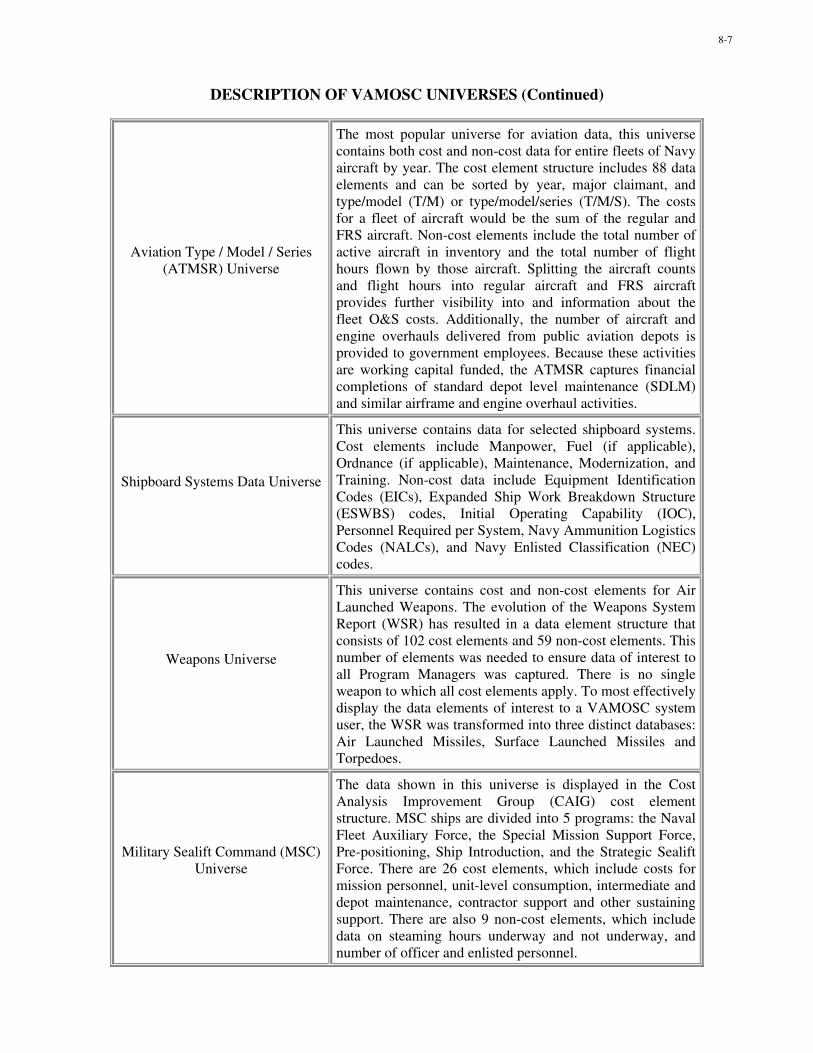
8-7
DESCRIPTION OF VAMOSC UNIVERSES (Continued)
Aviation Type / Model / Series(ATMSR) Universe
The most popular universe for aviation data, this universecontains both cost and non-cost data for entire fleets of Navyaircraft by year. The cost element structure includes 88 dataelements and can be sorted by year, major claimant, andtype/model (T/M) or type/model/series (T/M/S). The costsfor a fleet of aircraft would be the sum of the regular andFRS aircraft. Non-cost elements include the total number ofactive aircraft in inventory and the total number of flighthours flown by those aircraft. Splitting the aircraft countsand flight hours into regular aircraft and FRS aircraftprovides further visibility into and information about thefleet O&S costs. Additionally, the number of aircraft andengine overhauls delivered from public aviation depots isprovided to government employees. Because these activitiesare working capital funded, the ATMSR captures financialcompletions of standard depot level maintenance (SDLM)and similar airframe and engine overhaul activities.
Shipboard Systems Data Universe
This universe contains data for selected shipboard systems.Cost elements include Manpower, Fuel (if applicable),Ordnance (if applicable), Maintenance, Modernization, andTraining. Non-cost data include Equipment IdentificationCodes (EICs), Expanded Ship Work Breakdown Structure(ESWBS) codes, Initial Operating Capability (IOC),Personnel Required per System, Navy Ammunition LogisticsCodes (NALCs), and Navy Enlisted Classification (NEC)codes.
Weapons Universe
This universe contains cost and non-cost elements for AirLaunched Weapons. The evolution of the Weapons SystemReport (WSR) has resulted in a data element structure thatconsists of 102 cost elements and 59 non-cost elements. Thisnumber of elements was needed to ensure data of interest toall Program Managers was captured. There is no singleweapon to which all cost elements apply. To most effectivelydisplay the data elements of interest to a VAMOSC systemuser, the WSR was transformed into three distinct databases:Air Launched Missiles, Surface Launched Missiles andTorpedoes.
Military Sealift Command (MSC)Universe
The data shown in this universe is displayed in the CostAnalysis Improvement Group (CAIG) cost elementstructure. MSC ships are divided into 5 programs: the NavalFleet Auxiliary Force, the Special Mission Support Force,Pre-positioning, Ship Introduction, and the Strategic SealiftForce. There are 26 cost elements, which include costs formission personnel, unit-level consumption, intermediate anddepot maintenance, contractor support and other sustainingsupport. There are also 9 non-cost elements, which includedata on steaming hours underway and not underway, andnumber of officer and enlisted personnel.
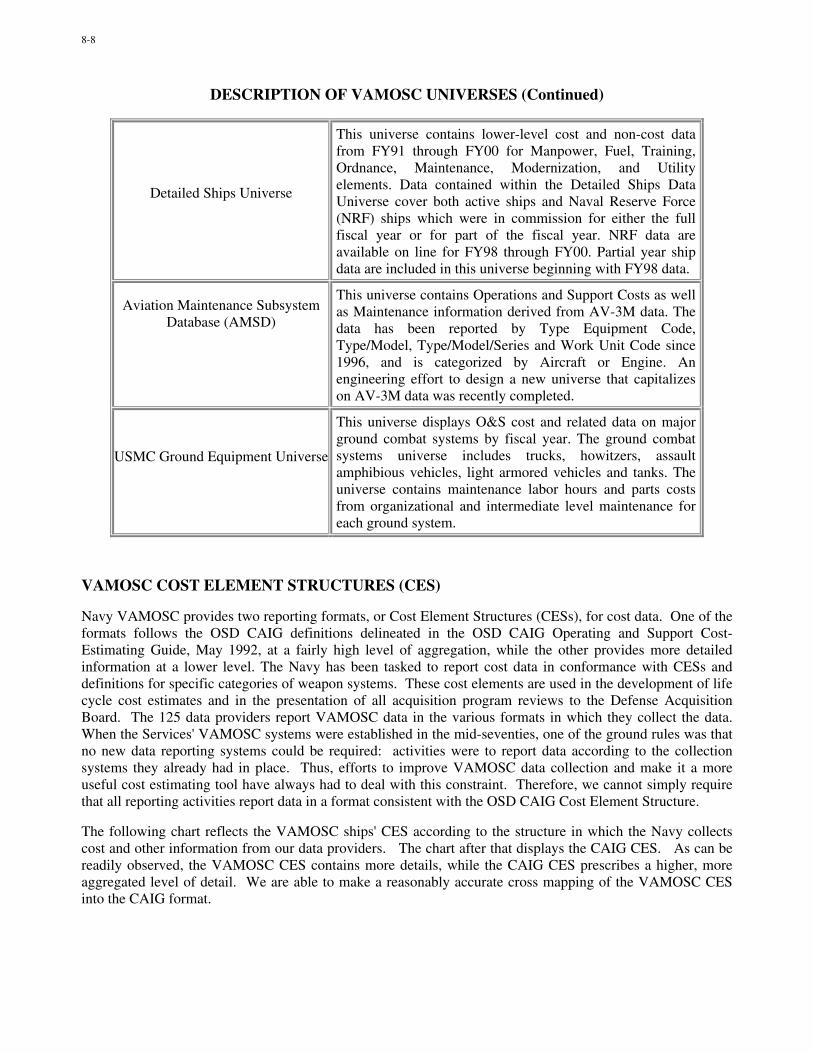
8-8
DESCRIPTION OF VAMOSC UNIVERSES (Continued)
Detailed Ships Universe
This universe contains lower-level cost and non-cost datafrom FY91 through FY00 for Manpower, Fuel, Training,Ordnance, Maintenance, Modernization, and Utilityelements. Data contained within the Detailed Ships DataUniverse cover both active ships and Naval Reserve Force(NRF) ships which were in commission for either the fullfiscal year or for part of the fiscal year. NRF data areavailable on line for FY98 through FY00. Partial year shipdata are included in this universe beginning with FY98 data.
Aviation Maintenance SubsystemDatabase (AMSD)
This universe contains Operations and Support Costs as wellas Maintenance information derived from AV-3M data. Thedata has been reported by Type Equipment Code,Type/Model, Type/Model/Series and Work Unit Code since1996, and is categorized by Aircraft or Engine. Anengineering effort to design a new universe that capitalizeson AV-3M data was recently completed.
USMC Ground Equipment Universe
This universe displays O&S cost and related data on majorground combat systems by fiscal year. The ground combatsystems universe includes trucks, howitzers, assaultamphibious vehicles, light armored vehicles and tanks. Theuniverse contains maintenance labor hours and parts costsfrom organizational and intermediate level maintenance foreach ground system.
VAMOSC COST ELEMENT STRUCTURES (CES)
Navy VAMOSC provides two reporting formats, or Cost Element Structures (CESs), for cost data. One of theformats follows the OSD CAIG definitions delineated in the OSD CAIG Operating and Support Cost-Estimating Guide, May 1992, at a fairly high level of aggregation, while the other provides more detailedinformation at a lower level. The Navy has been tasked to report cost data in conformance with CESs anddefinitions for specific categories of weapon systems. These cost elements are used in the development of lifecycle cost estimates and in the presentation of all acquisition program reviews to the Defense AcquisitionBoard. The 125 data providers report VAMOSC data in the various formats in which they collect the data.When the Services' VAMOSC systems were established in the mid-seventies, one of the ground rules was thatno new data reporting systems could be required: activities were to report data according to the collectionsystems they already had in place. Thus, efforts to improve VAMOSC data collection and make it a moreuseful cost estimating tool have always had to deal with this constraint. Therefore, we cannot simply requirethat all reporting activities report data in a format consistent with the OSD CAIG Cost Element Structure.
The following chart reflects the VAMOSC ships' CES according to the structure in which the Navy collectscost and other information from our data providers. The chart after that displays the CAIG CES. As can bereadily observed, the VAMOSC CES contains more details, while the CAIG CES prescribes a higher, moreaggregated level of detail. We are able to make a reasonably accurate cross mapping of the VAMOSC CESinto the CAIG format.
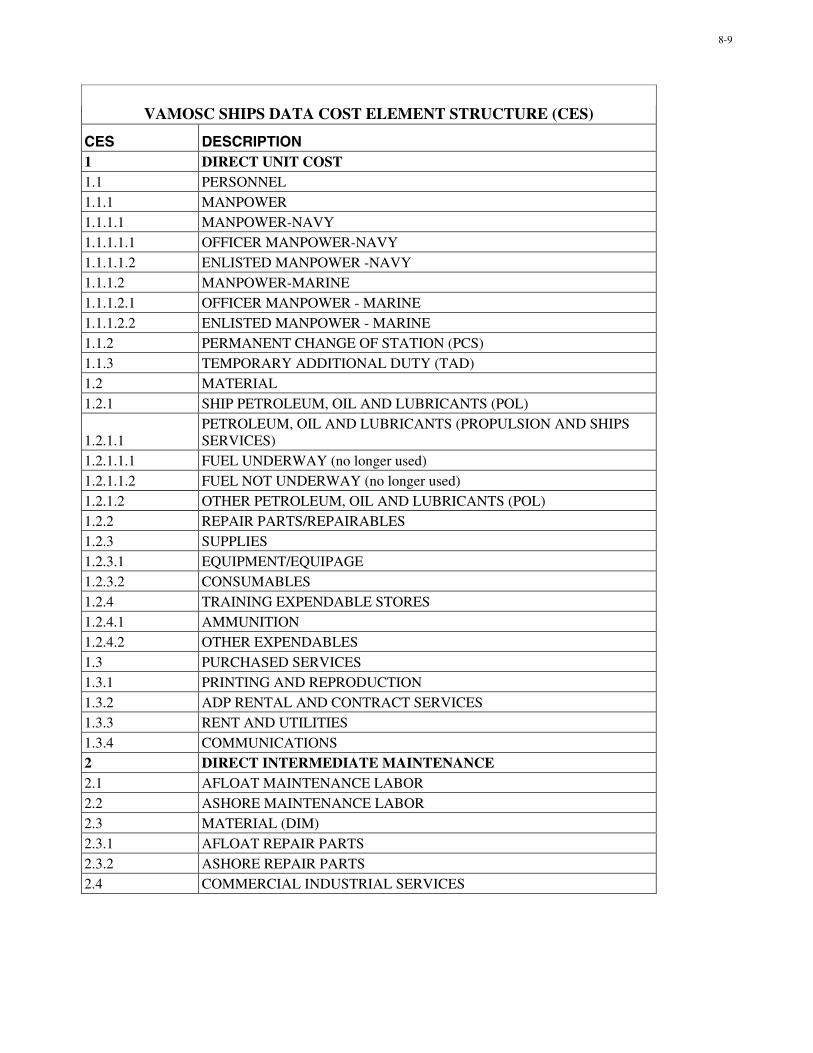
8-9
VAMOSC SHIPS DATA COST ELEMENT STRUCTURE (CES)
CES DESCRIPTION1 DIRECT UNIT COST1.1 PERSONNEL1.1.1 MANPOWER1.1.1.1 MANPOWER-NAVY1.1.1.1.1 OFFICER MANPOWER-NAVY1.1.1.1.2 ENLISTED MANPOWER -NAVY1.1.1.2 MANPOWER-MARINE1.1.1.2.1 OFFICER MANPOWER - MARINE1.1.1.2.2 ENLISTED MANPOWER - MARINE1.1.2 PERMANENT CHANGE OF STATION (PCS)1.1.3 TEMPORARY ADDITIONAL DUTY (TAD)1.2 MATERIAL1.2.1 SHIP PETROLEUM, OIL AND LUBRICANTS (POL)
1.2.1.1PETROLEUM, OIL AND LUBRICANTS (PROPULSION AND SHIPSSERVICES)
1.2.1.1.1 FUEL UNDERWAY (no longer used)1.2.1.1.2 FUEL NOT UNDERWAY (no longer used)1.2.1.2 OTHER PETROLEUM, OIL AND LUBRICANTS (POL)1.2.2 REPAIR PARTS/REPAIRABLES1.2.3 SUPPLIES1.2.3.1 EQUIPMENT/EQUIPAGE1.2.3.2 CONSUMABLES1.2.4 TRAINING EXPENDABLE STORES1.2.4.1 AMMUNITION1.2.4.2 OTHER EXPENDABLES1.3 PURCHASED SERVICES1.3.1 PRINTING AND REPRODUCTION1.3.2 ADP RENTAL AND CONTRACT SERVICES1.3.3 RENT AND UTILITIES1.3.4 COMMUNICATIONS2 DIRECT INTERMEDIATE MAINTENANCE2.1 AFLOAT MAINTENANCE LABOR2.2 ASHORE MAINTENANCE LABOR2.3 MATERIAL (DIM)2.3.1 AFLOAT REPAIR PARTS2.3.2 ASHORE REPAIR PARTS2.4 COMMERCIAL INDUSTRIAL SERVICES

8-10
VAMOSC SHIPS DATA COST ELEMENT STRUCTURE (CES)WBS DESCRIPTION3 DIRECT DEPOT MAINTENANCE/MODERNIZATION3.1 SCHEDULED SHIP OVERHAUL3.1.1 REGULAR OVERHAUL3.1.1.1 PUBLIC SHIPYARD (ROH)3.1.1.1.1 OVERHEAD (ROH PUBLIC)*3.1.1.1.2 LABOR (ROH PUBLIC)*3.1.1.1.3 MATERIAL (ROH PUBLIC)*3.1.1.2 PRIVATE SHIPYARD (ROH)3.1.1.3 SHIP REPAIR FACILITY (ROH)3.1.1.3.1 OVERHEAD (ROH SRF)*3.1.1.3.2 LABOR (ROH SRF)*3.1.1.3.3 MATERIAL (ROH SRF)*3.1.2 SELECTED RESTRICTED AVAILABILITY (SRA)3.1.2.1 PUBLIC SHIPYARD (SRA)3.1.2.1.1 OVERHEAD (SRA PUBLIC)*3.1.2.1.2 LABOR (SRA PUBLIC)*3.1.2.1.3 MATERIAL (SRA PUBLIC)*3.1.2.2 PRIVATE SHIPYARD (SRA)3.1.2.3 SHIP REPAIR FACILITY (SRA)3.1.2.3.1 OVERHEAD (SRA SRF)*3.1.2.3.2 LABOR (SRA SRF)*3.1.2.3.3 MATERIAL (SRA SRF)*3.1.3 OTHER SCHEDULED SHIP OVERHAUL3.2 NONSCHEDULED SHIP REPAIRS3.2.1 RESTRICTED AVAILABILITY3.2.1.1 PUBLIC SHIPYARD (RAV)3.2.1.1.1 OVERHEAD (RAV PUBLIC)*3.2.1.1.2 LABOR (RAV PUBLIC)*3.2.1.1.3 MATERIAL (RAV PUBLIC)*3.2.1.2 PRIVATE SHIPYARD (RAV)3.2.1.3 SHIP REPAIR FACILITY (RAV)3.2.1.3.1 OVERHEAD (RAV SRF)*3.2.1.3.2 LABOR (RAV SRF)*3.2.1.3.3 MATERIAL (RAV SRF)*3.2.2 TECHNICAL AVAILABILITY (TAV)3.2.2.1 PUBLIC SHIPYARD (TAV)3.2.2.1.1 OVERHEAD (TAV PUBLIC)*3.2.2.1.2 LABOR (TAV PUBLIC)*3.2.2.1.3 MATERIAL (TAV PUBLIC)*3.2.2.2 PRIVATE SHIPYARD (TAV)
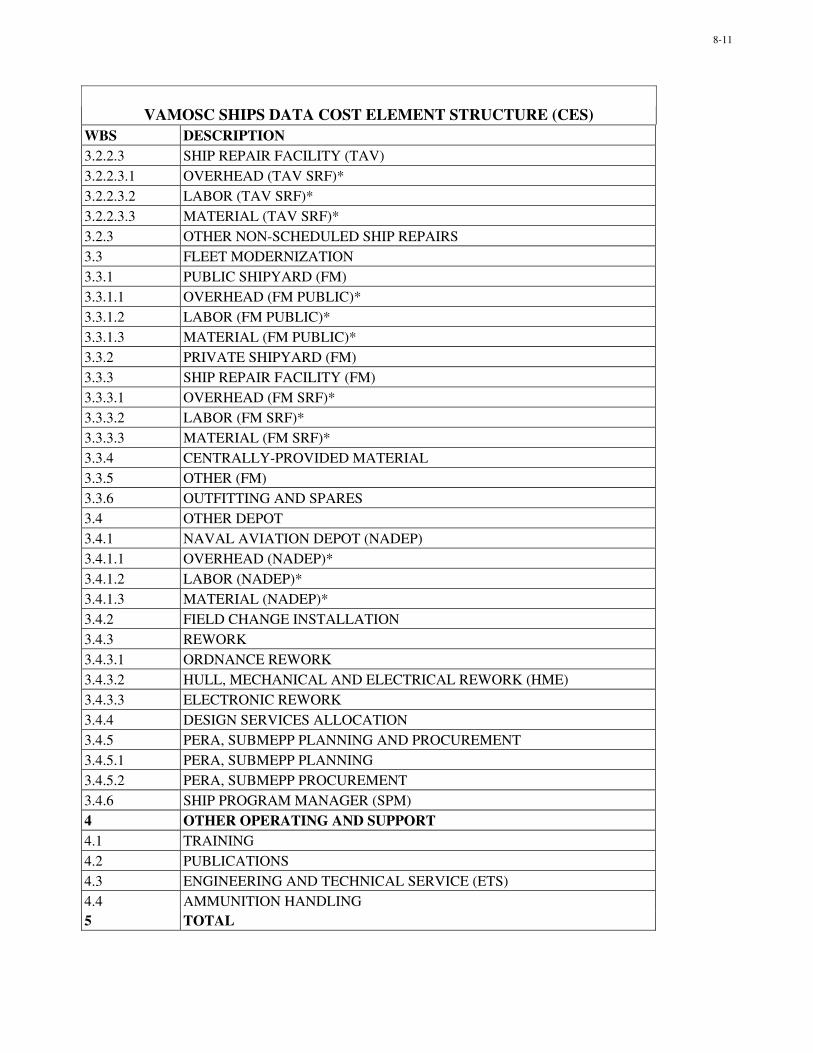
8-11
VAMOSC SHIPS DATA COST ELEMENT STRUCTURE (CES)WBS DESCRIPTION3.2.2.3 SHIP REPAIR FACILITY (TAV)3.2.2.3.1 OVERHEAD (TAV SRF)*3.2.2.3.2 LABOR (TAV SRF)*3.2.2.3.3 MATERIAL (TAV SRF)*3.2.3 OTHER NON-SCHEDULED SHIP REPAIRS3.3 FLEET MODERNIZATION3.3.1 PUBLIC SHIPYARD (FM)3.3.1.1 OVERHEAD (FM PUBLIC)*3.3.1.2 LABOR (FM PUBLIC)*3.3.1.3 MATERIAL (FM PUBLIC)*3.3.2 PRIVATE SHIPYARD (FM)3.3.3 SHIP REPAIR FACILITY (FM)3.3.3.1 OVERHEAD (FM SRF)*3.3.3.2 LABOR (FM SRF)*3.3.3.3 MATERIAL (FM SRF)*3.3.4 CENTRALLY-PROVIDED MATERIAL3.3.5 OTHER (FM)3.3.6 OUTFITTING AND SPARES3.4 OTHER DEPOT3.4.1 NAVAL AVIATION DEPOT (NADEP)3.4.1.1 OVERHEAD (NADEP)*3.4.1.2 LABOR (NADEP)*3.4.1.3 MATERIAL (NADEP)*3.4.2 FIELD CHANGE INSTALLATION3.4.3 REWORK3.4.3.1 ORDNANCE REWORK3.4.3.2 HULL, MECHANICAL AND ELECTRICAL REWORK (HME)3.4.3.3 ELECTRONIC REWORK3.4.4 DESIGN SERVICES ALLOCATION3.4.5 PERA, SUBMEPP PLANNING AND PROCUREMENT3.4.5.1 PERA, SUBMEPP PLANNING3.4.5.2 PERA, SUBMEPP PROCUREMENT3.4.6 SHIP PROGRAM MANAGER (SPM)4 OTHER OPERATING AND SUPPORT4.1 TRAINING4.2 PUBLICATIONS4.3 ENGINEERING AND TECHNICAL SERVICE (ETS)4.4 AMMUNITION HANDLING5 TOTAL

8-12
VAMOSC SHIPS NON-COST ELEMENT STRUCTURE (CES)A SHIP OPERATING DATAA.1 NUMBER OF SHIPSA.2 PERCENT OF FYA.3 NUMBER OF ENLISTED PERSONNELA.3.1 NUMBER OF ENLISTED PERSONNEL - MARINEA.3.2 NUMBER OF ENLISTED PERSONNEL - NAVYA.4 NUMBER OF OFFICER PERSONNELA.4.1 NUMBER OF OFFICER PERSONNEL - MARINEA.4.2 NUMBER OF OFFICER PERSONNEL - NAVYA.5 STEAMING HOURSA.5.1 STEAMING HOURS UNDERWAYA.5.2 STEAMING HOURS NOT UNDERWAYA.6 TOTALS BARRELS OF FUEL CONSUMEDA.6.1 BARRELS OF FUEL CONSUMED UNDERWAYA.6.2 BARRELS OF FUEL CONSUMED NOT UNDERWAYA.6.3 BARRELS OF FUEL CONSUMED OTHERB SHIP MAINTENANCE DATAB.1 O-LEVEL REPORTED MAINTENANCE LABOR MANHOURSB.2 I-LEVEL MAINTENANCE LABOR MANHOURSB.2.1 I-LEVEL AFLOAT MAINTENANCE LABOR MANHOURSB.2.2 I-LEVEL ASHORE MAINTENANCE LABOR MANHOURSB.3 MANDAYS (ROH PUBLIC)*B.4 MANDAYS (SRA PUBLIC)*B.5 MANDAYS (RAV PUBLIC)*B.6 MANDAYS (TAV PUBLIC)*B.7 MANDAYS (FM PUBLIC)*
*BUSINESS SENSITIVE DATA
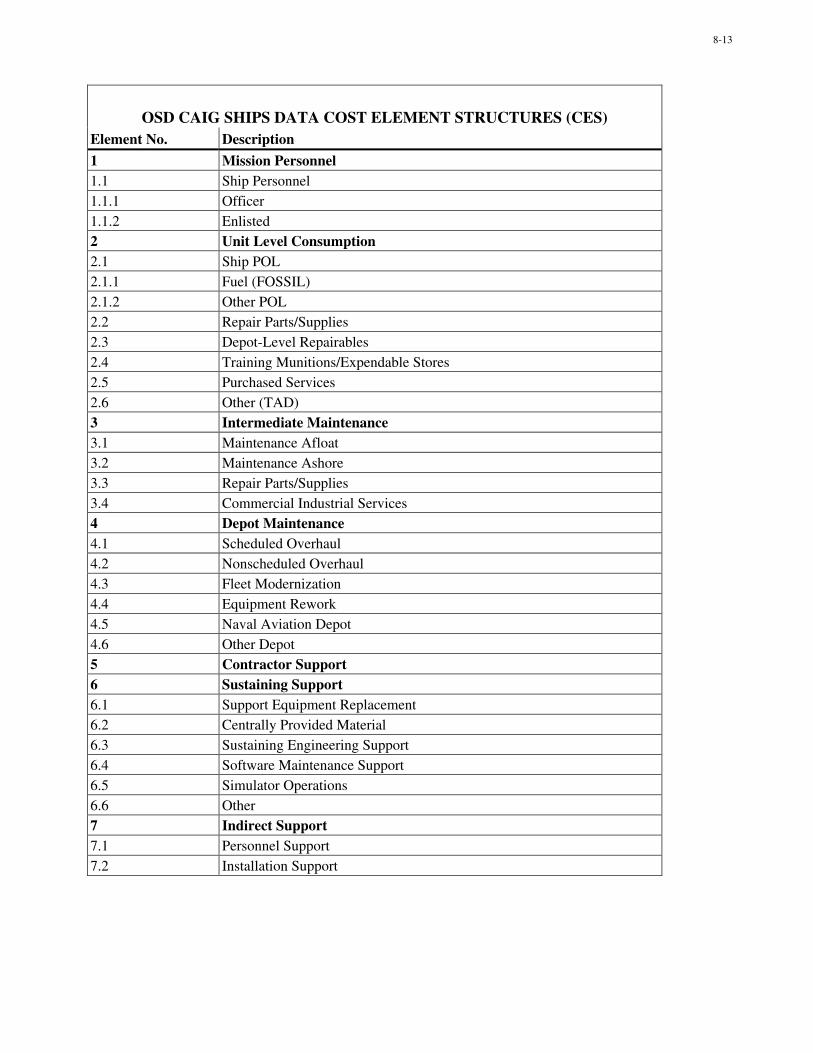
8-13
OSD CAIG SHIPS DATA COST ELEMENT STRUCTURES (CES)Element No. Description
1 Mission Personnel1.1 Ship Personnel1.1.1 Officer1.1.2 Enlisted2 Unit Level Consumption2.1 Ship POL2.1.1 Fuel (FOSSIL)2.1.2 Other POL2.2 Repair Parts/Supplies2.3 Depot-Level Repairables2.4 Training Munitions/Expendable Stores2.5 Purchased Services2.6 Other (TAD)3 Intermediate Maintenance3.1 Maintenance Afloat3.2 Maintenance Ashore3.3 Repair Parts/Supplies3.4 Commercial Industrial Services4 Depot Maintenance4.1 Scheduled Overhaul4.2 Nonscheduled Overhaul4.3 Fleet Modernization4.4 Equipment Rework4.5 Naval Aviation Depot4.6 Other Depot5 Contractor Support6 Sustaining Support6.1 Support Equipment Replacement6.2 Centrally Provided Material6.3 Sustaining Engineering Support6.4 Software Maintenance Support6.5 Simulator Operations6.6 Other7 Indirect Support7.1 Personnel Support7.2 Installation Support
8-14
ONGOING ENHANCEMENTS AND IMPROVEMENTS
In 1999, NCCA hired an independent contractor to conduct a thorough Independent Validation andVerification (IV&V) effort of Navy VAMOSC, which was completed in February 2000. We identified 85enhancements and improvements that needed to be accomplished in order for VAMOSC to provide the fullrange of capability needed by our users. Many of these enhancements and improvements involved informationtechnology (IT) advancements, while others addressed expanded data coverage, improved processing anddisplay of data and managerial improvements. All but five of the recommended enhancements andimprovements have been accomplished to date. The uncompleted items are receiving priority attention toensure their complete and timely implementation.
FUTURE GOALS AND IMPROVEMENTS
NCCA has a number of initiatives planned for the future, most of them involving technical redesign ofportions of the system, while others focus on addressing more detailed coverage desired by some of our users.The redesign goals will result in dynamic escalation of constant year dollars, dynamic rollups of base elementsfor enhancing the ease of future database updates, and separating costs and count elements to allow verticalmath on the database. At present, a change made to an element in one of our database universes does notautomatically correct all subsequent information that uses that element. The dynamic escalation and dynamicrollup improvements will largely correct this problem. NCCA will have these important modificationsimplemented by the end of this year.
Additional expansion of the database itself will also be undertaken. For example, we want to have increaseddepth and precision in organizational and intermediate maintenance and military personnel costs. Differenttypes of fuel experience different price increases, so we plan to develop and apply different inflation rates todifferent types of fuel. We also plan to add other metrics to the database, such as the amount of fuelconsumption in gallons and the number of personnel actually assigned to operational units.
Redesign specifications will be implemented in some of the database universes. The Aircraft Type-Model-Series Report will identify Navy and Marine Corps personnel by function, i.e., operations, maintenance orsupport. Details of actual payroll (base pay, allowances, bonuses, Federal Insurance Contribution Act (FICA)and retirement accrual) will be displayed by function. Summary level payroll costs will also be shown; forexample, in addition to the details of payroll, all components of pay will be shown in a single element as well.
Redesign specifications for the Ships System Universe will involve improvements to the historical data,structural and quality components of the database. With respect to historical data, there will bestandardization, updating and correction of past data, based on updated source data. In the area of structuralchanges, there will be standardization of CESs, modification of the cross mapping between the VAMOSC andCAIG CESs and more details in the Individual Ships Report. Quality improvements will include addressingthe remaining incomplete enhancements and improvements identified in the IV&V process, and strengtheningintermediate level maintenance by capturing and screening all costs.
SUMMARY
Although NCCA has made significant improvements in Navy VAMOSC in recent years, we see this as acontinuing process. Recognizing that needs may change over time, we will continue to ask our users forfeedback regarding Navy VAMOSC, and will exert every effort to accommodate their recommendations andsuggestions. Importantly, NCCA will stay abreast of ever-changing Information Technology advances andtake full advantage of the latest technical innovations.
References:
1. Visibility and Management of Operations (sic) and Support Cost (VAMOSC), Functional Process Improvement,Phase 2, Data Model Report, January 1998

9-1
OSCAM – Simulating Operation and Support CostsUsing System Dynamics
Julian Burridge Jonathan CoyleSPS/Cost Forecasting HVR Consulting Services Ltd
Elm1b #187 Selborne HouseMinistry of Defence Mill Lane
Abbey Wood AltonBristol, BS34 8JH Hants, GU34 2QJUnited Kingdom United Kingdom
SPS is one of the primary sponsors for OSCAM development and support in the UK MoD. HVR ConsultingServices Ltd (HVR) is the developer of the software on behalf of MoD and DoD.
BACKGROUND
1. In the spring of 1996 the UK Ministry of Defence (MoD) Specialist Procurement Services, now part of theDefence Procurement Agency and US Department of Defense (DoD) representatives discussed the needfor a new cost model for the Operation and Support elements of an equipment life cycle. Concerns hadbeen expressed that existing tools did not properly represent the dynamic nature of Operation and Support(O&S), nor were they tailored to the needs of users. Therefore in August 1996 a contract to develop a‘proof of concept’ demonstrator for shipboard systems (Sys model) was placed with HVR-CSL. Thisdemonstrator was delivered in late 1996 and became known as the Operation and Support Cost AnalysisModel (OSCAM).
2. Pretty early on it was recognised that OSCAM Ship and Ship Sys models were particularly useful toHILS(N), now part of the UK Warship Support Agency Whole Life Support Group. As a result work onthese models has been jointly funded with SPS in the UK.
3. Following the success of the Sys demonstrator, version 1.0 of a Sys model and a separate Ship modelwere both delivered in late 1997. Since then, there have been several versions of the OSCAM Sys andShip models (version 5.0 was released in June 2001) and other models have been developed. These othermodels include OSCAM Land, OSCAM ADGE, and OSCAM FASH in the UK, as well as OSCAMAAAV and OSCAM Air in the US.
WHY CONCENTRATE ON O&S COSTS?
4. The end of the Cold War witnessed the demise of the main defence threat to the West. This led to smallerdefence budgets and enabled Governments to spend the monies saved on other priorities (health,education etc.) and reduce personal taxation. Collectively this was known as the ‘peace dividend’.Shrinking budgets generally means one of two things: 1) you try to achieve the same outputs with lessmoney, i.e. greater efficiency; or 2) you reduce your outputs to match with your inputs. The intelligentmoney went on the first of these two options.
5. One obvious place to make savings was from the operation and support phases of an equipment life cycleas this is where the majority of the life cycle costs are expended. Ships and ship systems are a particularchallenge given the refitting and maintenance cycles. At the same time, the US DoD were fortunate inhaving a large database called VAMOSC which could be used to populate and test models. This led to ajoint project in which the UK funded OSCAM shipboard sys(tem) and ship model development and theUS provided data. The success of these programmes resulted in a jointly funded development programmewith Ship and Sys costs shared between the US and UK. Each country has now funded further models totackle particular equipment types.
Paper presented at the RTO SAS Symposium on “Cost Structure and Life Cycle Cost (LCC) for Military Systems”, held in Paris, France, 24-25 October 2001, and published in RTO-MP-096.
9-2
METHODOLOGY FOR DEVELOPING AN OSCAM TOOL
6. The OSCAM model tool set is based on the concept of System Dynamics modelling. This techniqueenables the processes surrounding operating and maintaining the equipment to be mapped into the model.
7. To develop the model(s) takes time, commitment and resources from the developers, sponsors, andstakeholders who operate and support the equipment. The initial stage is a facilitated workshop. Duringthis session, all processes are identified and mapped out. Further workshop sessions then take place oneach process. The end result is an influence diagram of all maintenance and support activities that makeup the system dynamics model. Near neighbour or reference systems can then be used to initially populatethe model. Forecasts for new systems or equipment O&S costs can then be soundly based.
ADDITIONAL (BUT RELATED) TOOLS
8. The DMT (Data Management Tool) was developed so that platforms and equipment could be modelled inmore detail. Whilst OSCAM works at a fairly high level to represent platforms or whole equipment, manyusers are interested in identifying which pieces of a system are the ‘cost drivers’. As a result DMT wasdeveloped so that it can be used in isolation or ‘fed into’ OSCAM to produce O&S costs.
9. The PCT (Parametric Cost Tool) has been developed to enable analysis of data such that trends can beidentified.
OSCAM SHIP AND SYS (UK AND US)
10. After a recent Validation and Verification exercise, OSCAM Ship and Sys(tem) models are now bothconsidered fully mature. As a consequence they have moved from the development to upkeep phase. Therelease of version 5.1 is imminent, however version 6.0 has been put on hold awaiting developments.
11. OSCAM Ship and Sys are being used on several platforms such as Type 23 and CV(F), in additionOSCAM Sys is planned to be used on the Sonar & Signature Improvement Programme. In addition thebenefits of Reliability Centred Maintenance was addressed using OSCAM for the Hunt class of vessels.
OSCAM LAND (UK)
12. The development of UK OSCAM Land over the last two years culminated in the release of Version 4.03in August 2001. The OSCAM Land model has undergone a successful Verification and Validationexercise and is being used on a myriad of ‘land’ projects including the Terrier programme. Terrier is theprogramme for replacing the ageing Combat Engineer Tractor (CET).
OSCAM ADGE (UK)
13. A model was developed for the Air Defence Ground Equipment by RAF HQ. Version 1.0 was released in1999.
OSCAM FASH (UK)
14. A model was developed for the Future Amphibious Support Helicopter (FASH) IPT - now SABR IPT.V1.0 of this model was V&V’d and the intention was to upgrade this to V2.0. However due to a changein priorities on the project this has not yet been progressed.
15. As the FASH model was based on Sea King data there now exists the basis for a model for rotary wingnaval aircraft.

9-3
UK OSCAM AIR (UK)
16. Due to the difficulties associated with Air projects across the Services, this has been put on hold.Whereas the Navy currently operates a ‘three trade’ maintenance system, the RAF uses five. The Navygenerally maintains their aircraft on a chronological basis, whereas the RAF operates on a flying hourbased routine. These issues are currently being addressed under the heading of Joint Force 2000. Add intothe equation the way that the army do their aircraft maintenance and there are challenging issues to beaddressed before developing a generic air model such as OSCAM, that is based on system dynamicsmodelling of current support methods. Further work is needed before deciding if a generic ‘Air’ model isuseful or whether a range of separate models would be required. This needs to be resolved as it impactsbudgets.
US DoD MODELS
17. In addition to making extensive use of the Ship and Sys models, the US DoD have developed bespokemodels for their own use such as OSCAM AAAV and OSCAM Air (C17).
SUPPORT (INCLUDING TRAINING)
18. Support to existing models is seen as key to ensuring that the initial investment is not wasted. ThereforeSPS have placed a contract that covers, amongst other things, the development of training packs, theprovision of courses, help desk and change control.
19. Current courses range from 1 day ‘awareness’ to 5 day detailed ‘expert’ courses on OSCAM Ship andShip Sys. Both internal to MoD and Industry can, and have, attended these courses.
MODEL DEVELOPMENT
20. As stated earlier, OSCAM has been developed using a methodology known as System Dynamics (SD).This approach was developed in the late 1950s at MIT and was one of the first dynamic business processmodelling techniques. It was chosen for OSCAM for the following reasons:
• SD is a well established approach and so this reduced the project risk;• We wanted to be able to study alternative support and maintenance strategies and so needed a
business process model; and• Use of a dynamic, time based simulation technique creates a more accurate representation of the
operating conditions of the equipment which is one of the primary drivers of O&S costs.
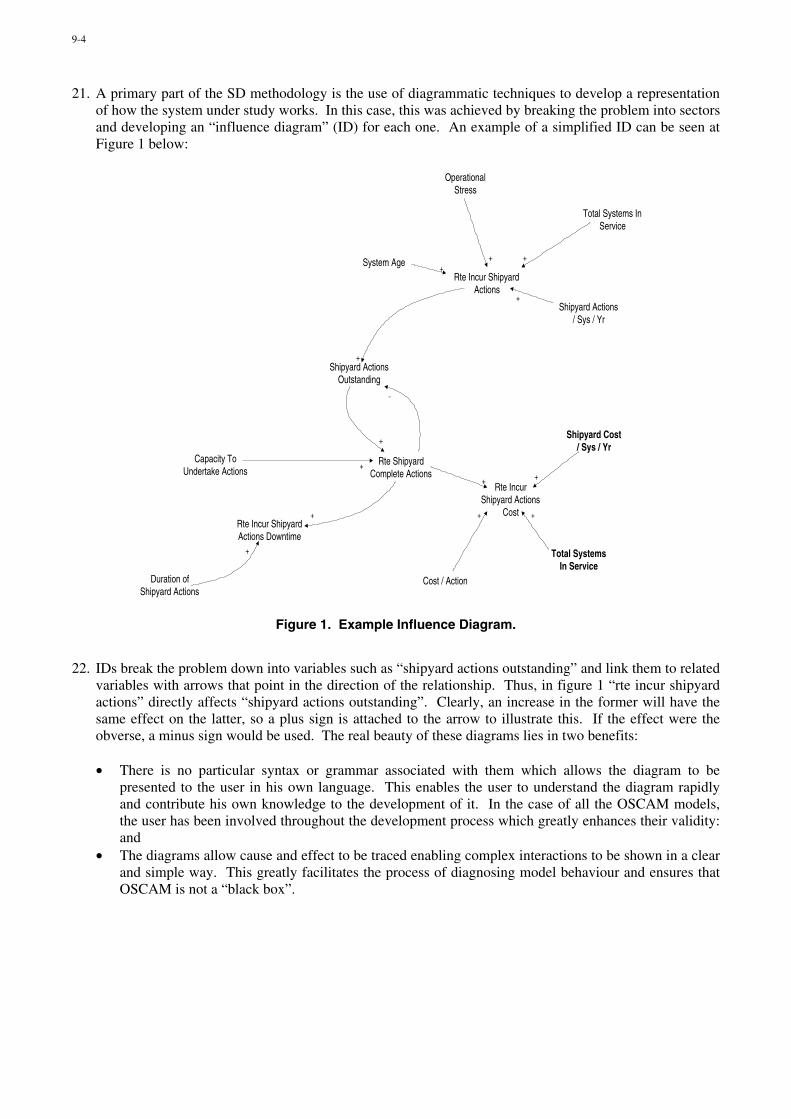
9-4
21. A primary part of the SD methodology is the use of diagrammatic techniques to develop a representationof how the system under study works. In this case, this was achieved by breaking the problem into sectorsand developing an “influence diagram” (ID) for each one. An example of a simplified ID can be seen atFigure 1 below:
Rte ShipyardComplete Actions
Capacity ToUndertake Actions
Rte Incur ShipyardActions Downtime
Duration ofShipyard Actions
Rte IncurShipyard Actions
Cost
Cost / Action
Shipyard Cost/ Sys / Yr
Total SystemsIn Service
Shipyard ActionsOutstanding
Rte Incur ShipyardActions
Shipyard Actions/ Sys / Yr
Total Systems InService
OperationalStress
System Age
+
+
+
+ +
+ +
+
−
+
++ +
+
Figure 1. Example Influence Diagram.
22. IDs break the problem down into variables such as “shipyard actions outstanding” and link them to relatedvariables with arrows that point in the direction of the relationship. Thus, in figure 1 “rte incur shipyardactions” directly affects “shipyard actions outstanding”. Clearly, an increase in the former will have thesame effect on the latter, so a plus sign is attached to the arrow to illustrate this. If the effect were theobverse, a minus sign would be used. The real beauty of these diagrams lies in two benefits:
• There is no particular syntax or grammar associated with them which allows the diagram to bepresented to the user in his own language. This enables the user to understand the diagram rapidlyand contribute his own knowledge to the development of it. In the case of all the OSCAM models,the user has been involved throughout the development process which greatly enhances their validity:and
• The diagrams allow cause and effect to be traced enabling complex interactions to be shown in a clearand simple way. This greatly facilitates the process of diagnosing model behaviour and ensures thatOSCAM is not a “black box”.

9-5
23. A set of IDs, known as sectors, are linked together to form a representation of the entire O&S process.The sectors that make up OSCAM (Ship) can be seen at Figure 2 below:
Overhauls
Facilities TrainingETS
Operating Profile DisposalIntroduction
FuelConsumables
Ordnance
Intermediate AfloatMaint.
Intermediate AshoreMaint.
OrganizationalMaint.
SoftwareManning
Intermediate AfloatMaint.
Intermediate AshoreMaint.
OrganizationalMaint.
Software
Figure 2. Sectors of OSCAM (Ship).
24. In Figure 2, the spine of the model is represented by the three sectors in the middle known as“introduction”, “operating profile”, and “disposal”. These represent the life cycle of the equipment and,in most models, the middle section is split into a number of environments. This allows us to distinguishbetween equipment used for, say, training and those used on real operations. The beauty of this is thatdifferent operating conditions and their associated stresses can be represented providing an accuraterepresentation of real operations and their impact on the equipment. Around this spine, are sectors thatdeal with the various lines of maintenance, consumables of various types, other facilities, and, inparticular the overhaul cycle of the equipment. Each of these can be varied or bypassed. This allows usto simulate a wide variety of alternative maintenance strategies such as Reliability Centred Maintenance(RCM) or Contractor Logistic Support (CLS). For example, to simulate RCM, the user would build uphis scenario by varying one parameter at a time. He might start by reducing the number of repairs at firstline being the anticipated benefit of this policy. Clearly, this would produce a beneficial result at the endof the model run, so he would now want to consider the penalty that needs to be paid to achieve thisresult. This could be represented by increasing the number of inspections that were needed at first line orby investing in test equipment. By slowly building up this scenario in this way, the user would be able toassess the pros and cons of a particular policy initiative.
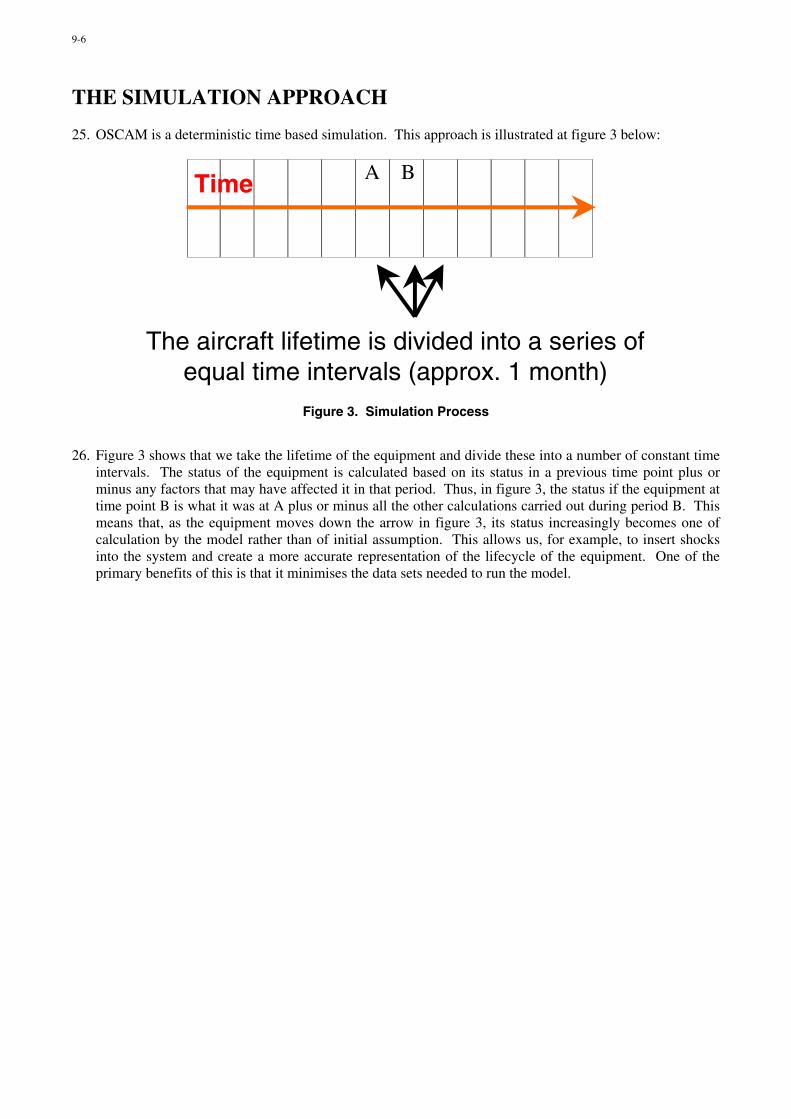
9-6
THE SIMULATION APPROACH
25. OSCAM is a deterministic time based simulation. This approach is illustrated at figure 3 below:
A B
The aircraft lifetime is divided into a series ofequal time intervals (approx. 1 month)
Time
Figure 3. Simulation Process
26. Figure 3 shows that we take the lifetime of the equipment and divide these into a number of constant timeintervals. The status of the equipment is calculated based on its status in a previous time point plus orminus any factors that may have affected it in that period. Thus, in figure 3, the status if the equipment attime point B is what it was at A plus or minus all the other calculations carried out during period B. Thismeans that, as the equipment moves down the arrow in figure 3, its status increasingly becomes one ofcalculation by the model rather than of initial assumption. This allows us, for example, to insert shocksinto the system and create a more accurate representation of the lifecycle of the equipment. One of theprimary benefits of this is that it minimises the data sets needed to run the model.

9-7
SOFTWARE ARCHITECTURE
27. OSCAM was developed using a SD case tool known as Powersim. This is a very powerful piece ofsoftware but is not particularly user friendly. We therefore developed a shell that sits around the model,written in a language known as Delphi. This makes the model much more accessible and gives it aMicrosoft Office look and feel. The benefit of this is that users can get to grips with the model quicklyand that training can focus on the detailed calculations of the tool rather than user access. An example ofan OSCAM screen can be seen at Figure 4 below.
Figure 4. Example OSCAM Screen

9-8
28. Data is stored in ACCESS databases that are obviously compatible with other tools such as Excel of otherSQL databases. This greatly facilitates the collection as well as the storage of data. However, OSCAMdoes require fairly aggregated data to drive it. This is not always readily accessible and so we created asecond tool know as the Data Management Tool (DMT). This enables the user to create any kind ofhierarchy that he likes, enter data at the lowest level and aggregate it up to provide an OSCAM compliantdata set. An example can be seen at Figure 5 below.
Figure 5. OSCAM DMT Screen
29. The DMT is designed to look like Windows Explorer and therefore any node that has a plus sign next to ithas children. Data can only be entered at the lowest level. Any type of hierarchy can be created and theuser does not have to go down to the same level of detail in all areas. This allows complete flexibility andit should be possible to create an OSCAM data set from almost any source.
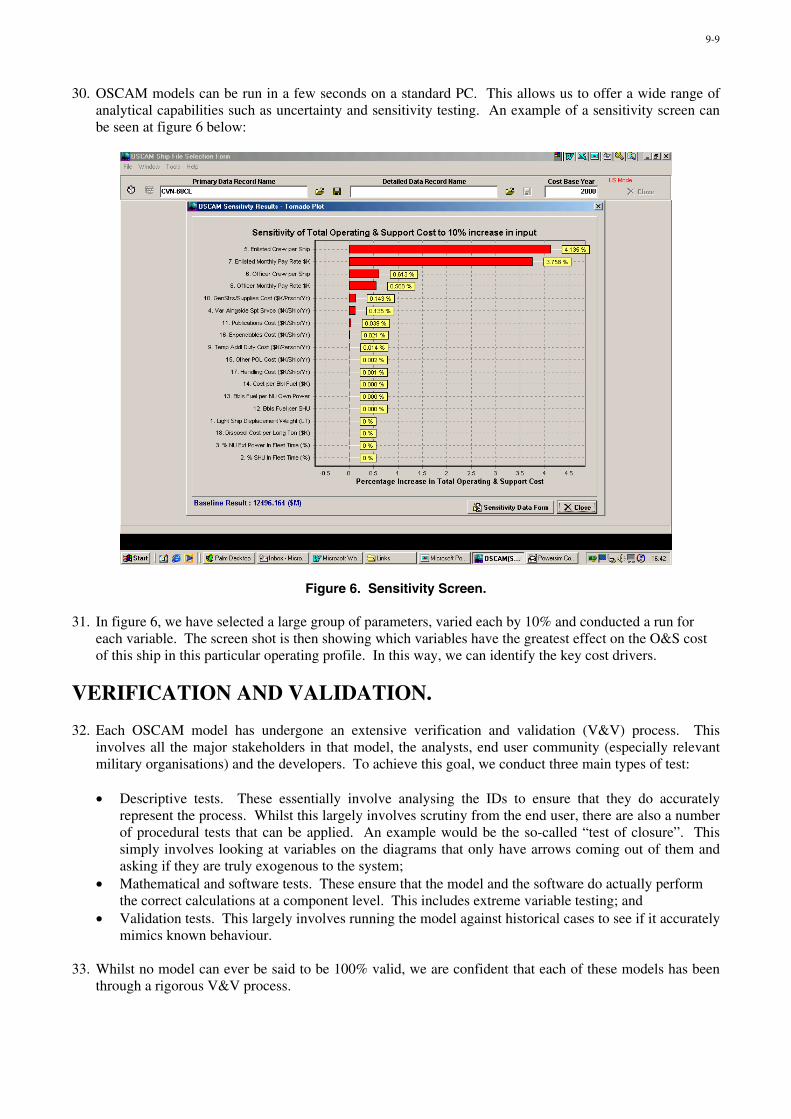
9-9
30. OSCAM models can be run in a few seconds on a standard PC. This allows us to offer a wide range ofanalytical capabilities such as uncertainty and sensitivity testing. An example of a sensitivity screen canbe seen at figure 6 below:
Figure 6. Sensitivity Screen.
31. In figure 6, we have selected a large group of parameters, varied each by 10% and conducted a run foreach variable. The screen shot is then showing which variables have the greatest effect on the O&S costof this ship in this particular operating profile. In this way, we can identify the key cost drivers.
VERIFICATION AND VALIDATION.
32. Each OSCAM model has undergone an extensive verification and validation (V&V) process. Thisinvolves all the major stakeholders in that model, the analysts, end user community (especially relevantmilitary organisations) and the developers. To achieve this goal, we conduct three main types of test:
• Descriptive tests. These essentially involve analysing the IDs to ensure that they do accuratelyrepresent the process. Whilst this largely involves scrutiny from the end user, there are also a numberof procedural tests that can be applied. An example would be the so-called “test of closure”. Thissimply involves looking at variables on the diagrams that only have arrows coming out of them andasking if they are truly exogenous to the system;
• Mathematical and software tests. These ensure that the model and the software do actually performthe correct calculations at a component level. This includes extreme variable testing; and
• Validation tests. This largely involves running the model against historical cases to see if it accuratelymimics known behaviour.
33. Whilst no model can ever be said to be 100% valid, we are confident that each of these models has beenthrough a rigorous V&V process.
9-10
OSCAM USE AND EXPERIENCE
34. OSCAM now has a relatively long development experience. In the US, we have trained nearly 200 userspredominately from the Navy but increasingly from the Marine Corps and Airforce. In the UK, we havenow trained over 80 users mainly in the Naval and Army communities. On both side of the Atlantic, themodel has been used by contractors as well as Government analysts.
35. The model has been used to address a number of problem areas including:
• Tender assessment;• Business case submission; and• Investment appraisals for new strategies for in service equipment.
36. The model was designed to be used throughout the system life cycle and this has proved to be the casewith both new and in service programmes using it. For example, in the US the model was used by theTAKE programme to assess the bids for these ships. All for contractors were asked to submit the O&Selement of their bids using the model. They did this with only minimal training from HVR and noconsultancy support. At the other extreme, the model was used to assess the pros and cons ofimplementing RCM across the Hunt Class mine hunters. Whilst overall the conclusion was that RCM didadd value, the model clearly showed that there were penalties as well as benefits and, in this way, greatlystrengthened the ultimate recommendations of this study.
SUMMARY
37. We hope that we have shown that OSCAM represents a unique and powerful way of assessing O&S costs.As a business process model, the tool differs from typical cost models. This is not to say that it is betterthan they are, merely that it provides an alternative window onto this type of problem. However, themodel is in use on a number of projects such as AAAV and C-17 and has been through an extensive V&Vprocess.
38. OSCAM is an important tool in the armoury for groups, like SPS and WSA, charged with assessing andcomparing O&S costs.
39. The UK models are freely available within MoD for trained users and for studies in support of MoDprogrammes. Organisations outside MoD can procure the models through HVR.
Joint HVR and Crown Copyright August 2001
The views expressed are those of the author(s) and do not necessarily represent those of the UnitedKingdom Ministry of Defence

10-1
Life Cycle Cost Simulation in Defence Planning
Prof. Jaroslav KomarekMilitary AcademyKounicova str. 65
612 00 BrnoCzech Republic
SummaryRegarding force and armament planning the relatively long life cycle of military systems has to beconsidered and a total life cycle cost (LCC) in the evaluation of optimal decision reflected. Whenanalysing LCC a cost breakdown structure (CBS) has to be determined as the first step and a costestimating follows. A variety of methods are available to develop a cost estimate (e.g. parametric,analogous, accounting method, expert opinion) and the methodology chosen depends on the level ofdetail required, the availability of data, and time constraints. An example of simplified preliminarycost estimate from the Czech Armed Forces is based on the relationship of LCC elements to the cost ofacquisition alone. As a decision support tool for defence planning a simulation model ForceSim hasbeen developed. This model is based on the optional scenario portfolio of security risks. Each scenariorequires the corresponding kind and number of military systems and when we sum up the demands ofall risks regarding possible concurrency and substitution, the outcome is the required structure ofdefence force pool. But each system represents a corresponding cost demand in the case of activation(initial cost), cost for the operation and support of deployed system, as well cost for the deactivation ofa superfluous system (disposal cost). Each phase is quantified for 17 generic military systems by itslength and per year cost. In some cases the deployment phase can differ from initial one in prevailingnon-investment cost and therefore the possibility of the fourth separate phase is considered. Thecomparison of total needed cost with disposable budget through 20-year simulation period is solved bySystem Dynamics model and the outcome can serve for the decision among the different strategies ofdefence force planning regarding LCC.
IntroductionThe need to address total LCC is evident by military systems. There are at least two reasons for it: thedominant proportion of operation and support (O&S) cost compared with acquisition one, and anessential impact on LCC coming from decisions made in the early phases of concept definition andplanning. When analysing LCC there is a need for CBS comprising all relevant cost elements. No setmethod exists for breaking down cost as long as the method used should be tailored to the specificapplication. Nevertheless Benjamin Blanchard presented a famous example of detailed CBS withalmost one hundred elements over twenty years ago and there has been a continuous development onthis field up to this time. But the structure is empty without costs, and therefore the second step inLCC analysis has to be a cost estimating.
Cost estimatingA variety of methods are available to develop a cost estimate. The methodology chosen depends onthe level of detail required, the availability of data, and time constraints. To identify the best-suitedmethodology, the analyst must have an understanding of the models and techniques and theirapplicability. But it is crucial that he (she) must have a clear and complete understanding of themilitary system requirements.
Cost estimates can be assessed by various methods:• The straightforward use of current cost is the simplest tool for an approximate analysis.• Parametric cost estimating involves the development and utilisation of quantified relationships
between historical costs and the performance characteristics of system (cost per mile of range,cost per unit weight or volume, cost per unit of reliability, etc.). Its basic premise is that the
Paper presented at the RTO SAS Symposium on “Cost Structure and Life Cycle Cost (LCC) for Military Systems”, held in Paris, France, 24-25 October 2001, and published in RTO-MP-096.
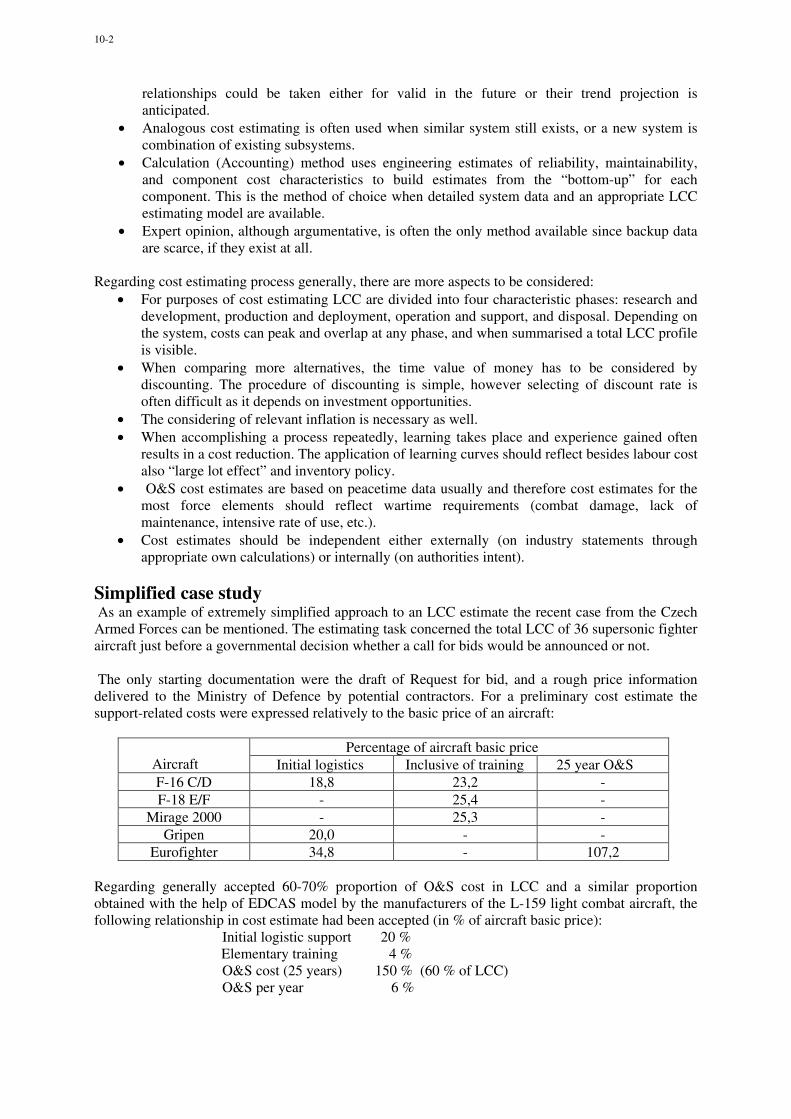
10-2
relationships could be taken either for valid in the future or their trend projection isanticipated.
• Analogous cost estimating is often used when similar system still exists, or a new system iscombination of existing subsystems.
• Calculation (Accounting) method uses engineering estimates of reliability, maintainability,and component cost characteristics to build estimates from the “bottom-up” for eachcomponent. This is the method of choice when detailed system data and an appropriate LCCestimating model are available.
• Expert opinion, although argumentative, is often the only method available since backup dataare scarce, if they exist at all.
Regarding cost estimating process generally, there are more aspects to be considered:• For purposes of cost estimating LCC are divided into four characteristic phases: research and
development, production and deployment, operation and support, and disposal. Depending onthe system, costs can peak and overlap at any phase, and when summarised a total LCC profileis visible.
• When comparing more alternatives, the time value of money has to be considered bydiscounting. The procedure of discounting is simple, however selecting of discount rate isoften difficult as it depends on investment opportunities.
• The considering of relevant inflation is necessary as well.• When accomplishing a process repeatedly, learning takes place and experience gained often
results in a cost reduction. The application of learning curves should reflect besides labour costalso “large lot effect” and inventory policy.
• O&S cost estimates are based on peacetime data usually and therefore cost estimates for themost force elements should reflect wartime requirements (combat damage, lack ofmaintenance, intensive rate of use, etc.).
• Cost estimates should be independent either externally (on industry statements throughappropriate own calculations) or internally (on authorities intent).
Simplified case study As an example of extremely simplified approach to an LCC estimate the recent case from the CzechArmed Forces can be mentioned. The estimating task concerned the total LCC of 36 supersonic fighteraircraft just before a governmental decision whether a call for bids would be announced or not.
The only starting documentation were the draft of Request for bid, and a rough price informationdelivered to the Ministry of Defence by potential contractors. For a preliminary cost estimate thesupport-related costs were expressed relatively to the basic price of an aircraft:
Percentage of aircraft basic price Aircraft Initial logistics Inclusive of training 25 year O&S
F-16 C/D 18,8 23,2 -F-18 E/F - 25,4 -
Mirage 2000 - 25,3 -Gripen 20,0 - -
Eurofighter 34,8 - 107,2
Regarding generally accepted 60-70% proportion of O&S cost in LCC and a similar proportionobtained with the help of EDCAS model by the manufacturers of the L-159 light combat aircraft, thefollowing relationship in cost estimate had been accepted (in % of aircraft basic price): Initial logistic support 20 %
Elementary training 4 % O&S cost (25 years) 150 % (60 % of LCC) O&S per year 6 %
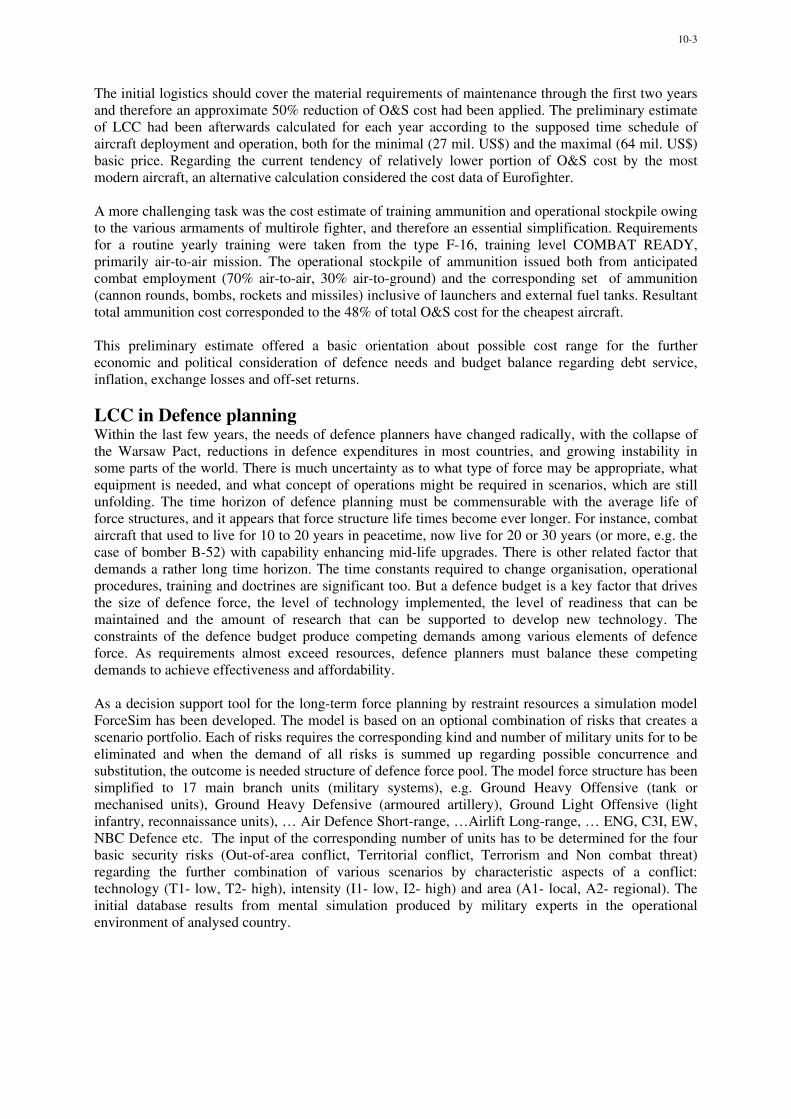
10-3
The initial logistics should cover the material requirements of maintenance through the first two yearsand therefore an approximate 50% reduction of O&S cost had been applied. The preliminary estimateof LCC had been afterwards calculated for each year according to the supposed time schedule ofaircraft deployment and operation, both for the minimal (27 mil. US$) and the maximal (64 mil. US$)basic price. Regarding the current tendency of relatively lower portion of O&S cost by the mostmodern aircraft, an alternative calculation considered the cost data of Eurofighter.
A more challenging task was the cost estimate of training ammunition and operational stockpile owingto the various armaments of multirole fighter, and therefore an essential simplification. Requirementsfor a routine yearly training were taken from the type F-16, training level COMBAT READY,primarily air-to-air mission. The operational stockpile of ammunition issued both from anticipatedcombat employment (70% air-to-air, 30% air-to-ground) and the corresponding set of ammunition(cannon rounds, bombs, rockets and missiles) inclusive of launchers and external fuel tanks. Resultanttotal ammunition cost corresponded to the 48% of total O&S cost for the cheapest aircraft.
This preliminary estimate offered a basic orientation about possible cost range for the furthereconomic and political consideration of defence needs and budget balance regarding debt service,inflation, exchange losses and off-set returns.
LCC in Defence planningWithin the last few years, the needs of defence planners have changed radically, with the collapse ofthe Warsaw Pact, reductions in defence expenditures in most countries, and growing instability insome parts of the world. There is much uncertainty as to what type of force may be appropriate, whatequipment is needed, and what concept of operations might be required in scenarios, which are stillunfolding. The time horizon of defence planning must be commensurable with the average life offorce structures, and it appears that force structure life times become ever longer. For instance, combataircraft that used to live for 10 to 20 years in peacetime, now live for 20 or 30 years (or more, e.g. thecase of bomber B-52) with capability enhancing mid-life upgrades. There is other related factor thatdemands a rather long time horizon. The time constants required to change organisation, operationalprocedures, training and doctrines are significant too. But a defence budget is a key factor that drivesthe size of defence force, the level of technology implemented, the level of readiness that can bemaintained and the amount of research that can be supported to develop new technology. Theconstraints of the defence budget produce competing demands among various elements of defenceforce. As requirements almost exceed resources, defence planners must balance these competingdemands to achieve effectiveness and affordability.
As a decision support tool for the long-term force planning by restraint resources a simulation modelForceSim has been developed. The model is based on an optional combination of risks that creates ascenario portfolio. Each of risks requires the corresponding kind and number of military units for to beeliminated and when the demand of all risks is summed up regarding possible concurrence andsubstitution, the outcome is needed structure of defence force pool. The model force structure has beensimplified to 17 main branch units (military systems), e.g. Ground Heavy Offensive (tank ormechanised units), Ground Heavy Defensive (armoured artillery), Ground Light Offensive (lightinfantry, reconnaissance units), … Air Defence Short-range, …Airlift Long-range, … ENG, C3I, EW,NBC Defence etc. The input of the corresponding number of units has to be determined for the fourbasic security risks (Out-of-area conflict, Territorial conflict, Terrorism and Non combat threat)regarding the further combination of various scenarios by characteristic aspects of a conflict:technology (T1- low, T2- high), intensity (I1- low, I2- high) and area (A1- local, A2- regional). Theinitial database results from mental simulation produced by military experts in the operationalenvironment of analysed country.
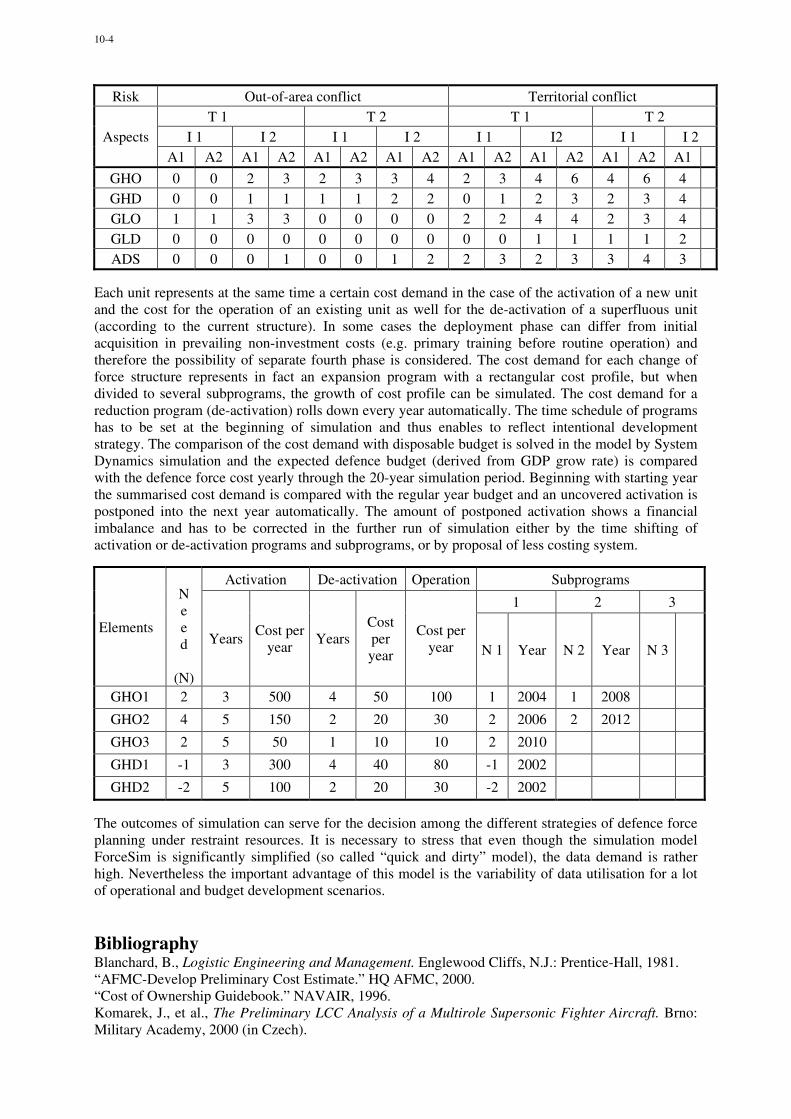
10-4
Risk Out-of-area conflict Territorial conflictT 1 T 2 T 1 T 2
I 1 I 2 I 1 I 2 I 1 I2 I 1 I 2AspectsA1 A2 A1 A2 A1 A2 A1 A2 A1 A2 A1 A2 A1 A2 A1
GHO 0 0 2 3 2 3 3 4 2 3 4 6 4 6 4GHD 0 0 1 1 1 1 2 2 0 1 2 3 2 3 4GLO 1 1 3 3 0 0 0 0 2 2 4 4 2 3 4GLD 0 0 0 0 0 0 0 0 0 0 1 1 1 1 2ADS 0 0 0 1 0 0 1 2 2 3 2 3 3 4 3
Each unit represents at the same time a certain cost demand in the case of the activation of a new unitand the cost for the operation of an existing unit as well for the de-activation of a superfluous unit(according to the current structure). In some cases the deployment phase can differ from initialacquisition in prevailing non-investment costs (e.g. primary training before routine operation) andtherefore the possibility of separate fourth phase is considered. The cost demand for each change offorce structure represents in fact an expansion program with a rectangular cost profile, but whendivided to several subprograms, the growth of cost profile can be simulated. The cost demand for areduction program (de-activation) rolls down every year automatically. The time schedule of programshas to be set at the beginning of simulation and thus enables to reflect intentional developmentstrategy. The comparison of the cost demand with disposable budget is solved in the model by SystemDynamics simulation and the expected defence budget (derived from GDP grow rate) is comparedwith the defence force cost yearly through the 20-year simulation period. Beginning with starting yearthe summarised cost demand is compared with the regular year budget and an uncovered activation ispostponed into the next year automatically. The amount of postponed activation shows a financialimbalance and has to be corrected in the further run of simulation either by the time shifting ofactivation or de-activation programs and subprograms, or by proposal of less costing system.
Activation De-activation Operation Subprograms
1 2 3
Elements
Need
(N)
YearsCost per
yearYears
Costperyear
Cost peryear N 1 Year N 2 Year N 3
GHO1 2 3 500 4 50 100 1 2004 1 2008
GHO2 4 5 150 2 20 30 2 2006 2 2012
GHO3 2 5 50 1 10 10 2 2010
GHD1 -1 3 300 4 40 80 -1 2002
GHD2 -2 5 100 2 20 30 -2 2002
The outcomes of simulation can serve for the decision among the different strategies of defence forceplanning under restraint resources. It is necessary to stress that even though the simulation modelForceSim is significantly simplified (so called “quick and dirty” model), the data demand is ratherhigh. Nevertheless the important advantage of this model is the variability of data utilisation for a lotof operational and budget development scenarios.
BibliographyBlanchard, B., Logistic Engineering and Management. Englewood Cliffs, N.J.: Prentice-Hall, 1981.“AFMC-Develop Preliminary Cost Estimate.” HQ AFMC, 2000.“Cost of Ownership Guidebook.” NAVAIR, 1996.Komarek, J., et al., The Preliminary LCC Analysis of a Multirole Supersonic Fighter Aircraft. Brno:Military Academy, 2000 (in Czech).
11-1
L’élaboration de modèles spécifiques à la DGA
Albane Capy et Christophe PereiraDGA/DPM/SDA/EC26, boulevard Victor
00457 ArméesFrance
La Délégation Générale pour l’Armement (DGA) est un organisme duMinistère de la Défense français « chargé de fournir aux armées françaises lesmatériels qui leur sont nécessaires, au meilleur coût ».
L’estimation des coûts à la DGA concourt à la maîtrise du coût des programmesd’armement comme outil d’aide à la décision pour la préparation puis la réalisation deprogrammes.
L’utilisation des premières méthodes « scientifiques » d’estimation de coût à laDGA date du début des années 80. Au milieu des années 90, les estimateurs de coûtsdisposent d’un premier modèle d’estimation spécifique de coûts élaborés par leur soindans le domaine des blindés.
Cet article traite de l’élaboration des modèles spécifiques dans l’environnementDGA c’est à dire un organisme étatique (il ne développe ni ne fabrique de produits) etmilitaire (les projets sont par essence complexes, à haute teneur technologique ets’étalent sur plusieurs années).
Les définitions des objets intervenant dans la constitution des modèles et lesétapes de la modélisation sont successivement exposées. Puis, sont abordés lesméthodes de régression et les critères statistiques à examiner. Enfin, on insistera surl’utilisation des modèles spécifiques et les principaux écueils rencontrés.
A titre d’illustration, un exemple, le modèle MOPSOS, est repris tout au long del’exposé.
1. QUELQUES DEFINITIONS
Le développement d’une Formule d’Estimation de Coûts (F.E.C.) part durecueil et de la normalisation des coûts pour aboutir à une formulation mathématiquedu coût en fonction de paramètres explicatifs (caractéristiques techniques, niveau deperformances, caractéristiques organisationnelles, …), spécifiques à chaque famille deproduit.
Le but est de mettre en évidence sur une famille spécifique de produits
les évolutions du coût, de les expliquer pour ensuite les prévoir.
Communication présentée lors du symposium RTO SAS sur les « Structures de coûts et coûts globaux de possession (LCC) pour systèmes militaires », organisé à Paris, France, du 24 au 25 octobre 2001, et éditée dans RTO-MP-096.

11-2
Un modèle d’estimation paramétrique de coûts de matériels lie par une ouplusieurs relation(s) mathématique(s) le coût à un ou plusieurs descripteurstechniques, économiques et/ou organisationnels. Sa finalité est de prévoir le coût àpartir d’un nombre réduit de paramètres, généralement en amont d’un projetlorsque peu d'informations sont disponibles.
Un modèle d’estimation paramétrique de coûts est dit spécifique lorsqu’il estétabli sur et pour une famille donnée de matériels (à titre d’exemple : les véhiculesblindés français, les moteurs d’avion, ...). L’établissement de modèles spécifiquess’appuie sur le recueil et l’analyse d’informations techniques et économiques sur cettefamille et consiste à établir des équations :
� COUT = F(caractéristiques et/ou performances)
A titre d’exemple, le modèle MOPSOS de prévision de coûts de production deblindés français permet de quantifier le coût de production d’un véhicule blindé àpartir de sa définition. L'objectif initial de ces travaux était d'être capable de faire uneestimation de coûts raisonnable avec peu d'informations très en amont dans la vie d'unblindé. Les équations de coût de blindés obtenues répondent aux exigences de laprospective : elles font intervenir des caractéristiques objectives, facilementquantifiables et connues très tôt dans le déroulement d'un programme.
Le modèle MOPSOS est un outil de gestion d'hypothèses de définition et/ou deconception.
2. LES ETAPES DE LA MODELISATION
La qualité d’un modèle spécifique de coûts est liée au nombre deprogrammes de référence qui auront servi à sa constitution et au respect desdifférentes étapes nécessaires à sa construction (pertinence des données, analysestatistique des données, recherche de la formulation mathématique la plus adaptée, testde qualité,...).
L’élaboration d'équations spécifiques s’articule autour de cinq étapessuccessives :
1. le choix de la famille de référence pour établir le modèle,
2. le recueil d’informations techniques et économiques sur la famille,
3. l’analyse et la normalisation des coûts,
4. la mise en œuvre de traitements statistiques,
5. la sélection des « meilleures » équations spécifiques.
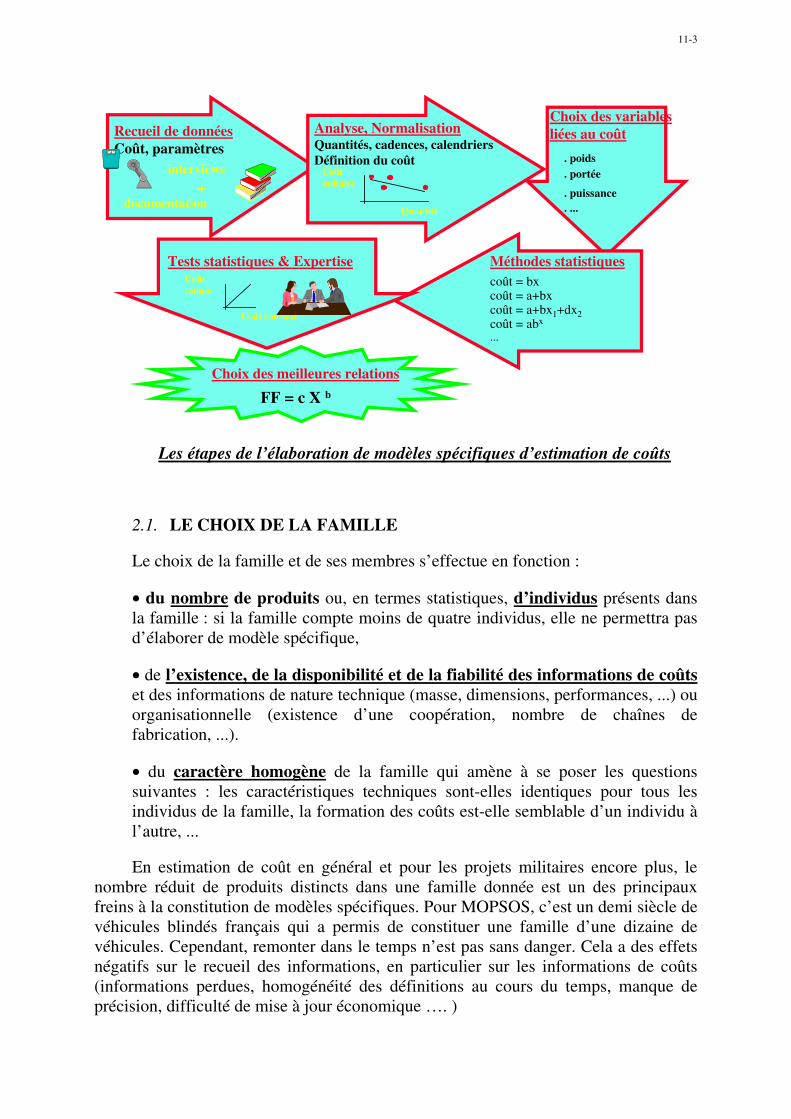
11-3
Recueil de donnéesCoût, paramètres
interviews
+documentation
Analyse, NormalisationQuantités, cadences, calendriersDéfinition du coût
Choix des variablesliées au coût
. poids . portée
. puissance . ...
Tests statistiques & Expertise
Coût constaté
Coûtestimé
Méthodes statistiquescoût = bxcoût = a+bxcoût = a+bx1+dx2coût = abx
...
Choix des meilleures relations
FF = c X b
Quantité
Coûtunitaire
Les étapes de l’élaboration de modèles spécifiques d’estimation de coûts
2.1. LE CHOIX DE LA FAMILLE
Le choix de la famille et de ses membres s’effectue en fonction :
• du nombre de produits ou, en termes statistiques, d’individus présents dansla famille : si la famille compte moins de quatre individus, elle ne permettra pasd’élaborer de modèle spécifique,
• de l’existence, de la disponibilité et de la fiabilité des informations de coûtset des informations de nature technique (masse, dimensions, performances, ...) ouorganisationnelle (existence d’une coopération, nombre de chaînes defabrication, ...).
• du caractère homogène de la famille qui amène à se poser les questionssuivantes : les caractéristiques techniques sont-elles identiques pour tous lesindividus de la famille, la formation des coûts est-elle semblable d’un individu àl’autre, ...
En estimation de coût en général et pour les projets militaires encore plus, lenombre réduit de produits distincts dans une famille donnée est un des principauxfreins à la constitution de modèles spécifiques. Pour MOPSOS, c’est un demi siècle devéhicules blindés français qui a permis de constituer une famille d’une dizaine devéhicules. Cependant, remonter dans le temps n’est pas sans danger. Cela a des effetsnégatifs sur le recueil des informations, en particulier sur les informations de coûts(informations perdues, homogénéité des définitions au cours du temps, manque deprécision, difficulté de mise à jour économique …. )

11-4
Un arbitrage est à faire entre une famille réduite (quelques individus) maishomogène et une large famille composite.
On pourra penser par exemple mélanger des individus de nationalités différentes(des missiles français et américains), de milieux différents (des avions civils etmilitaires), de type différent (des sous-marins et des navires de surface).
Il est possible de partir d’une grande famille et de raisonner par sous-famille parla suite, mais réduire le nombre d’individus a pour effet de diminuer le nombre devariables de l’équation. En effet, il est conseillé d’avoir au moins quatre individuspour un modèle à une variable ; ainsi pour dix individus, les équations de prévisionspourront compter deux à trois variables.
Une approche en sous-familles permet de raisonner à un niveau plus homogène,d'introduire dans les modèles des caractéristiques et/ou performances plus spécifiquesà un type de matériel donné.
2.2. LE RECUEIL D’INFORMATIONS TECHNIQUES ETECONOMIQUES
Il s’agit de bâtir un historique technique et économique de la famille deproduits : c'est-à-dire répertorier les caractéristiques techniques et/ou lesperformances caractérisant la famille et relever les informations économiquesconstatées sur les matériels de la famille. Ce recueil nécessite de rencontrer lesspécialistes techniques du domaine, les acheteurs négociateurs et les enquêteurs decoûts des principales sociétés impliquées dans la fabrication de la famille.
Les données à recueillir sont de trois types :
− les descripteurs techniques, candidats potentiels à intégrer les équations decoût,
− la variable économique : le coût, variable à modéliser puis à prévoir,
− les caractéristiques de programme (quantités, délais, …) associées au coût.
La phase de recueil est une étape-clef, consommatrice de temps, trèsitérative.
2.3. L’ANALYSE ET LA NORMALISATION DES COUTS
Les données de coûts recueillies à l’étape précédente sont des données brutes.
Chaque coût observé sur un produit existant est attaché à des conditionsd’établissement différentes et peut provenir de sources d’informations différentes. Cescoûts bruts sont à normaliser, c’est à dire qu’il faut les ramener à un ensemble uniquede conditions.
11-5
Ainsi, il est impératif d’avoir :
• une définition précise et homogène du coût ou du prix, le coût de production(hors marges et frais hors production) est à privilégier,
• la même unité monétaire et les mêmes conditions économiques (choix detables ou de formules de mise à jour des coûts),
• une quantité unique (choix de dégressivité),
• voire une cadence de fabrication unique.
Raisonner à quantité donnée (par exemple, le coût des 100 premiers véhiculesblindés) a pour avantage de ne pas utiliser la variable quantité dans l'équation derégression. Ainsi, d'autres variables explicatives peuvent figurer dans l’équation quandla famille des matériels est de taille réduite.
Un travail d’analyse et de validation est également à fournir sur les donnéestechniques recueillies mais il est souvent de moindre ampleur que sur les données decoûts. Il s’agit de consolider les données techniques en provenance de sourcesdifférentes (s’assurer que l’information n’est pas susceptible d’évoluer) ou rechercherles informations manquantes (sur les matériels les plus anciens). Des variablestechniques combinées peuvent être formées sous forme de ratios par exemples.
A l’issue de cette troisième étape, on dispose de la variable à prévoir : le coûtnormalisé et d’un ensemble de variables prédictives potentielles.
2.4. - LA MISE EN ŒUVRE DE TRAITEMENTS STATISTIQUES
Une fois les étapes précédentes effectuées, la phase de modélisation statistiqueva permettre de mettre en évidence les facteurs qui ont une influence mesurable surles coûts. La méthodologie adoptée consiste à relier statistiquement le coût avec unnombre réduit de descripteurs se rapportant aux aspects techniques et auxperformances de la famille, à l'organisation industrielle et aux caractéristiques desprogrammes.
Les traitements statistiques consistent à mettre en œuvre :
1. les techniques d'Analyse de Données : recherche de liens (entre lescaractéristiques et les matériels, entre les caractéristiques elles-mêmes, entre lesmatériels eux-mêmes), identification des facteurs discriminants, visualisationsynthétique des données, détection de points atypiques. Cette étape est facultative,mais se révèle intéressante lorsque les données sont nombreuses.
2. les techniques économétriques : mise en évidence des liens techniques etlogiques existants entre les variables et le coût pour obtenir un outil deprévision, le principe général de la régression étant la minimisation des écartsentre valeurs prédites et valeurs observées.
11-6
A titre d’exemple, l’utilisation de l'Analyse Factorielle des Correspondances surles blindés a guidé la constitution de deux sous-familles, d’une part la sous-famille deschars (blindés lourds), d’autre part celle des blindés de reconnaissance et de transportde troupes (plus légers).
La recherche de modèles prédictifs peut s’effectuer par balayage de toutes lescombinaisons possibles de variables et par test de plusieurs types de formulationsmathématiques.
Le travail itératif de sélection de modèles, coûteux en temps, et l'applicationdes techniques statistiques constituent les difficultés inhérentes à cette étape maisrenforce la qualité statistique et prédictive des modèles obtenus.
2.5. - LA SELECTION DES EQUATIONS SPECIFIQUES
La sélection d'un ensemble convenable de relations coûts/caractéristiquess’appuie sur la validation statistique et l’expertise des modèles.
Plus précisément, cette étape de sélection consiste à :
- mettre en œuvre de tests (qualité statistique, robustesse),
- examiner des écarts individuels entre coûts estimés et coûts observés,
- accepter ou non des modèles selon la pertinence des variables qu'ils fontintervenir,
- examiner la capacité prédictive des modèles sur les produits les plus récents.
Le recours systématique à la validation technique et/ou opérationnelle desmodèles mis en évidence est indispensable.
De façon générale, le recours à l’expertise des techniciens ou des utilisateurs dumatériel pour délimiter les sous-familles, sélectionner les meilleures équations esttoujours nécessaire.
3. LA REGRESSION MULTIPLE
3.1. RAPPEL SUR LES PRINCIPES DE BASE
La méthode de régression multiple est utilisée pour déterminer des relationsentre le coût et les variables prédictives.
La recherche de modèles explicatifs conduit à tester plusieurs types d'équation decomportement. Quatre formes-types - ou des combinaisons entre ces formes-types -peuvent être envisagées : linéaire, exponentielle, multiplicative et logarithmique.

11-7
La forme multiplicative donne généralement les meilleurs résultats en matièred’estimation de coûts. Les quatre formes de modèles peuvent se ramener à uneéquation de régression linéaire par un changement de variables.
Dans le plan (p = 2), la méthode de régression linéaire ajuste au nuage de pointsune droite qui minimise la somme des écarts au carré entre valeurs observées etvaleurs prédites (algorithme des Moindres Carrés Ordinaires : MCO).
y y*
yi
y
x xi x
3.2. LES VARIABLES PREDICTIVES POTENTIELLES
Pour intégrer une équation de coût, une variable doit nécessairement :
• être reliée de façon logique au coût : pour s'en assurer, il suffit de regarder lescoefficients de corrélation entre variable à prévoir (le coût) et variable prédictive,
• être disponible suffisamment tôt dans la vie d’un produit,
• être connue avec un certain degré de précision.
Les avis divergent sur le nombre de variables à introduire dans une équation parrapport au nombre d’individus. Il faut au moins un individu de plus que de variable :pour une famille de 10 produits, le nombre maximum de variables est 9 (dans le cascontraire, les méthodes de régression ne sont pas applicables). Cependant, pour mettreen œuvre des tests statistiques valides, un minimum de 4 individus est requis pourétablir une formule de régression à une variable (au plus 2 variables pour unefamille de 10 matériels)
Elargir le nombre des variables dans une équation a pour conséquence de réduirela capacité prédictive ; cependant des modèles avec une variable supplémentaire (troisvariables au total pour une famille de 10 individus) peuvent être conservés dans lamesure où ils apportent une information supplémentaire.
En effet, ajouter une variable revient à injecter dans l'équation un a priori qui meten cause la validité statistique des problèmes de colinéarité des variables présentesdans le modèle surviennent, le modèle devient trop descriptif et perd ses qualitésd'extrapolation.

11-8
4. LES CRITERES D’EVALUATION D’UN MODELE
Les relations de coûts sont évaluées sur la base de leur qualité statistique, de leurconformité à un comportement rationnel vis à vis du coût et de leur capacité deprédiction.
4.1. – LES CRITERES STATISTIQUES
Au regard des propriétés statistiques, les équations à conserver doivent satisfaireles critères suivants :
- le coût et les variables explicatives (ou leurs transformées) sont liés par unerelation linéaire,
Le degré de variation expliqué par l'équation de régression (mesuré par lecoefficient de détermination) est important.
- les variables prises collectivement ont une influence significative sur lecoût (test de Fisher) avec un niveau de probabilité donnée (90 % ou 95 % ou ...),
- l'erreur standard d'estimation (SEE) est minimisée, cette erreur peutêtre transcrite en pourcentage de variation sur le coût (20 %, 15 %, …)
- chaque variable est significative (test de Student) avec un niveau deprobabilité à définir (90 % ou 95 % ou 99%, ...),
Ne sont retenues dans l’équation que les variables pour lesquelles le coefficientest nettement différent de 0 (la mesure de la différence dépend de la probabilitéchoisie, souvent 95 %).
- les variables ne sont pas corrélées entre elles,
Des variables dont les corrélations linéaires sont supérieures à un seuil donné (0,7à 0,8 en général) ne peuvent être ensemble dans une équation.
- l'analyse des résidus est satisfaisante (respect des propriétés de varianceconstante et de non-corrélation).
L'étude des résidus permet de repérer les observations aberrantes (distance deCook), les observations qui jouent un rôle important dans la détermination de larégression.
4.2. - LA RATIONALITE
Développer des équations de coûts nécessite que les coefficients des variablesfournissent des résultats crédibles et conformes autant que possible à la procédurenormale d'estimation de coût.
Les signes et l’ampleur des coefficients dans les équations doivent être

11-9
cohérents avec la notion intuitive de l’évolution de la variable. A titre d’exemple pourles blindés, la variable masse doit apparaître avec un signe positif dans l’équation(quand la masse augmente, le coût augmente).
Pour vérifier la stabilité des coefficients, il est judicieux de comparer lecoefficient et son écart-type qui ne doivent pas être dans le même ordre de grandeur.La source principale d'instabilité des coefficients est le cas où les variablesexplicatives sont très corrélées entre elles.
Il est impératif de faire approuver les équations par des spécialistestechniques et les acheteurs du domaine en validant avec eux que les variablesretenues dans l’équation ont bien une influence sur les coûts et qu’il accepte le signe etl’ordre de grandeur du coefficient. A titre d’exemple, sur le modèle MOPSOScertaines équations ont été rejetées par les experts alors que leurs propriétésstatistiques étaient correctes.
4.3. LES PROPRIETES PREDICTIVES
Une façon de tester la qualité prédictive est de retirer de l'échantillon le ou lessystèmes les plus récents ou extrêmes en caractéristiques et/ou en coût afin de voircomment (en terme de déviation) l'équation résultante estime le système exclu.
5. L’UTILISATION D’UN MODELE SPECIFIQUE
Il est impératif d’établir des règles de bonne utilisation des modèles spécifiques.
Au préalable, il faut s’assurer de l’appartenance à la famille du produit àévaluer. Cette première règle en apparence simple peut être difficile à suivre.
Quand, par exemple il y a un changement de technologie majeure, il est évidentpour tous que le résultat du modèle est à examiner avec précaution. Par contre quandle produit à évaluer est de même nature mais nettement plus petit que les produitsayant servis à l’élaboration du modèle, le doute sur la validité du résultat n’est pastoujours acquis. Ainsi, il est judicieux de déterminer pour tous les paramètres desplages de variation admissibles. Ainsi, si un ou plusieurs paramètres sortent de laplage, l’utilisateur sera alerté.
Pour le modèle MOPSOS, des plages de variation ont été définies pour tous lesparamètres.
Il faut disposer d’une définition claire et précise de tous les paramètresintervenants dans l’équation aussi bien la variable de sortie, le coût que les variablesd’entrée et s’assurer que les données d’entrées sont conformes à leur définition (unitéde mesure, …).

11-10
A titre d’exemple, la masse d’un blindé peut varier d’une à plusieurs tonnesentre masse à vide et masse en ordre de combat. Ou encore, parler de massed’électronique peut avoir plusieurs interprétations : entre les cartes et composantsseulement et le boîtier électronique complet (avec sa structure) on passe du simple autriple.
Ces premières règles s’accompagnent d’une règle plus délicate à observer : ils’agit de valider la cohérence des paramètres d’entrée entre eux, en somme, des’assurer que le produit est « viable ». Pour cela, le modèle d’estimation peutcomporter des règles dites d’architecture permettant de valider la cohérence de ladéfinition du produit. Par exemple, pour un blindé, il faut valider l’ « harmonie » dutrio masse, puissance du moteur et vitesse maximale.
Il est nécessaire de s’assurer également de l’actualité du modèle. Utiliser surdes produits d’aujourd’hui un modèle des années 80 n’est pas pertinent. Cela nepermet pas de prendre en compte les évolutions techniques, technologiques ouorganisationnelles intervenues depuis 20 ans. Il est nécessaire d’intégrer les évolutionsde façon progressive. La mise à jour du modèle est impérative pour conserver laconfiance.
Ainsi pour le modèle MOPSOS, à la signature du marché d’un nouveau véhiculeblindé, la procédure de mise à jour du modèle peut démarrer. Elle consiste enplusieurs étapes :
1. recueil des paramètres sur le nouveau blindé (mise à jour de la base dedonnées MOPSOS) et utilisation du modèle MOPSOS pour prévoir son coût,
2. analyser les écarts entre le coût estimé et celui du marché (à définitionéquivalente),
3. intégrer le nouveau véhicule dans la famille des blindés pour recalculer avecce nouveau blindé les formules d’estimation de coûts, effectuer une nouvellerecherche d’équations pertinentes,
4. sélectionner un nouvel ensemble d’équations en examinant les testsstatistiques des nouvelles formules et en demandant le concours des expertstechniques du domaine,
5. mettre à jour la maquette informatique avec les nouvelles équations.
6. CONCLUSION
L’ensemble de données recueillies est à analyser avec une exigence commune :travailler avec le moins d'a priori possible et de la façon la plus exhaustive tout enrestant cohérent (définition unique des coûts, définition stricte et précise desvariables).

11-11
Les difficultés rencontrées peuvent principalement concerner :
• le travail de familiarisation avec la famille de matériels,
• l'élaboration d'une base de données exhaustive et cohérente,
• la normalisation des coûts,
• l'expertise sur les variables potentiellement déterminantes.
L'utilisateur des modèles spécifiques veillera à :
� adopter la même définition des variables que celle utilisée dans les modèles,
� rester assez proche des valeurs rencontrées dans l'échantillon de base,
� assurer la cohérence des valeurs qu'il donne aux différents paramètres.
Lorsqu’un nouveau membre de la famille apparaît, les équations de prévisionssont à mettre à jour (test des anciennes équations, calcul de nouveaux coefficients).
Les modèles d’estimation de coût spécifique à la DGA ont été jusqu’àaujourd’hui centrés sur les coût d’acquisition de programmes militaires.
Il est prévu d’étendre les capacités du modèle MOPSOS au coût de possessiondes blindés en collaboration avec les organismes chargés du maintien en conditionopérationnelle. De façon plus générale, la DGA devrait s’orienter vers l ‘élaboration etl’acquisition de modèle d’estimation de coûts du cycle de vie.

Page intentionnellement blanche
This page has been deliberately left blank

12-1
A Software Support Cost Model for Military Systems
Julian Gibbs, BSc, DMS, MIMgtPrincipal Consultant, Whole Life Economics
BMT Reliability Consultants Ltd12 Little Park Farm Road
Fareham, HampshirePO15 5SU
United Kingdom
Seriously Expensive ?
Research has shown that, for every £1 spent on developing and acquiring
computing software, at least £2 and, particularly for bespoke operational
software, sometimes in excess of £20 is spent maintaining it.
1. INTRODUCTION
This paper presents a description of the background, history and successful completion of a
programme of work to develop and implement a model to predict the cost of supporting
military software. This programme, which was carried out for the UK Ministry of Defence,
has resulted in a model which is now available to project teams and which brought a number
of surprises to us as we brought the development work to a conclusion. These surprises
have caused us to consider the nature of software support cost and what aspects need to be
addressed as it is used, and in the future.
Although we have only looked at UK projects for military software, we do not believe that
there are significant differences between the UK and other NATO or PfP countries and their
projects which would invalidate the model. In fact, we would be very pleased to hear from
any others with experience in this area.
We believe that we have established a world first in the completion of this model in terms of
its foundation, the size of the database, the number of cost drivers, and the final relationship.
The work was carried out under contract to the UK Ministry of Defence Specialist
Procurement Services/Cost Forecasting (SPS/CF) in the Defence Procurement Agency at
Paper presented at the RTO SAS Symposium on “Cost Structure and Life Cycle Cost (LCC) for Military Systems”, held in Paris, France, 24-25 October 2001, and published in RTO-MP-096.

12-2
Abbey Wood, Bristol. The views expressed in this presentation are those of the author and
do not necessarily represent Ministry of Defence policy.
2. PROBLEM AREA
The UK, in common with other nations, spends a significant proportion of its defence
budget on supporting equipment - both hardware and software. Hardware support is usually
a visible commodity with the repair or replacement of items of equipment and a consequent
logistic loop for which spares are bought and consumed. Such consumption can usually be
related to the equipment population and usage: the greater the population or usage, the
greater the demand for support and the consumption of spares. This situation is recognised
and accepted - or perhaps tolerated - as inevitable. Initiatives such as Integrated Logistic
Support which encourage Designing for Support are aimed at reducing the consequential
support costs and thus the Life Cycle Costs and there is evidence of a much greater
awareness of support issues at the design stage than there used to be.
However, the support activities for software are less clear. There is no requirement for
repair or replacement of hardware, only modifications or updates to software. The demand
for such changes comes about not only for correcting errors found in the software itself, but
also for keeping up with new operational demands, software system upgrades (e.g., new
versions of operating systems), and hardware changes, few of which are related to
population or usage.
In the UK, the current estimate for the cost of support is £4854M1 ($7040M), 21% of the
total planned expenditure. This in itself is a reduction of 2.4% in real terms on the budget
for the previous year and reflects a continuing pressure to reduce the annual defence budget.
It is not clear is how much of the budget is spent on software but there is a growing belief
that the proportion spent on software is increasing year on year, and that there are few
methods for measuring or controlling it.
There are models which claim to be able to predict the cost of procuring and supporting
software. However, there is some doubt about their capability and value since they all tend
to produce different answers and they all operate in different ways. There is a common
practice of taking the average of all of the results as the best estimate, but this is more for
convenience than for correctness, and is not a guarantee of success.
1 Vote 1F, Government Expenditure Plans 2000/2001 to 2001/2002, Cm 4608
12-3
As a result of the uncertainty surrounding software cost estimates, and the pressure to reduce
the Defence budget being applied particularly to support, two particular targets were set for
the development of a Software Support Cost Model:
• to understand what is meant by software support
• to quantify the costs, and the cost drivers, and thereby gain control.
This was the background to the development and implementation of the Software Support
Cost Model - the SSCM.
3. SOLUTION APPROACH
The MoD’s requirements for SSCM were for a model with a degree of substantiation behind
it - i.e., a model with traceability. Other requirements were that it should be based on
defence equipment, it should address operational software (rather than office software), and
should be available to project managers at their desks.
The approach to solving the problem followed four steps:
• Propose an Outline Model
• Collect data from existing projects
• Test the Model, Refine, Test, Refine and Test again
• Finalise and Issue.
3.1 Propose an Outline Model
Using a Delphi-type approach, we undertook literature and internet searches to identify
potential software support cost drivers. We spoke to software experts in the UK and to
project managers again with the aim of compiling a list of drivers. We also used the
opportunity to identify any models of software support of which we were unaware.
The resulting set of cost drivers was reviewed and an ordered list was compiled starting with
the most frequently named items. This formed the basis of the Outline Model.
3.2 Data
Data was collected from projects using a questionnaire. An initial questionnaire was sent to
all MoD projects which potentially had operational software under support. This asked for
confirmation of such software and that data on the software, its costs and other details could

12-4
be provided. Questionnaires were sent to 134 projects and 91 of these responded, most of
them offering data. A number of these were selected to receive a second, more detailed
questionnaire. Selection of projects was aimed at achieving as wide a coverage of projects
as possible. The more detailed questionnaire contained 52 questions relating to parameters
and information such as:
• Size • Cost • Language
• Application • Age • Type of Support
• Development • Technical requirements • Project Team
• Planned Life • Contract arrangements • Documentation
• Number of Users • Number of Installations • Criticality
Data was initially collected from 15 projects (21 had been requested). Only a proportion of
the target population of 91 was used initially, partly to test the questionnaire and partly to
limit the scale of work.
It became clear during this and subsequent data collections that there was no consistent
manner in which such data is recorded, nor any guidance to projects on its collection. To
aid our own work in future, and to encourage projects to maintain visibility of their software
support costs, we will be providing a template and assistance for recording and tracking this
information.
The data collected from 14 of the 15 projects was analysed using multiple regression to
identify potential models. Some relationships were found which, although not of
particularly high quality, indicated that there was potential to achieve a satisfactory
outcome, given a wider population. We viewed this as a positive result and set out to
progress the programme by collecting data from more projects and developing the model.
3.3 Further Data Collection and Model Refinement
The above process was repeated a further two times, increasing the population first by 27
projects and then by a further 7 to a total of 48, and refining the modelling approach by
considering logarithmic and 2nd order parameters. At the end of the third cycle, we decided
that we had established a sufficient model from the data available to stop at that stage and
progress to final model issue. We used statistical confidence testing on the model at each
stage to determine if the parameters we were using were actually contributing to the
12-5
relationship or not. This resulted in the exclusion of some parameters which surprised us
but for which the statistical evidence was definite.
These cycles lasted several months. We had difficulty in getting projects to return their
questionnaires, and much time was spent in analysing and re-analysing the data, using
different sets of parameters. In all we believe we evaluated over 500 different relationships.
At each stage of the project we submitted our methods and results to independent scrutiny.
This was to ensure that our results were justifiable, and that there were no errors or
omissions in the processes we were using. It would also enable us at the end of the work to
meet the MoD requirement that the results should be traceable.
3.4 Finalise and Issue
At the conclusion of the modelling work we had a mathematical relationship for software
support costs from a database of 48 projects using only 5 input parameters and with an
excellent coefficient of correlation. This was turned into a web-enabled model using pull-
down menus to select parameters and an output sheet to provide the results. This has been
presented and issued to projects for their own use as and when required.
4. RESULTS - THE MODEL
As stated above, we achieved a model based on 48 projects. All the data used came from
the projects themselves: there was no estimation of any of the parameters. The model uses
only 5 input parameters, as follows:
• War Fighting
• “Stability”
• Age
• Contract Type
• Application Type
and with a correlation
of better than 0.9
War Fighting is defined as whether the software is essential to the mission.
Stability reflects the likely rate of demand for support based on the variety of (new)
operational environments: some systems see very little demand, others see a lot.
Age is the number of years from the first installation and is the only parameter with a second
order coefficient. The two age parameters results in a support cost which peaks at 8 years.
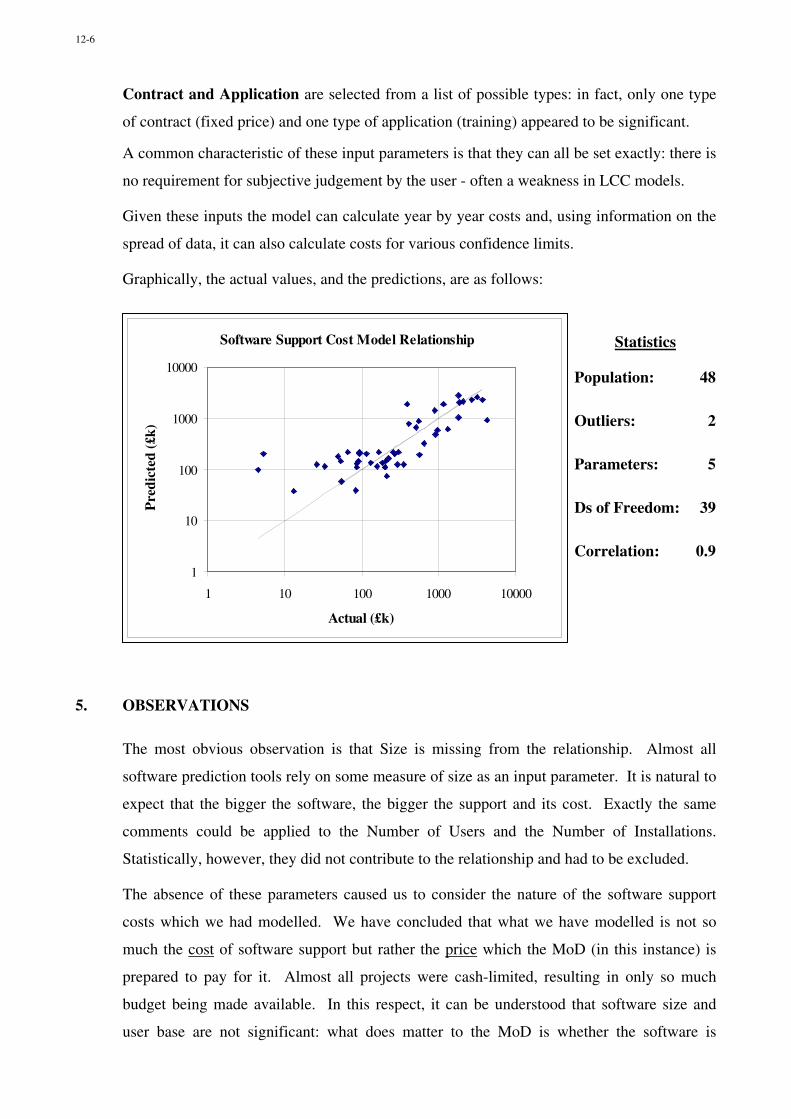
12-6
Software Support Cost Model Relationship
1
10
100
1000
10000
1 10 100 1000 10000
Actual (£k)
Pre
dict
ed (
£k)
Contract and Application are selected from a list of possible types: in fact, only one type
of contract (fixed price) and one type of application (training) appeared to be significant.
A common characteristic of these input parameters is that they can all be set exactly: there is
no requirement for subjective judgement by the user - often a weakness in LCC models.
Given these inputs the model can calculate year by year costs and, using information on the
spread of data, it can also calculate costs for various confidence limits.
Graphically, the actual values, and the predictions, are as follows:
Statistics
Population: 48
Outliers: 2
Parameters: 5
Ds of Freedom: 39
Correlation: 0.9
5. OBSERVATIONS
The most obvious observation is that Size is missing from the relationship. Almost all
software prediction tools rely on some measure of size as an input parameter. It is natural to
expect that the bigger the software, the bigger the support and its cost. Exactly the same
comments could be applied to the Number of Users and the Number of Installations.
Statistically, however, they did not contribute to the relationship and had to be excluded.
The absence of these parameters caused us to consider the nature of the software support
costs which we had modelled. We have concluded that what we have modelled is not so
much the cost of software support but rather the price which the MoD (in this instance) is
prepared to pay for it. Almost all projects were cash-limited, resulting in only so much
budget being made available. In this respect, it can be understood that software size and
user base are not significant: what does matter to the MoD is whether the software is
12-7
essential to the front line activity and in what operational environment it might have to
work.
The SSCM therefore shows project managers what budget is likely to be acceptable. In
terms of usefulness of this output rather than what was believed to be the original aim, this
result is considered to be of more benefit.
What we have not yet been able to ascertain is how much support was demanded and not
met, consequently how much of the software’s operational capability might have been
compromised. This is another aspect for the future.
Having established a database of defence software projects, the long term aim is to continue
to monitor software support costs, and to improve the detail of the data collected. In
particular, we want to expand the range of projects to include Commercial Off The Shelf
(COTS) and Safety Critical software as these are aspects which currently fall outside.
6. CONCLUSIONS
We set out to create a model for project managers to use to help them forecast the costs of
software support, and in this we have been successful. In achieving this success, we have
found some surprising results which have caused us to consider the nature of the software
support task itself.
The most surprising result has been that the size of the software, and the size of the user
base are not significant in determining the cost of software support. What are significant are
the military essentiality, the operational environment, the age and the contractual conditions.
The resulting model is deceptively simple in terms of the number of parameters, and
statistically remarkably accurate in terms of a 90% correlation with real data, particularly
given the number of parameters. We believe that this is a World First in terms of a model
based on real data with this quality of fit.
Further advantages of the model’s parameters are that they can all be determined in advance
of the software being created, and that there is little room for uncertainty and thus confusion.
We established links with over 50 MoD software projects. We want this to continue and
develop so that we can improve the model and expand the coverage into new areas.
In a wider context, we would like to test the model in NATO and PfP nations against their
projects, and where possible perhaps to share data. We would welcome any contact from
defence staff or manufacturers to help us here.

12-8
For the future, we intend to make the model available to a wider population via the Internet.
We want to extend its application into other areas outside defence where software is used
under similar operational demands.
The success of the project has been in no small part due to the support and encouragement
which we have received from our MoD sponsors in Specialist Procurement Services. We
look forward to further development and application of the model both inside and outside
defence. In terms of building an understanding of the Life Cycle Cost of Software Support,
we have now seen and modelled more than just the tip of the iceberg.
Paper prepared and presented by:
Julian Gibbs, BSc, DMS, MIMgtPrincipal Consultant, Whole Life EconomicsBMT Reliability Consultants Ltd12 Little Park Farm RoadFareham, HampshireUK, PO15 5SU
tel: +44 (0) 1489 55 31 00fax: +44 (0) 1489 55 31 01email: [email protected]: www.bmtrcl.com
MoD Contact:
Dr Dave Thombs, SPS/CF/Software, Abbey WoodBristol, UK, BS34 8JH
tel: +44 (0) 1179 13 27 54fax: +44 (0) 1179 13 29 22email: [email protected]
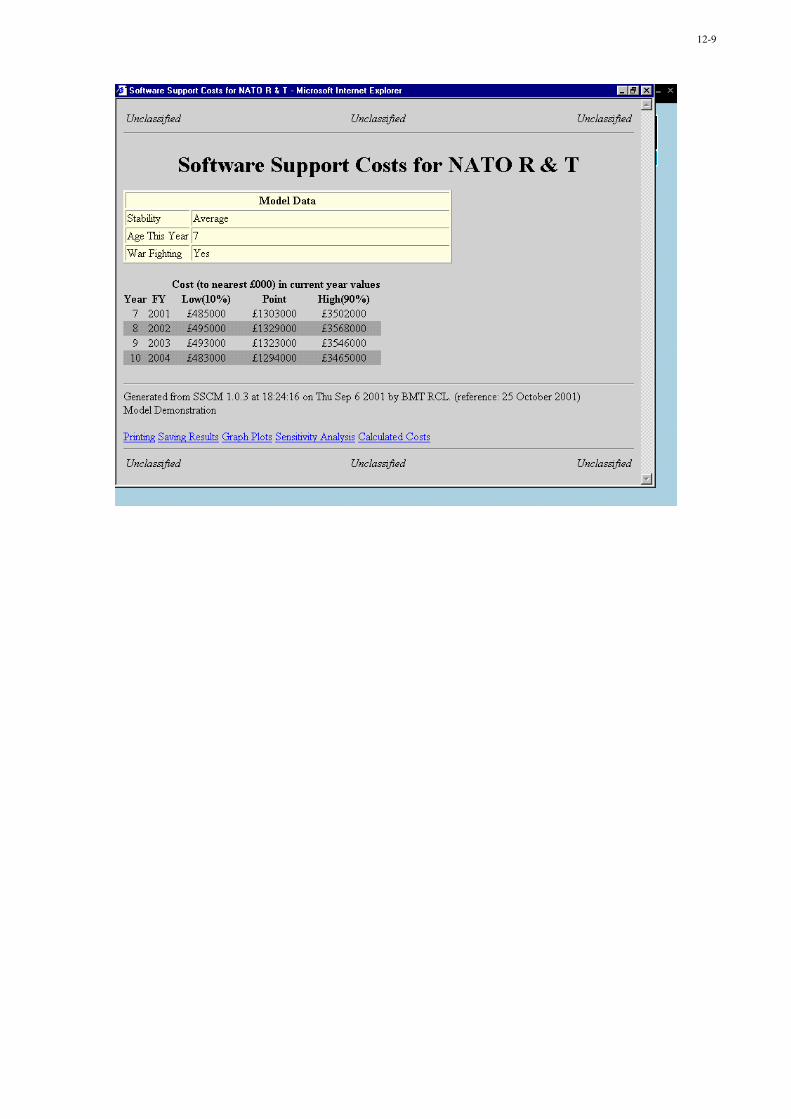
12-9

This page has been deliberately left blank
Page intentionnellement blanche
13-1
Life Cycle Cost Procurement Techniques
Maj. Altan ÖZKİL (MS in OR)Turkish General Staff Headquarters Scientific Decision Support Center06100 Bakanlıklar, Ankara, Turkey
Introduction
The primary purpose of this presentation is to describe the nature of a spectrum
of currently identified types of life cycle cost procurement techniques. These techniques
have the common characteristic that all are designed to motivate contractors to design,
manufacture and deliver equipment with lower life cycle costs.
You may believe that savings may be in the acquisition cost component of life
cycle costs. However, primary emphasis is generally on reducing and controlling
operating and support costs by transferring more responsibility to the contractor for
equipment operating and support cost performance.
Spectrum of LCC Procurement Techniques
It has been found that life cycle cost procurement provisions must be
individually tailored to each program to properly transfer the appropriate amount of
responsibility for Operating and Support costs to the contractor. This has resulted in
the development of a spectrum of LCC procurement techniques
The currently identified LCC procurement techniques including a variety of
LCC incentive provisions are;
• Source Selection Criteria,
• Pre-award Testing,
• Design To Cost / LCC Design Trade Study Requirements,
• Reliability and Maintainability Acceptance Criteria
Paper presented at the RTO SAS Symposium on “Cost Structure and Life Cycle Cost (LCC) for Military Systems”, held in Paris, France, 24-25 October 2001, and published in RTO-MP-096.
13-2
• LCC Incentive Provisions,
� Award Fee,
� Reliability Improvement Warranty (RIW),
� RIW with MTBF Guarantee,
� Reliability Demonstration Incentive,
� Fixed Price Repair with Incentive,
� Design to Cost Incentive,
� Value Engineering Incentive,
All of the LCC incentive provisions listed above involve contractual language
where a contractor can expect his profits to be affected by how well he succeeds in
designing and delivering a product with low life cycle cost characteristics. Source
Selection Criteria and Pre award Testing techniques deal with actions that can be taken
to select contractors whose products should have lower life cycle costs, but do not
involve incentives tied to 0&S cost performance. The third and fourth LCC procurement
techniques deal with specific O&S cost objectives which must be met, and there is no
incentive to improve the contract or product performance beyond that specified in these
techniques.
Factors For The Selection of Appropriate LCC Procurement Techniques
There are many factors for the selection of LCC procurement technique or
combinations of techniques would be most appropriate for any particular program.
They include many program and design factors that can affect the future operating and
support costs and how well these costs can be predicted at contract award.
Factors which can cause uncertainty about, what future operating and support
costs will be, are important for the selection of appropriate LCC Procurement
Techniques. These are;
• High performance requirements relative to current equipment,
• A tight development schedule,

13-3
• Limitations on funds for development and testing,
• Mission changes,
• Design to cost acquisition goals,
• Employment or operations and maintenance concept,
• Support personnel efficiency,
• Training efficiency,
• Quality control efficiency,
• Detail design decisions,
• Support equipment design and use,
• Training material quality.
When uncertainty is great in areas outside the contractor's control, techniques
that place less responsibility and risk on the contractor, such as award fee and value
engineering incentive provisions may be more appropriate. On the other hand if there is
considerable experience with similar equipment and uncertainty results primarily from
things such as design and quality control, over which the contractor has significant
control, more demanding incentive provisions, such as a Support Cost Guarantee
(SCG), Reliability Improvement Warranty (RIW) or RIW with an MTBF Guarantee are
applicable.
Source Selection Criteria
Life cycle costing objectives may be achieved by making life cycle cost an
important source selection criterion in procurements, which may or may not use life
cycle cost procurement incentive provisions. These two approaches are complementary
in that use of life cycle cost as a source selection criterion motivates a contractor to
consider life cycle costs prior to source selection, and use of incentive provisions
motivates a contractor to consider life cycle costs after contract award. The joint use of
these two techniques also motivates contractors to submit realistic 0&S cost estimates
at source selection because incentives will be tied to them.

13-4
Pre-award Testing
This is a procurement approach to reducing life cycle costs, primarily
characterized by testing to assess important life cycle cost related characteristics prior
to source selection.
The contract is awarded based on demonstrated LCC related performance in
pre award testing. Pre-contract award tests are conducted to assess the LCC related
equipment characteristics of each contractor’s equipments, and the results of these
assessments expressed in terms of life cycle costs, are used as the primary basis for
source selection.
The advantages of pre-award testing are as follows:
• The source selection is based on facts concerning performance of
equipment, not on promises.
• It does not require development and operation of a post-award
measurement system to accurately verify the operating and support cost
performance of the equipment in the field.
• It motivates contractors to innovate lower life cycle cost designs while
they are still in competition with each other to get the prime
development and production contract.
The disadvantages of pre-award testing are as follows:
• Because of the uncertainties involved, it is sometimes difficult for the
Government and contractor to agree on a practical measurement
system, which will equitably assess the 0&S cost performance of the
equipment
• It does not motivate the contractor to further reduce the life cycle costs
of his equipment after contract award.
• Its limitation to equipment procurements where it is feasible to buy and
test equipments from competing vendors prior to making a source
selection decision.
13-5
There are two major steps in applying this type of life cycle cost provision. The
first major step is appropriate selection of candidate equipments. The second major
step is the development of testing and source selection procedures and criteria.
Design to Cost/Life Cycle Cost Design Trade Study Requirements
This technique requires that contractor conduct studies to assess the cost
implication of design and support alternatives.
Design trade studies are a common requirement on most development
programs. The overall process of implementing this approach includes requesting
offers to propose design to cost/life cycle cost (DTC/LCC) design trade studies,
evaluating these proposals, and contracting for specific trade studies.
This technique for reducing life cycle costs can almost always be applied. In
fact, where technology and other uncertainties make it difficult to transfer
responsibility for O&S cost performance to contractors, this approach may prove most
advantageous. It also promotes the engagement of government personnel in design
decisions affecting 0&S costs.
This approach does not contractually make the contractor responsible for O&S
cost performance as demonstrated in the field.
The methodology for the application of this technique is defined as follows:
• Determination of adequate time and design flexibility,
• Determine whether the DTC/LCC design trade studies to be involved
should be specified by the Government, proposed by the contractors or
both,
• Describe all required DTC/LCC design trade studies for the contractor,
• Evaluate the proposals with respect to the DTC/LCC design trade study
plans presented by each contractor.
13-6
• Include in the contract Statement of Work a required list of specific trade
studies, any requirements for additional trade studies, and documentation
requirements for all trade studies conducted.
• Assure appropriate Government design specialists and other necessary
personnel monitor the contractor's work to evolve a low life cycle cost
system or equipment design.
Reliability and Maintainability (R&M) Acceptance Criteria
This is the technique used to motivate contractors to produce equipment with
low O&S cost characteristics requiring reliability and maintainability demonstration
tests which have to be passed before equipment is to be accepted under the contract.
This technique has been adapted as necessary for individual programs. Using
reliability acceptance criteria as an example, its essential elements are;
• Minimum acceptable mean time between failure (MTBF),
• Specification of environmental and other test conditions,
• Specification of acceptance test criteria, such as sampling plans, test
time, failure definitions,
• Conducting the tests and arriving at a decision to accept or reject based
on the results,
• In case of rejection, redesigning the equipment and repeating the tests
until achieving the results required for acceptance of the equipment.
This technique is a well-defined procedure and involves little or none of the
uncertainty with respect to how equipment will be used in the field in the future that
complicates other LCC procurement procedures. In addition, this approach separates
development and support activities somewhat simplifying its planning and execution.
The basic disadvantage of this approach is that successful laboratory testing
is a necessary but not a sufficient guarantee that the equipment will demonstrate
13-7
acceptable reliability in the field. It is difficult to design a test procedure, which will
correlate MTBF values observed during the tests to those expected in the field.
From an incentive standpoint, this approach is deficient in that it does not give
the contractor any incentive to design the equipment any better than necessary to
meet minimum reliability criteria.
LCC Procurement Incentive Provisions
General
The contract provisions designed to motivate a contractor to deliver lower life
cycle cost systems or equipment are called as LCC Procurement Incentive Provisions.
Cost reductions may be sought in support costs, acquisition costs or both. The eight
types of provisions represent a spectrum of approaches, which can be used individually
or in combination to match the LCC reduction motivation needs of new programs.
Award Fee
The objective of using the award fee is to motivate the contractor to take action
to engage in one or more activity areas, such as design trade studies, more extensive
or efficient testing, resulting in eventual life cycle cost reductions. The two essential
parts of all award fee provisions are the maximum size of the fee and the criteria to be
used by the Government in making a determination on how much of the maximum
possible fee to award. The criteria are very important in that they communicate to the
contractor what should be accomplished to earn an award fee.
The primary advantage of life cycle cost award fee incentive provisions is to
provide a mechanism for evaluation of contractor management, which usually received
secretarial review. An award fee determinations made at some time in the future can be
based not only on evidence of the contractor's performance, but on additional
13-8
information bearing on the difficulty of achieving life cycle cost objectives, not known
at the time of contract award.
Many feel and argue that award fee provisions, which do not hold contractors
responsible for not delivering low life cycle cost equipment, as promised, do not
adequately motivate contractors. Since award fee provisions are primarily designed
to reward a contractor for moving from expected performance to better than expected
performance, they may not provide motivation with respect to improving equipment
with poor LCC performance. In addition, maximum life cycle cost award fees are
generally small compared to the potential operating and support cost reduction
opportunities.
Support Cost Guarantee (SCG)
Support Cost Guarantee (SCG) provisions should generally be used in
conjunction with firm fixed price contracts. Support cost guarantee provisions generally
have both negative and positive features. When a positive incentive feature is
employed, it is provided either as an award fee or price adjustment provision. The
simplest type of price adjustment provision is to pay a higher price for items, which have
lower support cost characteristics. The negative incentive feature usually takes the form
of one or more of the following type provisions:
• Hardware Correction of Deficiencies: A provision by which the contractor
guarantees that support costs will meet a given target value as demonstrated
by verification testing, and that he will correct deficiencies causing this value to
be exceeded.
• Downward Price Adjustment: A provision similar to the hardware
correction of deficiencies provision except that the remedy for exceeding the
support cost target is a negotiated downward price adjustment either through a
reduced fee or a reduced price for a specific production quantity. The schedule
for such downward price adjustments must be included in the contract.
• No Cost Additional Spares: A provision also similar to the hardware
correction of deficiencies provision except that the remedy for exceeding the
13-9
support cost target is that the contractor provides, at no additional cost,
additional spares to offset the support cost deficiency.
• Ceiling price for Repair: During the period of time required to develop
support equipment and data, the contractor can act as the depot and
accomplish repair for a unit price per repair. Given a time period, a fixed usage
rate and a predictable return rate, a ceiling of the repair cost can limit the cost
obligation to the Government.
Contractor commitments to keep support costs below a specified level are
established in the contract. Objective and realistic support cost estimates must be
made early in the program. The contractor’s design effort is forced to direct attention to
the supportability of the equipment through the design process.
Extensive field verification tests involving training, using, acquiring and
supporting command personnel are required. The time required to conduct this test
may defer contract settlement, closeout, or payment. The expense associated with field
verification testing is great and the administrative tasks are many; however, limiting
the negative incentive to no cost additional spares can limit the testing to measuring
MTBF only.
Reliability Improvement Warranty (RIW)
The objective of an RIW is to motivate contractors to design and produce
equipment that will have a low failure rate, as well as low repair costs after failure,
resulting from operational use. In general, an RIW will provide for the repair or
replacement of failed units as well as agreed to no cost engineering changes and the
associated calibration, adjustment and testing. RIW is not, however, a maintenance
contract, and RTW provisions will not require a contractor to provide routine periodic
upkeep, i.e., adjusting, cleaning, and replacing fuses or light bulbs.
Under RIW, the contractor has a degree of financial responsibility for field
performance of his hardware. The contractor no longer may seek lowest acceptable
13-10
reliability. The contractor achieves maximum profit by controlling and making
appropriate tradeoffs between production costs and certain operating and support
costs.
The Government can defer many initial logistics decisions concerning the
purchase of spare parts, test equipment and technical data. These decisions can then
be made based upon more and better information generated during RIW.
When an RIW approach is properly considered early in development, support
cost risks are surfaced at a time when they can best be addressed and costs avoided.
The disadvantages of this provision are;
• It may not be practical to estimate with any degree of accuracy the
warranty costs for many new items of equipment having any significant
technical complexity.
• Laboratory controlled reliability demonstration tests alone may not provide
a sufficient basis for developing a reasonable estimate of expected field
reliability and reliability growth potential.
• The most important fact affecting the economic outcomes of an RIW is
the rate of return of units to the contractor's plant. A prediction of this
actor must be based on known or estimable data in order to identify and
control risk. This factor is significantly influenced by how the equipment
will be used in the field.
• Use and environmental conditions must be clearly defined at the time of
warranty pricing. This information is often not available. However, some
uncertainty on use and environmental factors can be reduced through
contractual provisions, e.g., adjustment for usage rate.
There are a number of other criteria that should be satisfied for an item to be
selected for Reliability Improvement Warranty coverage

13-11
Reliability Improvement Warranty (RIW) with MTBF Guarantee
The objective of an RIW with an MTBF guarantee is to provide a life cycle cost
control approach assuring the Government of obtaining the MTBF maturation through
the guarantee provision. Projected MTBF maturation is contained in the contract as a
function of time over the warranty period. If the specified operational MTBF is not
achieved, the contractor is required to provide additional spares to support operations
and may be required to submit corrective engineering change proposals and implement
approved changes at his expense.
The contractor may be required to make his design, redesign and corrective
action decisions so as to achieve his guaranteed MTBF. Therefore, the Government
should get equipment with not only lower support costs but with increased mission
reliability and. increased availability.
The final design configuration should be stable and the Statement of Work and
specifications developed to provide the capability to define; measure and predict the
MTBF and its growth during the warranty coverage. This is often not possible at the
time when the acquisition is still in a competitive environment if only one full-scale
development contractor is involved.
Reliability Demonstration Incentive
This is a procurement technique which includes a provision paying the
contractor for a variable price per unit depending on the reliability of the equipment
demonstrated under a specified set of test chamber conditions.
In a reliability demonstration incentive type of life cycle costing procurement, a
bonus fee schedule will be prepared based on the reliability of the equipment
demonstrated under specified conditions. This approach primarily differs from other
life cycle cost incentive provisions in that the basis for incentive provision settlement
13-12
determinations is Government specified and closely monitored test chamber, not field,
reliability demonstrating testing.
The primary advantage of this life cycle cost procurement technique is that it
gets directly to the root of many operating and support cost problems, low reliability
equipment. It has the advantage over some LCC procurement techniques in that it
requires the demonstration and assessment of only one parameter, that is, equipment
reliability as opposed to several parameters required to assess total equipment life
cycle costs.
One disadvantage is that this incentive is tied only to reliability and does not
include consideration of other factors which affect life cycle costs, such as time to
repair, spares consumption, required maintenance skill levels, etc. Another
disadvantage is that historically there has been poor correlation between reliability test
results conducted at the contractor's facility and reliability demonstrated in the field. This
approach cannot work effectively unless this problem is substantially corrected.
Fixed Price Repair with Incentive
The objective of a fixed priced repair incentive contract is to control support
costs by obtaining unit repair cost prices in a competitive environment, and
motivating the contractor to achieve the reliability used as a basis for the unit repair
cost prices and the contract repair cost ceiling.
The Government can obtain fixed commitments on repair costs while suppliers
are still in competition. Objectivity and realism in support cost estimates submitted for
source selection consideration are enhanced. The contractor incurs a lower cost
exposure risk than he might incur on an RIW contract.
There is no guarantee that reliable and maintainable equipment will be
delivered. Contract repair often requires additional pipeline spares and the associated
costs. There is less incentive for the contractor to improve the reliability of the
13-13
equipment than on RIW contracts. There may be time when forecasting the field
reliability is difficult and therefore arriving at an equitable ceiling price may be difficult.
Cost effective application of this approach is generally limited to items normally
repaired at a depot and where the expense of the added pipeline spares costs are not
prohibitive.
Design-to-Cost (DTC) Incentives
An incentive arrangement used to motivate the contractor to introduce
producibility and supportability considerations into his design, suggest configuration
changes which can reduce cost without seriously reducing mission performance
capabilities, and to recommend the elimination of performance requirements or
specifications which do not provide system capabilities commensurate with their
costs.
Currently most design to cost targets are tied to production costs. A design to
cost incentive in a production contract is a fixed priced incentive agreement generally
using specified formulae for establishing the earned level of profit. The formula would
base the target profit on the achievement of the specified design to cost target. The
formula may have positive and negative incentive features. It is applicable to design to
cost targets that can be quantified and measured, such as a unit or cumulative
average unit production cost target for a specified buy quantity produced at a
specified rate per month.
A design to cost incentive can increase contractor's profits while decreasing
Government costs. An innovative contractor should be able to achieve design to cost
objectives without degrading performance. Use of DTC incentives can provide a means
of motivating the contractor to reduce costs when competition no longer exists. They
also provide a means of cost control in procuring the first production quantities.
Control and visibility over non target related costs must be rigorously
maintained to preclude actions reducing target related costs while increasing nontarget
13-14
related costs. This approach requires the continual tracking and assessing of the cost
target, which will be affected by directed design changes, escalation and many other
factors. When Government directed changes may impact the agreed to target, a new
target must be negotiated in a noncompetitive environment.
Value Engineering Incentive
The objective of value engineering incentives is to encourage the contractor to
submit cost reduction proposals involving some change in the contract specifications,
purchase descriptions, or contract statement of work. This may include the elimination
or modification of any requirements found to be in excess of actual needs in areas
such as design of components, materials requirements, material processes,
tolerances, packaging requirements, technical data requirements, or testing
procedures and requirements.
Unlike several of the new types of life cycle cost provisions, value engineering
incentive payments related to O&S cost reduction related proposals are based on
estimated savings rather than field experience with the specific equipment.
Value engineering incentives in full-scale development contracts are one
management tool for reducing production and operating and support costs. However,
precautions must be exercised to prevent possible duplication between value
engineering incentives and other life cycle cost incentives.
Value engineering provides a management mechanism and tools to motivate
contractors to challenge unnecessary requirements and thereby reducing life cycle
costs. This in turn can provide an opportunity to involve each manager, engineer, and
technician in cost reduction activities as part of his responsibilities for meeting
performance and schedule requirements.
Value engineering techniques can be applied to a wide range of programs.
Prime contractors can use them to encourage subcontractors to reduce costs. Value

13-15
engineering provisions have a relatively short evaluation period prior to incentive
payment thereby increasing the contractor's motivation.
Valid assessment of operating and support cost reduction implications of
changes is often difficult and may involve considerable uncertainty. Value engineering
may not be an adequately strong incentive to reduce future costs.

This page has been deliberately left blank
Page intentionnellement blanche
14-1
Expérience navale française nationale et en coopérationconcernant le LCC et le Cost Structuring
(Naval Experience Concerning LCC & Cost Structuring)
Patrice GarnierDGA (délégation générale pour l'armement)
SPN/ST/MCO8, bd. Victor, Paris, 00303
Armées, France
Cette présentation vise à expliquer “ pourquoi ” (les demandes d’origine), “ comment ” (la démarche et leraisonnement) et les “ résultats réels obtenus ” (structure de coûts et perception par les utilisateurs étatiques etindustriels) concernant une application de structuration des coûts dans un programme, puis ce qu’il en estadvenu.
1. Origines du besoinA l’origine de cette réflexion, se trouve le programme tri-national Horizon de frégates aériennes, dont la fichede caractéristiques militaires (TSR = Tripartite Staff Requirements) comportait une exigence de maîtrise et deprévision des coûts relatifs à ces bâtiments.De plus, l’une des nations participantes (UK MOD ) posa le problème de la connaissance des coûts réels etdes flux financiers liés aux différentes activités d’un bâtiment (savoir à quoi est employé l’argent) et del’éventuelle budgétisation annuelle de ses coûts (de possession ) tout au long de sa vie (réalisation + enservice).
2. Traitement des demandesPour traiter cette double demande, différentes possibilités ont été passées en revue.
2.1. Généralités* différence entre « structure » et « modèle »En général :Un « modèle » est une représentation dynamique ayant pour particularité que les modifications posées enentrée influent sur les résultats obtenus. Par suite, il est fortement dépendant (puisque représentatif) dusystème étudié. Il n’est donc pas transposable d’un système à un autre.Une « structure » est une représentation figée (donc statique) de recueil et de synthèse des différents coûtsgénérés par le système étudié. Il s’agit donc d’une représentation des coûts du système et non pas du système.Elle est donc, a priori, applicable à tous les systèmes.
* différence entre structure de bateau (ou de système) et structure de coût , en termes de coût.
Communication présentée lors du symposium RTO SAS sur les « Structures de coûts et coûts globaux de possession (LCC) pour systèmes militaires », organisé à Paris, France, du 24 au 25 octobre 2001, et éditée dans RTO-MP-096.

14-2
-La structure du bateau (ou du système) est en fait une structure du bateau représentée en éléments financiers :Cost of the ship B➥– cost of the platform, x➥– cost of the combat system y ➥– cost of the CMS p ➥– cost of the AAW system q
➥– cost of the ASW system ravec : y = p + q + r et B = x + yCette approche est davantage adaptée à l’évaluation de l’acquisition d’un système.
-Une structure de (ou des) coûts du bateau (ou du système) est en fait une répartition des coûts aux différentessources de coûts.On peut ainsi identifier, comme source ou générateurs de coûts, des activités techniques, industrielles,managériales, d’emploi ou de soutien, etc. du bateau, d’une façon totalement indépendante de sadécomposition technique.Cost of the system (through life)➥– acquisition cost of the system,➥– investment cost of the system,➥– cost to operate the system,➥– cost to support the system,➥– cost to dispose of the system,
Chaque ligne peut-être détaillée, par exemple:➥– cost to operate the system,
➥– cost of the manning, ➥– cost of the consumables
➥– cost of the fuel,➥– cost of the ammunitions,➥– cost of … etc.
Cette approche est beaucoup plus proche du besoin de suivi des dépenses. De plus, elle peut-être appliquée àchaque élément de l’arborescence technique du système étudié.
- - -
2.2. Synthèse.
En fait, le problème posé est celui, déjà connu en comptabilité, de la connaissance des flux financiers, avecpour particularités, ici, d’être appliqué à un bâtiment, tout au long de sa vie, par le client et non par lefournisseur. Les pratiques comptables courantes des entreprises nomment cela de l’« information comptable »et le traitent par application des règles de la comptabilité analytique (à la différence de la comptabilitégénérale).
Puisqu’il s’agit d’un problème comptable, il faut tenir compte des différentes règles du métier et les adapter auproblème.
On retiendra les éléments suivants pris aux différentes approches :
-a- Le plan comptable général français (PCG 82) permet de comparer toutes les sociétés, ici, tous les systèmes,grâce aux caractéristiques suivantes : présentation des coûts selon un formalisme obligatoire où chaque lignede compte a un numéro et une définition claire de son contenu et de ses méthodes de calcul. De plus, chaqueligne est elle-même décomposée en sous-ligne autant de fois que cela est nécessaire à la précision voulue surl’information de coût recherchée. Trois niveaux d’application (renforcé, basique, simplifié) sont utilisés enfonction de critères à définir et dépendant fortement du montant total et de l’importance de chaque ligne decompte.
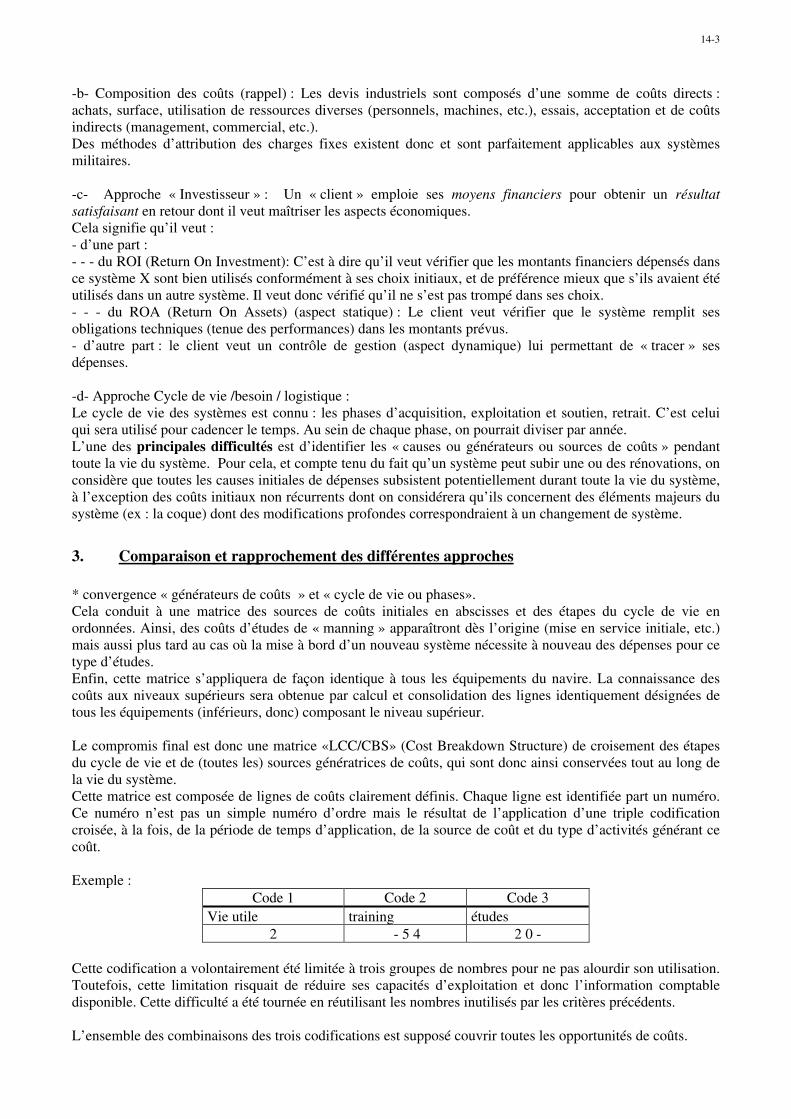
14-3
-b- Composition des coûts (rappel) : Les devis industriels sont composés d’une somme de coûts directs :achats, surface, utilisation de ressources diverses (personnels, machines, etc.), essais, acceptation et de coûtsindirects (management, commercial, etc.).Des méthodes d’attribution des charges fixes existent donc et sont parfaitement applicables aux systèmesmilitaires.
-c- Approche « Investisseur » : Un « client » emploie ses moyens financiers pour obtenir un résultatsatisfaisant en retour dont il veut maîtriser les aspects économiques.Cela signifie qu’il veut :- d’une part :- - - du ROI (Return On Investment): C’est à dire qu’il veut vérifier que les montants financiers dépensés dansce système X sont bien utilisés conformément à ses choix initiaux, et de préférence mieux que s’ils avaient étéutilisés dans un autre système. Il veut donc vérifié qu’il ne s’est pas trompé dans ses choix.- - - du ROA (Return On Assets) (aspect statique) : Le client veut vérifier que le système remplit sesobligations techniques (tenue des performances) dans les montants prévus.- d’autre part : le client veut un contrôle de gestion (aspect dynamique) lui permettant de « tracer » sesdépenses.
-d- Approche Cycle de vie /besoin / logistique :Le cycle de vie des systèmes est connu : les phases d’acquisition, exploitation et soutien, retrait. C’est celuiqui sera utilisé pour cadencer le temps. Au sein de chaque phase, on pourrait diviser par année.L’une des principales difficultés est d’identifier les « causes ou générateurs ou sources de coûts » pendanttoute la vie du système. Pour cela, et compte tenu du fait qu’un système peut subir une ou des rénovations, onconsidère que toutes les causes initiales de dépenses subsistent potentiellement durant toute la vie du système,à l’exception des coûts initiaux non récurrents dont on considérera qu’ils concernent des éléments majeurs dusystème (ex : la coque) dont des modifications profondes correspondraient à un changement de système.
3. Comparaison et rapprochement des différentes approches
* convergence « générateurs de coûts » et « cycle de vie ou phases».Cela conduit à une matrice des sources de coûts initiales en abscisses et des étapes du cycle de vie enordonnées. Ainsi, des coûts d’études de « manning » apparaîtront dès l’origine (mise en service initiale, etc.)mais aussi plus tard au cas où la mise à bord d’un nouveau système nécessite à nouveau des dépenses pour cetype d’études.Enfin, cette matrice s’appliquera de façon identique à tous les équipements du navire. La connaissance descoûts aux niveaux supérieurs sera obtenue par calcul et consolidation des lignes identiquement désignées detous les équipements (inférieurs, donc) composant le niveau supérieur.
Le compromis final est donc une matrice «LCC/CBS» (Cost Breakdown Structure) de croisement des étapesdu cycle de vie et de (toutes les) sources génératrices de coûts, qui sont donc ainsi conservées tout au long dela vie du système.Cette matrice est composée de lignes de coûts clairement définis. Chaque ligne est identifiée part un numéro.Ce numéro n’est pas un simple numéro d’ordre mais le résultat de l’application d’une triple codificationcroisée, à la fois, de la période de temps d’application, de la source de coût et du type d’activités générant cecoût.
Exemple :Code 1 Code 2 Code 3
Vie utile training études2 - 5 4 2 0 -
Cette codification a volontairement été limitée à trois groupes de nombres pour ne pas alourdir son utilisation.Toutefois, cette limitation risquait de réduire ses capacités d’exploitation et donc l’information comptabledisponible. Cette difficulté a été tournée en réutilisant les nombres inutilisés par les critères précédents.
L’ensemble des combinaisons des trois codifications est supposé couvrir toutes les opportunités de coûts.

14-4
Ainsi, peut-on distinguer :Code 1 Code 2 Code 3
Système principal Configuration parc de systèmes1 0 6 x - 7 x
ou : munitions Configuration Management8 0 6 x 0 1 x
Un autre avantage de cette codification est la possibilité d’utiliser directement les tables de codification pourattribuer un numéro à une ligne de coûts.
LCC/CBS n’est pas destiné à rapporter les coûts des systèmes pendant leurs seules phases de réalisations,mais durant toutes les phases de leur vie.
Enfin, une fois les coûts rapportés selon «LCC/CBS», les consolidations et calculs fournissent l’informationcomptable recherchée, grâce au collationnement des coûts concernés selon des critères de tris appliqués auxcodes des lignes de coûts.Exemples :Toutes les lignes : 2 2xx 70x fournissent les coûts initiaux dépensés pour le système de soutien du parc de
système (commun à tous les systèmes).Toutes les lignes : x 22x xxx fournissent les coûts relatifs aux rechanges (initiaux et en service, études,
communs au parc ou spécifiques à chaque système (après multiplicationpréalable par le nombre de systèmes), software et hardware (consommables etnon),
alors que les lignes x 223 xxx fournissent idem limité aux softwares et sans les études.et les lignes x x5x xxx fournissent les coûts liés aux facteurs humains :manning, training, , safety,etc.et les lignes x x54 xxx fournissent idem limité aux seuls aspects du training & training support.et les lignes 2 054 xxx fournissent idem limité au training & training support, durant la phase
d’acquisition.x = quelque soit le chiffre.
A bien retenir :
LCC/CBS est un moyen de collationner et rapporterdes données de coûts de n’importe quel système durant toute sa vie,
de les consolider avec d’autres coûts (du système supérieur),de les comparer d’un système à l’autre, etc.
C’est une méthode reposant sur les règles fondamentales de la comptabilitéanalytique, ayant pour objectif de
savoir,ensuite de
gérer,pour maîtriser
les coûts de nos investissements(durant toute leur vie).
Il en existe d’autres, bien sûr.La difficulté était de trouver une traduction concrète et adaptée des règles de comptabilité analytiquecourantes, qui ont fait leurs preuves.(Les tableaux des trois codifications sont donnés dans la présentation.)
14-5
4. LCC/CBS : situation actuelle.Une fois le système conçu, le problème était de savoir comment il serait perçu, accueilli et finalementappliqué par les utilisateurs, et, en tout premier lieu, par ceux fournissant les informations de coûts.
LCC/CBS a été utilisé :- sur le programme Horizon Tripartite (nations et industries), où les industriels en compétition, notamment,ont répondu aux appels d’offres en utilisant la structure,- sur le programme français de Frégates Multi-Missions (FMM), pour améliorer l’identification des coûtsdisponibles et dans la prochaine phase de faisabilité,- curieusement, il a été retrouvé sur des études ultérieures, alors que son emploi n’avait pas été imposé, ce quisignifie une sorte appropriation par certains industriels de l’ex-programme Hzn à des fins professionnelsinternes.
Qualité d’utilisation.La qualité des réponses a beaucoup variée d’un utilisateurs à l’autre, toutefois, certaines erreurs ont desexplications communes.Les origines des difficultés rencontrées dans l’emploi de LCC/CBS ont été identifiées, il s’agitprincipalement :- d’un manque de maturité des interlocuteurs industriels (ILS-M) en matière comptable et de gestion,- de l’absence d’informations élémentaires de coûts au sein des nations.
5. LCC/ CBS : utilisation et exploitation.Un minimum de rigueur est nécessaire pour utiliser LCC/CBS. Il s’agit d’appliquer certaines règlescomptables et quelques directives d’emploi.
Les principales sont :
- déterminer le périmètre du chiffrage : quels systèmes, combien, points d’emplois (sur quels bâtiments), pourquelle période, etc. Le but est de savoir à quoi se rapportent les chiffres.
- déterminer, ou indiquer, les unités de chiffrage :(a) quand le chiffre est fourni en unité monétaire : préciser laquelle, Franc, Euro, ou autres. Préciser s’il s’agit
de (exemple) Franc « courant » (de tous les jours, en ce cas indiquer l’année) ou de Franc « constant » (netenant pas compte de l’érosion monétaire et/ou de l’inflation), ceci pour éviter de comparer desévaluations de 1980 à d’autres de l’an 2000,
(b) quand il n’est pas possible de réaliser le chiffrage en unité monétaire (exemple : lorsque l’industriel neconnaît pas le coût horaire d’un personnel du client), fournir alors les élément permettant le chiffrage,c’est à dire, généralement, l’évaluation en volume (ex : quantité d’homme*heure, etc.)
- enfin, se souvenir que les coûts fixes sont toujours imputables via l’utilisation d’une clé de répartition etd’unité d’œuvres comptables adaptés.
Une fois les chiffrages fournis, par l’industrie généralement,- ajouter des informations complémentaires d’origine client (coûts élémentaires internes, exemple : coûtd’homme*heure, coût de la tonne – ou litre- de carburant),
- réaliser les synthèses, re-calculs ou consolidations, via des tris à l’aide des numéros de lignes codifiées.

14-6
6. Améliorations ultérieures
- Renseignements des lignes de la structure.Le but recherché étant l’information comptable, il est tentant de rechercher à accroître le nombred’informations recueillies en multipliant les sous-lignes de comptes et/ou en détaillant le contenu des lignessous la forme d’un devis industriel, par exemple (hommes, surface, ressources, etc.. ).Toutefois, la rentabilité de cette possibilité est à comparer, à ce qu’elle pourra coûter (de la part desindustriels, par exemple, pour lesquels cela correspond à un surcroît de travail, donc à un surcoût), d’une part,et au bénéfice réellement obtenu, d’autre part. En outre, le temps nécessaire au traitement des informationsrecueillies, par les organismes étatiques, est un facteur non négligeable qu’il faut considérer.
- Passage à un outil informatisé.L’informatisation complète de la méthode de façon à bénéficier de consolidations et retraitements quasi-automatiques apparaît comme l’étape suivante. Elle est envisagée.
- - -

15-1
LCC Analysis for the Replacement of the Dutch F-16
Mr. R.C.T. de Haas, Mr. M.C. Smiten Kol. Ir. M. de Zeeuw
Postbus 968642509 Den HaagThe Netherlands
Unfortunately Kol. de Zeeuw will not be able to attend the symposium, as in October 2001, itis expected that the project team will be very busy during that period in answering questionsfrom parliament. However, the paper will be co-authored by TNO-FEL and RNLAF. And theRNLAF suggested that the presentation will be given by TNO-FEL.
Abstract:
In the presentation we will first describe the way LCC-analysis are performed in theNetherlands in a general way. In the Netherlands LCC-studies are mainly used in theacquisition process of new military equipment. Inside the armed forces a project team isresponsible for the acquisition process and thus also for the execution of an LCC-study. TNOis also regularly involved for a number of reasons. The most important reason is that TNO isindependent. Besides that TNO-FEL has developed a step by step approach for performingLCC-analyses inside the Defence Organisation, called FELSALDO. The FELSALDO methodconsists of five steps: planning, definition, development, analysis and report. We will show acommon cost tree for the acquisition costs, the exploitation costs and the disposal costs. Whenthe elements of the cost tree have been determined, these cost elements are estimated. Thereare different ways of estimating a cost element. After estimating the cost elements the totalLCC can be calculated.
After this introduction we will focus on the project: Replacement F-16. We will show how theFELSALDO method was applied during the LCC-analysis in this project. First we will give alittle background of the F-16 replacement project. We will indicate that LCC is only one ofseven main decision criteria. After that we will give a detailed description of the LCCprocess, from planning to report using the five steps of the FELSALDO methodology. TheLCC analysis in this project was done thoroughly and extensively. A lot of effort was put intogathering the right data from the vendors and a lot of interaction with the vendors wasnecessary in order to make sure that the data used was the right one and that the vendors datawas used in an appropriate manner. Finally we will give the current status of the project,describe what the next LCC related problems will be and share the lessons learned of the F-16replacement project.
Introduction
TNO is an independent contract research organisation (originated by law in the 19 thirties)consisting of 15 institutes active in a numerous areas of applied scientific research. Defence isone of the core areas. Three TNO institutes are working in the defence area with a total ofaround 1000 employees. One of them is the Physics and Electronics Laboratory (FEL).
Paper presented at the RTO SAS Symposium on “Cost Structure and Life Cycle Cost (LCC) for Military Systems”, held in Paris, France, 24-25 October 2001, and published in RTO-MP-096.
15-2
LCC in general and FELSALDO
Organisation of LCC-studies in the NetherlandsIn the Netherlands LCC-studies are mainly used in the acquisition process of new militaryequipment. Military equipment especially for the Army and Airforce is often procuredCommercial Off the Shelf (COTS). Since 1993 LCC-studies are obliged in all stages of theDefence Materiel acquisition Process (DMP), that means for an acquisition project with abudget of at least fl. 5 million, an LCC-study has to be performed. Inside the armed forces aproject team is responsible for the acquisition process and thus also for the execution of anLCC-study.
Involvement TNO-FEL ORB in LCC-studies in the NetherlandsTNO is regularly involved with LCC-analyses in acquisition projects for a number of reasons.The most important reason is that TNO is independent. Besides that TNO-FEL has developeda step by step approach for performing LCC-analyses inside the Defence Organisation, calledFELSALDO. With this methodology project managers are able to perform LCC-studiesthemselves. But what we see is, that especially in the more complex acquisition projects TNOis invited to perform the LCC studies, most of the times in close co-operation with the projectteam. Our work consist mainly in composing or assisting in composing questionnaires on costissues, that will be send to industry as part of the RFI, RFQ or RFP. When industry hasanswered these questions, the answers are evaluated, an LCC-analysis is performed andsensitivity analyses can be performed.
Especially in the more complex acquisition projects TNO is asked to support the armed forcesin a broader way. TNO is able to provide support in a number of areas, like all kinds oftechnical, operational and logistic aspects. We have expertise in many areas. The project“replacement F-16” is an example of such a broad support.
Evaluating and reducing the initial and through life costThe following type of LCC-studies can be performed in the acquisition phase of newequipment, the first one I mentioned already:1. Estimation of the total costs for new equipment:2. Comparison of Life Cycle Costs for different options to fulfil the requirements:
Very often a number of candidate suppliers have to be compared in the acquisition phase.It is also possible that one candidate supplier offers a number of options to fulfil therequirements. The different candidate suppliers and the different options can be comparedon cost issues, when a common cost tree is used.It is also possible to use LCC-analyses to calculate, evaluate and compare several supportalternatives for the equipment. For instance a comparison of the concept of four levels ofmaintenance with the concept of two levels.
3. Determine important factors of influence / cost-driversCost-drivers are closely related with the main factors of influence. Based on the results ofthe study, cost-drivers can be analysed and studies can be performed trying to lower thetotal life cycle costs.
4. Sensitivity analyses on important factors of influence or uncertain cost elementsWhen the important factors of influence are known, analyses can be performed on thesensitivity of these factors to determine their impact on the total life cycle cost. This typeof sensitivity analyses can also be done on uncertain cost elements. On how to deal withuncertainty in cost I will come back later.
FELSALDOTNO-FEL has developed a step-by-step methodology for executing an LCC-study. TheFELSALDO method consists of five steps: planning, definition, development, analysis andreport. The first two steps determine the objective and scope of the LCC analysis. The mostimportant steps are the third and the fourth in which the LCC are calculated. Finally a reportis written.
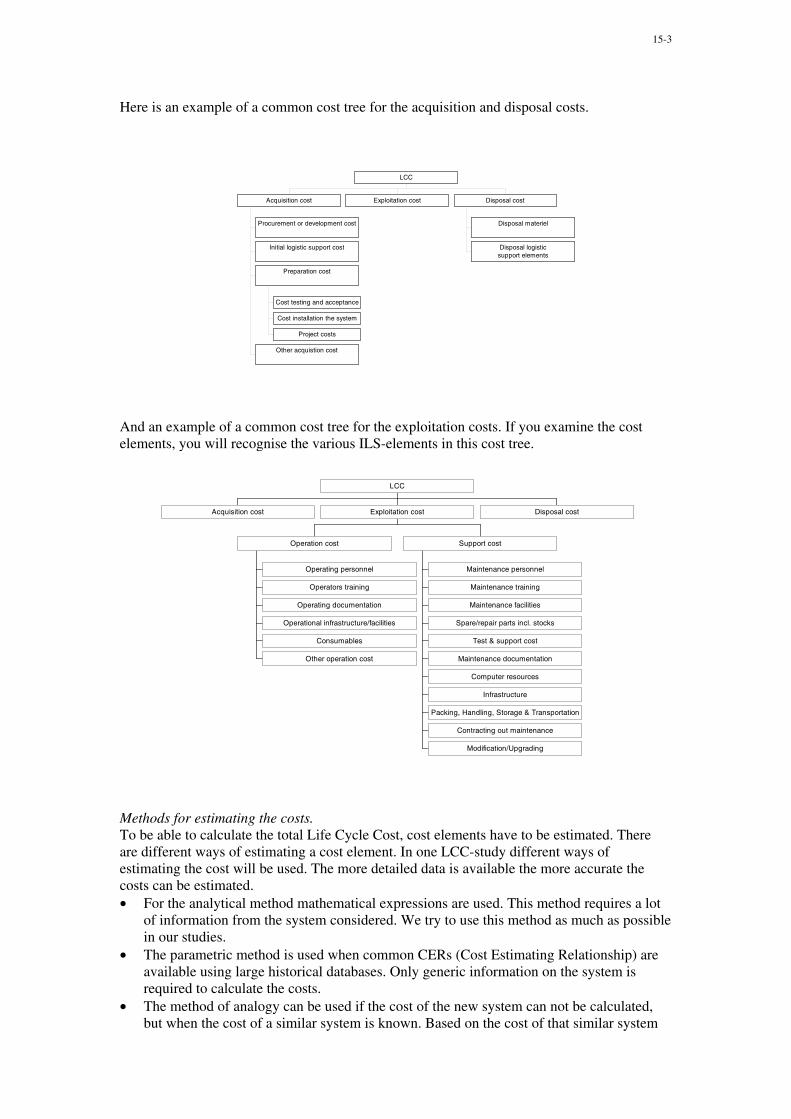
15-3
Here is an example of a common cost tree for the acquisition and disposal costs.
Procurement or development cost
Initial logistic support cost
Cost testing and acceptance
Cost installation the system
Project costs
Preparation cost
Other acquistion cost
Acquisition cost Exploitation cost
Disposal materiel
Disposal logisticsupport elements
Disposal cost
LCC
And an example of a common cost tree for the exploitation costs. If you examine the costelements, you will recognise the various ILS-elements in this cost tree.
Acquisition cost
Operating personnel
Operators training
Operating documentation
Operational infrastructure/facilities
Consumables
Other operation cost
Operation cost
Maintenance personnel
Maintenance training
Maintenance facilities
Spare/repair parts incl. stocks
Test & support cost
Maintenance documentation
Computer resources
Infrastructure
Packing, Handling, Storage & Transportation
Contracting out maintenance
Modification/Upgrading
Support cost
Exploitation cost Disposal cost
LCC
Methods for estimating the costs.To be able to calculate the total Life Cycle Cost, cost elements have to be estimated. Thereare different ways of estimating a cost element. In one LCC-study different ways ofestimating the cost will be used. The more detailed data is available the more accurate thecosts can be estimated.• For the analytical method mathematical expressions are used. This method requires a lot
of information from the system considered. We try to use this method as much as possiblein our studies.
• The parametric method is used when common CERs (Cost Estimating Relationship) areavailable using large historical databases. Only generic information on the system isrequired to calculate the costs.
• The method of analogy can be used if the cost of the new system can not be calculated,but when the cost of a similar system is known. Based on the cost of that similar system

15-4
the costs of the new system can be estimated, using characteristic parameters, technologyfactors and add-on factors.
• Three other methods can be used if even less information is available for the new system:expert opinions or rules of thumb may then help in estimating the cost. The method ofsimulation can be used if the real height of one or more cost elements is uncertain.Statistical methods (e.g. Monte Carlo simulation) can be used to produce confidenceintervals for the total costs.
After estimating the cost elements, the total LCC can be calculated.
LCC in replacement F-16
Background of the projectThe Royal Netherlands Airforce has the F-16 in service since 1979. Currently the RNLAFoperates 138 AC form three main operating bases, Leeuwarden, Volkel and Twenthe. The F-16’s have undergone a Mid-Life Update that is almost completed for the entire fleet. Around2010 the aircraft has reached its operational and technical limits. The replacement of the F-16is expected to take place in a time frame of 15 years (2010 –2025). The replacement of the F-16 is biggest NL material project ever, estimated at 10-12 billion guilders. For the acquitsitionof material the Defence Material Procurement Process (DMP) is used. This process consist offive phases:• DMP-A: determine the need• DMP-B: preliminary study phase• DMP-C: study-phase• DMP-D: acquisition preparation phase• DMP-E: evaluationFor the replacement of the F-16 the B and C phase are combined and this phase is almostcompleted. The reason that the B/C phase is done now, 10 years before introduction, is thatexperience learns that it takes 10 to 15 years to develop a new aircraft and that the RNLAFand the Dutch government is very interested in participating in the development of thereplacement of the F-16 (this was also the case with the F-16).
The following timetable gives a broad overview of the replacement F-16 project:Mid 1998: Masterplan for projectEnd 1998: Start of projectBeginning 1999: Develop evaluation structureBeginning 1999: Formulating Request For Information (RFI)
Sent out May 1999Answers due October 1999
End 1999: Start technical evaluationMid 2000: End of technical evaluation, followed by further assessment by
the RNLAFEnd 2000: B/C document formulated by RNLAF and presented to MOD
and government (still not presented to parliament for approval)
For the replacement of the F-16 there are 7 main decision criteria of which LCC is one. Othermain criteria are, for example, system effectiveness, risk and industrial participation. Thefollowing candidates were identified (through WEAG publication):• Eurofighter Typhoon (EUR)• Boeing F-18 E/F (USA)• Saab Gripen (SW) (No LCC data)• JSF (USA)• Dassault Rafale (FR)• Lockheed Martin F-16+ (USA)
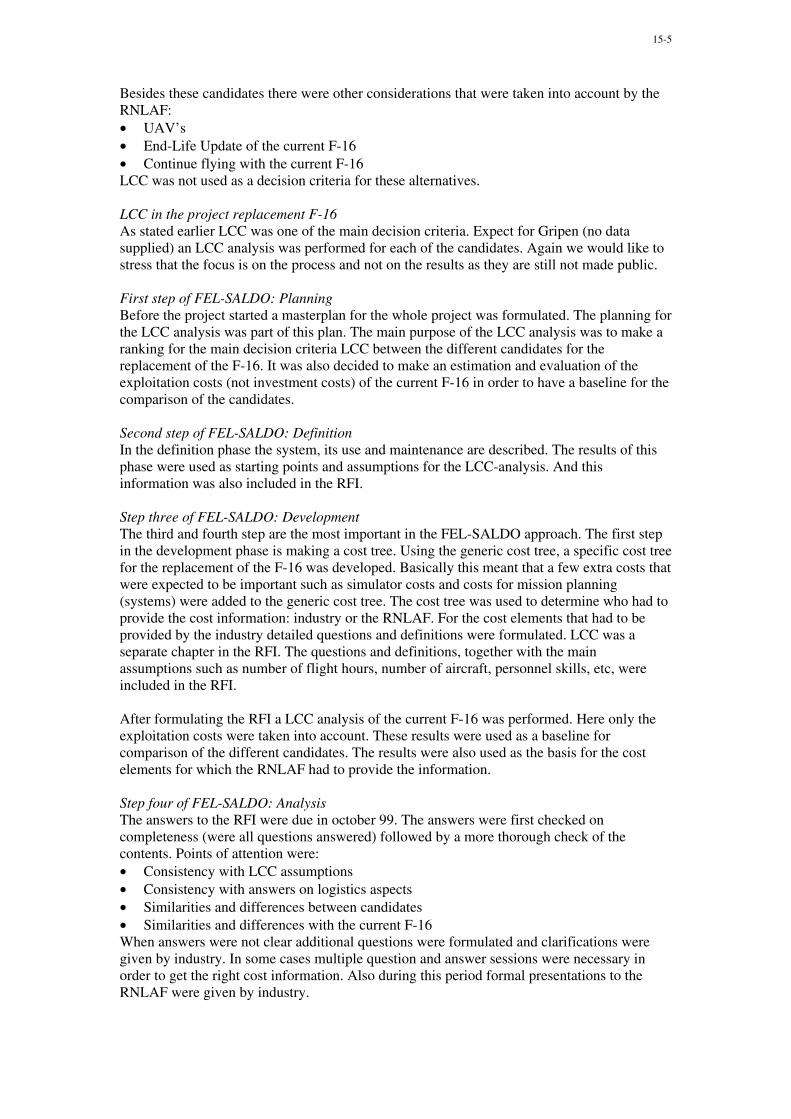
15-5
Besides these candidates there were other considerations that were taken into account by theRNLAF:• UAV’s• End-Life Update of the current F-16• Continue flying with the current F-16LCC was not used as a decision criteria for these alternatives.
LCC in the project replacement F-16As stated earlier LCC was one of the main decision criteria. Expect for Gripen (no datasupplied) an LCC analysis was performed for each of the candidates. Again we would like tostress that the focus is on the process and not on the results as they are still not made public.
First step of FEL-SALDO: PlanningBefore the project started a masterplan for the whole project was formulated. The planning forthe LCC analysis was part of this plan. The main purpose of the LCC analysis was to make aranking for the main decision criteria LCC between the different candidates for thereplacement of the F-16. It was also decided to make an estimation and evaluation of theexploitation costs (not investment costs) of the current F-16 in order to have a baseline for thecomparison of the candidates.
Second step of FEL-SALDO: DefinitionIn the definition phase the system, its use and maintenance are described. The results of thisphase were used as starting points and assumptions for the LCC-analysis. And thisinformation was also included in the RFI.
Step three of FEL-SALDO: DevelopmentThe third and fourth step are the most important in the FEL-SALDO approach. The first stepin the development phase is making a cost tree. Using the generic cost tree, a specific cost treefor the replacement of the F-16 was developed. Basically this meant that a few extra costs thatwere expected to be important such as simulator costs and costs for mission planning(systems) were added to the generic cost tree. The cost tree was used to determine who had toprovide the cost information: industry or the RNLAF. For the cost elements that had to beprovided by the industry detailed questions and definitions were formulated. LCC was aseparate chapter in the RFI. The questions and definitions, together with the mainassumptions such as number of flight hours, number of aircraft, personnel skills, etc, wereincluded in the RFI.
After formulating the RFI a LCC analysis of the current F-16 was performed. Here only theexploitation costs were taken into account. These results were used as a baseline forcomparison of the different candidates. The results were also used as the basis for the costelements for which the RNLAF had to provide the information.
Step four of FEL-SALDO: AnalysisThe answers to the RFI were due in october 99. The answers were first checked oncompleteness (were all questions answered) followed by a more thorough check of thecontents. Points of attention were:• Consistency with LCC assumptions• Consistency with answers on logistics aspects• Similarities and differences between candidates• Similarities and differences with the current F-16When answers were not clear additional questions were formulated and clarifications weregiven by industry. In some cases multiple question and answer sessions were necessary inorder to get the right cost information. Also during this period formal presentations to theRNLAF were given by industry.

15-6
In this process a lot of information on the different cost elements was gathered. Thisinformation was used to determine the values of different cost elements. For a number of costelements other experts were also consulted. The cost of fuel, based on flight hours andaverage fuel consumption per flight hour, for example were reviewed by experts on aircraftand jet engines. In a small number of cases information provided by industry were correctedor adjusted by the RNLAF. After filling in all the cost elements, the LCC of the differentcandidates were calculated.
In the whole process it became clear that the RNLAF and the various industries quite oftenused or interpreted the definitions of cost elements and information/data in a different way.The question and answer cycles reduced the misinterpretation a lot. To reducemisinterpretations as much as possible a final “verification” round was executed. The LCCproject team visited the different industries to verify the LCC analysis. In this verificationround the following things were done:1. Check on the documents provided by industry2. Show how the information on LCC was used in the LCC analysis3. Show where and when adjustments were made4. And finally show the results of the LCC analysis (the specific RNLAF information was
excluded form this LCC analysis)Also during this verification round the consistency between the configuration of the aircraft aspresented in the operational/technical information and the LCC information was checked. Themain reason for this was to make sure that the operational analysis and the LCC analysis wereperformed for the same aircraft.
As a result of this verification round a few minor adjustments were made the finaldetermination of the LCC was done.
Step five of FEL-SALDO: ReportWith the final analysis of the LCC ready it was time for the last step to make a report. Theresults of the LCC analysis were used by the RNLAF in their evaluation of the differentcandidates for the replacement of the F-16.
Current status replacement F-16 projectAt the end of last year the RNLAF wrote the DMP B/C document, containing their evaluationof the different candidates for the replacement of the F-16. Early 2001 this document waspresented to the MOD and the government. The MOD performed a formal validation of theevaluation and its results. So far the replacement of the F-16 has not yet been presented toparliament for approval.
Lessons learnedIn such a big project there were obviously a lot of lessons learned. There is however one biglesson that we would like to emphasize: You have to make sure that, in big and complexprojects like this, that the LCC projectteam and industry have to make sure they are talkingthe same (LCC) language. Using definitions and assumptions on LCC in general and onspecific cost elements helped only partially in achieving this. The things that helped most toestablish a clear understanding between the different parties were the formal presentations,the question and answer sessions and the verification round. This interaction between theRNLAF and industry created an atmosphere were mutual understanding on each othersapproach to LCC was achieved.

16-1
Application de modèles de coûts à un système de transmission
Marie-Pierre PezMinistère de la Défense
DGA/SPOTI26, boulevard Victor
00457 ArméesFrance
Emmanuel ArbaretierSociété SOFRETEN
10, avenue Entreprise Saint-Christophe95865 Cergy Saint-Christophe
France
Sébastien PierronSociété SOFRETEN
10, ave. de l’EntrepriseParc St. Christophe
95860 Cergy St-ChristopheFrance
1 RESUMECet article présente un cas d’utilisation de modèle de coûts dans le cadre d’un programme, où la notion dedéploiement d’un grand nombre de systèmes sur plusieurs années est prépondérante, et est allé jusqu’àimpacter l’organisation des études d’Analyse de Soutien Logistique : un premier concept SLI, initialisé lors dela fourniture du premier lot de systèmes et basé à la fois sur un profil d’emploi et une organisation de soutienétatiques donnés et sur des considérations globales du maître d’œuvre industriel en termes de disponibilité etde coût a donné lieu à des premières estimations de rechanges et de Maintien en Condition Opérationnel. Puis,à l’issue de la phase d’expérimentation terrain des premiers systèmes et, dans la perspective d’organisation dudéploiement du parc complet et d’évolution de l’organisation de soutien associées, des analyses dedisponibilité opérationnelle et de coût de soutien plus détaillées ont remis en question ces allocations initiales,et ont permis de réajuster les choix initiaux, dans une approche d’optimisation économique et d’Analyse deNiveaux de Réparation appliquée à la totalité du cycle de vie du système. Ce repositionnement des étudesASL sur l’ensemble de la fourniture industrielle a permis d’identifier des gisements d’économie importants.L’article aborde également l’importance du facteur humain dans le processus d’appropriation de modèles ASLcommuns par des partenaires ne partageant pas a priori les mêmes intérêts : donneur d’ordre étatique,utilisateur étatique et fournisseur industriel.
2 INTRODUCTION
Le programme Valorisation RITA engagé par l’armée de terre vise le remplacement du système detransmission RITA 1ère génération et consiste en le déploiement d’un réseau tactique de près de 250 stations detransmission. L’objet du programme a consisté à développer et mettre en œuvre les composantes de cettenouvelle génération nécessaires à la satisfaction des besoins exprimés par l’armée de terre.
La phase de production a débuté en 1997 et doit se poursuivre jusqu’en 2007, année qui marquera la fin de lalivraison à l’armée de terre du parc complet de stations Valorisation RITA. Ces stations seront livrées suivantun rythme de montée en charge progressive : le déploiement opérationnel, précédé d’une phased’expérimentation terrain d’une durée de 2 ans, a été initialisé fin 2000. La phase de production comprend laproduction du système principal et de son système de soutien : la livraison des premières stations a étéaccompagnée de la livraison de l’ensemble des moyens permettant à l’utilisateur de soutenir un parc de 100premières stations pendant les deux premières années de MCO.
Lors des études SLI concomitantes de l’ingénierie système de la phase de développement, l’industriel aproposé une politique de soutien et des évaluations globales de coût permettant d’ajuster les postes MCO des
Communication présentée lors du symposium RTO SAS sur les « Structures de coûts et coûts globaux de possession (LCC) pour systèmes militaires », organisé à Paris, France, du 24 au 25 octobre 2001, et éditée dans RTO-MP-096.

16-2
deux premières années; dans la perspective de livraison des stations complémentaires, la DGA a mis en œuvreune activité de modélisation et d’analyse de coût lui permettant de réactualiser les quantités de rechanges etles postes MCO évalués par l’industriel et concernant les années suivantes de l’ensemble du cycle de vie dusystème.
3 LE SLI ET LES ETUDES DE COÛTS DANS LE PROGRAMMEVALORITA
A l’issue des études d’ingénierie logistique qui lui étaient confiées dans le cadre de son contrat, l’industrielmaître d’œuvre a proposé un système de soutien optimisé où il avait procédé, entre autres, à une premièreattribution des niveaux de maintenance. Associé à ce système de soutien, une mise à jour du coût globalincluant l’enveloppe des coûts industriels correspondant au MCO sur la totalité du cycle de vie du système aété fournie par ce même industriel maître d’œuvre. Cette estimation « macroscopique » établie en début deprogramme devait servir de base au chiffrage du MCO long terme, faisant suite aux deux premières années demise en service.
Suite à l’initialisation de cette politique de soutien par l’industriel, la DGA a mis en place un partenariat avecles industriels et les utilisateurs étatiques, lui permettant de conduire une nouvelle optimisation de cettepolitique de soutien, tenant compte notamment de l’évolution de l’organisation de soutien de l’armée de terreassociée au déploiement du parc complet de stations.
L’engagement de ce processus SLI a conduit entre autres à la mise à jour des exigences relatives à :- la fourniture de données 1388-2B compatibles du système SIMAT (Système d’Information de
Maintenance de l’Armée de Terre) prenant en compte, entre autres, l’intégration des données deconception du système, afin de permettre l’optimisation de son soutien en utilisation : MTBF, tâches demaintenance, nombre de personnels affectés aux différentes tâches. A noter que l’obtention d’un retourd’expérience significatif sur les différents éléments du parc de systèmes devra néanmoins attendre uncertain nombre d’années.
- la mise en œuvre d’un système de gestion du ravitaillement compatible avec la norme AECMA 2000M
Dans le cadre de ce processus SLI, dont l’objectif majeur demeure la maîtrise des coûts et la recherche ducompromis optimal entre ce coût et le critère d’efficacité que constitue la disponibilité du système, desanalyses de coûts ont été conduites. Deux objectifs essentiels étaient visés dans le cadre de cette Analyse deSoutien complémentaire :- l’optimisation de la quantité de rechanges globale à déployer, en adoptant un critère d’optimisation
permettant d’éviter un surdimensionnement des stocks; à cet égard, la disponibilité opérationnelle dechaque système a été préférée à la probabilité de non rupture de stocks des différents articles,
- la prévision des dépenses futures de la DGA incluant en particulier l’allocation des différents budgets deMCO (Maintien en Condition Opérationnel) à négocier avec l’industriel et qui doivent s’échelonner surles années à venir.
Ces analyses ont été effectuées à partir de l’atelier de simulation « SIMLOG » (issu de l’atelier DIANA) de lasociété SOFRETEN, et ont nécessité la constitution de modèles concernant la description et la simulation desstations, de leur politique de soutien, et de la génération des coûts associés pendant la totalité de leur cycle devie. La méthodologie de réalisation de ces modèles, et leur contenu sont présentés aux paragraphes §4 et §5.
4 METHODOLOGIE UTILISEE POUR LA REALISATION DUMODELE DE COÛTS
La méthodologie de construction de modèles de coûts appliquée dans le cadre de ce programme peut êtreschématisée par un organigramme, telle que le montre la figure 1.Nous allons passer en revue chacune de ces étapes tout au long de ce paragraphe. Il faut également mentionnerla nécessité d’utilisation d’outils logiciels susceptibles d’aider l’analyste dans la construction et l’utilisation de

16-3
son modèle de coûts : ces outils assistent l'analyste dans toutes les étapes de conception de son modèle etpermettent de prendre en compte toutes les modifications qui pourraient être apportées au modèle. La figuresuivante met en évidence les différentes tâches qui permettront à l'analyste de mettre en œuvre laméthodologie de conception de modèles de coûts à partir du progiciel SIMLOG COST (distribué par la sociétéSOFRETEN) qui a également été utilisé dans le cadre de ce programme.
Etablir lesobjectifs
Définir leshypothèses
Développer l'Arbre deDécomposition des coûts
Ecrire les formulesde coût
Collecter lesdonnées
Analyste SIMLOG COST
Saisie du modèle dedonnées relationnelles
Saisie de l'arbre des coûts
Saisie des formules
Estimation descoûts
Exports desrésultats
Analyses, rapportsgraphiques...
Il faut garder à l’esprit que la génération d’un modèle de coûts doit s'appuyer sur une véritable modélisationdes systèmes opérationnels et du système de soutien associé, et non sur un simple modèle de donnéesrelationnel ne permettant pas de simuler ou d’évaluer l’ensemble des mécanismes (statiques ou dynamiques)décrivant ces deux systèmes (fonctionnement par rapport à une ou plusieurs missions opérationnelles requises,dysfonctionnements et défaillances, acheminement et mise à disposition des ressources logistiques...).
Les différentes phases pour la conception de notre modèle ont été les suivantes :
4.1 ETAPE 1 : identification des objectifsL'utilisateur doit identifier, formuler et définir les objectifs de l'étude qui nécessite le développement d'unmodèle de coûts. Suivant son utilisation, le modèle de coût aura des caractéristiques particulières. Ainsi, à toutmoment ces objectifs vont influencer :
• le choix des éléments de la base de donnée, le modèle relationnel de donnée,• la décomposition de l'arbre des coûts,• les formules d'estimation des coûts.
Dans notre cas, compte tenu notamment de l’avancement du programme au moment du lancement de l’étude,l’objectif premier était d’étudier les coûts liés à la maintenance, qu’elle soit préventive ou corrective. Lastructure des coûts a donc été définie en conséquence pour mettre en évidence ces différents paramètresinfluant sur le coût de soutien.

16-4
4.2 ETAPE 2 : définition des hypothèsesL'analyste doit identifier et adopter certaines hypothèses qui influencent le processus d'estimation du coût etqui permettent de mettre en place le modèle de données relationnelles. Ces hypothèses permettent de limiterl'analyse.Les hypothèses doivent être claires et validées. Pour ne citer que les plus importantes, nous avons considéréles hypothèses concernées par :
• le nombre total de systèmes à concevoir,• le taux de production du système et le programme de livraison,• le concept d’utilisation du système,• le concept de soutien logistique (stratégies de réparation niveaux de stocks requis, politique de
maintenance…),• la vie opérationnelle du système,• la mise au rebut en fin de vie du système.
4.3 ETAPE 3 : spécification de l’arbre des coûtsL'analyste de coût doit structurer et formaliser les éléments de coût à estimer. Pour cela, il développe un Arbrede Décomposition des Coûts (‘Cost Breakdown Structure’).Le but de cette structure arborescente a été de :
• prendre en considération tous les coûts• ne pas comptabiliser plusieurs fois le même coût.• rendre cohérents et définir clairement les éléments individuels de coût.
La structure de l’élément de coût a été organisée séquentiellement en quatre phases majeures du cycle de viedu programme, à savoir :
• l’acquisition (développement et production)• l’exploitation• le soutien• le retrait de service.
Certains coûts comme les ceux relatifs à l’acquisition du système représentent des coûts constatés, d’autrescomme les coûts de soutien et d’exploitation du système sont récurrents et ont été estimés à partir deshypothèses définies lors d’étape précédente.
4.4 ETAPE 4 : écriture des formules d'estimation du coût L’écriture des formules d’estimation du coût consiste en la spécification réelle du modèle de coût; elle peuts’envisager suivant deux axes pratiquement mis en œuvre en parallèle, à travers un processus interactif. Ils’agit :
• de la spécification du modèle de données relationnel sous-tendant le modèle de coûts• de la formalisation des liens logiques et analytiques (simples liens de dépendance logiques ou
formules opératoires permettant de déduire certaines données à partir de données déjàexistantes dont elles dépendent).
La spécification du modèle de données relationnel consiste en la description des structures de donnéesélémentaires et non-élementaires sous-tendant le modèle de coûts. Par exemple, les articles constituant lesystème Valorisation RITA, les sites (opérationnels ou de soutien) tout comme les personnels nécessaires à lamaintenance ou a l’exploitation, les équipements de test, la documentation, la formation sont des donnéesjouant un rôle privilégié dans l’étude de coûts qui a été menée. Les coûts liés à l’exploitation ont été associésaux sites opérationnels, ceux-ci regroupant l’ensemble des activités d’exploitation. D’autre part, les coûts liésà la maintenance du système ont été associés aux sites de maintenance, ceux-ci regroupant l’ensemble desactivités de maintenance.
L’écriture des formules de coût est spécifique à chaque modèle de coûts : on ne peut pas utiliser de modèlestandard pour des applications ou systèmes de nature différente. A travers ce type de tâche, on va retrouver lanotion de :
• loi physique ou plutôt ‘logistique’ qui introduit des points communs d’un modèle à l’autre• hypothèses financières• niveau de détail de précision du modèle
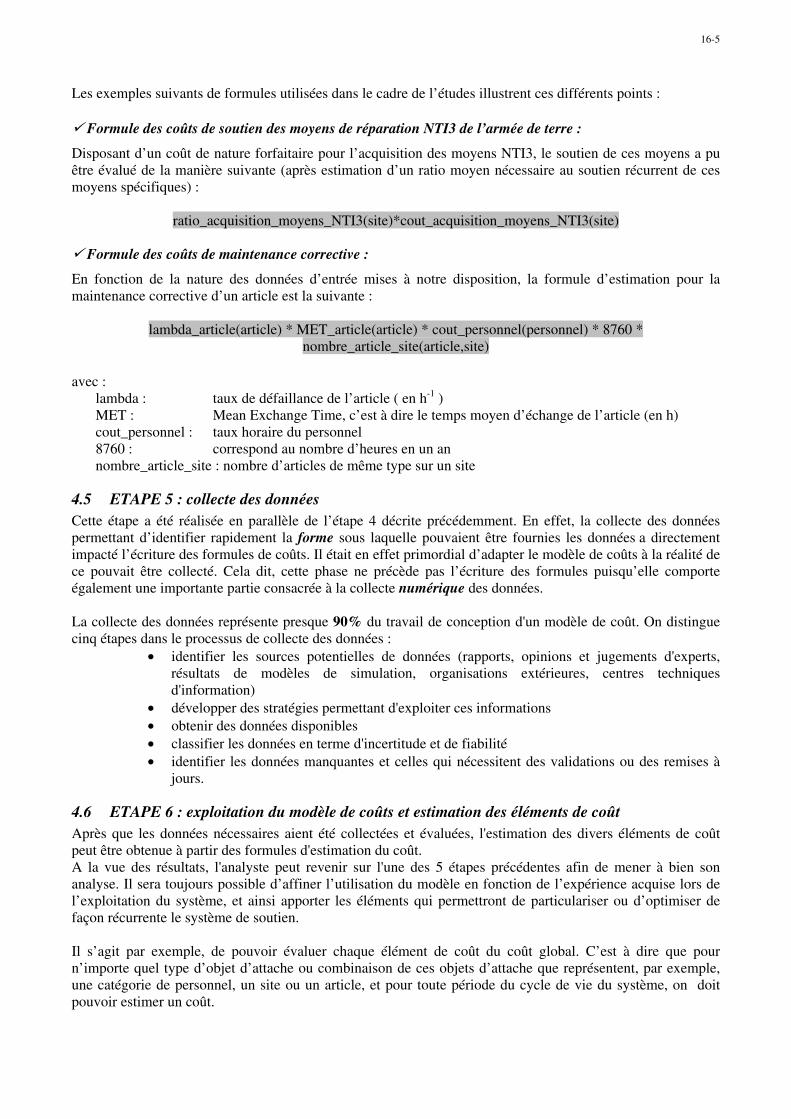
16-5
Les exemples suivants de formules utilisées dans le cadre de l’études illustrent ces différents points :
� Formule des coûts de soutien des moyens de réparation NTI3 de l’armée de terre :
Disposant d’un coût de nature forfaitaire pour l’acquisition des moyens NTI3, le soutien de ces moyens a puêtre évalué de la manière suivante (après estimation d’un ratio moyen nécessaire au soutien récurrent de cesmoyens spécifiques) :
ratio_acquisition_moyens_NTI3(site)*cout_acquisition_moyens_NTI3(site)
� Formule des coûts de maintenance corrective :
En fonction de la nature des données d’entrée mises à notre disposition, la formule d’estimation pour lamaintenance corrective d’un article est la suivante :
lambda_article(article) * MET_article(article) * cout_personnel(personnel) * 8760 *nombre_article_site(article,site)
avec :lambda : taux de défaillance de l’article ( en h-1 )MET : Mean Exchange Time, c’est à dire le temps moyen d’échange de l’article (en h)cout_personnel : taux horaire du personnel8760 : correspond au nombre d’heures en un annombre_article_site : nombre d’articles de même type sur un site
4.5 ETAPE 5 : collecte des donnéesCette étape a été réalisée en parallèle de l’étape 4 décrite précédemment. En effet, la collecte des donnéespermettant d’identifier rapidement la forme sous laquelle pouvaient être fournies les données a directementimpacté l’écriture des formules de coûts. Il était en effet primordial d’adapter le modèle de coûts à la réalité dece pouvait être collecté. Cela dit, cette phase ne précède pas l’écriture des formules puisqu’elle comporteégalement une importante partie consacrée à la collecte numérique des données.
La collecte des données représente presque 90% du travail de conception d'un modèle de coût. On distinguecinq étapes dans le processus de collecte des données :
• identifier les sources potentielles de données (rapports, opinions et jugements d'experts,résultats de modèles de simulation, organisations extérieures, centres techniquesd'information)
• développer des stratégies permettant d'exploiter ces informations• obtenir des données disponibles• classifier les données en terme d'incertitude et de fiabilité• identifier les données manquantes et celles qui nécessitent des validations ou des remises à
jours.
4.6 ETAPE 6 : exploitation du modèle de coûts et estimation des éléments de coûtAprès que les données nécessaires aient été collectées et évaluées, l'estimation des divers éléments de coûtpeut être obtenue à partir des formules d'estimation du coût.A la vue des résultats, l'analyste peut revenir sur l'une des 5 étapes précédentes afin de mener à bien sonanalyse. Il sera toujours possible d’affiner l’utilisation du modèle en fonction de l’expérience acquise lors del’exploitation du système, et ainsi apporter les éléments qui permettront de particulariser ou d’optimiser defaçon récurrente le système de soutien.
Il s’agit par exemple, de pouvoir évaluer chaque élément de coût du coût global. C’est à dire que pourn’importe quel type d’objet d’attache ou combinaison de ces objets d’attache que représentent, par exemple,une catégorie de personnel, un site ou un article, et pour toute période du cycle de vie du système, on doitpouvoir estimer un coût.
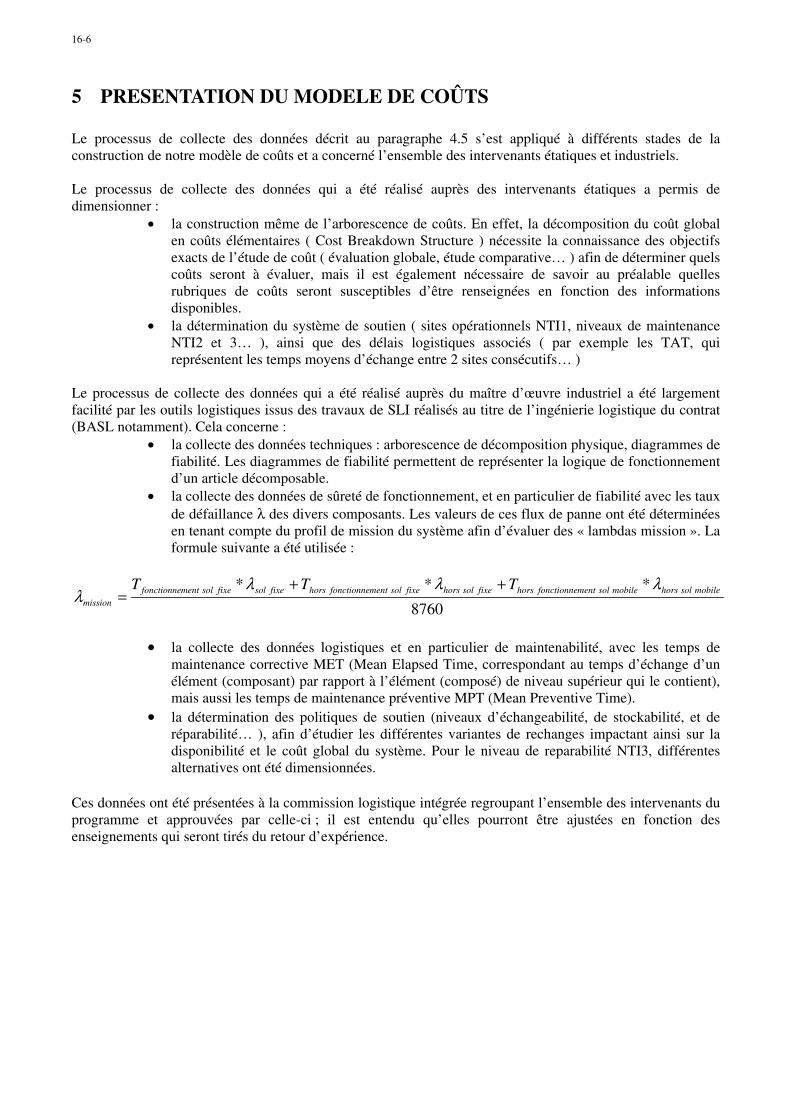
16-6
5 PRESENTATION DU MODELE DE COÛTS
Le processus de collecte des données décrit au paragraphe 4.5 s’est appliqué à différents stades de laconstruction de notre modèle de coûts et a concerné l’ensemble des intervenants étatiques et industriels.
Le processus de collecte des données qui a été réalisé auprès des intervenants étatiques a permis dedimensionner :
• la construction même de l’arborescence de coûts. En effet, la décomposition du coût globalen coûts élémentaires ( Cost Breakdown Structure ) nécessite la connaissance des objectifsexacts de l’étude de coût ( évaluation globale, étude comparative… ) afin de déterminer quelscoûts seront à évaluer, mais il est également nécessaire de savoir au préalable quellesrubriques de coûts seront susceptibles d’être renseignées en fonction des informationsdisponibles.
• la détermination du système de soutien ( sites opérationnels NTI1, niveaux de maintenanceNTI2 et 3… ), ainsi que des délais logistiques associés ( par exemple les TAT, quireprésentent les temps moyens d’échange entre 2 sites consécutifs… )
Le processus de collecte des données qui a été réalisé auprès du maître d’œuvre industriel a été largementfacilité par les outils logistiques issus des travaux de SLI réalisés au titre de l’ingénierie logistique du contrat(BASL notamment). Cela concerne :
• la collecte des données techniques : arborescence de décomposition physique, diagrammes defiabilité. Les diagrammes de fiabilité permettent de représenter la logique de fonctionnementd’un article décomposable.
• la collecte des données de sûreté de fonctionnement, et en particulier de fiabilité avec les tauxde défaillance λ des divers composants. Les valeurs de ces flux de panne ont été déterminéesen tenant compte du profil de mission du système afin d’évaluer des « lambdas mission ». Laformule suivante a été utilisée :
8760
*** mobilesolhorsmobilesolmentfonctionnehorsfixesolhorsfixesolmentfonctionnehorsfixesolfixesolmentfonctionnemission
TTT λλλλ
++=
• la collecte des données logistiques et en particulier de maintenabilité, avec les temps demaintenance corrective MET (Mean Elapsed Time, correspondant au temps d’échange d’unélément (composant) par rapport à l’élément (composé) de niveau supérieur qui le contient),mais aussi les temps de maintenance préventive MPT (Mean Preventive Time).
• la détermination des politiques de soutien (niveaux d’échangeabilité, de stockabilité, et deréparabilité… ), afin d’étudier les différentes variantes de rechanges impactant ainsi sur ladisponibilité et le coût global du système. Pour le niveau de reparabilité NTI3, différentesalternatives ont été dimensionnées.
Ces données ont été présentées à la commission logistique intégrée regroupant l’ensemble des intervenants duprogramme et approuvées par celle-ci ; il est entendu qu’elles pourront être ajustées en fonction desenseignements qui seront tirés du retour d’expérience.

16-7
En ce qui concerne l’arborescence de coûts, la décomposition du coût global jusqu’au troisième niveau decoûts est décrite sur le schéma suivant :
Cost Breakdown Structure
Recherche et développement
Logistique initiale
Système principal
Acquisition
Maintenance
Soutien exploitation
Soutien infrastructures
Transport
Instruction ESAM
Mise à jour de la documentation
Soutien des moyens de soutien
Soutien
Personnel exploitation
Instruction ESAT
Fluides exploitation
Exploitation
Retrait de service
Coût global
Pour certaines rubriques de coûts, l’évaluation a tenu compte du planning d’approvisionnement de certainsmatériels et en particulier des dates d’acquisition des différentes stations décrites selon un échéancierparticulier. En effet, l’ensemble des rubriques dépendant intrinsèquement du nombre de stations doit intégrerdans les formules de coûts certaines données permettant de traduire le déploiement d’acquisition de cesstations, traduisant ainsi la montée en puissance des coûts liés à l’acquisition du matériel.
D’autre part, cette projection du coût global sur l’axe des temps peut également être effectuée par rapport àd’autres critères de dépendance tels que les sites, les catégories de personnel…Ces différentes évaluations ontpour but d’expliquer les premières constatations obtenues par l’analyse globale, mais également de détecterdes tendances, des valeurs de coûts marginales par rapport à certains axes d’étude et conduire à uneoptimisation toujours itérative du système de soutien.
16-8
6 PREMIERS ENSEIGNEMENTS ISSUS DE LA REALISATION ET DEL’EXPLOITATION DES MODELES DE COÛTS
La réalisation de ces modèles a privilégié un point de vue technique, à travers la déclinaison du concept demaintenance vis à vis des différentes composantes du soutien : le modèle de coûts obtenu traduira donc plusune représentation comptable du cycle de vie du système, en termes de flux de coûts générés, qu’unesimulation contractuelle des différents lots de MCO tels que facturés par l’industriel et amortis financièrementpar la DGA. C’est dans une phase ultérieure de collaboration entre l’adjoint logistique de programme etl’acheteur en charge des contrats MCO vis à vis des industriels, que ce modèle de coûts pourra être traduit enmodèle de planification et de gestion financière.
La mise au point de ces modèles a nécessité le recueil d’informations techniques, organisationnelles etéconomiques qui s’est effectué tout au long du programme au sein de groupes de travail mixtes, réunis par laDGA, et rassemblant à la fois les industriels et les utilisateurs étatiques. Aucune contrainte de type budgétairen’a été ressentie, aussi bien du côté industriel que du côté étatique; tout au plus certaines contraintes afférantau plan de charge des industriels, ont pu être à l’origine de quelques difficultés d’organisation des groupes detravail.
En fait, les données économiques recueillies dans le cadre de ces groupes de travail ont été fournies en grandepartie par les industriels, les utilisateurs étatiques ayant un point de vue plus technique que financier. Il s’avèredonc encore nécessaire de sensibiliser les étatiques à fournir ces données économiques concernant parexemple les taux horaires, les coûts de transfert, les bancs de maintenance, ou encore les règlesd’amortissement proportionnel des différents types d’infrastructures (sites de stockage, ateliers demaintenance…). Ces dernières informations sont par ailleurs d’autant plus difficiles à identifier, qu’ellesimpliquent la connaissance des différents organismes qui partagent l’utilisation de ces infrastructures avec leprogramme, ainsi que la manière dont ils les utilisent : il s’agit alors de rentrer véritablement dans les règlesde fonctionnement organisationnelles et financières de ces organismes, ainsi que dans leur logiqued’imputation et d’amortissement proportionnel des différents programmes pour lesquels ils travaillent.
La modélisation des coûts de maintenance liés aux différents niveaux d’intervention a fait l’objet de difficultésdifférenciées : pour le NTI3, les approches ont été déclinées à partir d’ études amonts ; pour les rubriquesregroupant les coûts générés par le soutien des équipements de soutien, une approche sous forme de ratiosd’expérience a été adoptée, ce qui traduit d’un point de vue méthodologique la nécessité d’adapter lesformules d’évaluation au niveau de granularité des informations élémentaires susceptibles d’être recueillies.
Seulement un nombre limité d’hypothèses de prise en charge du NTI3 a été pris en compte :- prise en charge par l’étatique,- prise en charge par l’industriel,- hypothèse mixte : en fonction de la tâche, en fonction de l’année, prise en charge par l’étatique ou
l’industriel.
Cette limitation est atténuée par le fait que des analyses de sensibilité pourront être appliquées à la dernièrehypothèse, en faisant varier le type de tâche affecté à l’industriel ou à l’étatique, ainsi que le planning despériodes de prise en charge du niveau NTI3 par l’industriel ou l’étatique.Le niveau de maturité des industriels vis à vis des méthodologies de type SLI n’a pas posé de problème : dansle cadre de ce programme, la DGA n’avait à faire qu’avec un interlocuteur industriel, le Maître d‘ Œuvre,impliqué depuis longtemps dans des processus SLI, et rompu à ses différentes techniques d’analyse.
Des limitations quant à la connaissance précise des évolutions techniques à termes du système et de samaintenance ont rendu difficile l’extrapolation détaillée du cycle de vie de vingt ans auquel devait seconformer le modèle de coût : en effet, durant la totalité de ces vingt ans, de nombreux événements techniquessont susceptibles de se produire :- rétrofit des stations,- évolution des moyens de maintenance et des coûts associés,- portage majeur tous les 6 ou 7 ans.
16-9
Néanmoins, cette dernière hypothèse, a été prise en compte dans l’un des cas de figure de LORA envisagé desous-traitance intégrale de maintenance NTI3 à l’industriel.
En outre, au niveau des calculs de rechanges, les objectifs de disponibilité opérationnelle par station ont étéconsidérés comme constants sur toutes les années du cycle de vie. Il est à envisager qu’un ou plusieurs autressystèmes de transmission viendront seconder le système étudié sur la fin de son cycle de vie, et que lesobjectifs de disponibilité opérationnelle pourront être moins exigeants sur cette période.
Enfin, « last but not least », le facteur humain a paru être l’enjeu principal de réussite des groupes de travailimpliquant conjointement la DGA, les étatiques et surtout les industriels. Il a par exemple toujours été clairque l’un des objectifs de l’exploitation des informations fournies par les utilisateurs étatiques et industriels ausein de ces groupes consistait, entre autres, en l’optimisation du nombre de rechanges dans un environnementde soutien en évolution. Cet objectif, en contradiction avec les intérêts industriels, et souvent décrié par lesutilisateurs étatiques, illustre un des nombreux motifs de réserves invoqués à propos de l’organisation de cesgroupes de travail: la difficulté de concilier des intérêts contradictoires.En fait, la clé du succès de ces groupes de travail réside en un véritable effort de communication permettantaux industriels de s’approprier la logique « gagnant – gagnant » de ce type de partenariat : c’est la seulecondition pour obtenir une attitude transparente et constructrice à travers une logique de coopération encomplète synergie ; c’est l’occasion pour la DGA de véritablement optimiser l’utilisation de ses ressourceshumaines, techniques, et financières. Quant à l’industriel, c’est l’opportunité d’identifier de nouveauxgisements de profits, basés sur une prise en charge sélective et efficiente d’éléments de soutien du client,identifiés dans le cadre d’analyses conjointes, et anticipant les aléas coûteux du cycle de vie.
7 CONCLUSION
Les pilotes de coûts (« cost drivers »), identifiés dans le cadre de ce programme, ont été les suivants:• dotation initiale de rechanges,• maintenance NTI1,• maintenance NTI2,• maintenance NTI3,• maintenance préventive,• soutien des moyens de soutien.
Afin d’introduire une véritable dynamique d’optimisation de ces éléments de coût de soutien, il a éténécessaire de veiller attentivement à :
• l’obtention de la fiabilité intrinsèque de chaque équipement,• une estimation réaliste des différents délais de transport et de réparation,• l’optimisation de l’organisation logistique à travers la mise en commun des ressources et
l’attribution des niveaux de réparations, article par article,• l’allocation des informations élémentaires de coûts.
Mais plus que des difficultés purement techniques qu’il est finalement toujours possible de traiter, soit àtravers une connaissance précise des informations, soit à travers des démarches d’allocations ou encore paranalogie ou exploitation d’un retour d’expérience, c’est l’instauration d’une véritable logique de partenariatMCO avec des industriels et des utilisateurs étatiques, basée sur une stratégie « gagnant-gagnant » etpermettant des analyses LORA élaborées, qui constitue le véritable enjeu de la démarche de SoutienLogistique Intégré.

This page has been deliberately left blank
Page intentionnellement blanche

17-1
Monolith Composite Structures - Trend for CreationLow Life Cycle Cost Airframes
Nodar W. Pkhaladze, and Giorgi O. RusiashviliFlight Problems R&D Society of Georgia
380060, Gamsakhurdia ave. 28, Tbilisi, Georgia
E-mail: [email protected]; [email protected]
ABSTRACT
Principles of creation Low Life Cycle Cost monolith integral composite airframes for
military application by new technological approach are presented. New technological
approach including airframe fabrication in whole opening self-heating press from by Resin
Film Infusion process is offered. Typical technological process including the operations
and transitions are described. Impact of new technological approach to design principles is
discussed. Bases of Low Life Cycle Cost economical analysis for creation airframes by
high technological efficiency are presented. Recent achievements enabling performing of
new technological approach are summarized.
KEYWORDS: Low Life Cycle Cost, Monolith Integral Composite Airframe, Resin Film
Infusion, Self Heating Press form.
INTRODUCTION
Since the 50th, when organic composite materials were originally used in warship
construction, material manufacturers got enough experience in developing resin matrix
and fiber components with high mechanical properties, durability and damage tolerance
characteristic. Main reason, which serves for widest application of organic composite in
aircraft manufacturing till recently was an excellent specific weight ratio of airframe
structures. Now, after significant establishment of composite in aircraft manufacturing
(40-70 % of structural weight of combat aircraft and rotorcraft, 20-40% of commercial and
transport planes, and nearly 100% new generation general aviation aircrafts), the material
suppliers and aircraft designers and manufacturers have to solve the following very
important problems:
How to reduce material costs and develop the new perfect structures and manufacturing
technologies using which will be possible an output of Low Life Cycle Cost airframes?
Paper presented at the RTO SAS Symposium on “Cost Structure and Life Cycle Cost (LCC) for Military Systems”, held in Paris, France, 24-25 October 2001, and published in RTO-MP-096.

17-2
One of main direction of them is to achieve of large-scale integration of airframes
components till to develop of monolithic structures by combination of manufacturing and
assembly works. Fortunately, such of opportunity gives composite, because composite
materials are produced at the same time as the piece and gives possibility easy produce
large structures with complex geometry and modify locally their properties by choose with
the composition of the materials. Furthermore, special nature of composite structures
makes permissible to insert any other functional elements into structures at the same time
of processing of airframes. Therefore, we will look in nearest future the new advanced
technology and design development by with market will revise the perfect low cost
composite airframes.
TASK AND APPROACH
Targeted to development Low Life Cycle Cost airframes manufacturing technology for
military application special emphasis would be lay on hardly estimated links between
structural and fabrication features of airframes and economical benefits, which potentially
will be achieved by application of some of solution in order of serial manufacturing. Low
Life Cycle Cost mainly means Low Cost fabrication technology, because most of expenses
spended on design, manufacturing and utilisation phases of life cycle of aircraft takes
manufacturing phase and it is nearly 80% of total. As for manufacturing phases,
approximately depending on process used, carbon fiber epoxy resin composite structures
takes about 10% of the final cost, 40% gives material costs and 50% fabrication
technology. Therefore, aviation industry is in need of cheep composite materials
compatible with simple and cheep processing. Present paper discuses a direction of
development simple and inexpensive manufacturing processes linked with airframe
specific design.
The main questions, to be solved in order to develop such technology are:
1. To provide low cost serial manufacturing of high performance airframes of air vehicles;
2. To obtain whole compositional sandwich type, metal framework, foam filling in,
integral shell by laying up fiber cloth in disconnection negative press form (mould);
3. To achieve high accuracy reproduction of airfoil shell (forms and dimensions);
4. To ensure high quality of airfoil shell surface;
5. To obtain light firm structure of high air flexibility, vibration and thermal insulation,
fatigue resource;

17-3
6. To integrate in onetime technological cycle the manufacturing and assembling works;
7. To minimize the technological, construction and operational casing joint by its
unification.
To achieve the objectives above mentioned, sandwich type, monolithic integral shell
carrier structure with built in metal framework for airframes is offered; Also for
manufacturing of those airframes, special structure press-form (mould) with built in
heating devises for providing polymerization process of carbon-epoxy pesin composite by
using Resin Film Infusion Technology and pneumatic bag methods is offered.
The results are elaboration of generic technological process and technological equipment
for serial production of sandwich type, integral, high quality, light airframes of air vehicles
by laying up fiber cloth in disconnecting press forms.
One of the most important directions ensuring low costs high reliable and greater
resources for airfoil shell of light apparatus by minimum weight is making monolithic
design with minimum constructive, technological and operational disjoin by using
advanced constructive materials, specifically compositional materials, type glass or carbon
fibers. Framework uses traditional metal materials type of aluminum or titanium.
The proposal of technological process for making outwardly and inwardly shell of glass or
carbon fiber laid up in moulds with epoxy resin gives possibility for making a monolithic
construction of high precision and high-quality surface three layer whole-compositional
sandwich shell, with the high quality of air flexibility, vibration, noise and thermal
insulation. It is characterized by high quality energy dissipation, effective, minimum
technological disjoin and minimum weight.
Essence of the technology consists in forming double-skinned glass-fiber integral airframe
sandwich construction with built-in metal framework in the disjoined negative mould, cut-
off that corresponds to the perimeter (periphery) of the apparatus in the plan.
BASIC ECONOMICAL ANALYSIS
As known, economical effectiveness of flying apparatus namely airplanes as transport
vehicles maybe shown by equation:
E=Cf/Ce=(VxGcxR)Co/(C1+C2+C3) (1)
17-4
where,
Cf- incomes on full term of exploitation of airplanes, USD;
Ce- total expenses on airplanes, USD;
V-an average velocity of airplanes, km/hr;
Gc- commercial load, tm;
R- technical resource of airplanes, hr;
Co - price for transportation USD/tm*km;
C1-expenses on design and development of experimental (pioneer) airplanes divided on
the number of manufactured airplanes (N), USD;
C2-an average expenses for manufacturing of serial airplanes, USD;
C3-an average total expenses for exploitation and repair (maintenance) of airplanes on full
term of exploitation, USD.
If admit, that C1 and C3 compose an about at 10% of each in total expenses, then becomes
clear, that important role plays upgrading of technological efficiency of serial fabrication
processes of aircraft, i.e. decrease of manufacturing expenses (denominator) in order of
constant meaning of numerator.
As it is known economical efficiency of technological processes besides of others could be
assessed by three enlarged parameters, which are:
1) Level of labor productivity,
2) Level of self cost of the production,
3) Efficiency of investments.
In the present paper will be discussed the approach to improving these meanings of
efficiency of production of the airframe of flying apparatus from glass or carbide
composite materials on the basis of new approach of creation of bases of technological
process and relating methods of construction. The idea of the latter is in the maximally
possible enlargement of aggregates of integral airframe till to creation of wholly
monolithic composite shell and its production in one technological process by using a few
operations and transitions.
All above indicated three enlarged parameters are functions of quantity of produced units,
as increasing of volume of production enable introduction modern methods of production
and maximally mechanize and automatize the process of production. Taking into account
the fact that some types of military aviation products could be manufactured with high
serially it could be concluded that increasing of the integrity and monolith of aggregates

17-5
(parts) of airframe would lead to decreasing of total technological cost of unit, which
could be expressed by the following equilibrium:
Ct=Cm+Cw+Cue+Cse/N+H (2)
where,
Cm – cost of materials, used on manufacturing of unit, USD;
Cw – salaries and wages of labor on manufacturing of unit, USD;
Cue – expenses on depreciation of universal technological equipment, USD;
Cse – expenses on depreciation of specific technological equipment, USD;
N- number of manufactured units;
H – all contingencies related to realization of technological process, USD.
Analyzing equilibrium (2) it could be concluded that the main component with decreasing
of which it is possible to decrease the technological cost is:
Cm – expenses on used and procured materials, decreasing of which ceteris paribus could
be achieved by reducing of wastage at fabrication of composite airframes by innovative
technological techniques. It is noteworthy to mention that wastage in some cases is about
50% and more.
Cw – reducing of expenses on salaries and wages workers within the production could be
achieved by means mechanization and automotization of technological processes of
production of airplanes and by using the special technological equipment, which always
proves and refunds itself in the case of serial production of units. Consequently,
decreasing of Cw directly is linked to relation Cse/N in the equilibrium (2). Increasing of
volume of production N till several thousand units leads the necessity to create the special
technological equipment for serial production of airframes of flying apparatus. In such
cases the issue of designing of integral airframes with minimal disjunctions becomes the
drastic factor of providing the minimal technological cost of unit. In such cases unifying of
structuring technological and operational disjunctions could become the main mean of
reducing of quantity of technological equipment for serial manufacturing of airframes till
several units, which ultimately will serve for decreasing of technological cost of serial N.

17-6
TYPICAL TECHNOLOGICAL PROCESS
Typical technological process fabrication of integral monolithic airframes includes the
following operations and transitions:
1. Lay up of fabric on lower negative semi press form;
2. Set up of metal framework into lower negative semi press form and its positioning
upon basis point;
3. Set up of pneumatic bag into metal framework;
4. Lay up of fabric on the metal framework and pneumatic bag;
5. Set up of upper negative semi press form on the lower;
6. Pneumatic bag inflation and fabric on the press form wall application;
7. Curing processes.
It includes the following works and operations:
• Making master-model of airfoil shell.
• Making the negative semi-forms airfoil shell on master-model.
• Lay up of glass-fiber shell on the outwardly negative semi press form.
• Curing in the outwardly negative press form glass-fiber cloth shell using bag-molding
technology.
• Preparing outwardly negative semi press form for setting in the metal framework and
positioning the framework with found upon basis point.
• Join outwardly airfoil shell with metal framework.
• Making internal shell in positive press form with glass-fiber cloth laid up with epoxy
resin.
• Setting up of the finished inwardly shell into negative press from on the joined airfoil
shell and metal framework on the basis point with glue and mechanical fixation.
• Forming of the constructive, technological and operating disjoin.
• Preparing lower and upper negative semi-form of airfoil shell for conjunction.
• Setting up of pneumatic bag in internal cavity of airfoil shell.
• Connection of lower and upper semi-forms of airfoil shell.
• Completion of gluing process.
• Opening of negative semi-forms and withdrawal monolithic whole-compositional
airfoil shell.
• Receiving with positive press-forms wing and fuselage fuel tanks shells.

17-7
• Completion and join the finished wing and fuel tanks shell with semi wing and
fuselage.
• Fill the space between and outwardly shells with light inert filler, for example with
foam plastic.
• Out the excess, reduce work and inspection.
• Painting of finished whole-compositional airfoil shell.
• Final inspection
IMPACT TO DESIGN PRINCIPLES
The main direction of creation of LLCC from designing point of view is development of
airframes with maximum volume efficiency. This stipulates the maximal meaning of
correlation of volume V of the airframe to the surface S of the same airframe. Because of
the weight of compositional airframe by the major part is function direct proportional Sx∆,
where ∆ is the average 'weight thickness' of the airframe. Increasing of volume efficiency
stipulates increasing of weighting efficiency, and from this point of view it could be
considered the new principle pre-feasibility study when the initial main parameter is
volume but not weight of useful loading. Determining the configuration of useful volume
under sizes of useful loading and knowing its total mass we could start determining the
main designing parameters of flying apparatus. For relatively small and light apparatus
with weight 500-1000 kg it would be necessary to use the approach described above. We
could assume that this kind of apparatus will be enlargement of lifting body with the small
control surfaces included in adapting system of control. As a rule, lifting bodies present
itself integral bodies, which are suitable for the mentioned fabrication principle of latter in
to disjunction press forms using pneumatic bag method.
In the given approach the metallic framework in the structure of the airframe is carrier of
both main-loading function leaving for composites secondary and in some meaning also
primarily function, but is carrier also technological function, which means that in the
process of the manufacturing of the airframe serves as framework, mach, cell on which is
laying liner for further curing process. The approach to designing of metal frameworks
giving possibility to realize the following principles: all or almost all elements should
perform load function as well as free-edge-disjoin function for structural and operational
disjoining and moving elements, for instance the loading should mainly on metallic
elements of frames of doors and hatches. Their structure should involve the following
functions: loading, envisaging transmission of main loading; technological, envisaging
two technological functions: 1) joining-technological function, envisaging forming of

17-8
free edge of composite-metal coupling and; 2) assembling-technological, envisaging
function of frame (bench) holding of layer until inflation of pneumatic bag and
compressing to the wall of press form before polymerization and structural and operational
targeting main function. Multi functionality of structural elements of structure of loading
framework enables significantly reducing weight and manufacturing cost.
One of the important questions to be solved in order to develop manufacturing technology
of integral airframes is the study the behavior of Metal-Composite Coupling (MCC) into
functional elements of airframes. Such MCC is common on structural and operational
disjoints such as doors, hatch's etc., and in case of constructing metal-join-composite-
structure combination which are necessary for provision of moving connections of units,
such as main and bow legs, rudders etc., and to fixation of immovable units, such as
engines, equipment's etc.
As a rule, such of MCC represents heavy loaded structural elements of airframes and
perhaps its fatigue strength defines general recourses of airframes. That is why a careful
study and development of high reliable MCC is an important search problem to create the
perfect integral airframes.
The different properties of the metals and composites, particularly homogeneity and
isotropy, impact viscosity, electrical conductivity, corrosiveness and especially coefficient
of thermal expansion, dictate a special design approach and proper fabrication techniques
of metal-composite coupling. In this point of view more importantly seems choice of
cohesion surface features of them.
There must be distinguished two variants of choice of MCC design. First, when into
composite was inserted relatively small metallic particles and second, when we have a
complex metallic framework into composite is incorporated. In first case, we need only to
gave to metallic contact surfaces much more cohesive properties because absolute thermal
dimension change in this case is negligibly small. But in second cases especially when we
acted with a large 3D complex structures the feature of Metal-Composite Coupling design
must be chosen by foreseen of the fact that absolute thermal dimension (both working and
technological) change may be sufficient for origin large internal tenses in MCC.
Therefore, an appropriate computer modeling and trial methods should be experienced and
developed in order to be assured that chosen design features of MCC are valid and fatigue
resistance of MCC have a necessary level attained.
17-9
TECHNOLOGY AFFORDABILITY
What kind of 50 years composite materials experience and technological achievement
should be serve for implementation of Low Cost manufacturing technology proposed?
From material aspect there are a significant achievements in the increasing of carbon fiber
thickness with acceptable mechanical properties (i.e. tensile modulus, tensile strength,
elongation, etc.), weight and purchasing costs. Introduction of resin film made possible to
exploit Resin Film Infusion (RFI) process for large structural parts manufacturing
technology. Non Crimp Fabric (NCF) layers gives opportunity to lay up of part with hard
surface complexity.
The manufacturing effort to develop an inovative semipreg technology which consists in
recovering a thick dry fiber tape with a thick resin film made possible to manipulate only
one intermediate resin - fiber product. Although this new technology needs some work to
be technicaly validated, such achievement is hardly overestimated. Another modern
specific materials, such as antiadhesires, laminates, surface mats etc. also serve to solve
the important problems of monolithic composite airframes manufacturing.
Therefore, we could say that there are no more dimension limitations in monolithic
airframe processing and further composite material development should be focused on
upgrading of its characteristic.
As for process aspect, there are no doubts, that use of special self heating large press
forms- moulds for monolithic composite airframes fabrication instead of large mould -
large autoclave techniques is the factor of cost reducing. Application of disconnection
negative press-form cut off which corresponds to the perimeter of the apparatus in the plan
coupling with pneumatic bag installation inside and special care techniques to eliminate all
of the air from mould after hand lay up and closing of press-form make possible to handle
polymerization (cure) process with convenient tolerance band in parameters and serve to
improve the level of reliability delivering of ready airframes without of off-size, off-grade
and without of wastage. Creation of predictable and reproductionable technology is main
advantages of proposed processes.
Materials, equipments, techniques and technology, counted above coupled with another
know-how, gives possibility to create a truly perfect low life cycle cost carbon fiber-epoxy
resin composite airframes as sandwich type monolithic integral shell with built in metal
framework.

17-10
SUMMARY
The development and creation perfect Low Life Cycle Cost composite airframes closely
linked with application of monolithic integral shell fabrication techniques and processes.
Design step Integration of structural parts to whole monolithic airframes and development
of suitable equipment for its manufacturing is one of the main directions of decreasing
manufacturing cost. The proposed design and technological approach is equally applicable
both to civil and military aircraft airframes production. Principles offered give possibility
to designers and manufacturers to use it as further tool in developing a truly Low Life
Cycle Cost composite monolithic airframes, that may not have been feasible otherwise
with common methods.
Flight Problem Research and Development Society of Georgia hopes to break 10 years
isolation and extend the technology and collaborative base with worldwide scientific
community for close integration in appropriate works.
BIBLIOGRAPHY
1. Vigdorchik C.A.-Technological basic of design and drawing of aircraft. Moscow,
MAI, 1974
2. Gorbunov M.H.-Basic of fabrication technology of aircraft, Moscow, Mashinostroenie,
1976
3. Avduevski V.C,Ishlinski A.I.,Obrazcov U. F.-Scientifical basic of advanced
techniques and technologies. Moscow, Mashinostroenie 1985.
4. Gimmellfarb A.L- Basic of design in aircraftbuilding. Moscow, Mashinostroenie, 1980
5. Pkhaladze N.W.-Research of the technological process and development the
technological equipment for making whole compositional airfoil shell of light flying
apparatus with built in metal framework. NATO RTO AVT panel spring symposium
and specialists meeting. Braunshweig, Germany, 2000
6. Pkhaladze N.W.-Biplane. Invention #3007 GE. The Georgian National Center of the
Intellectual Property "Sakpatenti" 2000.
7. Bauer I. -Increasing productivity in composite manufacturing. NATO RTO AVT Panel
spring symposium and specialists' meeting Loen, NORWAY, 2001.
8. Wood G., Petrescue L., Jonston A. - Design and certification of a Vacuum –Assisted
Resin Transfer Moulded Composite Seaplane Float. NATO RTO AVT Panel spring
symposium and specialists' meeting Loen, NORWAY, 2001.

17-11
9. Deo R.B.,Starnes I.H.J.R., Holzwart R. C., Low -Cost Composite materials and
Structures for Aircraft application. NATO RTO AVT Panel spring symposium and
specialists' meeting Loen, NORWAY, 2001.
10. Cinquin I. -Aeronautical composite Structure cost Reduction from the material Aspect.
NATO RTO AVT Panel spring symposium and specialists' meeting Loen, NORWAY,
2001.
11. Starnes I. H. Ir., Dexter H. B., Jonston N. I., Ambur D. R., Cano R. I. -Composite
Structures and materials research at NASA LANGLEY Research center, NATO RTO
AVT Panel spring symposium and specialists' meeting Loen, NORWAY, 2001.
12. Mills A., Backhouse R. -Innovative materials and manufacturing processes for the cost
effective manufacturing of composite airframe structures. 44th International SAMPE
symposium and exhibition, Long Beach, CA, USA, 23-27 May 1999. P 2255-2267.

This page has been deliberately left blank
Page intentionnellement blanche

18-1
The NATO Research & Technology Organization (RTO) – Overview
Claude Mounier, RTA/SPD7, rue Ancelle
92200 Neuilly-sur-SeineFrance
In the interests of readability and understandability, it is RTO policy topublish PowerPoint presentations only when accompanied by supportingtext. There are instances however, when the provision of such supportingtext is not possible hence at the time of publishing, no accompanying text
was available for the following PowerPoint presentation.
Paper presented at the RTO SAS Symposium on “Cost Structure and Life Cycle Cost for Military Systems”,held in Paris, France, 24-25 October 2001, and published in RTO-MP-096.

This page has been deliberately left blank
Page intentionnellement blanche

19-1
Strategic Cost Model to Support High Level Operational Analysis
Duncan BarradaleTechnical Leader Cost Analysis
A2 BuildingFarnborough, Hampshire
GU14 0LXUnited Kingdom
In the interests of readability and understandability, it is RTO policy topublish PowerPoint presentations only when accompanied by supportingtext. There are instances however, when the provision of such supportingtext is not possible hence at the time of publishing, no accompanying text
was available for the following PowerPoint presentation.
Paper presented at the RTO SAS Symposium on “Cost Structure and Life Cycle Cost (LCC) for Military Systems”, held in Paris, France, 24-25 October 2001, and published in RTO-MP-096.

This page has been deliberately left blank
Page intentionnellement blanche

20-1
Realistic Cost Estimates for Acquisition Programs:CAIG Perspectives
Richard BurkeOffice of Secretary of Defense
Program Analysis and Evaluation1800 Defense Pentagon, Room BE829
Washington, DC 20301-1800, USA
Introduction
My remarks today will focus on 3 specific questions:
1. Why do we do realistic cost estimates?
2. How we develop and use the cost estimates?
3. How successful are we?
In addressing these questions I hope to provide the CAIG perspective on the need forrealistic cost estimates in the acquisition of major military systems. I will conclude my remarkswith a discussion of the road ahead for the CAIG in developing realistic cost estimates for USprograms.
Why Do We Do Realistic Cost Estimates?
The answer to this question is obvious to those in the US involved with the formulation ofthe defense acquisition budget. It is not well known to all in the acquisition world, however.Hence, it may be useful to begin by stating why we work so hard at getting realistic estimates ofthe costs of major acquisition programs.
The question really is why we are so concerned with life cycle costs—that is, development,procurement, and operations and support costs year-by-year for a period which at the start ofengineering and manufacturing development (i.e., equivalent to the design and developmentphase in NATO acquisition) can extend for 30 years and more. Program managers are stronglymotivated to make realistic forecasts of their costs a year or two in advance to justify their near-term budgets. But why such concern with costs over horizons of 10, 20, or 30 years in the future?
Without wishing to insist to firmly on the relevance of estimates of costs that will occur farin the future, the answer to this question is to be found in a combination of three considerations.First, in the acquisition world, decisions made “today” strongly influence funding requirementsnot just for “this year” but also for “next year” and many years thereafter. To take an obviousexample, the decisions that will be made on the Joint Strike Fighter program are likely to be amajor factor in partners’ tactical aircraft procurement programs for decades. Second, programstypically are relatively “cheap” in their initial stages, especially the early stages of development,but require much larger annual funding later, during the procurement phase. Third, the overallbudget of the US Defense Department is subject to constraints; spending on particular parts ofthe budget (e.g., Army aircraft procurement) are also constrained, although somewhat lessspecifically.
Paper presented at the RTO SAS Symposium on “Cost Structure and Life Cycle Cost (LCC) for Military Systems”, held in Paris, France, 24-25 October 2001, and published in RTO-MP-096.

20-2
It goes without saying that demand for investment funds exceeds the amounts available. It isgenerally perceived that, in the competition for funds, Fortune tends to favor systems thatpromise outstanding performance at an affordable cost. Hence, program advocates have reason totake an optimistic view of both performance and cost. To the extent that optimistic appraisals ofcost are adopted, the acquisition budget as a whole will be “over programmed;” that is, theDepartment will begin the development of more programs than can be completed at efficientprocurement rates.
The question of why we need realistic cost estimates then becomes: What is wrong with“over programming” the acquisition accounts. The answer is that over programming, to thedegree that it actually occurs, is wasteful in that it causes the total cost of the procurementprogram to be greater than it needs to be.
The mechanisms through which over programming increases the costs of obtaining a givencapability within a given time frame are straightforward. Over programming becomes a fact thatmust be recognized when budgets for the next year or two are put together. At that point,contracts are pending or in place, and, in contrast to the outyears, program managers are stronglymotivated to adopt realistic cost estimates. The need to adjust the acquisition program inresponse to a shortage of funds (due to over programming) of course can be avoided to thedegree that there is some source of additional funding outside the acquisition program. This isnot something that can be counted on; at least to a considerable extent, the services and otherDoD components have found that they must deal with the problem within pre-existing fundinglimits.
At least in the US, substantially reducing the capabilities or performance of the militarysystem to be acquired has not usually been a serious option. Occasionally the response has beento cancel one or more programs, which is wasteful to the extent that the development efforts ofthe canceled programs have no utility to programs that are eventually funded. More common, thefunding shortages caused by over programming are accommodated by stretching ongoingprograms—that is, by lengthening the time over which the development is accomplished and/orreducing the quantity of the system procured each year. This increases costs if only because fixedcosts must be carried for more years, and usually for other reasons as well.
At roots, then, we seek realistic costs for individual major acquisition programs because aclear eyed view of cost is needed to economically structure the acquisition program as a whole.Good stewardship of the resources allocated to the Department is something that the seniorleadership of DoD requires. It is also something that the Congress insists upon and is, therefore,something that DoD must do reasonably well if it is to remain master over its own programs.
How do We Develop and Use Cost Estimates
The process for estimating costs for major defense acquisition programs in the DoD isrelatively well established. The process involves the preparation of two separate life cycle costestimates for each major decision point in the lifetime of an acquisition program. The two costestimates are presented to the Defense Acquisition Board, the oversight and advisory body in theDoD for major military acquisition programs, at each major milestone review.
The US manages the acquisition of major military systems through a milestone decisionprocess. In broad terms, the process presumes that a well managed acquisition program proceedsthrough several distinct phases. The point of transition between phases, where work on one hasbeen completed and work on the next not yet begun, is termed a “milestone.” (The number ofmilestones has varied from three to six over the roughly 30 years that DoD has used a milestoneacquisition process.) The overarching question at each milestone is whether the system is ready

20-3
in all respects to go on to the next phase. The authority to make that decision for a major weaponsystem acquisition rests with the Secretary of Defense. From the start of development throughthe early stages of production, the authority to make the decision is ordinarily delegated to theUnder Secretary of Defense (Acquisition, Technology and Logistics) USD(AT&L). Then, absentpositive approval by USD(AT&L), the service conducting the acquisition cannot spend funds onactivities associated with the next phase (e.g., could not spend funds on characteristically designand development activities for a system at the end of the program definition and risk reductionphase.)
Milestone approval covers a substantial list of topics—among others, the technical goals thesystem is to achieve, test and evaluation plans, a contracting plan (e.g., multi-year vs. single yearprocurement), procurement quantities, and—of particular interest here-- cost and budget.Decisions by USD(AT&L) on budget for an acquisition program are not final, as they are subjectto change in the DoD resource allocation process, by the Office of Management and Budget, andultimately by the Congress. Those initial decisions on cost and budget are very influential,however.
There are two life cycle cost estimates prepared for each milestone review of a majordefense acquisition program in the US. One estimate is prepared by the military serviceresponsible for managing the acquisition of the system under consideration. In some instancesthis cost estimate is prepared within the program office itself, under the direct management of theprogram manager. For other programs, this cost estimate may be prepared in a centralizedorganization within the military department responsible for the acquisition program. The costestimate prepared by the military department is coordinated throughout the military service andpresented to the USD(AT&L) as part of the DAB review process.
Another separate life cycle cost estimate is prepared for the military system at each majormilestone in the US acquisition process. By statute, at decisions on entry into Engineering andManufacturing Development (i.e., EMD, known as the “Design and Development” phase in theNATO acquisition community) and into Full Production the USD(AT&L) must also consider anindependent cost estimate, that is, an estimate made by an organization that does not report to thechain of command of the sponsoring military service. The responsibility for making theindependent cost estimates is assigned by DoD regulations to the Cost Analysis ImprovementGroup (CAIG), which effectively is a large part of the Resource Analysis deputate of the Officeof Program Analysis and Evaluation. The CAIG has available to it substantially the samehistorical data and cost information as the military service, but makes its own judgments aboutassumptions and costing methods.
Why is there a need for two separate life cycle cost estimates at each milestone foracquisition of major military systems? There are several important reasons the DoD acquisitionprocess has for three decades included the preparation and consideration of two cost estimates ateach key decision point.
As discussed earlier, there is a natural tendency to adopt optimistic cost estimates resultingin over programming of the acquisition accounts relative to the fiscal constraints facing the DoDand the military services. The consideration of the second independent cost estimate at eachmajor milestone serves as a direct counterbalance to the natural tendency to adopt overlyoptimistic cost estimates. It is quite frequently the case that the CAIG independent cost estimateis higher than the service cost estimate because of less optimistic assumptions used in developingthe CAIG estimate of costs.
The consideration of two cost estimates also results in a form of competition between themilitary service preparing the service cost estimate and the CAIG analysts preparing theindependent cost estimate for major milestone reviews. There are several reasons this informal

20-4
competition is healthy from a DoD corporate perspective. First and foremost, competitionimproves the quality of cost estimates available for use in the Department for managingacquisition programs and budgets. The benefits of good, reliable cost estimates accrue to theDepartment over time in the form of enhanced credibility in dealings with the executive branchof government, the White House, the Congress, and perhaps most importantly, directly with theAmerican people.
A second major benefit of the informal competition in preparation life-cycle cost estimatesis that it provides an incentive for the military services and the CAIG to maintain and improvethe cost analysis methods, information sources, and human resources needed to produce the life-cycle estimates. Over time the consideration of two cost estimates has resulted in betterdefinition of cost analysis procedures and processes, improved analytic techniques andinformation resources, and improved training of the human resources devoted to the costing ofmajor military systems in the DoD.
A third benefit of having two cost estimates available for consideration at each milestonereview is that the cost estimates themselves serve as vehicles for identifying major program riskareas for consideration by the acquisition executive. At each milestone review the militaryservices and the CAIG compare the cost estimates side-by-side, explaining the substantivedifferences between the two cost estimates. Most often, the differences in estimates can be traceddirectly to two or three key assumptions used in developing the cost estimates. It is preciselythese assumptions that identify key risk areas in the program under review. For example, theCAIG cost estimate may differ substantially from the service cost estimate because the proposedprogram schedule is overly optimistic based on DoD experience with prior programs in a specificcommodity class. In this situation, the comparison of cost estimates may lead the acquisitionexecutive to establish a more realistic schedule for the program prior to milestone approval andentry into, for example, the EMD phase.
There are serious differences between the service and the CAIG cost estimates in perhaps 30percent of the cases that are reviewed by USD(AT&L). In these, the decision on the cost estimateto be used, and therefore on the resources budgeted for the system, is made by USD(AT&L).
The cost estimates prepared in support of USD(AT&L) establish a basis for decisions on thebudget of the system under review. The presumption is that budget equals cost. This does notmean the budget for the upcoming year or two, but the year by year budget through the plannedconclusion of the procurement.
Cost and budget issues, although they can arise at any stage, tend to be most crucial at thepoint at which the decision to enter EMD (i.e., the equivalent of the D&D phase in the NATOacquisition process) is made. Typically, the annual expenditure rate increases sharply at the startof EMD, and the program attracts so many adherents that it becomes very difficult to cancel.Moreover, the forecasting challenges, and hence the possibility of legitimate controversy, tend tobe greatest around the start of the EMD (or D&D) phase.
Measures of Success
It is fruitful take a step back and examine the degree to which we have achieved success indeveloping and using independent cost estimates for DoD programs. In the CAIG we maintainan ongoing process to evaluate our success in estimating costs. We do this by comparing ourindependent cost estimates for programs prepared at the start of the EMD and production phasesof programs, with the actual costs of the program measured at the completion of each of theseprogram phases.
20-5
It is helpful to review the significant long-term problem that that led to the formation of theCost Analysis Improvement Group (or CAIG) in 1971. At that time, the Deputy Secretary ofDefense, David Packard, was plagued with sharp criticism because of continuing problems withmajor acquisition programs that were encountering very severe cost growth—growth ofapproximately 100-400% above contractor cost estimates were typical during this period. Chart 1shows the approximate situation posed to Deputy Secretary of Defense Packard in 1971. Of the34 major systems shown on the chart, 15 had projected cost overruns greater than 100%. Theselarge overruns were, as you can imagine, causing numerous headaches for the DeputySecretary—problems with insufficient budgets for execution of programs, extensive scheduledelays and program changes, and, perhaps most importantly, problems with the US Congress.
Mr. Packard traced the source of the problem with large cost overrruns on military systemacquisition programs to the poor quality of cost estimates prepared by military contractors andthe military departments. His response was to direct the development of an independent costestimating process to improve the quality of cost estimates for major defense acquisitionprograms. In early 1972 the Secretary of Defense affirmed the recommendations of DeputySecretary Packard and established the OSD Cost Analysis Improvement Group.
As we step back, now thirty years later, and measure the success of independent costing, weno longer find ourselves in a situation where cost growth of 100-400% is typical for majormilitary acquisition programs in the U.S. The historical information on actual program costsshows that independent cost estimating has dramatically reduced both the occurrence and thesize of cost overruns for major defense acquisition programs. Recent experience since the early1980s shows that growth of acquisition costs for major programs averaged approximately 30-50%, well below the levels routinely experienced by David Packard as the Deputy Secretary ofDefense. In fact, the record since the 1980s shows that the problem with large, unanticipated costgrowth on major weapon systems has been largely solved.
Chart 2 shows acquisition cost growth for small systems, large systems, and large and smallsystems considered in aggregate. The chart presents a histogram of the number of systemsexperiencing cost growth at levels less than 0%, 0-20%, 20-50%, and greater than 50% relativeto the original cost estimate for the acquisition program prepared at the start of the EMD phase.The red bars show DoD experience with programs prior to 1983. The blue bars show experienceduring 1983-1996, a time period in which the reforms introduced by Deputy Secretary Packardwere in full effect. As shown on Chart 2, only one in ten DoD systems had cost growth greaterthan 50% during 1983-1996, a marked improvement from the situation facing the DeputySecretary of Defense a decade earlier.
Where Do We Go From Here
I’d like to close my remarks with a look ahead at the path we plan to pursue to ensure theDoD continues to improve processes, analytic tools, and the human resources necessary todevelop realistic cost estimates for the acquisition of military systems.
First, we continue to pursue improvements in the tools and processes used in DoD toestimate the costs of major military systems. The CAIG, as well as the military services, continueto expend significant financial and human resources in pursuit of improvements in our costanalysis methods, information sources and databases, and procedures for developing costestimates. For example, later this afternoon you will hear from Colonel Dave Robinson, theDirector of the Contractor Cost Data Reporting (CCDR) office in DoD. He will provide adiscussion of improvements that have been implemented in the CCDR system, and plans forfuture improvements to information sources and data systems available to cost analysts. The
20-6
CCDR system will continue to provide an efficient means to collect cost actuals from ongoingacquisition programs to support analysts in preparing cost estimates new programs. We continueto pursue improvements as needed in the Cost Analysis Requirements Document, WorkBreakdown Structures, VAMOSC, and other tools used for cost analysis —many of which willbe discussed during this two-day conference. Lastly, we are working to improve the number oftraining opportunities and the quality of training available for human resources in the costingcommunity. Early next year we will once again support the 35th Annual DoD Cost AnalysisSymposium to meet our training objectives.
Second, we are pursuing the application of cost estimating and analysis methods to addressDoD financial management problems beyond the scope of the acquisition of major militarysystems. For example, it is obvious to us in the US that the Department will be facing newchallenges in acquisition of large service contracts, and in the acquisition of health care servicesfrom private contractors to provide services to active duty personnel, dependents, and retirees.
Finally, we continue to extend the practice of developing realistic cost estimating to othergovernment agencies and international organizations. The number of government agencies andinternational organizations requesting assistance or expressing interest in developing realistic lifecycle cost estimates continues to grow. In some cases, agencies are seeking guidance on how toestablish new independent costing organizations to develop realistic cost estimates in supporttheir acquisition programs. We shall support these activities to the degree possible because wecontinue to believe that realistic costing is a central element of sound financial management ofmajor government acquisition programs.

21-1
Overview of the Symposium Topics
Gérard SeguinDGA/DPM/MCO/EL26, Boulevard Victor
00460 ArméesFrance
In the interests of readability and understandability, it is RTO policy topublish PowerPoint presentations only when accompanied by supportingtext. There are instances however, when the provision of such supportingtext is not possible hence at the time of publishing, no accompanying text
was available for the following PowerPoint presentation.
Paper presented at the RTO SAS Symposium on “Cost Structure and Life Cycle Cost (LCC) for Military Systems”, held in Paris, France, 24-25 October 2001, and published in RTO-MP-096.

This page has been deliberately left blank
Page intentionnellement blanche
22-1
Discours de clôture
I.G.A. Bernard Besson
DGA–IPE8 boulevard VictorF-00303 Armées
France
Bonjour, bon après midi plutôt…
D'abord, je vous promets d'être bref parce que je sais que certains d'entre vousont des avions ou des trains à prendre ce soir et que ceux qui ne partent pas,veulent peut-être profiter du soleil à Paris. En cette période ce n'est pas tous lesjours.
Pourquoi m'adressai-je à vous maintenant ? C'est parce que d'abord je suis ausein de la Délégation Générale pour l'Armement, à la tête d'une équipe, dite lesArchitectes de Systèmes de Forces (ASF), qui est chargée de préparer les choixsur les capacités futures des armées françaises. Et, comme vous l’a ditl'ingénieur général Bongrand, en ouverture hier matin, la vision globale du coûtest évidemment un élément majeur dans la gestion des dossiers de préparationdes choix importants pour les forces. Alors, au cours de ces deux jours vous avezéchangé un certain nombre d’études, de données, et j'ai noté, j'ai relevéquelques problèmes. Je n'ai pas assisté à l'ensemble de vos travaux, mais il y aquelques problèmes qui, me semble-t-il, ont été mis en évidence, quidémontrent qu'il y a encore du travail pour les responsables d'établissement descoûts, c'est d'abord s'attacher à la qualité des bases de données dont j'ai biennoté qu'elle était essentielle, à la validité des modèles qui étaient employés. Et,même quand les données de bases sont les mêmes, la base de données peutintroduire son facteur personnel. J'ai bien noté que, par exemple aux Etat-Unis,quand on fait des évaluations indépendantes on arrive à 30 % d'écart à partir dedonnées des bases dont on pourrait penser qu'elles sont les mêmes. C’est doncvraiment un problème de fond, cette qualité, ce souci de vision de l'information,qui est nécessaire au travail.
Deuxième facteur qui me paraît important, c'est l'organisation des acteurs dontcertains ont dit qu'ils étaient indépendants et qui déterminent, par leurorganisation, la structure des coûts. C'est un secret pour personne que, quandon compare déjà des armées entre elles, par exemple la marine et l'armée deterre, l'organisation étant différente, la structure des coûts de soutien, defonctionnement ne va pas être la même. Et pour nous, qui préparons des choixsur des équipements futurs, des capacités futures, dont la majorité sera sansdoute réalisée en coopération internationale, ces problèmes de différenced’organisation sont encore plus importants, quand on se met à plusieurs pays. Oril est clair que, pour se comprendre et pour voir l'influence du choix sur lesstructures de coût, il faut avoir un langage commun qui permet d'expliquer lepoids des organisations.
Communication présentée lors du symposium RTO SAS sur les « Structures de coûts et coûts globaux de possession (LCC) pour systèmes militaires », organisé à Paris, France, du 24 au 25 octobre 2001, et éditée dans RTO-MP-096.

22-2
Enfin il y a un troisième problème, que personnellement je n'ai encore pas vubien abordé même si la méthode britannique de comptabilité économique detype entreprise s'en approche, c'est la comparaison, pour un choix, de systèmesdont la durée de vie est différente. Quand on doit prendre une décision sur unrenouvellement d'équipement ou sur une modernisation d'équipement, on agénéralement le choix entre un achat sur étagère, "SCOTS" en anglais, oudévelopper un système nouveau, ou faire une modernisation importante d'unsystème existant. Il est clair que les durées de vie de chacun de ces choix nesont pas les mêmes, et comment, par une approche de coût global, peut-onrendre compte de l'équilibre des choix alors qu'on ne va pas donner le mêmepotentiel ? Il y a un problème de modélisation important, qui, à mon sens, n'estpas encore résolu. Donc vous avez encore du travail.
Voilà les trois points que je voulais noter. Je tire aussi de ces journées le fait quedéjà, d'avoir pu parlé ensemble, de mettre ensemble toutes ses expériences, estla première démarche pour que, dans notre monde de la défense au moins, onpuisse se comprendre et savoir de quoi on parle tous ensemble. C'est un facteurde progrès.
Alors maintenant j'ai une deuxième raison de m'adresser à vous ce soir, c'estque je suis le représentant national pour la France au Panel SAS qui sponsorise,si j'ose dire, ce symposium. Alors d'abord, au nom du Panel, je dois dire que jeme félicite que ce symposium se soit tenu parce que c'est un témoignage vivantde la qualité des activités que nous essayons de promouvoir. Je remercie donctous ceux qui ont pris la peine de venir ici pour témoigner, présenter desconférences et mettre leur savoir en commun.
Cette étude sur les modèles de coûts est née il y a deux ans du résultat d'uneétude sur le véhicule tout électrique (VTE) où les pays de l'Alliance essayaient decomparer leur approche de cette problématique, et s’étaient aperçu que, pourévaluer les différents systèmes, il fallait parler de coûts, et que,malheureusement personne n'avait un modèle de coût qui soit satisfaisant et quipermettait d’en rendre compte. Donc l'idée a été émise qu'on pourrait lancer uneétude sur les modèles de coûts qui s'est transformée d'ailleurs dans son intitulésur la structure de coûts et non sur les modèles de coûts. Compte tenu deséchanges auxquels j’ai assisté, je pense qu'il y a de quoi lancer encore desétudes pour la suite, pour améliorer, maintenant qu'on a posé peut-êtrequelques bases de langage commun, un travail, pour arriver effectivement à desmodules de coûts sur lesquels nous serons d'accord, que nous saurons les gérerensemble et ce qui permettra effectivement d'approcher une vision partagéeentre tous les membres de l'Alliance et les pays partenaires des questions decoûts.
Donc j'invite chacun d'entre vous, rentré à la maison, rentré dans son pays, àdiscuter avec ses autorités, ses représentants vis à vis du Panel pour savoir,après une réflexion, après la digestion de tout ce qui a été dit aujourd'hui, quellesuite vous souhaiteriez voir donner, c'est vraiment une question que le Panel doitse poser prochainement.
Enfin, en tant que représentant du Panel, il m’appartient de faire quelquesremerciements pour la tenue de ce symposium. D’abord je remercie le servicecommunication (COMM) de la DGA qui a veillé à l'organisation matérielle dusymposium. Je pense qu’à voir votre attitude vous en êtes à peu près satisfaits,donc je remercie en votre nom et au nom du Panel. Je remercie aussi l'équipe de

22-3
l'agence, de la RTA et Mme Louise Choquette qui a apporté un soutien dans lapréparation de ce symposium et dans la gestion des participants. Je remercie lesinterprètes pour leur travail qui, j'espère, a été apprécié, même si de temps entemps on ne trouvait pas le bon canal ou le micro ne marchait pas. Et enfin jeremercie le comité d'organisation du symposium et particulièrement le directeurd'études Gérard Seguin pour la réussite de ces deux jours.
Merci beaucoup !

Page intentionnellement blanche
This page has been deliberately left blank
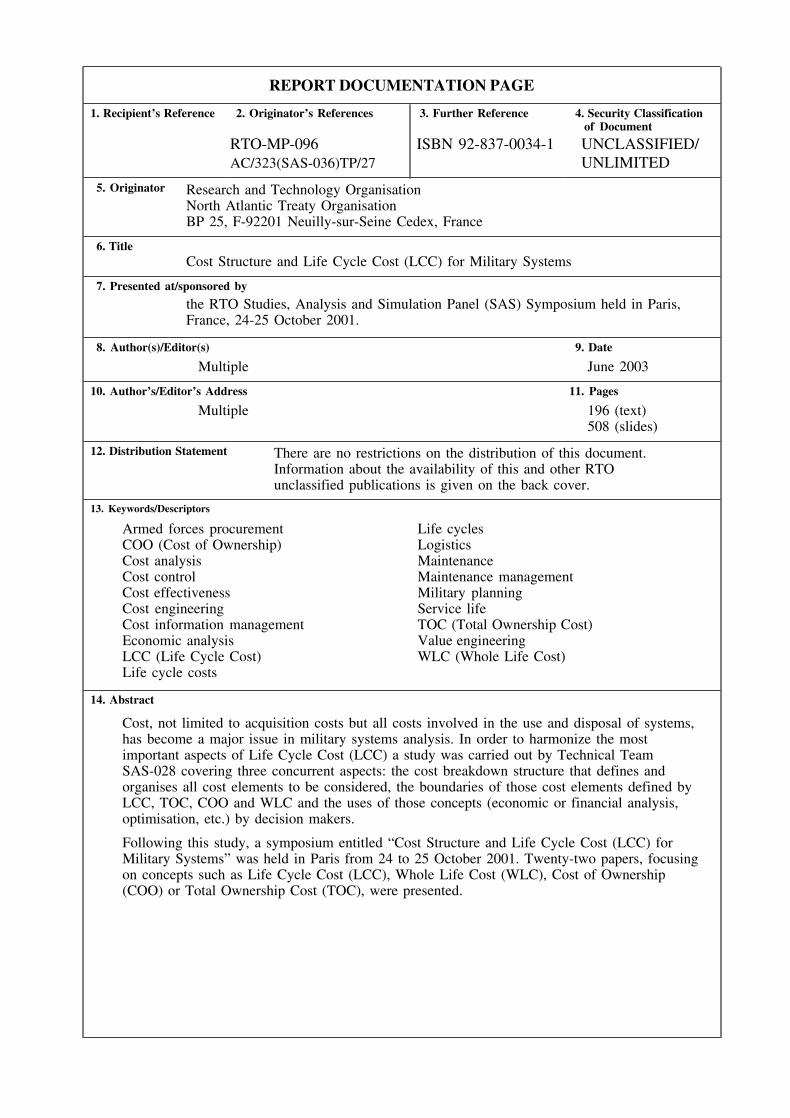
REPORT DOCUMENTATION PAGE
1. Recipient’s Reference 2. Originator’s References 3. Further Reference 4. Security Classificationof Document
RTO-MP-096 ISBN 92-837-0034-1 UNCLASSIFIED/AC/323(SAS-036)TP/27 UNLIMITED
5. Originator Research and Technology OrganisationNorth Atlantic Treaty OrganisationBP 25, F-92201 Neuilly-sur-Seine Cedex, France
6. TitleCost Structure and Life Cycle Cost (LCC) for Military Systems
7. Presented at/sponsored by
the RTO Studies, Analysis and Simulation Panel (SAS) Symposium held in Paris,France, 24-25 October 2001.
8. Author(s)/Editor(s) 9. Date
Multiple June 2003
10. Author’s/Editor’s Address 11. Pages
Multiple 196 (text)508 (slides)
12. Distribution Statement There are no restrictions on the distribution of this document.Information about the availability of this and other RTOunclassified publications is given on the back cover.
13. Keywords/Descriptors
Armed forces procurement Life cyclesCOO (Cost of Ownership) LogisticsCost analysis MaintenanceCost control Maintenance managementCost effectiveness Military planningCost engineering Service lifeCost information management TOC (Total Ownership Cost)Economic analysis Value engineeringLCC (Life Cycle Cost) WLC (Whole Life Cost)Life cycle costs
14. Abstract
Cost, not limited to acquisition costs but all costs involved in the use and disposal of systems,has become a major issue in military systems analysis. In order to harmonize the mostimportant aspects of Life Cycle Cost (LCC) a study was carried out by Technical TeamSAS-028 covering three concurrent aspects: the cost breakdown structure that defines andorganises all cost elements to be considered, the boundaries of those cost elements defined byLCC, TOC, COO and WLC and the uses of those concepts (economic or financial analysis,optimisation, etc.) by decision makers.
Following this study, a symposium entitled “Cost Structure and Life Cycle Cost (LCC) forMilitary Systems” was held in Paris from 24 to 25 October 2001. Twenty-two papers, focusingon concepts such as Life Cycle Cost (LCC), Whole Life Cost (WLC), Cost of Ownership(COO) or Total Ownership Cost (TOC), were presented.

This page has been deliberately left blank
Page intentionnellement blanche

NORTH ATLANTIC TREATY ORGANISATION
RESEARCH AND TECHNOLOGY ORGANISATION
BP 25 • 7 RUE ANCELLE DIFFUSION DES PUBLICATIONS
F-92201 NEUILLY-SUR-SEINE CEDEX • FRANCE RTO NON CLASSIFIEES
Telecopie 0(1)55.61.22.99 • E-mail [email protected]
L’Organisation pour la recherche et la technologie de l’OTAN (RTO), detient un stock limite de certaines de ses publications recentes, ainsique de celles de l’ancien AGARD (Groupe consultatif pour la recherche et les realisations aerospatiales de l’OTAN). Celles-ci pourronteventuellement etre obtenues sous forme de copie papier. Pour de plus amples renseignements concernant l’achat de ces ouvrages,adressez-vous par lettre ou par telecopie a l’adresse indiquee ci-dessus. Veuillez ne pas telephoner.
Des exemplaires supplementaires peuvent parfois etre obtenus aupres des centres nationaux de distribution indiques ci-dessous. Si voussouhaitez recevoir toutes les publications de la RTO, ou simplement celles qui concernent certains Panels, vous pouvez demander d’etreinclus sur la liste d’envoi de l’un de ces centres.
Les publications de la RTO et de l’AGARD sont en vente aupres des agences de vente indiquees ci-dessous, sous forme de photocopie oude microfiche. Certains originaux peuvent egalement etre obtenus aupres de CASI.
CENTRES DE DIFFUSION NATIONAUX
ALLEMAGNE FRANCE PAYS-BASStreitkrafteamt / Abteilung III O.N.E.R.A. (ISP) Royal Netherlands MilitaryFachinformationszentrum der 29, Avenue de la Division Leclerc Academy LibraryBundeswehr, (FIZBw) BP 72, 92322 Chatillon Cedex P.O. Box 90.002
Friedrich-Ebert-Allee 34 4800 PA BredaGRECE (Correspondant)D-53113 Bonn
Defence Industry & Research POLOGNEBELGIQUE General Directorate Armament Policy Department
Etat-Major de la Defense Research Directorate 218 Niepodleglosci Av.Departement d’Etat-Major Strategie Fakinos Base Camp 00-911 WarsawACOS-STRAT-STE – Coord. RTO S.T.G. 1020
PORTUGALQuartier Reine Elisabeth Holargos, AthensEstado Maior da Forca AereaRue d’Evere, B-1140 Bruxelles HONGRIE SDFA - Centro de Documentacao
Department for ScientificCANADA AlfragideAnalysisDSIGRD2 P-2720 Amadora
Institute of Military TechnologyBibliothecaire des ressources du savoirREPUBLIQUE TCHEQUEMinistry of DefenceR et D pour la defense Canada
DIC Czech Republic-NATO RTOH-1525 Budapest P O Box 26Ministere de la Defense nationaleVTUL a PVO Praha305, rue Rideau, 9e etage ISLANDE Mladoboleslavska ul.Ottawa, Ontario K1A 0K2 Director of Aviation Praha 9, 197 06, C
∨eska republika
c/o FlugradDANEMARKROYAUME-UNIReykjavikDanish Defence Research Establishment
Dstl Knowledge ServicesRyvangs Alle 1, P.O. Box 2715 ITALIE Kentigern House, Room 2246DK-2100 Copenhagen Ø Centro di Documentazione 65 Brown StreetTecnico-Scientifica della DifesaESPAGNE Glasgow G2 8EX
Via XX Settembre 123aINTA (RTO/AGARD Publications)00187 Roma TURQUIECarretera de Torrejon a Ajalvir, Pk.4
Millı Savunma Bas,kanli i (MSB)28850 Torrejon de Ardoz - Madrid LUXEMBOURG ARGE Dairesi Bas,kanli i (MSB)Voir BelgiqueETATS-UNIS 06650 Bakanliklar - AnkaraNASA Center for AeroSpace NORVEGEInformation (CASI) Norwegian Defence Research
Parkway Center Establishment7121 Standard Drive Attn: BiblioteketHanover, MD 21076-1320 P.O. Box 25, NO-2007 Kjeller
AGENCES DE VENTE
NASA Center for AeroSpace The British Library Document Canada Institute for Scientific andInformation (CASI) Supply Centre Technical Information (CISTI)
Parkway Center Boston Spa, Wetherby National Research Council7121 Standard Drive West Yorkshire LS23 7BQ AcquisitionsHanover, MD 21076-1320 Royaume-Uni Montreal Road, Building M-55Etats-Unis Ottawa K1A 0S2, Canada
Les demandes de documents RTO ou AGARD doivent comporter la denomination “RTO” ou “AGARD” selon le cas, suivie dunumero de serie (par exemple AGARD-AG-315). Des informations analogues, telles que le titre et la date de publication sontsouhaitables. Des references bibliographiques completes ainsi que des resumes des publications RTO et AGARD figurent dans lesjournaux suivants:
Scientific and Technical Aerospace Reports (STAR) Government Reports Announcements & Index (GRA&I)STAR peut etre consulte en ligne au localisateur de publie par le National Technical Information Serviceressources uniformes (URL) suivant: Springfield
http://www.sti.nasa.gov/Pubs/star/Star.html Virginia 2216STAR est edite par CASI dans le cadre du programme Etats-UnisNASA d’information scientifique et technique (STI) (accessible egalement en mode interactif dans la base de
donnees bibliographiques en ligne du NTIS, et sur CD-ROM)STI Program Office, MS 157ANASA Langley Research CenterHampton, Virginia 23681-0001Etats-Unis
Imprime par Groupe d’imprimerie St-Joseph inc.(Membre de la Corporation St-Joseph)
1165, rue Kenaston, Ottawa (Ontario), Canada K1G 6S1

NORTH ATLANTIC TREATY ORGANISATION
RESEARCH AND TECHNOLOGY ORGANISATION
BP 25 • 7 RUE ANCELLE DISTRIBUTION OF UNCLASSIFIED
F-92201 NEUILLY-SUR-SEINE CEDEX • FRANCE RTO PUBLICATIONS
Telefax 0(1)55.61.22.99 • E-mail [email protected]
NATO’s Research and Technology Organisation (RTO) holds limited quantities of some of its recent publications and those of the formerAGARD (Advisory Group for Aerospace Research & Development of NATO), and these may be available for purchase in hard copy form.For more information, write or send a telefax to the address given above. Please do not telephone.
Further copies are sometimes available from the National Distribution Centres listed below. If you wish to receive all RTO publications, orjust those relating to one or more specific RTO Panels, they may be willing to include you (or your organisation) in their distribution.
RTO and AGARD publications may be purchased from the Sales Agencies listed below, in photocopy or microfiche form. Original copiesof some publications may be available from CASI.
NATIONAL DISTRIBUTION CENTRES
BELGIUM GREECE (Point of Contact) POLANDEtat-Major de la Defense Defence Industry & Research Armament Policy DepartmentDepartement d’Etat-Major Strategie General Directorate 218 Niepodleglosci Av.ACOS-STRAT-STE – Coord. RTO Research Directorate 00-911 WarsawQuartier Reine Elisabeth Fakinos Base Camp
PORTUGALRue d’Evere, B-1140 Bruxelles S.T.G. 1020Estado Maior da Forca AereaHolargos, Athens
CANADA SDFA - Centro de DocumentacaoDRDKIM2 HUNGARY AlfragideKnowledge Resources Librarian Department for Scientific P-2720 AmadoraDefence R&D Canada Analysis
SPAINDepartment of National Defence Institute of Military TechnologyINTA (RTO/AGARD Publications)305 Rideau Street, 9th Floor Ministry of DefenceCarretera de Torrejon a Ajalvir, Pk.4Ottawa, Ontario K1A 0K2 H-1525 Budapest P O Box 2628850 Torrejon de Ardoz - Madrid
CZECH REPUBLIC ICELANDTURKEYDirector of AviationDIC Czech Republic-NATO RTO
Millı Savunma Bas,kanli i (MSB)c/o FlugradVTUL a PVO PrahaARGE Dairesi Bas,kanli i (MSB)ReykjavikMladoboleslavska ul.06650 Bakanliklar - AnkaraPraha 9, 197 06, C
∨eska republika
ITALYUNITED KINGDOMCentro di DocumentazioneDENMARK
Dstl Knowledge ServicesTecnico-Scientifica della DifesaDanish Defence ResearchKentigern House, Room 2246Via XX Settembre 123aEstablishment65 Brown Street00187 RomaRyvangs Alle 1, P.O. Box 2715Glasgow G2 8EXDK-2100 Copenhagen Ø
LUXEMBOURGUNITED STATESSee BelgiumFRANCE
NASA Center for AeroSpaceO.N.E.R.A. (ISP)NETHERLANDS Information (CASI)29 Avenue de la Division Leclerc
Royal Netherlands Military Parkway CenterBP 72, 92322 Chatillon CedexAcademy Library 7121 Standard Drive
P.O. Box 90.002GERMANY Hanover, MD 21076-13204800 PA BredaStreitkrafteamt / Abteilung III
Fachinformationszentrum derNORWAYBundeswehr, (FIZBw)
Norwegian Defence ResearchFriedrich-Ebert-Allee 34EstablishmentD-53113 Bonn
Attn: BiblioteketP.O. Box 25, NO-2007 Kjeller
SALES AGENCIESNASA Center for AeroSpace The British Library Document Canada Institute for Scientific and
Information (CASI) Supply Centre Technical Information (CISTI)Parkway Center Boston Spa, Wetherby National Research Council7121 Standard Drive West Yorkshire LS23 7BQ AcquisitionsHanover, MD 21076-1320 United Kingdom Montreal Road, Building M-55United States Ottawa K1A 0S2, CanadaRequests for RTO or AGARD documents should include the word ‘RTO’ or ‘AGARD’, as appropriate, followed by the serialnumber (for example AGARD-AG-315). Collateral information such as title and publication date is desirable. Full bibliographicalreferences and abstracts of RTO and AGARD publications are given in the following journals:
Scientific and Technical Aerospace Reports (STAR) Government Reports Announcements & Index (GRA&I)STAR is available on-line at the following uniform published by the National Technical Information Serviceresource locator: Springfield
http://www.sti.nasa.gov/Pubs/star/Star.html Virginia 22161STAR is published by CASI for the NASA Scientific United Statesand Technical Information (STI) Program (also available online in the NTIS BibliographicSTI Program Office, MS 157A Database or on CD-ROM)NASA Langley Research CenterHampton, Virginia 23681-0001United States
Printed by St. Joseph Print Group Inc.(A St. Joseph Corporation Company)
1165 Kenaston Street, Ottawa, Ontario, Canada K1G 6S1
ISBN 92-837-0034-1