Cost-Effectiveness of Percutaneous Coronary Intervention...
52
DOI: 10.1161/CIRCULATIONAHA.114.009985 1 Cost-Effectiveness of Percutaneous Coronary Intervention with Drug-Eluting Stents vs. Bypass Surgery for Patients with 3-Vessel or Left Main Coronary Artery Disease: Final Results from the SYNTAX Trial Running title: Cohen et al.; Cost-effectiveness of PCI versus CABG David J. Cohen, MD, MSc 1 *; Ruben L. Osnabrugge, MSc 1,2 *; Elizabeth A. Magnuson, ScD 1 ; Kaijun Wang, PhD 1 ; Haiyan Li, MS 1 ; Khaja Chinnakondepalli, MS 1 ; Duane Pinto, MD 3 ; Mouin S. Abdallah, MD 1 ; Katherine A. Vilain, MPH 1 ; Marie-Claude Morice, MD 4 ; Keith D. Dawkins, MD 5 ; A. Pieter Kappetein, MD, PhD 2 ; Friedrich W. Mohr, MD 6 ; Patrick W. Serruys, MD, PhD 2 , on behalf of the SYNTAX trial investigators 1 Saint Luke’s Mid America Heart Institute, University of Missouri-Kansas City, Kansas City, MO; 2 Erasmus University Medical Center, Rotterdam, The Netherlands; 3 Harvard School of Public Health, Boston, MA; 4 Institut Jacques Cartier, Massy, France; 5 Boston Scientific, Natick, MA; 6 Herzzentrum Universität Leipzig, Leipzig, Germany *joint first authors Address for Correspondence: David J. Cohen, MD, MSc Saint Luke’s Mid America Heart Institute University of Missouri-Kansas City School of Medicine 4401 Wornall Rd. Kansas City, MO 64111 Tel: 816-932-4581 Fax: 816-932-4582 E-mail: [email protected] Journal Subject Codes: Cardiovascular (CV) surgery:[36] CV surgery: coronary artery disease, Treatment:[24] Catheter-based coronary interventions:stents, Ethics and policy:[100] Health policy and outcome research MD 5 ; A. Pieter Kappetein, MD, PhD 2 ; Friedrich W. Mohr, MD 6 ; Patrick W. Ser rr ru ruys ys y , MD MD MD, , Ph Ph PhD D 2 on behalf of the SYNTAX trial investigators 1 1 Sa Sa Sain in int t Lu Lu uke ke ke’s M M Mi id id America Heart Institute, Un niv iv i e e er sity of Missou ou o ri-K -K Ka an ansas City, Kansas City, M MO MO; 2 Eras as smu mu mus s s Un Un Univ iv iver er ersi si sity ty ty M M Med ed edic ic ical al l C C Cen en e t t t er er er, Ro Rot tt te er rda am, m, m, T T The he h N N Net ethe he herl rl lan an ands d ; 3 3 Ha Ha Harv rv rvar ar a d d Sc Sc Scho ho hool ol ol o o of P Pub bl blic Health, h B B Bo osto ton n n, M M MA; A; ; 4 4 I In Inst stit it itu ut ut J J Ja ac cque es es Car r rti ie er, M Ma Mass ss ssy y, F Fr r ran n nce; 5 5 B Bo ost st to on n S Sci ci ien n nti tif f fic c, , N Na a ati ic ck, MA A A; ; 6 He He erz z zze zentru ru rum m m U U Univ v ver r rsitä ä ät Le Leip ip ipz zi zig, g, , L L Leip p pzi i ig, G G Ger rm rma a any y y *j *j *joi oi oint nt nt f f fir ir irs st st a a aut ut u ho ho hors rs rs Ad Add d f f C C d d by guest on May 29, 2018 http://circ.ahajournals.org/ Downloaded from by guest on May 29, 2018 http://circ.ahajournals.org/ Downloaded from by guest on May 29, 2018 http://circ.ahajournals.org/ Downloaded from by guest on May 29, 2018 http://circ.ahajournals.org/ Downloaded from by guest on May 29, 2018 http://circ.ahajournals.org/ Downloaded from by guest on May 29, 2018 http://circ.ahajournals.org/ Downloaded from by guest on May 29, 2018 http://circ.ahajournals.org/ Downloaded from by guest on May 29, 2018 http://circ.ahajournals.org/ Downloaded from by guest on May 29, 2018 http://circ.ahajournals.org/ Downloaded from by guest on May 29, 2018 http://circ.ahajournals.org/ Downloaded from by guest on May 29, 2018 http://circ.ahajournals.org/ Downloaded from by guest on May 29, 2018 http://circ.ahajournals.org/ Downloaded from by guest on May 29, 2018 http://circ.ahajournals.org/ Downloaded from
Transcript of Cost-Effectiveness of Percutaneous Coronary Intervention...
DOI: 10.1161/CIRCULATIONAHA.114.009985
1
Cost-Effectiveness of Percutaneous Coronary Intervention with Drug-Eluting
Stents vs. Bypass Surgery for Patients with 3-Vessel or Left Main Coronary
Artery Disease: Final Results from the SYNTAX Trial
Running title: Cohen et al.; Cost-effectiveness of PCI versus CABG
David J. Cohen, MD, MSc1*; Ruben L. Osnabrugge, MSc1,2*; Elizabeth A. Magnuson, ScD1;
Kaijun Wang, PhD1; Haiyan Li, MS1; Khaja Chinnakondepalli, MS1; Duane Pinto, MD3; Mouin
S. Abdallah, MD1; Katherine A. Vilain, MPH1; Marie-Claude Morice, MD4; Keith D. Dawkins,
MD5; A. Pieter Kappetein, MD, PhD2; Friedrich W. Mohr, MD6; Patrick W. Serruys, MD, PhD2,
on behalf of the SYNTAX trial investigators
1Saint Luke’s Mid America Heart Institute, University of Missouri-Kansas City, Kansas City, MO; 2Erasmus University Medical Center, Rotterdam, The Netherlands; 3Harvard School of
Public Health, Boston, MA; 4Institut Jacques Cartier, Massy, France; 5Boston Scientific, Natick, MA; 6Herzzentrum Universität Leipzig, Leipzig, Germany
*joint first authors
Address for Correspondence:
David J. Cohen, MD, MSc
Saint Luke’s Mid America Heart Institute
University of Missouri-Kansas City School of Medicine
4401 Wornall Rd.
Kansas City, MO 64111
Tel: 816-932-4581
Fax: 816-932-4582
E-mail: [email protected]
Journal Subject Codes: Cardiovascular (CV) surgery:[36] CV surgery: coronary artery disease, Treatment:[24] Catheter-based coronary interventions:stents, Ethics and policy:[100] Health policy and outcome research
MD5; A. Pieter Kappetein, MD, PhD2; Friedrich W. Mohr, MD6; Patrick W. Serrrruruysysy , MDMDMD,,, PhPhPhDD2
on behalf of the SYNTAX trial investigators
11SaSaSaininint t LuLuukekeke’s MMMiidid America Heart Institute, Unnivivi eeersity of Missououo ri-K-KKaanansas City, Kansas City,MMOMO; 2Erasassmumumusss UnUnUnivivivererersisisitytyty MMMedededicicicalall CCCenene tttererer, RoRotttteerrdaam,m,m, TTTheheh NNNetetheheherlrllananandsd ; 33HaHaHarvrvrvarara d d ScScSchohohoololol ooof
PPubblblic Health,h BBBoostotonnn, MMMA;A;; 44IInInststititituutut JJJaaccqueeses Carrrtiieer, MMaMassssssyy, FFrrrannnce; 55BBooststtoonn SSciciiennntitiffficc,, NNaaatiicck,MAAA;; 6HeHeerzzzzezentrururummm UUUnivvverrrsitääät LeLeipipipzzizig,g,, LLLeipppziiig, GGGerrmrmaaanyyy
*j*j*joioiointntnt fffiririrsstst aaaututu hohohorsrsrs
AdAddd ff CC dd
by guest on May 29, 2018
http://circ.ahajournals.org/D
ownloaded from
by guest on M
ay 29, 2018http://circ.ahajournals.org/
Dow
nloaded from
by guest on May 29, 2018
http://circ.ahajournals.org/D
ownloaded from
by guest on M
ay 29, 2018http://circ.ahajournals.org/
Dow
nloaded from
by guest on May 29, 2018
http://circ.ahajournals.org/D
ownloaded from
by guest on M
ay 29, 2018http://circ.ahajournals.org/
Dow
nloaded from
by guest on May 29, 2018
http://circ.ahajournals.org/D
ownloaded from
by guest on M
ay 29, 2018http://circ.ahajournals.org/
Dow
nloaded from
by guest on May 29, 2018
http://circ.ahajournals.org/D
ownloaded from
by guest on M
ay 29, 2018http://circ.ahajournals.org/
Dow
nloaded from
by guest on May 29, 2018
http://circ.ahajournals.org/D
ownloaded from
by guest on M
ay 29, 2018http://circ.ahajournals.org/
Dow
nloaded from
by guest on May 29, 2018
http://circ.ahajournals.org/D
ownloaded from
DOI: 10.1161/CIRCULATIONAHA.114.009985
2
Abstract
Background—The SYNTAX trial demonstrated that in patients with 3-vessel or left-main CAD,
CABG was associated with a lower rate of cardiovascular death, MI, stroke, or repeat
revascularization compared with DES-PCI. The long-term cost-effectiveness of these strategies
is unknown.
Methods and Results—Between 2005 and 2007, 1800 patients with left-main or 3-vessel CAD
were randomized to CABG (n=897) or DES-PCI (n=903). Costs were assessed from a US
perspective, and health state utilities were evaluated with the EuroQOL questionnaire. A patient-
level micro-simulation model based on the 5-year in-trial data was used to extrapolate costs, life
expectancy, and quality-adjusted life expectancy over a lifetime horizon. Although initial
procedural costs were $3415/patient lower with CABG, total hospitalization costs were
$10,036/patient higher. Over the next 5 years, follow-up costs were higher with DES-PCI, owing
to more frequent hospitalizations, revascularization procedures, and higher medication costs.
Over a lifetime horizon, CABG remained more costly than DES-PCI but the incremental cost-
effectiveness ratio was favorable ($16,537/ QALY gained) and remained <$20,000/QALY in
most bootstrap replicates. Results were consistent across a wide range of assumptions regarding
the long-term effect of CABG vs. DES-PCI on events and costs. In patients with left-main
disease or a SYNTAX Score 22, however, DES-PCI was economically dominant compared
with CABG although these findings were less certain.
Conclusions—For most patients with 3-vessel or left-main CAD, CABG is a clinically and
economically attractive revascularization strategy compared with DES-PCI. However, among
patients with less complex disease, DES-PCI may be preferred on both clinical and economic
grounds.
Clinical Trial Registration Information—www.clinicaltrials.gov. Identifier: NCT00114972.
Key words: bypass surgery, percutaneous coronary intervention, drug-eluting stent, cost-benefit analysis, randomized controlled trial
procedural costs were $3415/patient lower with CABG, total hospitalization costs s wewewerere
$10,036/patient higher. Over the next 5 years, follow-up costs were higher with DEDEDES-S--PCPCPCI,I,I ooowiwiwingngng
o more frequent hospitalizations, revascularization procedures, and higher medication costs.
Overer aaa lllifififetetetimimme hohohoririr zon, CABG remained more cococoststs ly than DES-PCI bububut t t the incremental cost-
efeffffefecctctivi enessss s raatitio oo wawass fafafavovovorarablblleee ($($($1616,5,5, 3737// QQQALALYYY ggainnededed))) ana d d rreremmamaininededed <$2$20,0,0,0000000/0/QAQAALYLYLY iiin n n//
mmom sstst bootstrap repepeplicaaatetes. ReRResusultl ss wewerrere connsiisstennnt aacrososss s aa a wwwi edee rraangeee ooff aassssuumptttioonnss reeegarrdiining
hhe e e loloongngng-t-tererrm m m efeffffecctct ooff CCACABGBGG vvvsss. DEDED SSS-PCPCPCI I I onnn eevvvennntss annndd d cocostststs.s. IIInn n papaatieenentstss wwwitith h leleefft-m-mmaaiain n
dididiseseseasasaseee ororor aaa SSSYNYNYNTATATAXXX ScScScorororeee 222222, hohohoweweweveveverrr, DDDESESES P-P-PCICICI wwwasasas eeecococonononomimimicacacallllllyyy dododomimiminananantntnt cccomomompapaparerereddd
wiwithth CCABABGG alalththououghgh tthehesese ffinindidingngss wewerere lelessss ccerertatainin
by guest on May 29, 2018
http://circ.ahajournals.org/D
ownloaded from

DOI: 10.1161/CIRCULATIONAHA.114.009985
3
Approximately 6% of all American adults suffer from coronary artery disease (CAD) with
estimated total annual costs in excess of $200 billion.1 Coronary revascularization procedures
including percutaneous coronary intervention (PCI) and coronary artery bypass graft surgery
(CABG) account for nearly $12 billion/year in direct costs alone. Over the past 2 decades,
numerous clinical trials have compared the clinical outcomes of PCI vs. CABG for patients with
multivessel CAD. In general, these studies have demonstrated similar short- and long-term
mortality with either procedure (with the exception of diabetic patients) but substantial
advantages of CABG in terms of angina relief and the need for subsequent revascularization
procedures.2-8 Economic evaluations performed in both the balloon angioplasty and bare metal
stent eras, have consistently demonstrated early cost savings with PCI but similar long-term costs
for the 2 strategies.7, 9, 10
The most recent study to compare PCI with CABG in a broad population was the
SYNTAX trial.11 In contrast to previous studies, SYNTAX included patients with more complex
CAD (3-vessel and left main disease), had few exclusion criteria, and used drug-eluting stents
(DES) for all PCI procedures. At 5-year follow-up, SYNTAX demonstrated that CABG was
associated with a lower rate of the composite of cardiovascular death, MI, stroke, or repeat
revascularization compared with DES-PCI—driven mainly by reductions in non-fatal MI and
repeat revascularization.12 However, DES-PCI was associated with a lower rate of stroke in the
overall population and similar overall clinical outcomes in certain patient subsets.12, 13 Given the
current economic challenges facing virtually all healthcare systems, understanding both the long-
term clinical benefits and cost-effectiveness of these alternative revascularization strategies is
critical for both clinical guideline development and health care policy. We therefore performed a
prospective health economic evaluation alongside the SYNTAX trial. Although the SYNTAX
tent eras, have consistently demonstrated early cost savings with PCI but similaarrr loloonggg-t-t-terererm m m cocost
for the 2 strategies.7, 9, 10
ThThTheee mmmoststt rrreececent study to compare PCI wwwititithh CABG in a brrroaoo d popopopppulation was the
SSYSYNNNTAX trialal.11111 InIn cccononntrrtraasast tt tototo pprerer viviv oououss stuududiies, S NYNYNTTATAXXX iininclclududdeded pppattieentntntsss wiwiththth mmmororee cocompmpmplex
CACAADDD (3(3(3-v-vesesesssesel l aaandd d lelefft mmmaia n n didiiseseseasasasee)e), , hahaadd d ffefew w w exexxcllususioioi n nn ccrcritterereriaiaa, , ananand d uususedede dddruruug-g-g eeleluututinnngg ststenenntss
DES) for all l PCPCPCI I prprprococcedede ururreseses.. AAAt t t 5-5-yeyearara fffolololloloow-w-w upupup, SYSYSYNTNTNTAXAXAX dddemememonononstststrararateteted d thththatatat CCCABABA G was
by guest on May 29, 2018
http://circ.ahajournals.org/D
ownloaded from
DOI: 10.1161/CIRCULATIONAHA.114.009985
4
trial included only 5-year follow-up, we used disease-simulation techniques to extrapolate the 5-
year trial results to a lifetime horizon.
Methods
The design and methods of the SYNTAX trial have been described previously.11, 12, 14 Between
March 2005 and April 2007, 1800 patients with 3-vessel or left main CAD without recent MI
who were considered equally suitable for PCI with DES and CABG by both a cardiac surgeon
and an interventional cardiologist were randomized to either procedure. CABG was performed
using standard techniques, and PCI procedures utilized paclitaxel-eluting stents (TAXUS
Express, Boston Scientific, Natick, MA, USA). The institutional review board at each
participating site approved the protocol and all patients provided written informed consent. The
trial complies with the Declaration of Helsinki and is registered at the National Institutes of
Health website (http://www.clinicaltrials.gov; identifier NCT00114972).
Estimation of Medical Care Costs
Costs for the initial hospitalization and the 5-year follow-up period were assessed by a
combination of resource-based and event-based methods as described below. These methods
were virtually identical to those used for a recent health economic assessment of DES-PCI vs.
CABG among diabetic patients.15 To maintain consistency with that previous report, all costs
were assessed from the perspective of the U.S. health care system and are reported in 2010 U.S.
dollars.
Procedural Costs
Detailed resource use was recorded for each initial and any subsequent revascularization
procedures, and the cost for each item was estimated on the basis of its mean hospital acquisition
Express, Boston Scientific, Natick, MA, USA). The institutional review board aat t eaaachchch
participating site approved the protocol and all patients provided written informed consent. The
rriaiaalll cocoompmpmplililiesess wwititithhh tht e Declaration of Helsinki ananandd is registered atatt thee NNNaatational Institutes of
HHeaalalth websitete (((hthttptp://://w/w/wwwww.c.cclililininicccalalaltrtriiaallss.goovv;; ideenntttifieerer NNCTCTCT000011114949727272).
EsEstititimamamatitiononon ooof f MeMeMedidicacal l CaCareree CCCososostststs
Costs for the e inininititi iaiaal l l hohohospsppitalalalizizzatatioioionn n anana d d d thththee e 5-5-5 yeyeyeararr fffololollol w-w-w upupup ppperererioioi d d d wewewererere aaassssssesessseseed d d bybyby aa
by guest on May 29, 2018
http://circ.ahajournals.org/D
ownloaded from
DOI: 10.1161/CIRCULATIONAHA.114.009985
5
cost at 3 surveyed U.S. hospitals. Each DES was assigned a cost of $1500. Costs of
antithrombotic therapy were based on the current wholesale acquisition cost obtained from
Micromedex Red Book.16 Costs for additional disposable equipment, overhead and depreciation
of the cardiac catheterization laboratory and operating room, and non-physician personnel were
estimated using data from the micro-cost accounting systems of Saint Luke’s Mid America Heart
Institute and adjusted for observed procedure duration. For the purposes of this report, initial and
planned staged PCI procedures were combined for the calculation of index resource utilization
and cost.
Post-procedure hospitalization costs
Post procedure costs for each initial hospitalization were estimated using regression models
based on SYNTAX-eligible patients who underwent either PCI (n=113,921) or CABG
(n=43,866) and whose data were included in the 2010 Medicare Provider and Review
(MEDPAR) database. Hospital charges were converted into costs using hospital- and cost center-
specific cost-to-charge ratios.17, 18 Linear regression models were then developed, using total
hospitalization costs as the outcome and sociodemographic factors, comorbidities, and in-
hospital complications (identified on the basis of ICD-9 codes) as predictors (eTable 1). Because
of substantial variability in length of stay for revascularization procedures across the enrolling
countries, length of stay was not included as a predictor in these models. The final models for
PCI and CABG were then used to predict nonprocedural costs for each initial hospitalization as
well as any subsequent hospitalizations that involved coronary revascularization. To avoid
double-counting procedural costs, the intercept for each model was adjusted to remove the costs
directly related to the revascularization procedures.
For follow-up cardiovascular hospitalizations that did not involve a revascularization
Post procedure costs for each initial hospitalization were estimated using regresssiioion nn momomodededelslsls
based on SYNTAX-eligible patients who underwent either PCI (n=113,921) or CABG
nn=4=4=43,3,3,8686866)6)6) aannnd wwwhhohose data were included in theee 2220010 Medicare PPPror vividedederr r and Review
MMEEDEDPAR) ddatataaba asase.e. HHHososspipipitatatall chchhararargeges wwerree ccconveveverrteddd iintntooo ccocoststts ususininggg hhohospspspiititalal-- ananand d d ccocoststst ccenenentter-
ppecececififificicic ccososst-t-t-toto-c-cchhaargrggee rraratitiosss..177,7, 1818 LLLinineeaearrr rereregrgrg esesessisiononon mmmododdelelelss wewewereree ttthehehen n deeevevelolol pepeped,d,d, uuussinngng tttototaalal
hospitalizatioon n n cococ stststss s asasa tttheee oooutuu cococomememe aandndnd sssocococioioodeded momomogrgrgrappphihihic cc fafafactctctororo s,s,, ccooomomomorbrbrbididitititieieies,s,s aaandndn in-
by guest on May 29, 2018
http://circ.ahajournals.org/D
ownloaded from
DOI: 10.1161/CIRCULATIONAHA.114.009985
6
procedure, Medicare Severity-Diagnosis Related Groups (MS-DRGs) were assigned based on
the primary indication for hospitalization and procedures performed during that admission. Costs
were then assigned based on mean 2010 Medicare reimbursement rates for the MS-DRG
obtained from the Medicare Part A data files.19
Physician Costs
Physician fees for PCI and CABG procedures (including those for the primary surgeon, surgical
assistant, and anesthesiologist) were based on the 2010 national Medicare fee schedule. Non
procedure-related physician fees for revascularization-related hospitalizations were estimated for
U.S. patients on the basis of post procedure ICU and non-ICU length of stay and Medicare
payment rates. For non-U.S. patients, postprocedure length of stay after CABG and PCI was
estimated from regression models developed using 2010 MedPAR data and the same covariates
as used in the cost models (eTable 2), along with PCI and CABG-specific ratios of ICU vs. total
post procedure length of stay estimated from the trial data for U.S. patients. Physician costs for
all other hospitalizations were estimated as a percentage of hospital costs according to the
Medicare Severity-Diagnosis Related Group.20, 21
Outpatient Costs
Costs for outpatient visits, tests and procedures, and inpatient rehabilitation and skilled nursing
facility days were estimated using 2010 Medicare reimbursement rates. Outpatient medication
use was assessed at each follow-up visit, and costs were assigned using the most current average
wholesale prices from Micromedex Red Book.16
Quality of Life
Quality of life was assessed directly from patients at baseline and at 1, 6, 12, 36, and 60 months
using the EuroQOL (EQ-5D) health status instrument and converted to utility weights (range 0-
payment rates. For non-U.S. patients, postprocedure length of stay after CABGG aaandndd PPPCICICI wwwasasa ff
estimated from regression models developed using 2010 MedPAR data and the same covariates
ass uuuseseseddd ininin ttthehehe cosossttt mom dels (eTable 2), along wittthh h PPCCI and CABGGG-s- peeciciciffific ratios of ICU vs. total
poststt procedurere lllenenengtthhh offf sstatatayy y eesestitimmmaatateedd ffrommm ttthe tttriiaal dadadatata ffforrr UU.S.S.. papatititiennntsts... PhPhP ysysicici iaiaian n cooosststss fooor
alllll otototheheherr hohoospspspititalallizzzatatioioonsnss wwerrre ee esesestititimammateteed dd asasas aa pepepercrccennntataagegege oooff f hohoospsps ititalalal cocoostss s acacccococordrdr ininngg g too thhehe
Medicare Sevevverereritity-y-y DiDiD aaagngng osososisiss RRRelele atata edede GGGrorooupupup..202020, 212121
by guest on May 29, 2018
http://circ.ahajournals.org/D
ownloaded from
DOI: 10.1161/CIRCULATIONAHA.114.009985
7
1) using an algorithm developed from the U.S. population.22
Statistical Analysis
To account for the slightly higher withdrawal rate among patients assigned to CABG, a modified
intention-to-treat (mITT) population was used as the primary population for economic analysis.
This population was defined as all randomized patients who underwent 1 initial
revascularization procedure (n=1766), with patients categorized according to their assigned
treatment. Since virtually all of the patients who did not undergo revascularization withdrew
from the trial within the first 6 months of follow-up, the MITT approach is preferred because it
includes initial revascularization costs for all patients while yielding survival estimates that are
virtually identical to those for an ITT analysis using censored data. A secondary analysis used
the per protocol (PP) population and included only those patients who underwent the assigned
revascularization procedure (n=1739).
Categorical data are reported as frequencies, and continuous data are reported as mean ±
standard deviation. Discrete variables were compared using Fisher exact tests. Normally
distributed continuous variables were compared using Student t-tests, and non-normally
distributed data were compared using the Wilcoxon rank-sum test. Treatment effects from
Poisson regression models were used for the comparison of hospitalization rates. Kaplan-Meier
estimates and log-rank tests were used for the comparison of 5-year clinical events. Cost data are
reported as both mean and median values and were compared using t-tests.23 Confidence
intervals for the differences in costs between treatment groups were obtained via bootstrapping
(1000 replicates).24
Quality-adjusted life expectancy was calculated for each patient as the time-weighted
average of his/her utility values. The mid-point between assessments was used as the transition
virtually identical to those for an ITT analysis using censored data. A secondary y annnaalysysysisiss uuuseses dd
he per protocol (PP) population and included only those patients who underwent the assigned
eevavaascscculululararrizizizatata ionn n pprprocedure (n=1739).
Categororicicicaall dddatata ararreee rerereppoportrttededed aass ffreqqueueuencieeess,, andndnd ccoonnttitinunuouuus dd dadadataa aareree rrrepepororrteeed d d aaas mmmeaeaann n ±
ttananndadadardrdr ddeveveviiaiatitiononon.. DiDiiscsccreretete vvvararriaiaiablblbleses wwwerereree e cocoompmpmparareded uusisisingngng FFFisisi hhher rr exexe aaactt tetestststs.s. NNoorormmamallllly y
distributed cocontntntinini uououoususus vvvarriaiaiablblblesss wwwererre e cococompmpmparararededed uuusisis ngngng SSStututudededentntnt ttt-t-ttessststst ,, ananandd d nonon n-n-n nononormrmrmalala ly
by guest on May 29, 2018
http://circ.ahajournals.org/D
ownloaded from
DOI: 10.1161/CIRCULATIONAHA.114.009985
8
between health states, starting at the 30-day visit. Missing utility values were estimated using
multiple imputation, taking into account baseline patient characteristics, clinical events including
hospitalizations, and previous utility values.
In-Trial Analysis of Costs, Life years, and Quality-Adjusted Life Years
Since not all patients had complete 5-year follow-up data, methods for the analysis of censored
data were used to obtain estimates of cumulative costs and quality-adjusted life-years (QALY) at
each follow-up timepoint. 25 We used Kaplan Meier methods to estimate survival at each follow-
up timepoint, and life expectancy differences were estimated as the area between the 2 survival
curves. For costs, an inverse probability-weighted estimator was applied, whereby the time axis
was divided into 3-month intervals, and costs for each interval were estimated as the observed
costs during the interval for patients with complete data divided by the probability of not being
censored within the interval. Similar methods were applied to estimate QALYs. The bootstrap
method was used to calculate the confidence limits for the mean cumulative cost, life-year, and
QALY estimates for each treatment group, as well as the difference between groups.24
Cost-Effectiveness
The cost-effectiveness of CABG vs. PCI was assessed over a life-time horizon using QALYs as
the measure of health benefit for the primary analysis, and life-years for secondary analyses.26
Costs, life-years, and QALYs were discounted at 3% per year for all cost-effectiveness
calculations.27 The lifetime analyses were based on a combination of (1) observed in-trial cost
and quality of life data and (2) projections of post-trial costs, life expectancy and quality-
adjusted life expectancy obtained from a Markov disease-simulation model. In this model, each
surviving patient was assumed to face a monthly risk of death, with estimates of this risk based
on the age-, sex- and race specific risk of death obtained from U.S. life tables, which were
was divided into 3-month intervals, and costs for each interval were estimated as s ththheee obobobseseservrvrveeded
costs during the interval for patients with complete data divided by the probability of not being
ceensnsnsororrededed wwwititithhhin n thththee interval. Similar methods weweerere applied to estitiimamm tetee QQQALA Ys. The bootstrap
mmetththod was uusesed dd ttto ccalaa ccuculalalatetee ttthehe cccoononffiiddeenceee lllimittts forrr tthhehe mmmeaeann ccuumumulalatttivevee cccosost,t, llififife-e-yyeyeaarar,, ananand
QAQAALYLYLY eeststimimimatatesess fffororo eeeacacch h trt eaeaeatmtmmenenenttt grgrrouououpp,p, aaas wewew llll aaas ththt eee dididifffferererenenncecece bbeeetwweweenenn gggroror upupupsss.24
Cost-Effectiivevevenenen ssssss
by guest on May 29, 2018
http://circ.ahajournals.org/D
ownloaded from

DOI: 10.1161/CIRCULATIONAHA.114.009985
9
calibrated to match the observed 5-year mortality for the SYNTAX PCI population.15, 28
For the CABG group an additional multiplicative factor was applied to project the benefit
of CABG vs. PCI on mortality. This multiplier was based on the hazard ratio (HR) derived from
an analysis of all-cause mortality from the SYNTAX patients. In a sensitivity analysis, the
separate impact of non-fatal myocardial infarction (MI) and stroke on long-term mortality was
taken into account. For these secondary analyses, HRs were obtained from a Cox proportional
hazards regression model fit to the trial data, in which non-fatal MI and stroke were each
modeled as time-dependent covariates, and baseline characteristics (age, sex and diabetes) and
treatment group were included as fixed covariates. Patient-level costs and utility weights for each
projected year of life beyond the trial observation period were derived from regression models
developed from the in-trial data (eTables 3 and 4).
Three sets of analyses were performed based on alternative assumptions regarding the
duration of the prognostic benefit of CABG relative to PCI. The base case analysis assumed that
the benefit of CABG tapered in a linear fashion from year 5 to 10 and that there were no
prognostic differences between PCI and CABG beyond year 10 (i.e. HR=1 after year 10). In
sensitivity analyses, we assumed that (1) prognostic benefits of CABG would remain constant
from year 5 to year 10, with no benefit of CABG after 10 years; or 2) that there would be no
further prognostic benefit of CABG beyond the 5-year trial observation period (i.e. HR=1 after
year 5).
Bootstrap methodology (1000 replicates) was used to estimate uncertainty in the joint
distribution of lifetime cost, life-years, and QALYs for each treatment group. To maintain
consistency of the within-trial and post-trial CABG effect within each bootstrap sample, the HRs
for the effect of CABG vs. PCI on mortality were re-estimated for each bootstrap replicate. All
projected year of life beyond the trial observation period were derived from regrereesssioioi nn n momomodededelsls
developed from the in-trial data (eTables 3 and 4).
ThThThrerereee seetststs ooof f analyses were performed babaaseses dd on alternativevee asssumumumptions regarding the
dduduraaratit on of the e pprrooognonoosttticicic bbbenenenefefitit oof f f CACACABGBG reeelatiivveee tooo PPPCICII. TThThee bbaases cccassse e aananaalalysysisisi aaassssummmededed thhhat
hhe e e bebebenenen fifitt ofofof CCABABABG G tttappeperred dd ininn aaa lllininineaeaar r fafafashshshiononon ffrroromm m yeyeyeararar 555 tttooo 1100 aaandndn tthahaat t thththererree wewewerrre nnno o
prognostic ddififffefeferereencncncesess bbbetweweweenene PPPCICICI aandndnd CCCABABABG G G bebebeyoyoyondndd yyyeaeaear r r 101010 (((i.e.e.e. HHHR=R=R 111 afafteteter r r yeyeyeararar 10). In
by guest on May 29, 2018
http://circ.ahajournals.org/D
ownloaded from
DOI: 10.1161/CIRCULATIONAHA.114.009985
10
analyses were performed using SAS 9.3 (SAS Institute, Cary, NC.).
Results
Patient Population
Overall, a total of 1800 patients with 3-vessel or left main CAD were randomized to either
CABG (n=897) or PCI (n=903). Of these, 27 patients assigned to CABG and 7 patients assigned
to PCI did not undergo any revascularization procedure and were excluded from the primary
mITT population for this economic analysis (Figure 1). Baseline characteristics for the mITT
population are summarized in Table 1. There were no significant differences in any observed
characteristics between the CABG and PCI groups. Of the mITT patients, 13.6% were enrolled
in the United States, 39% had left main CAD, and the median follow-up was 60 months.
Initial Treatment Costs
Among patients assigned to PCI, 98.8% underwent PCI and 1.2% underwent CABG. Among
patients assigned to CABG, 98.2% underwent CABG and 1.8% underwent PCI. Resource
utilization for the initial revascularization procedures is summarized in Table 2 (PP population).
In the PCI group, 13.6% underwent staged procedures, with 13.5% requiring 2 procedures and
0.1% requiring 3 procedures. On average, the initial PCI procedure required 2.1 guiding
catheters, 3.5 guidewires, 3.7 angioplasty balloons, and 4.5 drug-eluting stents. Although
procedure duration was longer for CABG, initial procedure costs were ~$3500 lower with
CABG as compared with PCI ($8504 vs. $11,919, P<0.001), owing to the higher costs
associated with consumable resources (including stents) for the PCI group. For the mITT
population, the difference in initial procedural costs was slightly smaller ($8482 vs. $11,866,
P<0.001), as a result of the small proportion of patients who crossed over to the alternative
characteristics between the CABG and PCI groups. Of the mITT patients, 13.6% % weweereee eenrnrnrololollelledd
n the United States, 39% had left main CAD, and the median follow-up was 60 months.
nnitittiaiaialll TrTrTreaeaeatmtmt enennttt CoC sts
AmAmAmono g patienntsts aassssigignnened dd tototo PPPCCICI, 989898.8.8% % unddderrrwennntt PCCCII anandd d 1.1.2%2%% undnddeeerwwewenntnt CCABABABG.G.G. AAAmmomonngng
papatititienenntstst aasssssigigigneneddd totoo CCABABBG,G 9998.8 2%2%2% uundndderererwewewenttt CCCABABABG G anannddd 111.8%8%8% uundndndererwewewentnt PPPCCICI. . ReReRessouuurccece
utilization foor r r thththe e inininititi iaiaial l l reevavavascss ululularara izizzatatioioion n n prprprocococedededururureseses is s sususummmmmmarararizizi ededed iiin n n TaTaTablblb e e 222 (((PPPPPP pppopulation)..
by guest on May 29, 2018
http://circ.ahajournals.org/D
ownloaded from
DOI: 10.1161/CIRCULATIONAHA.114.009985
11
treatment strategy.
Clinical events, resource utilization, and costs during the initial hospitalization are
summarized in Table 3. Post-procedural hospital costs were greater for the CABG group than
the PCI group ($19,511 vs. $8785, P<0.001), as were physician fees ($5100 vs. $2315,
P<0.001). As a result, total initial hospitalization costs were ~$10,000/patient higher in the
CABG group than in the PCI group ($33,190 vs. $23,154, P<0.001).
Follow-up Resource Utilization and Costs
Follow-up clinical outcomes, resource utilization, and costs are summarized in Table 4. During
each year of follow-up, the annual rates of repeat revascularization, diagnostic catheterization,
hospitalization, and their associated costs were higher for the PCI group as compared with the
CABG group. In addition, costs for outpatient services and medications were consistently higher
for patients assigned to initial PCI vs. CABG. Rehabilitation costs were greater in the CABG group
in the first year and were similar between treatments in the subsequent years. As a result, the
difference in cumulative medical care costs between the CABG and PCI narrowed from $10,036
after the index hospitalization to $5619 after 5 years of follow-up (Table 5 and Figure 2).
Utility Weights and QALYs
Compared with baseline, utility weights improved substantially for both treatment groups over
the course of the trial (eTable 5). At 1 month follow-up, utility weights were significantly lower
after CABG than PCI (0.77 vs. 0.85, P<0.001), reflecting the longer recovery period following
CABG. This early utility benefit of PCI was no longer apparent at 6 months, however. As a
result of the early difference in favor of PCI, cumulative quality-adjusted life-years were lower
with CABG than with PCI through 3 years of follow-up (Table 5). By the end of year 5,
however, life expectancy (4.70 vs. 4.60 years) and quality-adjusted life expectancy (3.91 vs. 3.87
hospitalization, and their associated costs were higher for the PCI group as compaarrred dd wwiwiththth ttthehehe
CABG group. In addition, costs for outpatient services and medications were consistently higher
foor r papapatititienentststs aassssiggnenened d to initial PCI vs. CABG. Reeehhahabbbilitation costss wwweree gggrrereater in the CABG group
nn thhehe first yeaar r aannddd weweereee ssimimimilililaarar bbetete wweweenenn treeatatmmmennntss in tthhehe ssububbseseqququenent t yyyeaarars.s. AAAs s a a rrressusultltlt, thththee
didifffffferererenenencece iiin n n cucumumumulalatitivveve mmedddicici alalal cccararare e ccocostststsss bbbetwtwtweeeeenn ththee CACACABGBGBG aandndnd PPPCCIII nnanarrrrowowoweded fffrororom m m $1110,0,0003666
after the indeex x x hohoh spspspitititalallizizzatioioion n n totoo $5$5$56161619 afafafteteter r r 555 yeyeyearara sss ofofo ffolololloloow-ww upupup ((TaTaTablblble e e 555 aaandndn FiFiFigugugurerere 2).
by guest on May 29, 2018
http://circ.ahajournals.org/D
ownloaded from
DOI: 10.1161/CIRCULATIONAHA.114.009985
12
QALYs) were both greater with CABG than with PCI.
Lifetime Cost-Effectiveness- Overall Population
Results from the lifetime cost-effectiveness analyses are summarized in Table 6. Based on the
observed 5-year results, the estimated mortality hazard ratio for CABG vs PCI was 0.80 (95% CI
0.61-1.05). When these results were used to project clinical and economic outcomes beyond the
trial period (Figure 3), we estimated that CABG would be associated with lifetime incremental
costs of $5081 (95%CI, $1802 to $8241) compared with PCI together with a gain in life
expectancy of 0.412 years (95% CI, -0.060 to 0.831) and a gain in quality-adjusted life
expectancy of 0.307 QALYs (95% CI,
-0.105 to 0.378),
The resulting incremental cost-effectiveness ratio (ICER) for CABG vs. PCI was
$16,537/QALY gained, with 84.7% of bootstrap replicates falling below a societal willingness-
to-pay threshold of $50,000/QALY (Figures 4 and 5, and Table 6/row 1). When outcomes were
assessed in life-years, CABG was associated with an ICER of $12,329/life-year gained (Table
6/row 2). When the analysis also accounted for the prognostic impact of non-fatal MI and stroke,
the benefit of CABG increased modestly to 0.338 QALYs, and the ICER improved to
$15,758/QALY gained with 87.7% of bootstrap replicates falling below a societal willingness-
to-pay threshold of $50,000/QALY (Figure 5, Table 6/row 4).
These results were robust across a wide range of alternative assumptions regarding the
duration and magnitude of the benefit of CABG over PCI on both survival and costs beyond the
timeframe observed in the trial. When we assumed that the benefits of CABG would remain
constant from year 5 to year 10, with no further benefit beyond 10 years, the ICER for CABG vs.
PCI improved to $10,695/QALY gained. Under the conservative assumption of no benefit of
0.105 to 0.378),
The resulting incremental cost-effectiveness ratio (ICER) for CABG vs. PCI was
$116,6,6,5353537/7/7/QAQAQALYLL gggaaiainned, with 84.7% of bootstrappp rreepplicates falling g g belolooww w a societal willingness-
oo-pppaya threshooldldd off $5$5$50,0,0000000/0/0/QAQAQALYLYY ((FFigggurees 44 annndd 5, anannd d TaTaablblee 666/r/rowoww 11).). WWWhehen nn ououutctcomommeses wwwere
asssesesesssssedede iin nn lililifefe-y-yyeaaarsrs,,, CCAABGBGG wwwasasas aaassssoocociaiaiateteteddd wwwitithhh aanan IIICECEERR R ofoff $$12121 ,3,3,3292929/liifife-e-yeyey arara gggaiaiineneddd (((d TaTabbbleee
6/row 2). Wheheen n n ththheee anananalalalysysisisis aaalssooo acacaccococ unununteteted d d fofofor r r ththhe e e prprprogggnononostststicicic iiimpmpm acacact t t ofofof nnnononon-f-ffatatatalalal MMMII and strokeee,
by guest on May 29, 2018
http://circ.ahajournals.org/D
ownloaded from
DOI: 10.1161/CIRCULATIONAHA.114.009985
13
CABG beyond the 5-year trial period, the ICER increased to $27,485/QALY gained with 74.8%
of the bootstrap replicates below the $50,000 per QALY gained threshold. Results were also
similar when the analysis incorporated the prognostic impact of non-fatal MI and stroke, or when
effectiveness was expressed in life-years rather than QALYs (eTables 7 and 8).
Subgroup Analyses. Results from prespecified, subgroup analyses are summarized in eTable 6
(observed 5-year results) and Table 7 (lifetime projections). For most subgroups, the results
were consistent with those of the overall trial population albeit with greater uncertainty due to
the reduced sample sizes. There were 2 subgroups with results that differed substantially from
those of the overall trial, however. For patients with less complex coronary anatomy (SYNTAX
Score 22), PCI was projected to improve increase quality-adjusted life expectancy and to
reduce costs compared with CABG. For this subgroup, the probability that CABG would be
economically attractive at an ICER of $50,000/QALY was only 18.3%. In contrast, for patients
with SYNTAX Scores of 23-32 and 33, the ICERs for CABG vs. PCI were $36,790/QALY
gained and $8219/QALY gained, respectively. PCI was also projected to be an economically
dominant strategy for patients with left main CAD, whereas CABG appeared to be highly
economically attractive compared with PCI for patients with 3-vessel disease (ICER
$4905/QALY gained). For all other patient subgroups, CABG was projected to be economically
attractive compared with PCI with ICERs <$35,000/QALY gained. Results for subgroups were
largely unchanged under alternative assumptions regarding the duration and magnitude of the
benefit of CABG over PCI, and when we considered the impact of non-fatal MI and stroke on
mortality (eTables 7 and 9).
Impact of Stent Pricing and Productivity Losses
Since DES prices in the US continue to decrease each year, we performed a sensitivity analysis
Score 22), PCI was projected to improve increase quality-adjusted life expectananncycycy andndnd tttoo o
educe costs compared with CABG. For this subgroup, the probability that CABG would be
ecconononomomomiicicalalallylyly attttrararactctive at an ICER of $50,000/QAQAQALLY was only 118.8 3%%%. IIn contrast, for patients
wwithhh SYNTAX X SScScororesess oooff 22323-3-3-322 ananndd d 3333, theee IIICEERRss fooorr r CACAABBGBG vvvss.. PPCCII wwwererre e $$3$36,6 7979790/0/QAQAQALYLYY
gagainininededed aaandndnd $$$828219119/Q/Q/QALAALYY Y gag inininededed, rererespspecece tititivevevelylyy.. PPPCICII wawawasss alalalsosos ppproroojejejectctctededd ttoo o bebee aan nn ecececoononomommiicicalalllyly
dominant strtrratatategegegy y y fofofor r papapatit enenentststs wwwititith h lelel ftftt mmmaiaiainnn CCCADADAD,,, whwhw ererereaeaeas s s CACACABGBGBG aaappppppeaeaearerered d tototo bbbe e e hihihighg ly n
by guest on May 29, 2018
http://circ.ahajournals.org/D
ownloaded from
DOI: 10.1161/CIRCULATIONAHA.114.009985
14
on the acquisition cost of DES (Figure 6). Although the ICER for CABG vs. PCI increased as
the acquisition cost of DES decreased, even at a DES price of $0, the ICER for CABG vs. PCI in
the overall study population remained <$40,000/QALY gained. When this sensitivity analysis
was repeated within strata according to SYNTAX Score, only the intermediate SYNTAX Score
tertile was sensitive to stent price (eTable 10). For patients with a SYNTAX Score 22, the PCI
strategy remained economically attractive unless the stent price exceeded $4880/stent, while for
patients with a SYNTAX Score 33, CABG remained economically attractive at all stent prices.
Among patients with SYNTAX Scores between 23 and 32, however, the ICER for CABG vs.
PCI remained <$50,000/QALY gained only if the stent price were >$1195.
Finally, we performed a sensitivity analysis to assess the impact of productivity loss on
the cost-effectiveness of CABG vs. DES-PCI. Since no data on employment were collected from
the SYNTAX trial patients, we used several external sources to estimate the proportion of
patients employed at baseline, the timing of return to work according to the type of
revascularization procedure, and the average earning for a US worker.9, 29 With incorporation of
these factors, the cost difference between the treatments increased by ~$1000 for the overall
population, reflecting the higher productivity loss with CABG compared to PCI, but the ICER
for CABG vs. PCI remained <$20,000/QALY gained (eTable 11). When this additional analysis
was repeated for subgroups according to SYNTAX Score tertile and LM or 3-vessel disease
subgroups, the outcomes were similar to the main analyses that did not incorporate productivity
losses.
Discussion
SYNTAX is the first study to directly compare the long-term clinical and economic outcomes of
Finally, we performed a sensitivity analysis to assess the impact of produucctc ivivvitty y y lololossssss oon n
he cost-effectiveness of CABG vs. DES-PCI. Since no data on employment were collected from
hhe e SYSYSYNTNTNTAXAXAX tririialalal ppatients, we used several exteernrnr aal sources to esesstit mamatetete tthe proportion of
patiiieents emplooyeyeedd att bbbasssellelininine,e,, tthehe tttiimimiiningg off reeeturnnn tto wwwoorork k accccocorrdrdining toto tthehee ttyypypee ofofo
eevavaascsccululularararizizizaatatioionnn prprprococcededdururu e, aaandndnd ttthhhe e avavvererragagageee eaeaearnrnninnngg g fofofor rr aa a USUSUS wworororkekeker.r..999, 22929 WWWititithhh ininincococorprppororatata ioioonn ofofo
hese factorrs,s,s ttthehehe cccososost t dididifff erererenenenceee bbbetettweweweenenen ttthehehe tttrerereatata memementnts s s ininincrcrcreaeaeasesesed d bybyby ~~~$1$1$10000000 0 fofofor r r ththheee ovo erall
by guest on May 29, 2018
http://circ.ahajournals.org/D
ownloaded from
DOI: 10.1161/CIRCULATIONAHA.114.009985
15
DES-PCI vs. CABG for patients with 3-vessel or left main CAD. As such, this economic
substudy provides a number of critical insights about the optimal revascularization strategy for
such patients. First, we found that despite substantially higher procedural costs, DES-PCI is
substantially less costly than CABG in the short term. Second, although CABG was associated
with improved clinical outcomes and reduced follow-up resource utilization, cumulative costs
remained lower with DES-PCI (by ~$5000/patient) at 5 years and over a lifetime horizon. Third,
although differences in life expectancy and quality-adjusted life expectancy were small over the
5-year timeframe of the trial (0.100 years and 0.044 QALYs, respectively), the incremental life
expectancy and QALY gains with CABG increased considerably when projected over a patient’s
lifetime. As a result, the lifetime incremental cost-effectiveness ratio for CABG vs. DES-PCI
was ~$16,500/QALY gained and ~$12,500/LY gained—values that compare favorably with
many other accepted therapies in the context of the US healthcare system.30, 31 Moreover, while
SYNTAX did not demonstrate a “statistically significant” difference in 5-year mortality between
CABG and DES-PCI, these main findings were robust to both stochastic uncertainty analyses
(i.e., bootstrapping) and to a variety of alternative assumptions regarding the durability of
benefit, the prognostic impact of non-fatal events, and stent pricing. In general, the economic
outcomes of the SYNTAX trial mirrored the clinical results.
Although the results of the overall trial were robust, subgroup analyses demonstrated
several key cohorts with results that diverged from those of the main SYNTAX population.
Specifically, among patients with left main disease or SYNTAX Score 22, DES-PCI was
projected to be an economically dominant strategy that resulted in similar or greater quality-
adjusted life expectancy and lower lifetime costs compared with CABG. Although these results
were not definitive (due mainly to uncertainty with respect to long-term survival differences),
ifetime. As a result, the lifetime incremental cost-effectiveness ratio for CABG G vsvs... DEDEDES-S-S PCPCPCII
was ~$16,500/QALY gained and ~$12,500/LY gained—values that compare favorably with
mamanynyny ooothththererer aacccepeppteteted d therapies in the context of thththee US healthcareee syststememem.30, 31 Moreover, while
SSYSYNNNTAX didd nnooot dememmononnstststrararatetete aa “““ststtata iissttiicallllly signnniifficananant”t” dddiffffefererennnce e ininin 555-yyyeaeaearr momoortrttalalalititity bebbetwtwtweeeenff
CACAABGBGBG aandndd DDDESES-P-PPCICI,,, thhhesese mmamaininin fffininindidiingngngss s wewwererere rrobobobusustt t totoo bbbototh h h ststtococchahahaststticc uuncncncererrtataininintytyty aanananalylysesees
i.e., bootstrapapappipipingngng) ) ) anannd d d too aaa vvvaariririetete y y y ofoff aaaltlttererernananatitiivevee aaasssss umummptptptioioionsnss rrregege ararardididingngng ttheheh dddurururabababilililititi y of
by guest on May 29, 2018
http://circ.ahajournals.org/D
ownloaded from
DOI: 10.1161/CIRCULATIONAHA.114.009985
16
these findings suggest that DES-PCI may be the preferred strategy for patients with less
anatomically complex CAD on both clinical and economic grounds. In contrast, among patients
with 3-vessel disease or with anatomic SYNTAX Scores 32, CABG was strongly favored on
economic grounds with ICERs <$10,000/QALY gained and a <6% probability that the ICER
exceeds $50,000/QALY gained. While subgroup analyses are typically considered “hypothesis
generating” when interpreting clinical trial results, cost-effectiveness analysis is driven by
measures of absolute cost and benefit that may be more susceptible to meaningful interactions.
As such, subgroup effects in cost-effectiveness analysis are frequently considered to be valid
considerations for guideline development and health care policy—particularly when the results
are supported by appropriate uncertainty analyses and are consistent with the underlying
pathophysiology.32
The finding that our results were only minimally sensitive to stent pricing was somewhat
surprising. Although device prices are commonly perceived to be an important determinant of
their cost-effectiveness,33 when comparing DES-PCI vs. CABG, we found that the major
determinant of cost-effectiveness was the gain in life expectancy rather than the cost difference,
per se. Consequently, there was no device cost at which DES-PCI would be economically
attractive compared with CABG in either the overall trial population or in patients with a high
SYNTAX Score. Only among patients with an intermediate SYNTAX Score (where the gain in
quality-adjusted life expectancy with CABG was minimal) would DES-PCI become the
economically preferred therapy if the device cost were reduced by ~20% from current levels.
Comparison with Previous Studies
These findings contrast with those from our previous cost-effectiveness analysis of DES-PCI vs.
CABG based on the 1-year SYNTAX trial results, in which we reported that DES-PCI was an
are supported by appropriate uncertainty analyses and are consistent with the undndderrlylyl inininggg
pathophysiology.32
ThThTheee fififindndininnggg tht at our results were only mimiinnnimmmally sensitivee tot sstetetenntnt pricing was somewhat
uurppprir sing. Altlthohoh uugugh hh dedeeviivicecece pppririceceess aareee cccommmmoonlyyy ppperccceeieiveved toto bbbee anan iiimpmpm ororrtatatantnt dddetete eerermmim nananantntt ooff
hheieieir r cococostst-e-eeffffffecectitiveveenenessss,333 wwhhehen n cococompmmpaararininng gg DEDEDES-S-S PCPCPCI vvvs. CACACABGBGBG,, wewewe ffooounndnd ttthahahatt t ththheee mamamajjojor r r
determinant ofofof cccososst-t-t efefffefefectivivvenenenessssss wawawas thththe e e gagagaininn iiin n n liliifefefe expxpxpececectatatancncncy y y raaathththererer ttthahahan n n thhhe e e cococoststst ddifference,
by guest on May 29, 2018
http://circ.ahajournals.org/D
ownloaded from
DOI: 10.1161/CIRCULATIONAHA.114.009985
17
economically dominant strategy.34 Compared with that previous report, the initial cost difference
in favor of DES-PCI has increased from ~$5000/patient to ~$10,000/patient—changes driven
largely by the substantial reduction in DES prices over the last 4-5 years (from $2200/stent to
$1500/stent). Another important difference between the 2 studies is the cost difference in the
first year of follow-up, which decreased from ~$2300 in the original study to ~$1700 in the
current study— due mainly to reductions in the cost of dual antiplatelet therapy with the
approval of generic clopidogrel. The most important difference between the 2 studies was that in
the 1-year study, quality-adjusted life expectancy favored DES-PCI (reflecting the early QOL
and survival advantage), whereas in the current study, quality-adjusted life expectancy was
greater with CABG. These differences highlight the importance of basing policy decisions on
clinical trials with sufficiently long follow-up to allow prognostically important benefits to
emerge. Although many third-party payers in the US are more concerned with a 1-3 year time
horizon than a lifetime horizon, the results of our study demonstrate how analyses that focus
solely on short-term economic and clinical outcomes may fail to incorporate the full benefits of
the more effective therapy and arrive at misleading conclusions.
Numerous previous studies have sought to evaluate the relative cost-effectiveness of PCI
vs. CABG for patients with multivessel CAD.7, 9, 15, 28, 35-39 However, most of these studies are
limited by relatively short follow-up durations,7, 34, 36, 39 or by focusing solely on costs without
performance of a formal cost-effectiveness analysis.35 In addition, no studies to date have
examined the cost-effectiveness of PCI vs. CABG for patients with left main disease. With
respect to methodology and duration of follow-up, our study is most comparable to economic
evaluations performed alongside the BARI and FREEDOM trials. In BARI, the ICER for
CABG vs. balloon angioplasty was ~$14,000/life-year gained over a 12 year follow-up period
greater with CABG. These differences highlight the importance of basing policcyy y deded ccicisisis ononons s s onon
clinical trials with sufficiently long follow-up to allow prognostically important benefits to
emmererergegege. AAAltltlthohh ugugghhh mmany third-party payers in thhhee e UUUS are more conono ceernrnneeded with a 1-3 year time
hhohoririizoz n than aa lllififi eettimmee hohohoriririzozozonn,n, tthhehe rreessuullts ooof our sttuudy y y ddedemomomonsnstttraattee hohohowww anannalalalysysesess ttthahahatt t fofoocucusss
oolelelelylyly ooon n shshhoroort-t teteermrmm eecocoononomimimicc ananandd d cclclininnicccalalal oooutututcococ mememes mamamayy y ffafaililil ttoo o innncococ rprprpoorratatee e thththee fufufulllll bbenenenefefititss oofof
he more efffececctititivevee ttheheh rararapypy aaandndn aaarrrrrrivivve ee atatat mmmisisisleleleadadadininngg g cococ ncncclululusisisiononons.s.s.
by guest on May 29, 2018
http://circ.ahajournals.org/D
ownloaded from
DOI: 10.1161/CIRCULATIONAHA.114.009985
18
28—results that are quite similar to those from the SYNTAX trial. In contrast to SYNTAX,
however, BARI found that for patients with 3-vessel CAD costs were actually lower with CABG
than PCI over 5 years of follow-up.9 It is likely that these differences between trials reflect the
much lower rate of repeat revascularization procedures after PCI seen in SYNTAX as compared
with BARI with the introduction of effective drug-eluting stents (26% vs. 54%).3, 12
FREEDOM is the only other trial to compare the cost-effectiveness of PCI vs. CABG in
the DES era and demonstrated that for patients with diabetes and multivessel CAD, CABG is
highly cost-effective compared with DES-PCI with an ICER of ~$8000/QALY gained.15
Although these overall results are relatively similar to those seen in SYNTAX, in FREEDOM
CABG was economically attractive across the full range of SYNTAX Scores whereas in
SYNTAX, CABG was only attractive for patients moderate to high degrees of angiographic
complexity (SYNTAX Score >22). These findings may relate to underlying differences in
atherosclerosis between patients with vs. without diabetes or may reflect the fact that diabetic
patients often have additional conditions (e.g. renal dysfunction, peripheral artery disease) that
confer higher cardiovascular risk.13 Of note, patients with left main coronary disease were not
studied in either BARI or FREEDOM.
Limitations
Our study has several important limitations. First, our economic analysis was performed from the
perspective of the U.S. healthcare system, although the SYNTAX trial enrolled patients from 18
countries. To address this issue, costs associated with the index procedures were estimated from
detailed resource use, which would not be expected to differ by geography. Since hospital length
of stay differs across countries, all other costs were estimated using methods that were
independent of length of stay and depend only the assumption that clinical outcomes and
CABG was economically attractive across the full range of SYNTAX Scores whheeereaee ss ininin
SYNTAX, CABG was only attractive for patients moderate to high degrees of angiographic
coompmpmplelele ixixitytyty (((SSYSYNTNTNTAXA Score >22). These findiingngn ss may relate too uuunddererrlylylyini g differences in
attheeeror sclerosiiss bebb ttwtweeeeen n papaattitienenentsts wwwiiththt vvss. wiitthhout ddiiabeeetetees s ooor mmaaay rereflflleeectt ththeee ffafactct ttthahahatt ddid abababetetticici
papatititienenntstst ooftftftenenen hhaavvee e adaddidititit ono alalal ccononondididititiononns ss (e(e(e..g.g. rerer nnanall dydyysfffunununcctioioion,n, pperereripipheheheraral l arara teteteryryry dddiiseeaasesee) ) ththhatatt
confer higheer r cacacardrddioioiovavaascscsculllararar rrrisssk.k.k.131313 OfOff nnototo e,e,e pppatata ieiei ntntntss s wiwiwiththth lllefefeft t t mamam innn cccorororonononararary y dididiseseseasasa ee e were not
by guest on May 29, 2018
http://circ.ahajournals.org/D
ownloaded from

DOI: 10.1161/CIRCULATIONAHA.114.009985
19
procedural complications are similar across healthcare systems.40 Although it would have been
possible to exclude all non-US patients from our analysis, this would have markedly reduced our
sample size and added considerable variability to the results. It is nonetheless reassuring that our
main results were consistent between patients enrolled in the US compared with other countries.
Second, the need for lifetime extrapolations required several assumptions regarding the
impact of CABG on long-term survival, health care costs, and quality-of-life. To the greatest
extent possible, we used empirical data from the trial to inform these assumptions and examined
the impact of plausible alternatives in sensitivity analyses, the results of which were similar to
our primary results. Third, all DES patients in the SYNTAX trial were treated with paclitaxel-
eluting DES. Recently, second-generation DES have demonstrated lower rates of MI, target
vessel revascularization, and stent thrombosis as compared with first-generation DES.41
Therefore, the cost results of the current study may not be generalizable to patients treated with
second-generation DES. It is unlikely that the main results of our analysis would change
substantially with use of second generation DES, however, since there is no evidence that these
devices reduce mortality compared with the paclitaxel-eluting stents that were used in
SYNTAX.41 Finally, PCI in the SYNTAX trial did not incorporate routine use of physiologic
guidance—a technique that has recently been shown to both improve clinical outcomes and
lower long-term costs compared with angiographic guidance.42, 43 Future trials comparing
physiologically-guided PCI vs. CABG will be required to determine the overall cost-
effectiveness of this strategy.
Conclusions
Based on the results of the SYNTAX trial, for most patients with 3-vessel or left main CAD
eluting DES. Recently, second-generation DES have demonstrated lower rates ofoff MMMI,I ttarrargegeget t t
vessel revascularization, and stent thrombosis as compared with first-generation DES.41
Thherererefefefoorore,ee, tttheheh cosososttt rresults of the current study mmmayaya not be generaalilil zablbllee e toto patients treated with
eecooondn -generatatioioionn DEDEDES.S.. IIIttt isisis uuunnlilikekekelylyl tthhaat thhhe maainin resssuulultsts oofff oouuur aananalylylysiiis wowowoululd d chchchanana ggege f
uubsbsbstatatantntn iaiallllly y y wiwitthh uuusese off f sesecooondndd gegegenneneraraatitiiononon DDEESES, ,, hohoowwewevevever,r,r, sininincecee tthehehereree iss nonoo eeviviv dedeencncnce ttthaatat tthhhessese
devices reduucecee mmmororortatat liliitytyy ccomomompapaarerered d wiww ththth ttthehehe pppacacacliliitataaxexex l--elelelutututinining g g stststenene tststs ttthahahat t t wewewereree uuusesesedd d inini
by guest on May 29, 2018
http://circ.ahajournals.org/D
ownloaded from

DOI: 10.1161/CIRCULATIONAHA.114.009985
20
without recent MI, CABG is a clinically and economically attractive revascularization strategy
compared with DES-PCI. However, among patients with less complex disease, DES-PCI may be
preferred on both clinical and economic grounds. These findings provide additional support for
existing guidelines and underscore the importance of ongoing studies to define the optimal
revascularization strategy for patients with left main disease.
Acknowledgments: Authors’ Contributions: Cohen and Osnabrugge had full access to all of the
data in the study and take responsibility for the integrity of the data and the accuracy of the data
analysis.
Study concept and design: Serruys, Mohr, Cohen
Acquisition of data: Serruys, Mohr, Cohen
Analysis and interpretation of data: Osnabrugge, Wang, Li, Chinnakondepalli, Abdallah, Villain,
Magnuson, Cohen
Drafting of the manuscript: Osnabrugge, Cohen
Critical revision/approval of the manuscript for important intellectual content: Wang,
Magnuson, Li, Chinnakondepalli, Pinto, Abdallah, Villain, Morice, Dawkins, Kappetein, Mohr,
Serruys
Statistical analysis: Wang, Li, Chinnakondepalli, Magnuson
Obtained funding: Serruys, Mohr, Cohen
Administrative, technical, or material support: None
Study supervision: Cohen
Role of the Sponsors: The industry sponsors reviewed the study design and were involved in
data management for the SYNTAX trial. The sponsor had no role in the analysis and
interpretation of the data or in the preparation of the manuscript.
Disclaimer: The views expressed in this article represent those of the authors and do not
necessarily represent the official views of the sponsors.
y p g y , ,
Acquisition of data: Serruys, Mohr, Cohen
Analysis and interpretation of data: Osnabrugge, Wang, Li, Chinnakondepalli, Abdallah, Villain
Magnuson, CoC hen
DrDrrafafafttitinng oof ff thththe mamanuscrir ptpt: Ossnan brruguggeg , Cohen
CCCritttical revisioion/n/n apappprprrovovvallal oof f f thththe mamamanuuuscccriptt ffofor immmppporrtrtaanant t inintelllleccctualall cooonteteenntnt:: WWWannng,g,
MaMaMagngngnususon, , LiLiLi,, CChChininnanaakkoondndeepepaalallili, , PiPiPintnto,o, AAbbdbdaalallalahhh, ViVilllllaaiain,n, MMMororiiicee,e, Dawawawkikinnns, , KaKappppppeeeteeiinn,, MMohohhr,
Serrrruyuys
Statistical anannalalalysysysisisis:: WaWaWanngng, LiLiLi, ChChChininnnnnakokokondnddepepepalalallilii, MaMaMagngnusuusononn
by guest on May 29, 2018
http://circ.ahajournals.org/D
ownloaded from
DOI: 10.1161/CIRCULATIONAHA.114.009985
21
Additional Contributions: We thank Kristine Roy for her administrative assistance and Randall
Richner and Mary Ann Clark for their assistance in the design of the study.
Funding Sources: This study was funded by Boston Scientific
Conflict of Interest Disclosures: Dr Cohen has received grant support from Abbott Vascular,
Astra Zeneca, Biomet, Boston Scientific, Edwards Lifesciences, Eli Lilly, Jannsen
Pharmaceuticals and Medtronic, and consulting fees from Abbott Vascular, Astra Zeneca, Eli
Lilly and Medtronic. Dr. Magnuson has received grant support from Abbott Vascular, Astra
Zeneca, Boston Scientific, Daiichi Sankyo, Edwards Lifesciences, Eli Lilly and Medtronic.
Dr. Dawkins is a fulltime employee of Boston Scientific and owns stock in Boston Scientific. All
other co-authors have no relevant financial disclosures.
References:
1. Go AS, Mozaffarian D, Roger VL, Benjamin EJ, Berry JD, Borden WB, Bravata DM, Dai S, Ford ES, Fox CS, Franco S, Fullerton HJ, Gillespie C, Hailpern SM, Heit JA, Howard VJ, Huffman MD, Kissela BM, Kittner SJ, Lackland DT, Lichtman JH, Lisabeth LD, Magid D, Marcus GM, Marelli A, Matchar DB, McGuire DK, Mohler ER, Moy CS, Mussolino ME, Nichol G, Paynter NP, Schreiner PJ, Sorlie PD, Stein J, Turan TN, Virani SS, Wong ND, Woo D, Turner MB. Heart disease and stroke statistics--2013 update: a report from the American Heart Association. Circulation. 2013;127:e6-e245.
2. Coronary artery bypass surgery versus percutaneous coronary intervention with stent implantation in patients with multivessel coronary artery disease (the Stent or Surgery trial): a randomised controlled trial. Lancet. 2002;360:965-970. 3. Comparison of coronary bypass surgery with angioplasty in patients with multivessel disease. The Bypass Angioplasty Revascularization Investigation (BARI) Investigators. N Engl J Med. 1996;335:217-225. 4. Hamm CW, Reimers J, Ischinger T, Rupprecht HJ, Berger J, Bleifeld W. A randomized study of coronary angioplasty compared with bypass surgery in patients with symptomatic multivessel coronary disease. German Angioplasty Bypass Surgery Investigation (GABI). N Engl J Med. 1994;331:1037-1043. 5. King SB, 3rd, Lembo NJ, Weintraub WS, Kosinski AS, Barnhart HX, Kutner MH, Alazraki NP, Guyton RA, Zhao XQ. A randomized trial comparing coronary angioplasty with coronary bypass surgery. Emory Angioplasty versus Surgery Trial (EAST). N Engl J Med. 1994;331:1044-1050.
References:
1. GGo o ASASAS,, MoMoMozaaffffffarara ian D, Roger VL, Benjamin EJEJEJ, Berry JD, Bordenn WWWB,B Bravata DM, Dai S, FoFoordrdrd EEES,S FFoxoxox CS,S, FFranco S, Fullerton HJ,, Gillespspiee C, Hailpern SSSMM,M HHeieitt JA, Howard VJ, HHHufffffmam n MDMDD, , KiKiKissselellaa a BMBMBM,, , KiKiKittttttnenenerr SJSJSJ,, LaLaL ckckcklalalandnd TDTD , LiLiLichchchtmtmtmanann JJH,H,H, LLLisisisababa etth h h LDLDLD,,, MaMaMagigigidd d D,D,D, MMaM rrcr us GM, Maaareeellii AAA, MaMatcttchhahar DBDBDB, MMMcGuuuirrre DKDKK, MoMoM hlhlhleeer EEER,R, MMMoy CCS,S, MMMuussolllinnoo MMMEE, NiNiNichchholol G,, Paaaynyny teteer NPNP,, SSSchrreeeinnener r PJPJJ, , SSorrlrliee PPPDD,D, SSteteinin JJJ, TuTurrarann TTNN, , Virrrannini SSSS,S, WWononnggg NDNDND,, WWWoooo D,D TTTurururnenenerrr MBMMB. HeHeHearara t t t dididiseseseasa e e ananand d d sststrorokekeke ssstatatatititissstititicscss----202020131313 uuupdpdpdatatate:e: aaa rrrepepeporororttt fffrorom mm thththe ee AmAmAmererericicicananan tttHeHeHearararttt AsAsAssososociciciatatatioioionnn. CiCiCircrcrculululatatatioioionnn. 202020131313;1;1;1272727:e:e:e66-6-e2e2e2454545.
by guest on May 29, 2018
http://circ.ahajournals.org/D
ownloaded from
DOI: 10.1161/CIRCULATIONAHA.114.009985
22
6. Rodriguez AE, Baldi J, Fernandez Pereira C, Navia J, Rodriguez Alemparte M, Delacasa A, Vigo F, Vogel D, O'Neill W, Palacios IF. Five-year follow-up of the Argentine randomized trial of coronary angioplasty with stenting versus coronary bypass surgery in patients with multiple vessel disease (ERACI II). J Am Coll Cardiol. 2005;46:582-588. 7. Serruys PW, Unger F, Sousa JE, Jatene A, Bonnier HJ, Schonberger JP, Buller N, Bonser R, van den Brand MJ, van Herwerden LA, Morel MA, van Hout BA. Comparison of coronary-artery bypass surgery and stenting for the treatment of multivessel disease. N Engl J Med. 2001;344:1117-1124. 8. Farkouh ME, Domanski M, Sleeper LA, Siami FS, Dangas G, Mack M, Yang M, Cohen DJ, Rosenberg Y, Solomon SD, Desai AS, Gersh BJ, Magnuson EA, Lansky A, Boineau R, Weinberger J, Ramanathan K, Sousa JE, Rankin J, Bhargava B, Buse J, Hueb W, Smith CR, Muratov V, Bansilal S, King S, 3rd, Bertrand M, Fuster V. Strategies for multivessel revascularization in patients with diabetes. N Engl J Med. 2012;367:2375-2384. 9. Hlatky MA, Rogers WJ, Johnstone I, Boothroyd D, Brooks MM, Pitt B, Reeder G, Ryan T, Smith H, Whitlow P, Wiens R, Mark DB. Medical care costs and quality of life after randomization to coronary angioplasty or coronary bypass surgery. Bypass Angioplasty Revascularization Investigation (BARI) Investigators. N Engl J Med. 1997;336:92-99. 10. Weintraub WS, Mauldin PD, Becker E, Kosinski AS, King SB, 3rd. A comparison of the costs of and quality of life after coronary angioplasty or coronary surgery for multivessel coronary artery disease. Results from the Emory Angioplasty Versus Surgery Trial (EAST). Circulation. 1995;92:2831-2840. 11. Serruys PW, Morice MC, Kappetein AP, Colombo A, Holmes DR, Mack MJ, Stahle E, Feldman TE, van den Brand M, Bass EJ, Van Dyck N, Leadley K, Dawkins KD, Mohr FW, Investigators S. Percutaneous coronary intervention versus coronary-artery bypass grafting for severe coronary artery disease. N Engl J Med. 2009;360:961-972. 12. Mohr FW, Morice MC, Kappetein AP, Feldman TE, Stahle E, Colombo A, Mack MJ, Holmes DR, Jr., Morel MA, Van Dyck N, Houle VM, Dawkins KD, Serruys PW. Coronary artery bypass graft surgery versus percutaneous coronary intervention in patients with three-vessel disease and left main coronary disease: 5-year follow-up of the randomised, clinical SYNTAX trial. Lancet. 2013;381:629-638. 13. Farooq V, van Klaveren D, Steyerberg EW, Meliga E, Vergouwe Y, Chieffo A, Kappetein AP, Colombo A, Holmes DR, Jr., Mack M, Feldman T, Morice MC, Stahle E, Onuma Y, Morel MA, Garcia-Garcia HM, van Es GA, Dawkins KD, Mohr FW, Serruys PW. Anatomical and clinical characteristics to guide decision making between coronary artery bypass surgery and percutaneous coronary intervention for individual patients: development and validation of SYNTAX score II. Lancet. 2013;381:639-650. 14. Ong AT, Serruys PW, Mohr FW, Morice MC, Kappetein AP, Holmes DR, Jr., Mack MJ, van den Brand M, Morel MA, van Es GA, Kleijne J, Koglin J, Russell ME. The SYNergy between
Smith H, Whitlow P, Wiens R, Mark DB. Medical care costs and quality of life aftftererer andomization to coronary angioplasty or coronary bypass surgery. Bypass Angigioopoplalal sstty yy
Revascularization Investigation (BARI) Investigators. N Engl J Med. 1997;336:9:92-2-2 999999.
10. WeW intraub WSWS,, Mauldin PD, Becker E, Kosinski AS, King SB, 3rd. A comparison of the cooststtsss ofofof aandndnd qqquaalililitytyty of life after coronary angiopppllalasstty or coronary y y sus rgrgerereryyy for multivessel cocoorooonary artrtererery y dididiseses asase.e.e. RRResese ulultstss fffroror m m ththe e EmEmorory y AnAnAngiopopoplalalastststy yy VeVeVersssusus SuSuurgrr erry y y TrTrTriaiai l l (E(EASASAST)T)T)..CCCirccrculu ation. 19199959 ;;92:2:2 2828313131-2-2-28484840.0.
111. SeSeSerrrrr uyuyuyss s PWPWP ,,, MMoMoririicecee MMC,C,C KKKapapappepep teteininin AAAPPP, CCCololo ooommmbooo A,A,A HHHolololmememess DRDRD ,, MMaMackckck MMMJ,J,J, SSSttahhhlee e E,E, Feldldmam n TETE, vavan deden n Branand M,M, BBass EJJ, VaVan n DyDyck NN, LeLeadadleley y K,K, DDawawkiinsns KKD,D, Mohohr FWFW,,nvestigators s S.S.S PPererercucucutatatanenn ououous s s cocoorororonananaryyy iintntntererervvvenenentitiiononon vvverrrsusususs s cococ rororonann ryryry-a-aartrtrtererery y y bybyypapapasssss gggrarar fting for eeveverere ccororononararyy ararteteryry ddisiseaeasese NN EnEnglgl JJ MMeded 20200909;3;36060:9:96161 9-97272
by guest on May 29, 2018
http://circ.ahajournals.org/D
ownloaded from
DOI: 10.1161/CIRCULATIONAHA.114.009985
23
percutaneous coronary intervention with TAXus and cardiac surgery (SYNTAX) study: design, rationale, and run-in phase. Am Heart J. 2006;151:1194-1204. 15. Magnuson EA, Farkouh ME, Fuster V, Wang K, Vilain K, Li H, Appelwick J, Muratov V, Sleeper LA, Boineau R, Abdallah M, Cohen DJ, Investigators FT. Cost-effectiveness of percutaneous coronary intervention with drug eluting stents versus bypass surgery for patients with diabetes mellitus and multivessel coronary artery disease: results from the FREEDOM trial. Circulation. 2013;127:820-831. 16. Micromedex 2.0. Greenwood Village, Colorado. Accessed 02/03/2013. 17. Ashby J. The accuracy of cost measures measures derived from medicare cost report data. Hosp Cost Manag Account. 1992;3:1-8. 18. Taira DA, Seto TB, Siegrist R, Cosgrove R, Berezin R, Cohen DJ. Comparison of analytic approaches for the economic evaluation of new technologies alongside multicenter clinical trials. Am Heart J. 2003;145:452-458.
19. Centers for Medicare and Medicaid Services. 100% MEDPAR inpatient hospital national data for fiscal yar 20. Short stay inpatient diagnosis groups. Available at: http://cms.gov/research-statistics-data-and-systems/statistics-trends-and-reports/MedicareFeeforSvcPartsAB/downloads/DRG10.pdf. Accessed on March 1, 2013. 20. Mitchell J. Per case prospective payment for episodes of hospital care. Health Economics Research, Inc., Needham, MA.; 1995. 21. Weintraub WS, Mahoney EM, Lamy A, Culler S, Yuan Y, Caro J, Gabriel S, Yusuf S. Long-term cost-effectiveness of clopidogrel given for up to one year in patients with acute coronary syndromes without ST-segment elevation. J Am Coll Cardiol. 2005;45:838-845. 22. Shaw JW, Johnson JA, Coons SJ. US valuation of the EQ-5D health states: development and testing of the D1 valuation model. Med Care. 2005;43:203-220. 23. Polsky D, Glick H. Costing and cost analysis in randomized controlled trials: caveat emptor. Pharmacoeconomics. 2009;27:179-188. 24. Efron B. Better Bootstrap Confidence Intervals. J Am Stat Assoc. 1987;82:171-185.
25. Bang H, Tsiatis AA. Estimating medical costs with censored data. Biometrika. 2000;87:329-343.
26. Weinstein MC, Siegel JE, Gold MR, Kamlet MS, Russell LB. Recommendations of the Panel on Cost-effectiveness in Health and Medicine. JAMA. 1996;276:1253-1258. 27. Gold MR. Cost-effectiveness in health and medicine. Oxford University Press; 1996.
19. Centers for Medicare and Medicaid Services. 100% MEDPAR inpatient hossppipitataall nananatititionononalalal data for fiscal yar 20. Short stay inpatient diagnosis groups. Available at: http://cms.gov/research-statistics-data-and-systems/statistics-trends-and-eports/MedicareFeeforSvcPartsAB/downloads/DRG10.pdf. Accessed on March 1, 2013.
20200. MMiMitchelll JJJ. PePeerr r cacasesee ppprororospspececctititivevev pppayayymementnt fofof r r epepepisoddeseses ooof f f hoospspspititalal ccararare. HeHeealalalththth EEcoconononomimimicscsc RRessesearch, Inc., NeNeN ededdhahah mm,m, MMMA.A.A ; ; 1919999595.
211. WeWeWeinintrtrauauaubbb WSWSWS,,, MMMahhohonney y y EMEMEM, , LaLLamymymy AAA, , CuCuCulllleeer SS,, YuYuuananan YYY,, , CCaCarororo JJ, , , GGaGabrbrrieiei lll S,S,, YYYuusuufuf SS. LLoLonngng-ermm ccost-t-efeffectctivenenesess ofof cloopipidodogrel givivenen fforr uup too oonene yyeaear r inn ppatatieientn ss wiwithth aacutee ccorrononarary yndromes wiwiithththououut tt STSTST-s-ssegeggmemementtt eeelelevavav titiiononon.. J J J AmAmAm CCColololll l CaCaardrdrdioioioll.. 2020200555;4;4;45:5:5:8383838-8-8 848445.5.5.
by guest on May 29, 2018
http://circ.ahajournals.org/D
ownloaded from
DOI: 10.1161/CIRCULATIONAHA.114.009985
24
28. Hlatky MA, Boothroyd DB, Melsop KA, Brooks MM, Mark DB, Pitt B, Reeder GS, Rogers WJ, Ryan TJ, Whitlow PL, Wiens RD. Medical costs and quality of life 10 to 12 years after randomization to angioplasty or bypass surgery for multivessel coronary artery disease. Circulation. 2004;110:1960-1966. 29. United States Department of Labor, Bureau of Labor Statistics. Available at: http://www.bls.gov/news.release/empsit.t19.htm. Accessed on June 4, 2014.
30. Cohen DJ, Reynolds MR. Interpreting the results of cost-effectiveness studies. J Am Coll Cardiol. 2008;52:2119-2126. 31. Mark DB, Hlatky MA. Medical economics and the assessment of value in cardiovascular medicine: Part I. Circulation. 2002;106:516-520. 32. Sculpher M. Subgroups and heterogeneity in cost-effectiveness analysis. Pharmacoeconomics. 2008;26:799-806. 33. Serruys PW. Cost-effectiveness: the ménage à trois having a ratio with one denominator and one numerator. EuroIntervention. 2013;9:173. 34. Cohen DJ, Lavelle TA, Van Hout B, Li H, Lei Y, Robertus K, Pinto D, Magnuson EA, McGarry TF, Lucas SK, Horwitz PA, Henry CA, Serruys PW, Mohr FW, Kappetein AP. Economic outcomes of percutaneous coronary intervention with drug-eluting stents versus bypass surgery for patients with left main or three-vessel coronary artery disease: one-year results from the SYNTAX trial. Catheter Cardiovasc Interv. 2012;79:198-209. 35. Weintraub WS, Becker ER, Mauldin PD, Culler S, Kosinski AS, King SB, 3rd. Costs of revascularization over eight years in the randomized and eligible patients in the Emory Angioplasty versus Surgery Trial (EAST). Am J Cardiol. 2000;86:747-752. 36. Rodriguez A, Mele E, Peyregne E, Bullon F, Perez-Balino N, Liprandi MI, Palacios IF. Three-year follow-up of the Argentine Randomized Trial of Percutaneous Transluminal Coronary Angioplasty Versus Coronary Artery Bypass Surgery in Multivessel Disease (ERACI). J Am Coll Cardiol. 1996;27:1178-1184. 37. Stroupe KT, Morrison DA, Hlatky MA, Barnett PG, Cao L, Lyttle C, Hynes DM, Henderson WG, Investigators of Veterans Affairs Cooperative Studies P. Cost-effectiveness of coronary artery bypass grafts versus percutaneous coronary intervention for revascularization of high-risk patients. Circulation. 2006;114:1251-1257. 38. Henderson RA, Pocock SJ, Clayton TC, Knight R, Fox KA, Julian DG, Chamberlain DA, Second Randomized Intervention Treatment of Angina Trial P. Seven-year outcome in the RITA-2 trial: coronary angioplasty versus medical therapy. J Am Coll Cardiol. 2003;42:1161-1170. 39. Weintraub W, Mahoney E, Zhang Z, Chu H, Hutton J, Buxton M, Booth J, Nugara F, Stables
33. Serruys PW. Cost-effectiveness: the ménage à trois having a ratio with one deenonoomimim nanatotor r anand one numerator. EuroIntervention. 2013;9:173.
34. Cohen DJ, Lavelle TA, Van Hout B, Li H, Lei Y, Robertus K, Pinto D, Magnuson EA, McGaG rry y TF, , Lucas SK, Horwitz PA, Henry CA,, Serruys PW, Mohr FW,W Kappetein AP. Ecconononomomomicicic oooututu coomememess of percutaneous coronary innnttet rrrvention with drdrd ugg-e-eelululuting stents versus bybyypapaass surgegeerrry ffororor ppatatieieientnttsss wiwiththh lllefefe t t mamainin oorr ththrer eee-vvvessselelel cccororo onnararary y y ararteteryryry disseaeaasesese::: onone-e-yeyeyeararr rrreesuuultl s from thehe SSYNYNYNTATATAXXX trtrtriaiaial.l. CaCaCaththt eeteerr CCaararddiovvvaassc InInIntetervrvv. 20201212;779:9:9 19198-8-20202099.9.
3555. WeWeWeinintrtrauauaubbb WSWSWS,,, BeBeeckckkerer EEER,R,R, MMMauauauldlddininn PPPDDD, CCCululleler r r S,S,, KKKosososininnskskski i ASASAS,, KKKingngng SSSB,B,B, 33rdrdrd.. CoCoostts s s ofoff evavascscullararizizatioion ovoverer eigghth yyeaearss iin the rarandndomomizized aandnd eeliligigiblb e papatitienents iin n thhee EEmorory y
Angioplasty y veveversrsr ususus SSSururu gegeg ryryry TTTriialala ((EAEAE STSTST)).). AmAmAm JJJ CCCararardid ololol... 202020000000;8;886:6:7474747-7-7 7575752.2.2.
by guest on May 29, 2018
http://circ.ahajournals.org/D
ownloaded from
DOI: 10.1161/CIRCULATIONAHA.114.009985
25
R, Dooley P. One year comparison of costs of coronary surgery versus percutaneous coronary intervention in the stent or surgery trial. Heart. 2004;90:782-788.
40. Reed SD, Anstrom KJ, Bakhai A, Briggs AH, Califf RM, Cohen DJ, Drummond MF, Glick HA, Gnanasakthy A, Hlatky MA, O'Brien BJ, Torti FM, Jr., Tsiatis AA, Willan AR, Mark DB, Schulman KA. Conducting economic evaluations alongside multinational clinical trials: toward a research consensus. Am Heart J. 2005;149:434-443.
41. Bangalore S, Kumar S, Fusaro M, Amoroso N, Attubato MJ, Feit F, Bhatt DL, Slater J. Short- and Long-Term Outcomes With Drug-Eluting and Bare-Metal Coronary Stents: A Mixed-Treatment Comparison Analysis of 117 762 Patient-Years of Follow-Up From Randomized Trials. Circulation. 2012;125:2873-2891.
42. Fearon WF, Bornschein B, Tonino PA, Gothe RM, Bruyne BD, Pijls NH, Siebert U. Economic evaluation of fractional flow reserve-guided percutaneous coronary intervention in patients with multivessel disease. Circulation. 2010;122:2545-2550. 43. Tonino PA, De Bruyne B, Pijls NH, Siebert U, Ikeno F, van' t Veer M, Klauss V, Manoharan G, Engstrom T, Oldroyd KG, Ver Lee PN, MacCarthy PA, Fearon WF. Fractional flow reserve versus angiography for guiding percutaneous coronary intervention. N Engl J Med. 2009;360:213-224.
43. Tonino PA, De Bruyne B, Pijls NH, Siebert U, Ikeno F, van' t Veer M, Klausss VVV,,, MaManonohaharranG, Engstrom T, Oldroyd KG, Ver Lee PN, MacCarthy PA, Fearon WF. Fractionanaal flflf owww rrresesesererervev versus angiography for guiding percutaneous coronary intervention. N Engl J MMededd. 2009;360:213-224.
by guest on May 29, 2018
http://circ.ahajournals.org/D
ownloaded from
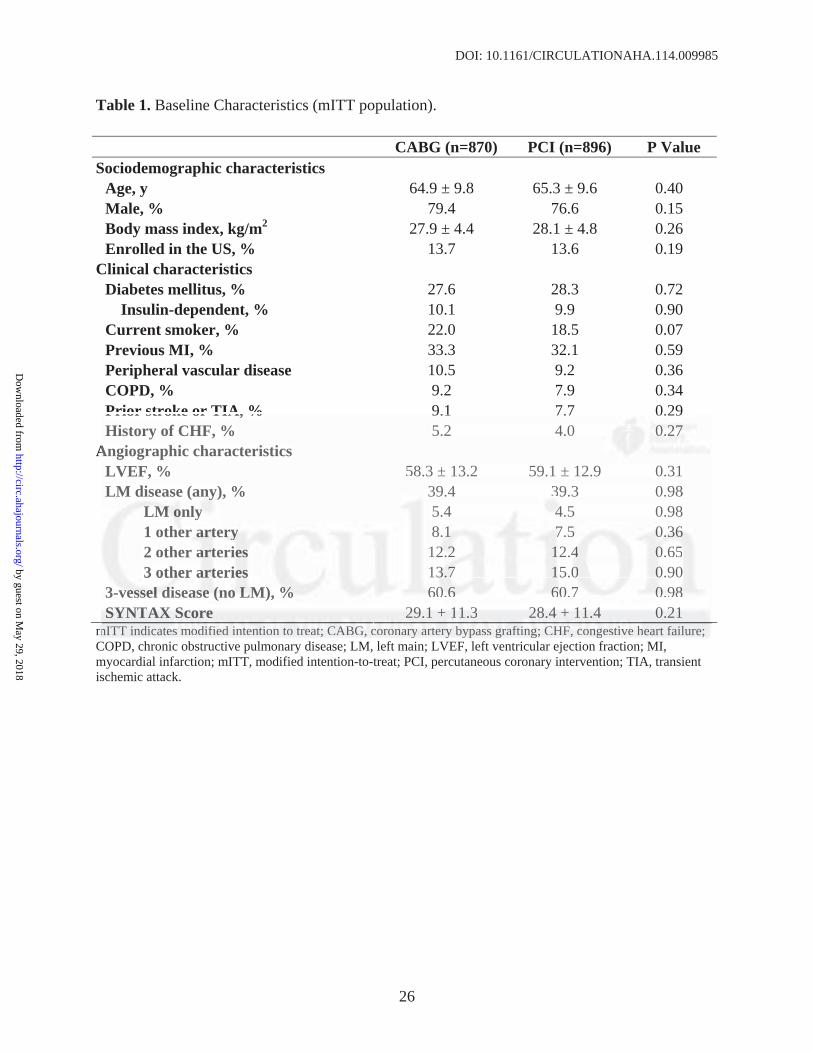
DOI: 10.1161/CIRCULATIONAHA.114.009985
26
Table 1. Baseline Characteristics (mITT population).
CABG (n=870) PCI (n=896) P Value Sociodemographic characteristics
Age, y 64.9 ± 9.8 65.3 ± 9.6 0.40 Male, % 79.4 76.6 0.15 Body mass index, kg/m2 27.9 ± 4.4 28.1 ± 4.8 0.26 Enrolled in the US, % 13.7 13.6 0.19
Clinical characteristics Diabetes mellitus, % 27.6 28.3 0.72
Insulin-dependent, % 10.1 9.9 0.90 Current smoker, % 22.0 18.5 0.07 Previous MI, % 33.3 32.1 0.59 Peripheral vascular disease 10.5 9.2 0.36 COPD, % 9.2 7.9 0.34 Prior stroke or TIA, % 9.1 7.7 0.29 History of CHF, % 5.2 4.0 0.27
Angiographic characteristics LVEF, % 58.3 ± 13.2 59.1 ± 12.9 0.31 LM disease (any), % 39.4 39.3 0.98
LM only 5.4 4.5 0.98 1 other artery 8.1 7.5 0.36 2 other arteries 12.2 12.4 0.65 3 other arteries 13.7 15.0 0.90
3-vessel disease (no LM), % 60.6 60.7 0.98 SYNTAX Score 29.1 ± 11.3 28.4 ± 11.4 0.21
mITT indicates modified intention to treat; CABG, coronary artery bypass grafting; CHF, congestive heart failure; COPD, chronic obstructive pulmonary disease; LM, left main; LVEF, left ventricular ejection fraction; MI, myocardial infarction; mITT, modified intention-to-treat; PCI, percutaneous coronary intervention; TIA, transient ischemic attack.
Prior stroke or TIA, % 9.1 7.7 0.299 History of CHF, % 5.2 4.0 0.0.0.272727
Angiographic characteristics LVEF, % 58.3 ± 13.2 59.1 ± 12.9 0.31 LMM diseasese (anany)y)y , % 39.4 339.3 0.98
MLMLM oonly y 5.4 444.5 0.98 1 otheheer r ararartetet ryryry 8..111 7.77 5 0.0.0.363636 2 other aaarttteririeses 1222 2.2.2 1122.444 00.0.6565 3 otheheher aaartteteririeses 1333.7.77 115.5.000 00.0.9090
3-3 vevevesssssselelel dddiisiseaeaasesese (((nonono LLLMM)M , %%% 606060 6.6.6 66600.0 77 00.0.989898 SYSYSYNTNTNTAXAXAX SSScocorere 292929 11.1 ±±± 11111.1.333 282828 44.4 ±±± 111111.444 000.212121
mITT indicateses mmododdififfieieddd inini tetet ntntioioi nn to ttrereatat;; CACAABGBBG,, cocororonanaryry aarttrterery y bybbypapassss ggrar fttinini g;g; CCCHFHFHF,, cocongngesestittiveve hhheart failure;;yy
by guest on May 29, 2018
http://circ.ahajournals.org/D
ownloaded from

DOI: 10.1161/CIRCULATIONAHA.114.009985
27
Table 2. Index procedural resource utilization and cost (per protocol population).
CABG (n=854) PCI (n=885) P value Number of PCI procedures, %
1 - 85.9 (760/885) 2 - 13.5 (124/885) 3 or more - 0.1 (1/885)
Procedure duration, minutes 209±62 [205] 101±55 [90] <0.001 Guiding catheters - 2.1 ± 1.2 Guidewires - 3.5 ± 2.3 Paclitaxel-eluting stents - 4.5 ± 2.3 Bare metal stents - 0.0 ± 0.3 Angioplasty balloons - 3.7 ± 2.8 Rotablator burrs - 0.1 ± 0.3 IVUS catheters - 0.1 ± 0.4 Closure device - 0.4 ± 0.6 Contrast volume, ml - 415 ± 207.5 [380] Antithrombotic agents used, %
Bivalrudin - 7.2% (64/885) Abciximab - 15.6% (138/885) Eptifibatide - 9.5% (84/885) Tirofiban - 10.7% (95/885)
Index procedure cost, $ 8504 ± 1972 [8356] 11,919 ± 6162 [11263] <0.001 Values in brackets represent medians. CABG, coronary artery bypass grafting; IVUS, intravascular ultrasound; PCI, percutaneous coronary intervention.
Contrast volume, ml - 415 ± 207.5 [380800]]] Antithrombotic agents used, %
Bivalrudin - 7.2% (64/885) Abciximab - 15.6% ((138/885) EpEpEptititifififibababatititided -- 9.9 5%5%% ((84/885) TTiTirofibaan n n - 101010.7.7%%% (955/8/8/8858585)) )
nnddedex proceddurure cocosstt, $$ $ 85504 ± 1977722 [83535356]6]6] 11111,999199 ±±± 66161626262 [[11112262633]3] <<00..0001 VaVaValuuueses in bracckekeets rrepeppreseennt meddiiaiannsns.. CACABGBGB ,, cocooronaaryyy arteeeryyy bbypypypaasass s gggraaaftinngg; IIVUSSS, iinintrtraavaasa cuc laaarr uuultrtraasoooundd; PPPCI,pepercrccutututanananeoeoe ususus cccoororononaaary y y ininttetervvvenentit onnn.
by guest on May 29, 2018
http://circ.ahajournals.org/D
ownloaded from
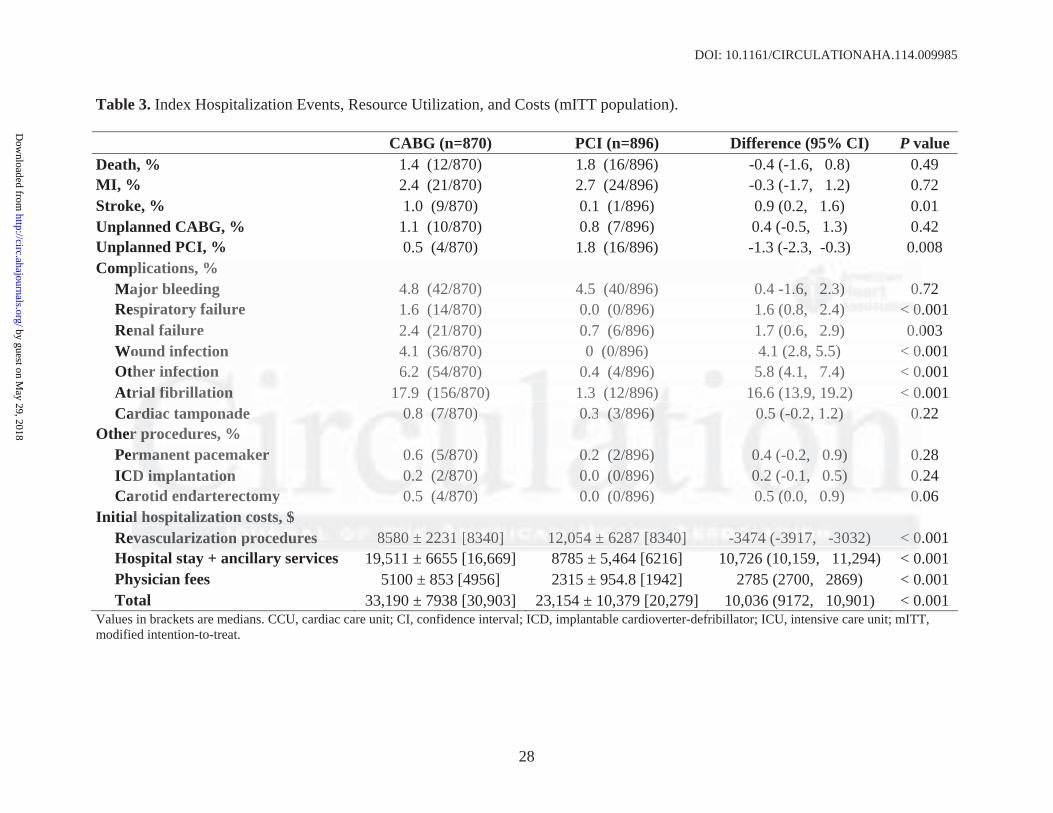
DOI: 10.1161/CIRCULATIONAHA.114.009985
28
Table 3. Index Hospitalization Events, Resource Utilization, and Costs (mITT population).
CABG (n=870) PCI (n=896) Difference (95% CI) P value Death, % 1.4 (12/870) 1.8 (16/896) -0.4 (-1.6, 0.8) 0.49 MI, % 2.4 (21/870) 2.7 (24/896) -0.3 (-1.7, 1.2) 0.72 Stroke, % 1.0 (9/870) 0.1 (1/896) 0.9 (0.2, 1.6) 0.01 Unplanned CABG, % 1.1 (10/870) 0.8 (7/896) 0.4 (-0.5, 1.3) 0.42 Unplanned PCI, % 0.5 (4/870) 1.8 (16/896) -1.3 (-2.3, -0.3) 0.008 Complications, %
Major bleeding 4.8 (42/870) 4.5 (40/896) 0.4 -1.6, 2.3) 0.72 Respiratory failure 1.6 (14/870) 0.0 (0/896) 1.6 (0.8, 2.4) < 0.001 Renal failure 2.4 (21/870) 0.7 (6/896) 1.7 (0.6, 2.9) 0.003 Wound infection 4.1 (36/870) 0 (0/896) 4.1 (2.8, 5.5) < 0.001 Other infection 6.2 (54/870) 0.4 (4/896) 5.8 (4.1, 7.4) < 0.001 Atrial fibrillation 17.9 (156/870) 1.3 (12/896) 16.6 (13.9, 19.2) < 0.001 Cardiac tamponade 0.8 (7/870) 0.3 (3/896) 0.5 (-0.2, 1.2) 0.22
Other procedures, % Permanent pacemaker 0.6 (5/870) 0.2 (2/896) 0.4 (-0.2, 0.9) 0.28 ICD implantation 0.2 (2/870) 0.0 (0/896) 0.2 (-0.1, 0.5) 0.24 Carotid endarterectomy 0.5 (4/870) 0.0 (0/896) 0.5 (0.0, 0.9) 0.06
Initial hospitalization costs, $ Revascularization procedures 8580 ± 2231 [8340] 12,054 ± 6287 [8340] -3474 (-3917, -3032) < 0.001 Hospital stay + ancillary services 19,511 ± 6655 [16,669] 8785 ± 5,464 [6216] 10,726 (10,159, 11,294) < 0.001 Physician fees 5100 ± 853 [4956] 2315 ± 954.8 [1942] 2785 (2700, 2869) < 0.001 Total 33,190 ± 7938 [30,903] 23,154 ± 10,379 [20,279] 10,036 (9172, 10,901) < 0.001
Values in brackets are medians. CCU, cardiac care unit; CI, confidence interval; ICD, implantable cardioverter-defribillator; ICU, intensive care unit; mITT, modified intention-to-treat.
plications, % ajor bleeding 4.8 (42/870) 4.5 (40/896) 0.4 -1-1.6. , 2.2 3)3)3) 0.espiratory failure 1.6 (14/870) 0.0 (0/896) 1.6 ((0.0.888, 222 4.4))) <<< 000enal failure 2.4 (21/870) 0.7 (6/896) 1.7 (0.6, 2.9) 0.0ound infection 4.1 (36/870) 0 (0/896) 4.1 (2.8, 5.5) < 0ther r ininfefefectctctioioion n 6.2 (54/870) 0.4 (4/896) 5.8 (4.1, 7.4) < 0ririalala fffibibi rir llatat oioionn 17.9 (156/870) 1.3 (12/896) 16.6 (13.9, 19.2) < 0
aardrr aiaiac c tamponnadadade e 0.0.0.88 (((7/7/7/87878 0)0)) 000.3.3.3 (3(3(3/8// 9666))) 0.0.0.555 (-(-(-0.00.2,2, 11.2.22))) 0.r r rrproco edures, % % rmrr anana ent paceemam eker r 0..66 ((5/5 788 0) 000.2.2.2 (2(( 88/ 96)) .0.0 4 (-( 0.2,22 00 99.9) 0.DDD imimimplplplanantaatitiiononon 0.0.0 222 ((2/22 787870)0)0) 000.0.0 (0(( 88/896969 )) 0.0.222 (-(-0.0..1,1,, 0 5.5.5) 0.
arotitidd enenendadadartrtere eccttotomymy 0.0 5 ( /4/8787870)0)0 000.0.00 0(0(0/8/8/8969 ) 0.0.555 (0(0(0.00, 0.0.9)9)9) 00.aalll hhohospspititit lalaliiziz tatatiioionn coco tststss, $$$ evascularizatioioonn prprprocococ dededurururesese 585808080 ±±± 2223233111 [8[8[834343 0]0]0] 1112,22 5505444 ±± 62262878787 [838 40400]]] -3-33474744 (-(( 9393917177, -3- 032) < 000
by guest on May 29, 2018
http://circ.ahajournals.org/D
ownloaded from

DOI: 10.1161/CIRCULATIONAHA.114.009985
29
Table 4. Follow-Up Events, Resource Utilization, and Costs (mITT population).
Year 1 Year 2 Year 3 Year 4 Year 5 5-year Cumulative CABGn=870
PCI N=896
CABGn=813
PCI N=851
CABGn=791
PCI N=832
CABGn=767
PCI N=805
CABGn=733
PCI N=771
CABGn=870
PCI N=896
Pvalue
Clinical outcomes Death, % 1.8 2.6 1.5 2.0 1.9 2.6 2.2 3.2 2.9 2.3 10.7 13.6 0.06 MI, % 0.9 2.2 0.1 1.2 0.3 1.2 0.3 1.7 0.0 1.2 3.7 9.3 <0.001 Stroke, % 1.0 0.6 0.7 0.7 0.5 0.6 0.4 0.2 0.0 0.1 3.4 2.2 0.12
Resource use (events/100 pts) Repeat revascularization (any) 4.8 14.1 3.9 6.6 2.5 3.7 2.2 5.5 2.6 4.3 16.6 35.2 <0.001
PCI procedures 4.7 11.9 3.9 5.6 2.5 2.8 2.2 4.8 2.6 3.1 15.3 28.9 <0.001 CABG procedures 0.1 2.1 0.0 0.9 0.0 1.0 0.0 0.6 0.0 1.2 1.3 6.3 <0.001 Diagnostic catheterization 3.8 11.6 2.3 6.5 1.9 4.1 0.1 0.2 1.4 3.4 10.1 22.3 <0.001 Re-hospitalization 27.7 41.1 16.6 20.9 12.9 15.6 14.5 18.3 11.5 13.5 77.5 103.6 <0.001 Cost per patient, $
Rehospitalizations 2435 3964 1570 2044 1200 1485 1240 1664 1178 1471 - - - Outpatient services 323 333 91 167 83 110 141 171 118 165 - - - Rehab/skilled nursing stays 900 186 27 14 28 15 30 47 31 49 - - - Medications 1578 2136 1787 2186 1837 2236 1866 2204 1952 2300 - - - MD fees 724 1027 439 558 348 421 384 446 321 381 - - - Total 5959 7646 3914 4970 3495 4266 3661 4532 3601 4366 - - -
CABG; coronary artery bypass grafting; MI, myocardial infarction; mITT, modified intention-to-treat; PCI, percutaneous coronary intervention
urce use (events/100 pts) peat revascularization (any) 4.8 14.1 3.9 6.6 2.5 3.7 2.2 5.5 2.6 44.33 1166.6.666 353 .2CI procedures 4.7 11.9 3.9 5.6 2.5 2.8 2.2 4.8 2.6 33 1.1.1 1115.55.333 282828.9.99ABG procedures 0.1 2.1 0.0 0.9 0.0 1.0 0.0 0.6 0.0 1.2 1.3 6.3 agnostic catheterization 3.8 11.6 2.3 6.5 1.9 4.1 0.1 0.2 1.4 3.4 10.1 22.3-hospspititalalizzation n 27.7 41.1 16.6 20.9 122.9. 15.6 14.5 18..33 11.5 13.5 77.5 103.6perer pppatatatieieientnt, $$ $ hohoho ppspititalalizi atioo snsns 24243535 3396964 4 151570 220444 4 1211 0000 11484855 12240040 166664 4 117878 11474711 -- -
uutpt atata ieient services 3232323 333333333 91919 111 767 8333 11111100 0 4141411 17717111 11118 8 8 166165 55 -- - hah b/b/b sks illed nursing tsts yyays 900 0 18186 7272 114 8828 11555 0030 47 7 313 4449 -- - eedidd aacatit ons 15 878 2213136 17178787 2181 6 66 1811 37373 22223232 6 6 18 666 2 0204 4 9191 25252 230303 0 0 -- - DD fffeeeee ss 72724 4 01010272727 443933 555 858 33 8484 444212121 333 48484 44 64646 332122 33381181 -- -tal 5959595 77646464666 39 4414 449797970 0 34349595 44426262 6 6 363 161 44535322 36360101 444363 6 6 -- --
GGG;;; cococorororonananaryryry aaartrtrterereryyy bybybypapapassssss gggrararaftftftinining;g;g; MMMIII, mmmyoyoyocacacardrdrdiaiaialll inininfafafarcrcrctititiononon;;; mImImITTTTTT, momomodididifififiededed iiintntntenenentititiononon t-t-too-o-trtrtreaeaeat;t;t; PPPCICICI, pepepercrcrcutututanananeoeoeoususus cccorororonononarararyyy iiintntnterererveveventntntioioionnn yyy
by guest on May 29, 2018
http://circ.ahajournals.org/D
ownloaded from
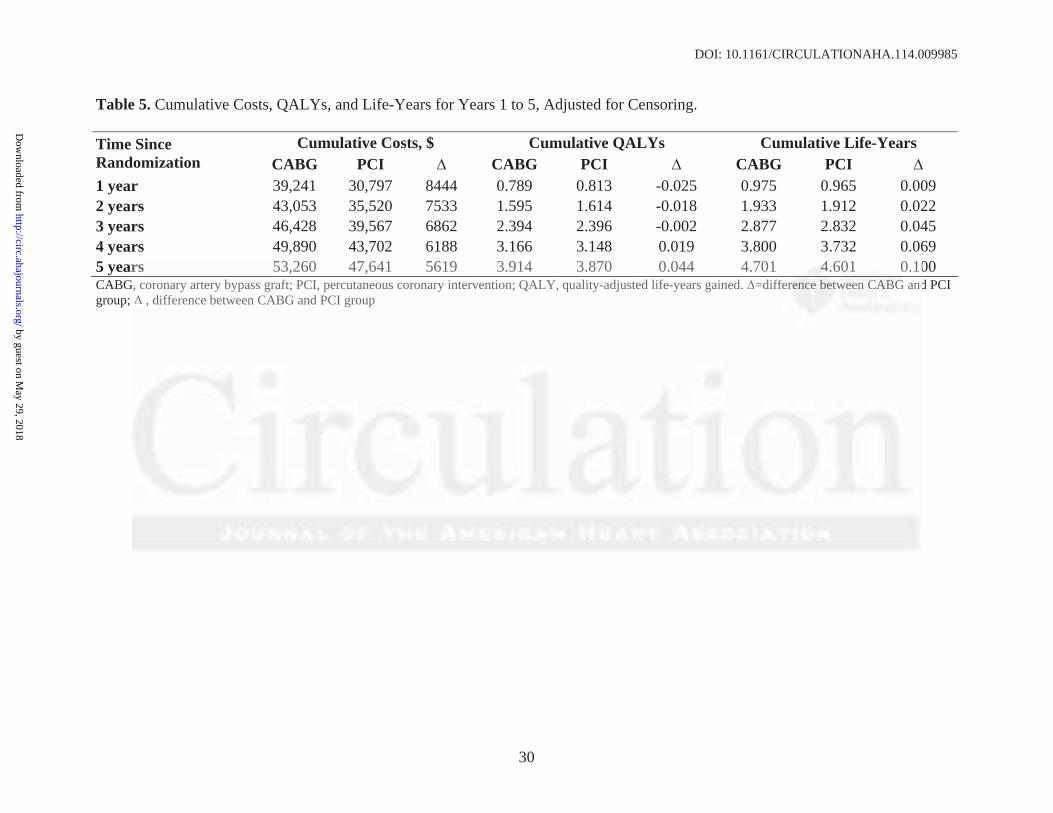
DOI: 10.1161/CIRCULATIONAHA.114.009985
30
Table 5. Cumulative Costs, QALYs, and Life-Years for Years 1 to 5, Adjusted for Censoring.
Cumulative Costs, $ Cumulative QALYs Cumulative Life-Years Time Since Randomization CABG PCI CABG PCI CABG PCI 1 year 39,241 30,797 8444 0.789 0.813 -0.025 0.975 0.965 0.009 2 years 43,053 35,520 7533 1.595 1.614 -0.018 1.933 1.912 0.022 3 years 46,428 39,567 6862 2.394 2.396 -0.002 2.877 2.832 0.045 4 years 49,890 43,702 6188 3.166 3.148 0.019 3.800 3.732 0.069 5 years 53,260 47,641 5619 3.914 3.870 0.044 4.701 4.601 0.100 CABG, coronary artery bypass graft; PCI, percutaneous coronary intervention; QALY, quality-adjusted life-years gained. =difference between CABG and PCI group; , difference between CABG and PCI group
rs 53,260 47,641 5619 3.914 3.870 0.044 4.701 444.6.60101 00.10G, coronary artery bypass graft; PCI, percutaneous coronary intervention; QALY, quality-adjusted life-years gained. =diffefe erer cnce e e bebetwtweeeee n n CACAABGBGB and
, difference between CABG and PCI group
by guest on May 29, 2018
http://circ.ahajournals.org/D
ownloaded from
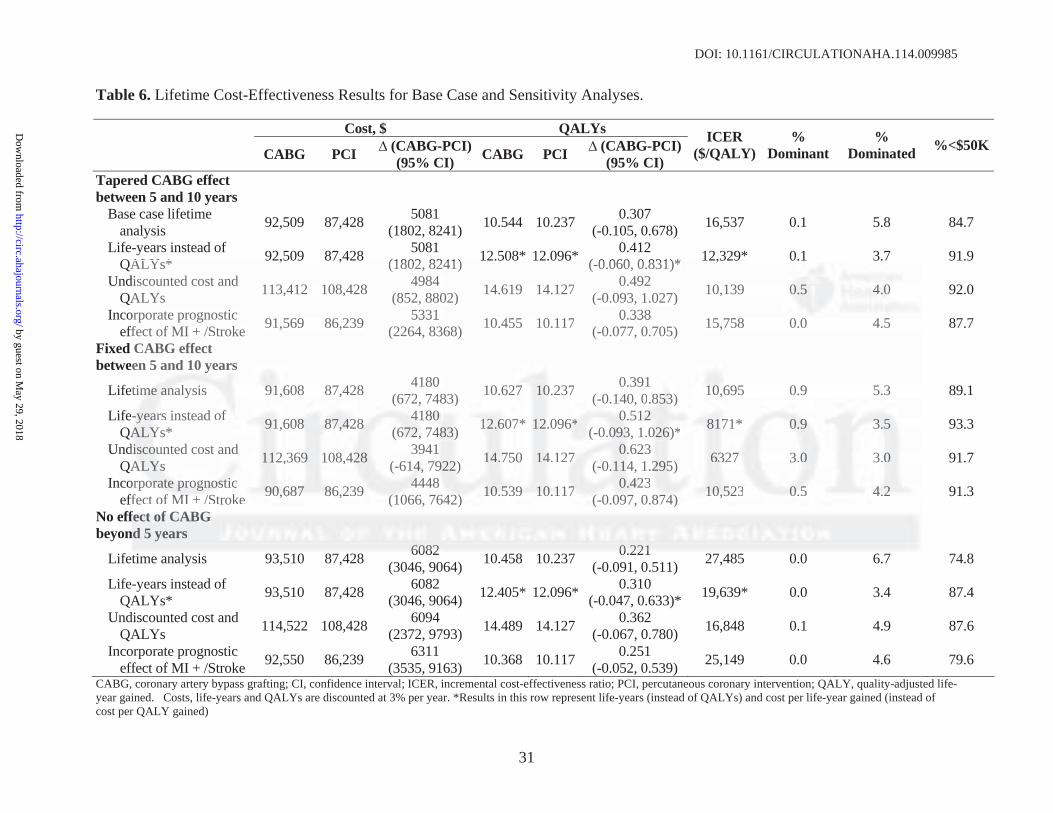
DOI: 10.1161/CIRCULATIONAHA.114.009985
31
Table 6. Lifetime Cost-Effectiveness Results for Base Case and Sensitivity Analyses.
Cost, $ QALYs CABG PCI (CABG-PCI)
(95% CI) CABG PCI (CABG-PCI)(95% CI)
ICER ($/QALY)
% Dominant
% Dominated %<$50K
Tapered CABG effect between 5 and 10 years
Base case lifetime analysis 92,509 87,428 5081
(1802, 8241) 10.544 10.237 0.307 (-0.105, 0.678) 16,537 0.1 5.8 84.7
Life-years instead of QALYs* 92,509 87,428 5081
(1802, 8241) 12.508* 12.096* 0.412 (-0.060, 0.831)* 12,329* 0.1 3.7 91.9
Undiscounted cost and QALYs 113,412 108,428 4984
(852, 8802) 14.619 14.127 0.492 (-0.093, 1.027) 10,139 0.5 4.0 92.0
Incorporate prognostic effect of MI + /Stroke 91,569 86,239 5331
(2264, 8368) 10.455 10.117 0.338 (-0.077, 0.705) 15,758 0.0 4.5 87.7
Fixed CABG effect between 5 and 10 years
Lifetime analysis 91,608 87,428 4180 (672, 7483) 10.627 10.237 0.391
(-0.140, 0.853) 10,695 0.9 5.3 89.1
Life-years instead of QALYs* 91,608 87,428 4180
(672, 7483) 12.607* 12.096* 0.512 (-0.093, 1.026)* 8171* 0.9 3.5 93.3
Undiscounted cost and QALYs 112,369 108,428 3941
(-614, 7922) 14.750 14.127 0.623 (-0.114, 1.295) 6327 3.0 3.0 91.7
Incorporate prognostic effect of MI + /Stroke 90,687 86,239 4448
(1066, 7642) 10.539 10.117 0.423 (-0.097, 0.874) 10,523 0.5 4.2 91.3
No effect of CABG beyond 5 years
Lifetime analysis 93,510 87,428 6082 (3046, 9064) 10.458 10.237 0.221
(-0.091, 0.511) 27,485 0.0 6.7 74.8
Life-years instead of QALYs* 93,510 87,428 6082
(3046, 9064) 12.405* 12.096* 0.310 (-0.047, 0.633)* 19,639* 0.0 3.4 87.4
Undiscounted cost and QALYs 114,522 108,428 6094
(2372, 9793) 14.489 14.127 0.362 (-0.067, 0.780) 16,848 0.1 4.9 87.6
Incorporate prognostic effect of MI + /Stroke 92,550 86,239 6311
(3535, 9163) 10.368 10.117 0.251 (-0.052, 0.539) 25,149 0.0 4.6 79.6
CABG, coronary artery bypass grafting; CI, confidence interval; ICER, incremental cost-effectiveness ratio; PCI, percutaneous coronary intervention; QALY, quality-adjusted life-year gained. Costs, life-years and QALYs are discounted at 3% per year. *Results in this row represent life-years (instead of QALYs) and cost per life-year gained (instead of cost per QALY gained)
ALYs* , , (1802, 8241) (-0.060, 0.831)* ,
discounted cost and ALYs 113,412 108,428 4984
(852, 8802) 14.619 14.127 0.492 (-0.093, 1.027) 10,139 000.5 444.0.0.0
orporate prognostic ffect of MI + /Stroke 91,569 86,239 5331
(2264, 8368) 10.455 10.117 0.338 (-0.077, 0.705) 15,758 0.0 4.5
CABG effect en 5 anand d 1010 yyeaarsrs
titimememe aaananan lyl siss 919191,6608 87,428 4180 (6( 722, , 74483) 10.6277 0010.237 0.391
(-( 0.0.140, 0.8.8535353) ) 101010,6,695 0.9 5.3
y-y- aaearsrs instead ooff AA YYLYs*s 1191,6080808 8887,7,7,4242428 8 8 41414 808080
6(6(6727272, , 74748383) ) 12121 66.6070 1* .2.2 096**6* 0.00 51512 22(-(-0.0 0900 3,3,3 11 0.0.0 626)*) 81717 * 0.00 999 3.3.3 5
ididisc uouounted cost and dAAALYLYLYs s s 111 2,2 369 99 101 8, 242428 39394141
(-( 614,4,4, 779299 )2)2 1411 77. 50 4414.1127277 .0.0 623 (-(-0.0.114,4 1 22.2 5595) 33632727 3 00.0 3 0.0.
oorprp rororatata ee prprprogogognononostststicici ffectt oof f MIMI ++ //StStrokee 909090,6,66878787 8886,6,6 239 9 44444 4848
(1(106066, 76442)2) 101010 5.5.5393939 101010.111 71717 00.42424233 (-(-0.0.09097,7, 0.87474) ) 101010 55,523232 000.555 444 22.2
fffececttt fofof CCCABABABGGG nd 5 years
60608282 00 222211
by guest on May 29, 2018
http://circ.ahajournals.org/D
ownloaded from
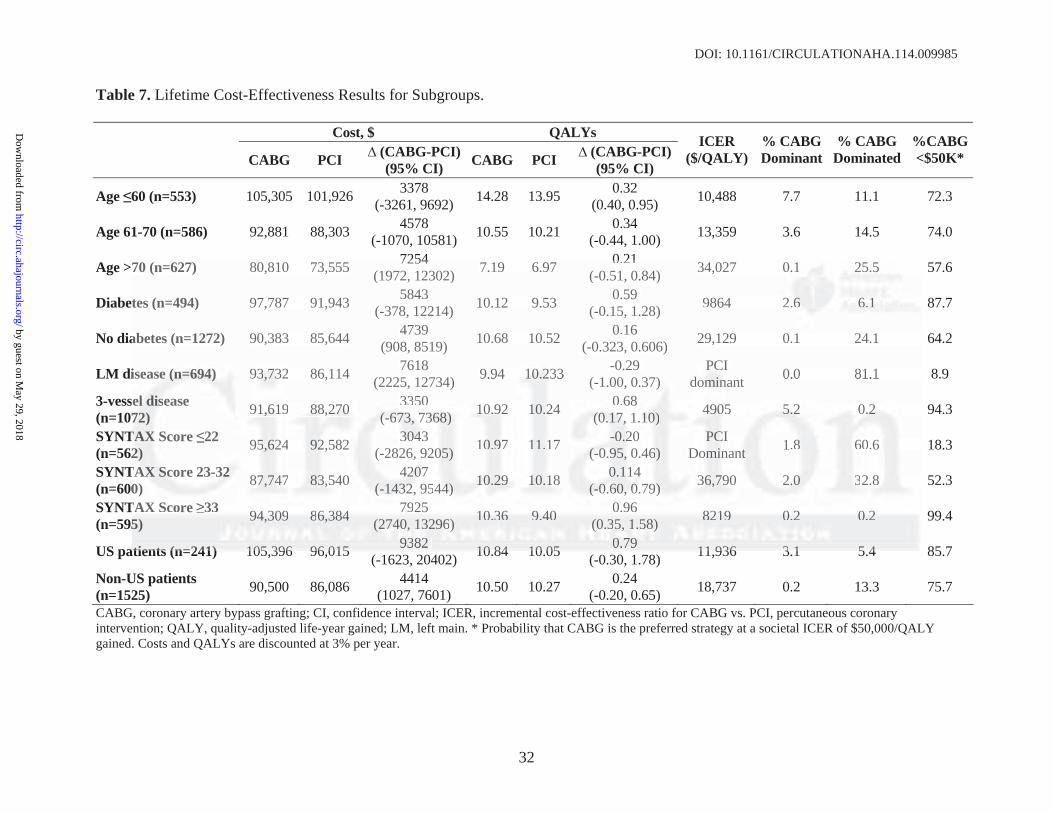
DOI: 10.1161/CIRCULATIONAHA.114.009985
32
Table 7. Lifetime Cost-Effectiveness Results for Subgroups.
Cost, $ QALYs
CABG PCI (CABG-PCI)(95% CI) CABG PCI (CABG-PCI)
(95% CI)
ICER ($/QALY)
% CABG Dominant
% CABG Dominated
%CABG <$50K*
Age 60 (n=553) 105,305 101,926 3378 (-3261, 9692) 14.28 13.95 0.32
(0.40, 0.95) 10,488 7.7 11.1 72.3
Age 61-70 (n=586) 92,881 88,303 4578 (-1070, 10581) 10.55 10.21 0.34
(-0.44, 1.00) 13,359 3.6 14.5 74.0
Age >70 (n=627) 80,810 73,555 7254 (1972, 12302) 7.19 6.97 0.21
(-0.51, 0.84) 34,027 0.1 25.5 57.6
Diabetes (n=494) 97,787 91,943 5843 (-378, 12214) 10.12 9.53 0.59
(-0.15, 1.28) 9864 2.6 6.1 87.7
No diabetes (n=1272) 90,383 85,644 4739 (908, 8519) 10.68 10.52 0.16
(-0.323, 0.606) 29,129 0.1 24.1 64.2
LM disease (n=694) 93,732 86,114 7618 (2225, 12734) 9.94 10.233 -0.29
(-1.00, 0.37) PCI
dominant 0.0 81.1 8.9
3-vessel disease (n=1072) 91,619 88,270 3350
(-673, 7368) 10.92 10.24 0.68 (0.17, 1.10) 4905 5.2 0.2 94.3
SYNTAX Score 22 (n=562) 95,624 92,582 3043
(-2826, 9205) 10.97 11.17 -0.20 (-0.95, 0.46)
PCI Dominant 1.8 60.6 18.3
SYNTAX Score 23-32 (n=600) 87,747 83,540 4207
(-1432, 9544) 10.29 10.18 0.114 (-0.60, 0.79) 36,790 2.0 32.8 52.3
SYNTAX Score 33 (n=595) 94,309 86,384 7925
(2740, 13296) 10.36 9.40 0.96 (0.35, 1.58) 8219 0.2 0.2 99.4
US patients (n=241) 105,396 96,015 9382 (-1623, 20402) 10.84 10.05 0.79
(-0.30, 1.78) 11,936 3.1 5.4 85.7
Non-US patients (n=1525) 90,500 86,086 4414
(1027, 7601) 10.50 10.27 0.24 (-0.20, 0.65) 18,737 0.2 13.3 75.7
CABG, coronary artery bypass grafting; CI, confidence interval; ICER, incremental cost-effectiveness ratio for CABG vs. PCI, percutaneous coronary intervention; QALY, quality-adjusted life-year gained; LM, left main. * Probability that CABG is the preferred strategy at a societal ICER of $50,000/QALY gained. Costs and QALYs are discounted at 3% per year.
70 (n=627) 80,810 73,555 7254 (1972, 12302) 7.19 6.97 0.21
(-0.51, 0.84) 34,027 0.11 225.5.55
tes (n=494) 97,787 91,943 5843 (-378, 12214) 10.12 9.53 0.59
(-0.15, 1.28) 9864 22 6.6.6 666.11.1
abetes (n=1272) 90,383 85,644 4739 (908, 8519) 10.68 10.52 0.16
(-0.323, 0.606) 29,129 0.1 24.1
iseaasese (((n=n=n=6969694)4)4) 93933 77,732323 86,114 7618 (2225, 12734) 9.94 111000.2322 3 -0.29
(-1.00, 0.37) )PCPCI I
dodomimim nanan nt 0.0 81.1
ssellel ddissiseaeasese 7772) 9191,6,6,61919 8888,8,8 2727270 0 0 333 505
(((-66-6737373, 73733686868))) 1010.9.922 1011 2.2. 4 0.68 (((0.00 171717,, 1.1.101010)) 4949905050 555.2.2. 00.2.22
T XAXAX SScore 22 222) 5595,6242 92,22 582 30303043434
(-( 28826,, 9292 500 ) ) 0010 9.977 1111 1.1. 7 -0- 22. 0 0 (-(-(-0.0.0 9599 , , 0. 6646)
PCPCI IoDomiminan tntnt 1.88 606 .6
TTAXAXAX SSScocorere 23-3 323232 00) ) 87787,747474 83,3,3,54540 4242207070
(-(-( 144323232, 9595 44444)) ) 101010 2.2999 1011 1.1.18 0.00 111 4 4(-(-( 0.0.0 60606 , , 0.0.0 7979)) ) 6363 7,79090 22.0.00 332.2.88
TAXX SScore 3333 5) 949494 33,3090909 888666,383838444 797 25
(2274747 0,0,0 113233 9666) )) 101010 33.3666 999.404040 0.0 9696 (0(0(0.3.3.35,5,5, 11.5.5.58)8)8) 828282191919 000 22.2 000 22.2
tatiie tnts ((n 2=24141)) 101055 393966 9696 001515 93938282 1010 8844 1010 0055 0.0 7979 1111 993636 33 11 55 44
by guest on May 29, 2018
http://circ.ahajournals.org/D
ownloaded from

DOI: 10.1161/CIRCULATIONAHA.114.009985
33
Figure Legends:
Figure 1. CONSORT diagram. Black boxes represent the modified intention-to-treat (mITT)
population that was the primary analytic population for the economic study. The grey boxes
represent the per protocol (PP) population. CABG, coronary artery bypass grafting; PCI,
percutaneous coronary intervention.
Figure 2. Mean cumulative medical costs (lines) and mean annual follow-up costs (bars) in 2010
dollars, for the PCI and CABG groups. CABG, coronary artery bypass grafting; PCI,
percutaneous coronary intervention. Note that the first set of bars represent represents the costs
of the index hospitalization.
Figure 3. Observed survival through 5 years and predicted survival beyond 5 years for the
CABG and PCI groups, according to the base case assumptions. CABG, coronary artery bypass
grafting; PCI, percutaneous coronary intervention.
Figure 4. Joint distribution of projected lifetime incremental costs and quality-adjusted life
expectancy for CABG vs. PCI based on bootstrap replication of the SYNTAX trial population,
plotted on the cost-effectiveness plane. The black circle represents the estimated mean values
(incremental cost=$5081, incremental QALYs=0.307). CABG, coronary artery bypass grafting;
PCI, percutaneous coronary intervention; QALY, quality-adjusted life-year.
Figure 5. Cost effectiveness acceptability curve of CABG vs. PCI. The probability that CABG is
percutaneous coronary intervention. Note that the first set of bars represent represessennntts tthehehe cccososo tsts
of the index hospitalization.
FFiguugure 3. Obseservrvveed ssuuurvivivivavaal l l thththrorougugughh h 555 yyyearrss aaand prprrediicictteted d suuurvrviivivalal bbbeeyyoonond d d 555 yeyeararars s fofof rrr ththhee
CACAABGBGBG aandndd PPPCICI ggrrooupupps, aacccororordididingngng tttoo ththheee bababaseses cccasassee aasssusumpmpmpttitiononons.s. CCCABABA GG,G, ccororronononararyy y aararteerryry bbypyppasassss
grafting; PCI,I,I, ppperere cucucutatat neneneouuusss cococ roroonanan ryryry intntnterererveveventntn ioioi n.n.n
by guest on May 29, 2018
http://circ.ahajournals.org/D
ownloaded from
DOI: 10.1161/CIRCULATIONAHA.114.009985
34
cost-effective is calculated as the proportion of bootstrap-derived estimates falling below a given
cost-effectiveness threshold and is plotted across a range of possible cost-effectiveness
thresholds. The solid blue line represents the base-case analysis, while the dashed red line
indicates the analysis in which the prognostic impact of MI and stroke were taken into account.
Figure 6. Sensitivity analysis of the ICER for CABG vs. PCI as a function of the stent price in
the overall population and according to the anatomic SYNTAX Score. The negative ICERs for
the low SYNTAX Score population indicate that PCI was economically dominant over the full
range of stent prices displayed.
by guest on May 29, 2018
http://circ.ahajournals.org/D
ownloaded from

Figure 1
by guest on May 29, 2018
http://circ.ahajournals.org/D
ownloaded from
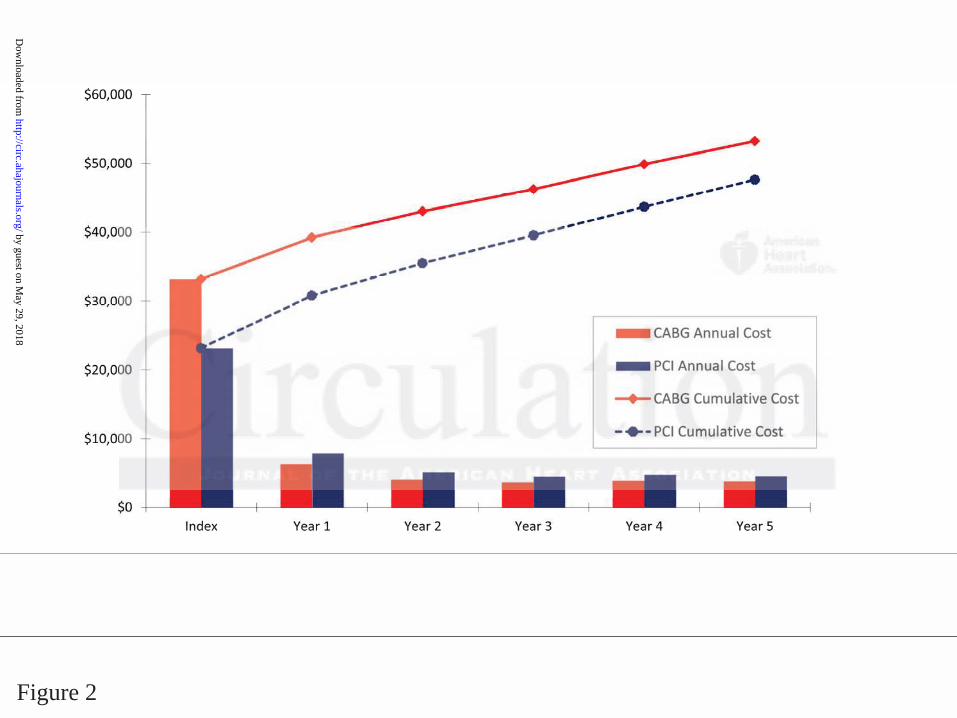
Figure 2
by guest on May 29, 2018
http://circ.ahajournals.org/D
ownloaded from
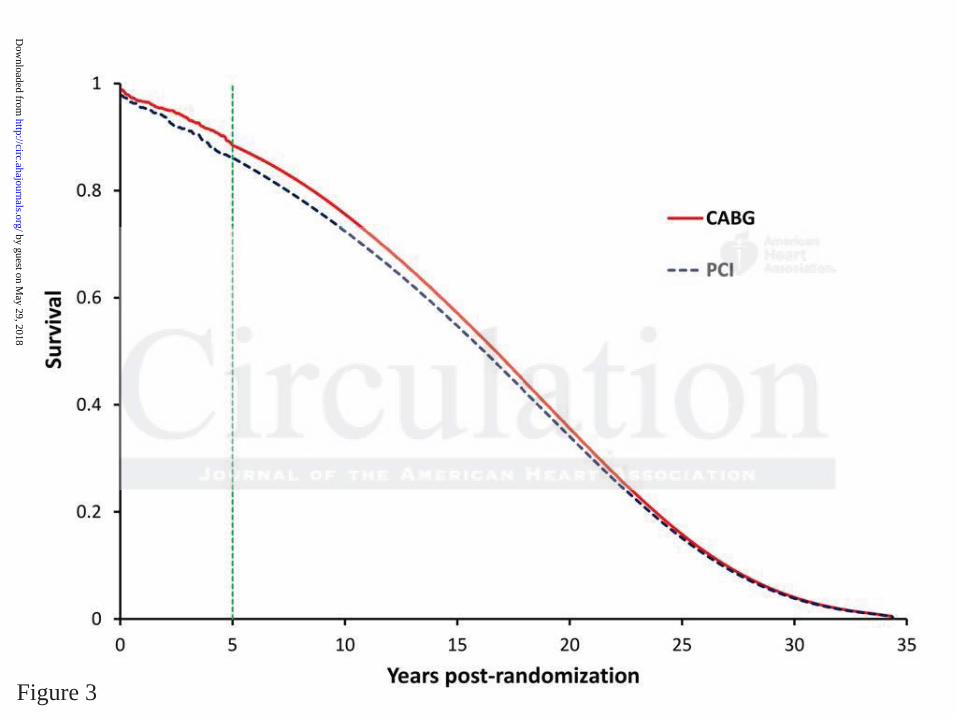
Figure 3
by guest on May 29, 2018
http://circ.ahajournals.org/D
ownloaded from
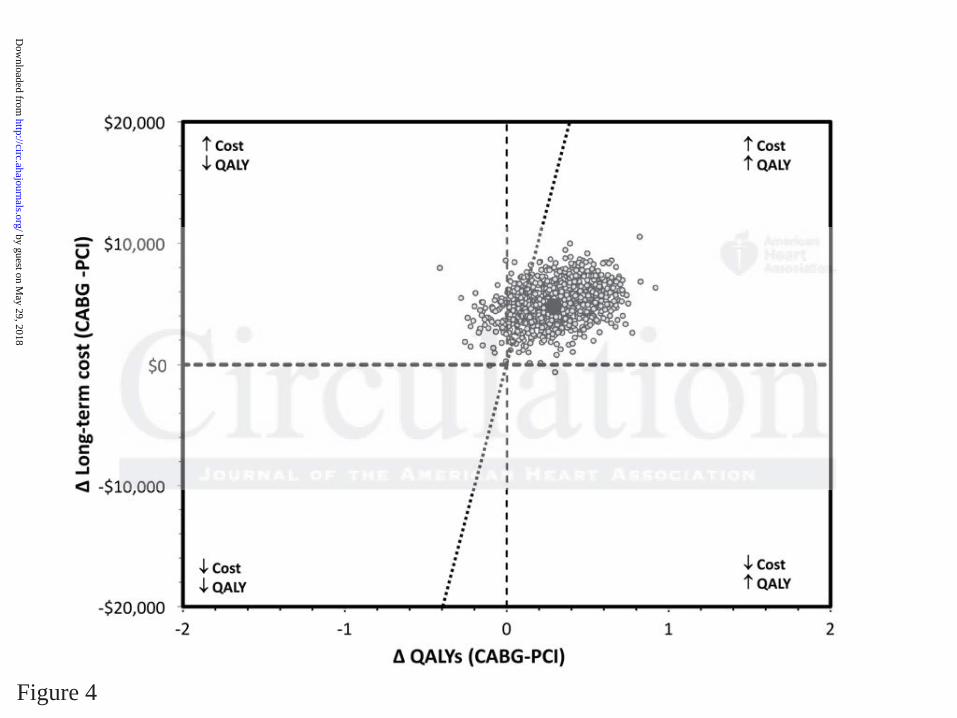
Figure 4
by guest on May 29, 2018
http://circ.ahajournals.org/D
ownloaded from
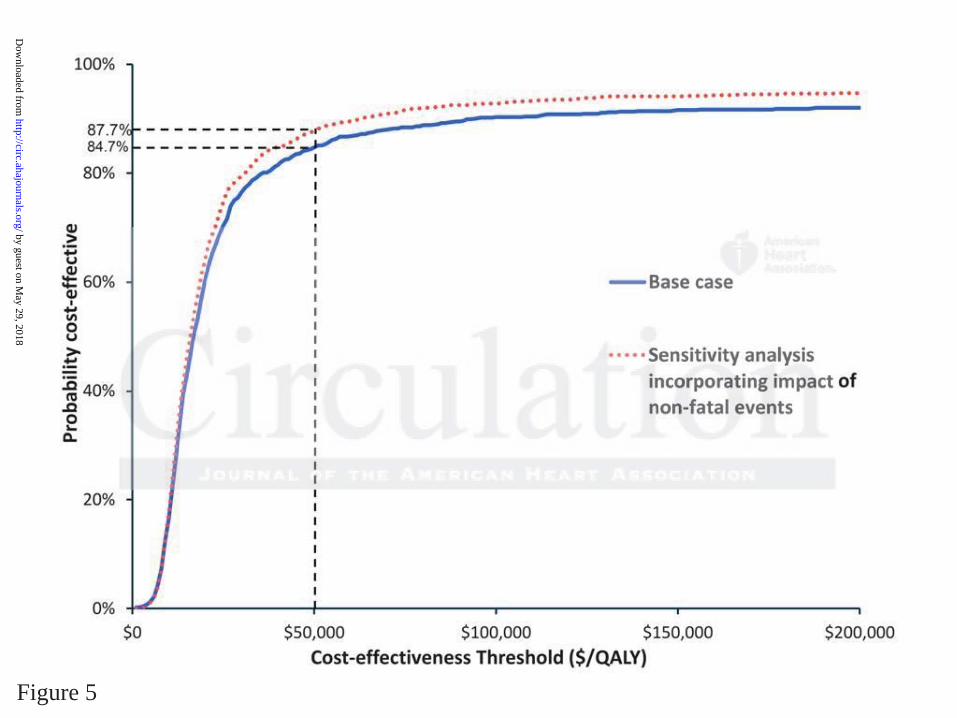
Figure 5
by guest on May 29, 2018
http://circ.ahajournals.org/D
ownloaded from
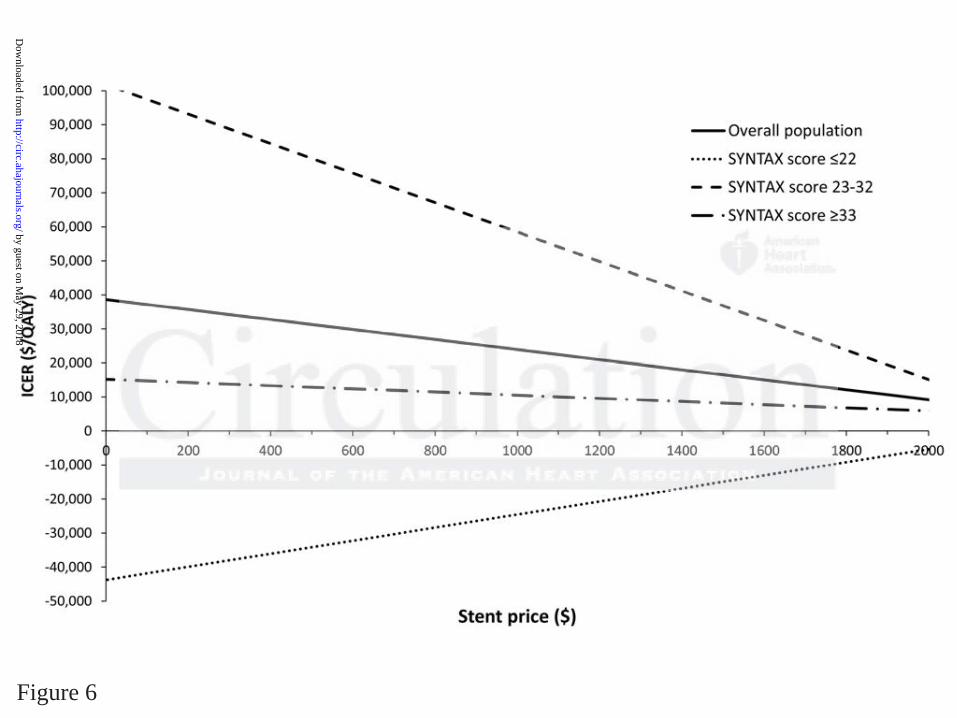
Figure 6
by guest on May 29, 2018
http://circ.ahajournals.org/D
ownloaded from

Keith D. Dawkins, A. Pieter Kappetein, Friedrich W. Mohr and Patrick W. SerruysChinnakondepalli, Duane Pinto, Mouin S. Abdallah, Katherine A. Vilain, Marie-Claude Morice, David J. Cohen, Ruben L. Osnabrugge, Elizabeth A. Magnuson, Kaijun Wang, Haiyan Li, Khaja
the SYNTAX TrialSurgery for Patients with 3-Vessel or Left Main Coronary Artery Disease: Final Results from
Cost-Effectiveness of Percutaneous Coronary Intervention with Drug-Eluting Stents vs. Bypass
Print ISSN: 0009-7322. Online ISSN: 1524-4539 Copyright © 2014 American Heart Association, Inc. All rights reserved.
is published by the American Heart Association, 7272 Greenville Avenue, Dallas, TX 75231Circulation published online August 1, 2014;Circulation.
http://circ.ahajournals.org/content/early/2014/08/01/CIRCULATIONAHA.114.009985World Wide Web at:
The online version of this article, along with updated information and services, is located on the
http://circ.ahajournals.org/content/suppl/2014/08/01/CIRCULATIONAHA.114.009985.DC1Data Supplement (unedited) at:
http://circ.ahajournals.org//subscriptions/
is online at: Circulation Information about subscribing to Subscriptions:
http://www.lww.com/reprints Information about reprints can be found online at: Reprints:
document. Permissions and Rights Question and Answer available in the
Permissions in the middle column of the Web page under Services. Further information about this process isOnce the online version of the published article for which permission is being requested is located, click Request
can be obtained via RightsLink, a service of the Copyright Clearance Center, not the Editorial Office.Circulation Requests for permissions to reproduce figures, tables, or portions of articles originally published inPermissions:
by guest on May 29, 2018
http://circ.ahajournals.org/D
ownloaded from
SUPPLEMENTAL MATERIAL
Table of contents
Supplemental Table 1. Linear regression models developed from MedPAR data for the
prediction of post-procedure costs.
Supplemental Table 2. Linear regression models developed from MedPAR data for the
prediction of post-procedure length of stay.
Supplemental Table 3. Regression model developed from SYNTAX follow-up cost for
the prediction of long-term costs.
Supplemental Table 4. Regression model developed from SYNTAX follow-up utility data
for the prediction of long-term QALYs.
Supplemental Table 5. EQ-5D Utility Scores by Treatment assignment.
Supplemental Table 6. In-trial 5-year cumulative Costs, QALYs, and life years.
Supplemental Table 7. Lifetime cost-effectiveness results, incorporating the impact of MI
and stroke.
Supplemental Table 8. Lifetime cost-effectiveness results for base case and sensitivity
analyses, expressed in terms of cost per life year gained (instead of QALY).
Supplemental Table 9. Lifetime cost-effectiveness results for subgroups, expressed in
terms of cost per life year gained (instead of QALY).
Supplemental Table 10. Sensitivity analysis on stent price in overall population and
SYNTAX Score.
Supplemental Table 11. Cost-effectiveness results incorporating productivity costs.
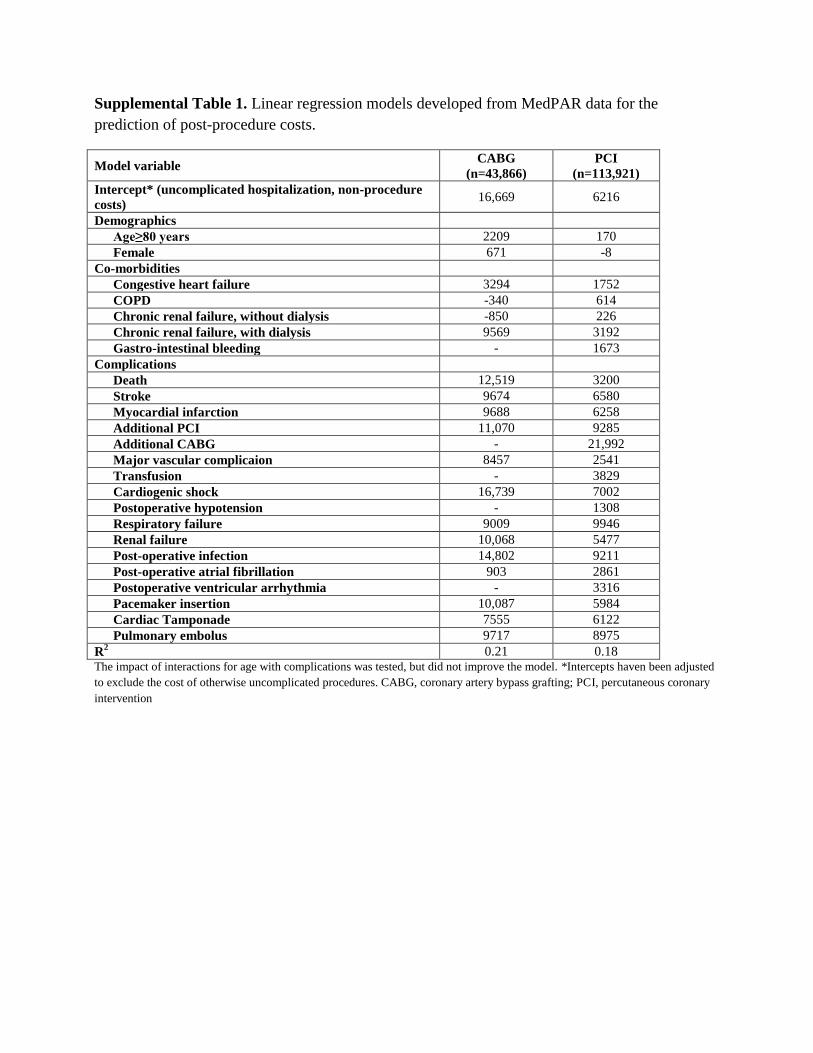
Supplemental Table 1. Linear regression models developed from MedPAR data for the
prediction of post-procedure costs.
Model variable CABG
(n=43,866)
PCI
(n=113,921)
Intercept* (uncomplicated hospitalization, non-procedure
costs) 16,669 6216
Demographics
Age≥80 years 2209 170
Female 671 -8
Co-morbidities
Congestive heart failure 3294 1752
COPD -340 614
Chronic renal failure, without dialysis -850 226
Chronic renal failure, with dialysis 9569 3192
Gastro-intestinal bleeding - 1673
Complications
Death 12,519 3200
Stroke 9674 6580
Myocardial infarction 9688 6258
Additional PCI 11,070 9285
Additional CABG - 21,992
Major vascular complicaion 8457 2541
Transfusion - 3829
Cardiogenic shock 16,739 7002
Postoperative hypotension - 1308
Respiratory failure 9009 9946
Renal failure 10,068 5477
Post-operative infection 14,802 9211
Post-operative atrial fibrillation 903 2861
Postoperative ventricular arrhythmia - 3316
Pacemaker insertion 10,087 5984
Cardiac Tamponade 7555 6122
Pulmonary embolus 9717 8975
R2 0.21 0.18
The impact of interactions for age with complications was tested, but did not improve the model. *Intercepts haven been adjusted
to exclude the cost of otherwise uncomplicated procedures. CABG, coronary artery bypass grafting; PCI, percutaneous coronary
intervention

Supplemental Table 2. Linear regression models developed from MedPAR data for the
prediction of post-procedure length of stay.
The impact of interactions for age with complications was tested, but did not improve the model. *Intercepts haven been adjusted
to exclude the cost of otherwise uncomplicated procedures. CABG, coronary artery bypass grafting; PCI, percutaneous coronary
intervention.
Model variable CABG
(n=43,866)
PCI
(n=113,921)
Intercept* (uncomplicated hospitalization, non-procedure
costs) 6.79 1.61
Demographics
Age≥80 years 0.94 0.23
Female 0.81 0.31
Co-morbidities
Congestive heart failure 1.50 1.35
COPD 0.14 0.46
Chronic renal failure, without dialysis -0.01 0.43
Chronic renal failure, with dialysis 3.18 1.46
Gastro-intestinal bleeding - 1.46
Complications
Death 0.07 -0.34
Stroke 4.33 3.07
Myocardial infarction 3.05 2.53
Additional PCI 1.03 1.52
Additional CABG - 5.34
Major vascular complicaion 1.81 1.09
Transfusion - 2.31
Cardiogenic shock 3.29 2.37
Postoperative hypotension - 0.22
Respiratory failure 2.99 4.33
Renal failure 4.29 3.80
Post-operative infection 7.92 5.10
Post-operative atrial fibrillation 0.61 1.62
Postoperative ventricular arrhythmia - 1.63
Pacemaker insertion 1.98 0.95
Cardiac Tamponade 3.70 1.01
Pulmonary embolus 4.39 4.68
R2 0.21 0.27
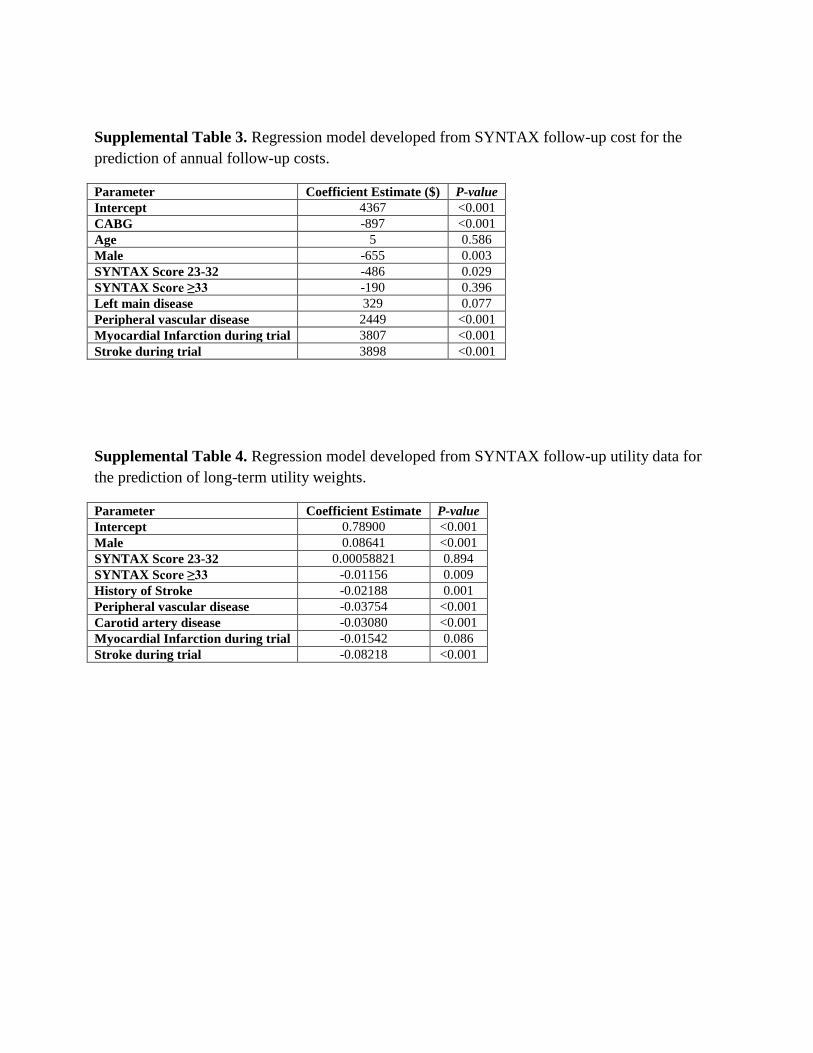
Supplemental Table 3. Regression model developed from SYNTAX follow-up cost for the
prediction of annual follow-up costs.
Parameter Coefficient Estimate ($) P-value
Intercept 4367 <0.001
CABG -897 <0.001
Age 5 0.586
Male -655 0.003
SYNTAX Score 23-32 -486 0.029
SYNTAX Score ≥33 -190 0.396
Left main disease 329 0.077
Peripheral vascular disease 2449 <0.001
Myocardial Infarction during trial 3807 <0.001
Stroke during trial 3898 <0.001
Supplemental Table 4. Regression model developed from SYNTAX follow-up utility data for
the prediction of long-term utility weights.
Parameter Coefficient Estimate P-value
Intercept 0.78900 <0.001
Male 0.08641 <0.001
SYNTAX Score 23-32 0.00058821 0.894
SYNTAX Score ≥33 -0.01156 0.009
History of Stroke -0.02188 0.001
Peripheral vascular disease -0.03754 <0.001
Carotid artery disease -0.03080 <0.001
Myocardial Infarction during trial -0.01542 0.086
Stroke during trial -0.08218 <0.001

Supplemental Table 5. EQ-5D Utility Scores by Treatment assignment.
Values in brackets are medians. CABG, coronary artery bypass graft; PCI, percutaneous coronary intervention. P-values are
derived from ANCOVA, adjusted for baseline.
Timepont CABG PCI P value
Baseline 0.741 ± 0.191 [0.800] 0.754 ± 0.187 [0.800]
1 month 0.769 ± 0.171 [0.816] 0.853 ± 0.156 [0.844] <0.001
6 months 0.847 ± 0.153 [0.827] 0.862 ± 0.150 [0.844] 0.09
12 months 0.850 ± 0.158 [0.827] 0.854 ± 0.157 [0.844] 0.98
36 months 0.850 ± 0.161 [0.843] 0.847 ± 0.164 [0.833] 0.62
60 months 0.846 ± 0.173 [0.838] 0.843 ± 0.174 [0.843] 0.83
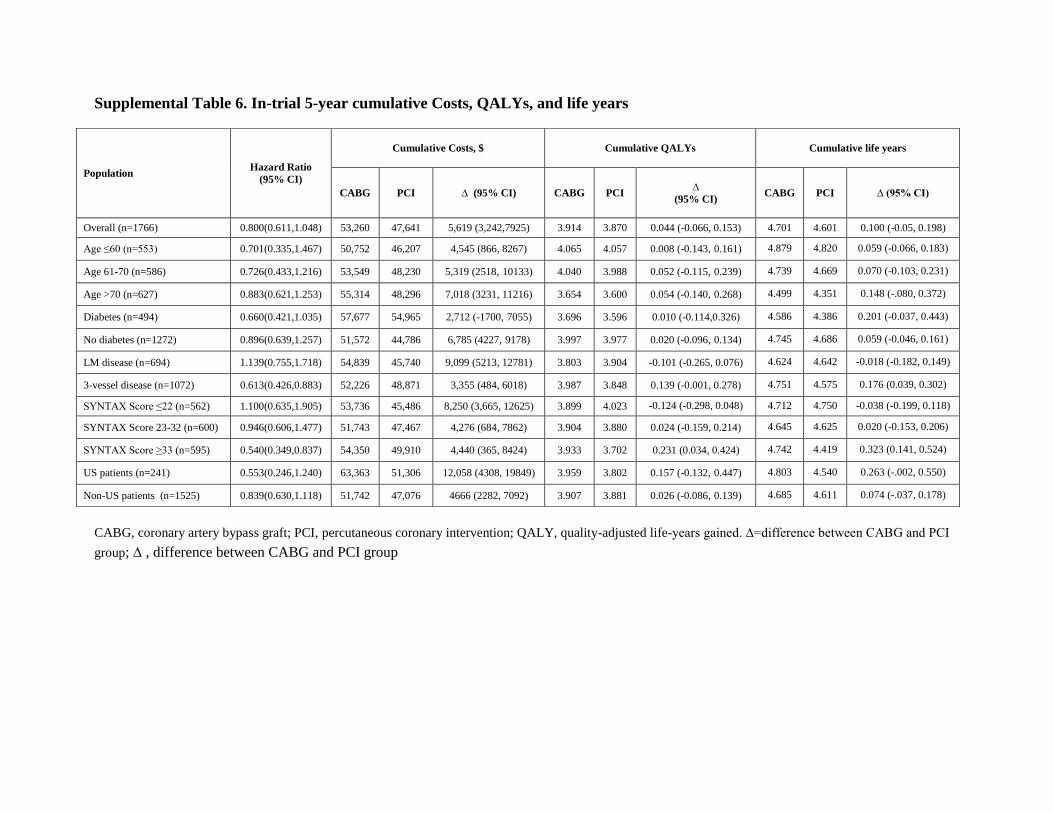
Supplemental Table 6. In-trial 5-year cumulative Costs, QALYs, and life years
CABG, coronary artery bypass graft; PCI, percutaneous coronary intervention; QALY, quality-adjusted life-years gained. ∆=difference between CABG and PCI
group; , difference between CABG and PCI group
Population Hazard Ratio
(95% CI)
Cumulative Costs, $ Cumulative QALYs Cumulative life years
CABG PCI ∆ (95% CI) CABG PCI ∆
(95% CI) CABG PCI ∆ (95% CI)
Overall (n=1766) 0.800(0.611,1.048) 53,260 47,641 5,619 (3,242,7925) 3.914 3.870 0.044 (-0.066, 0.153) 4.701 4.601 0.100 (-0.05, 0.198)
Age ≤60 (n=553) 0.701(0.335,1.467) 50,752 46,207 4,545 (866, 8267) 4.065 4.057 0.008 (-0.143, 0.161) 4.879 4.820 0.059 (-0.066, 0.183)
Age 61-70 (n=586) 0.726(0.433,1.216) 53,549 48,230 5,319 (2518, 10133) 4.040 3.988 0.052 (-0.115, 0.239) 4.739 4.669 0.070 (-0.103, 0.231)
Age >70 (n=627) 0.883(0.621,1.253) 55,314 48,296 7,018 (3231, 11216) 3.654 3.600 0.054 (-0.140, 0.268) 4.499 4.351 0.148 (-.080, 0.372)
Diabetes (n=494) 0.660(0.421,1.035) 57,677 54,965 2,712 (-1700, 7055) 3.696 3.596 0.010 (-0.114,0.326) 4.586 4.386 0.201 (-0.037, 0.443)
No diabetes (n=1272) 0.896(0.639,1.257) 51,572 44,786 6,785 (4227, 9178) 3.997 3.977 0.020 (-0.096, 0.134) 4.745 4.686 0.059 (-0.046, 0.161)
LM disease (n=694) 1.139(0.755,1.718) 54,839 45,740 9,099 (5213, 12781) 3.803 3.904 -0.101 (-0.265, 0.076) 4.624 4.642 -0.018 (-0.182, 0.149)
3-vessel disease (n=1072) 0.613(0.426,0.883) 52,226 48,871 3,355 (484, 6018) 3.987 3.848 0.139 (-0.001, 0.278) 4.751 4.575 0.176 (0.039, 0.302)
SYNTAX Score ≤22 (n=562) 1.100(0.635,1.905) 53,736 45,486 8,250 (3,665, 12625) 3.899 4.023 -0.124 (-0.298, 0.048) 4.712 4.750 -0.038 (-0.199, 0.118)
SYNTAX Score 23-32 (n=600) 0.946(0.606,1.477) 51,743 47,467 4,276 (684, 7862) 3.904 3.880 0.024 (-0.159, 0.214) 4.645 4.625 0.020 (-0.153, 0.206)
SYNTAX Score ≥33 (n=595) 0.540(0.349,0.837) 54,350 49,910 4,440 (365, 8424) 3.933 3.702 0.231 (0.034, 0.424) 4.742 4.419 0.323 (0.141, 0.524)
US patients (n=241) 0.553(0.246,1.240) 63,363 51,306 12,058 (4308, 19849) 3.959 3.802 0.157 (-0.132, 0.447) 4.803 4.540 0.263 (-.002, 0.550)
Non-US patients (n=1525) 0.839(0.630,1.118) 51,742 47,076 4666 (2282, 7092) 3.907 3.881 0.026 (-0.086, 0.139) 4.685 4.611 0.074 (-.037, 0.178)
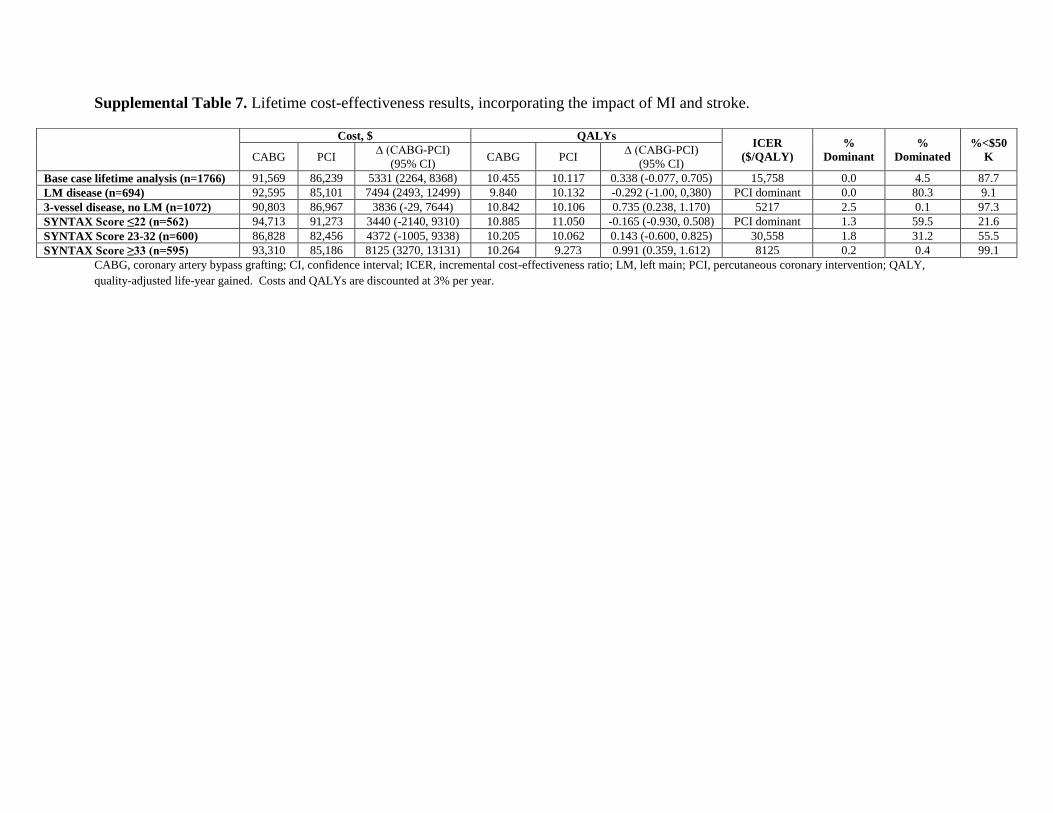
Supplemental Table 7. Lifetime cost-effectiveness results, incorporating the impact of MI and stroke.
CABG, coronary artery bypass grafting; CI, confidence interval; ICER, incremental cost-effectiveness ratio; LM, left main; PCI, percutaneous coronary intervention; QALY,
quality-adjusted life-year gained. Costs and QALYs are discounted at 3% per year.
Cost, $ QALYs ICER
($/QALY)
%
Dominant
%
Dominated
%<$50
K CABG PCI ∆ (CABG-PCI)
(95% CI) CABG PCI
∆ (CABG-PCI)
(95% CI)
Base case lifetime analysis (n=1766) 91,569 86,239 5331 (2264, 8368) 10.455 10.117 0.338 (-0.077, 0.705) 15,758 0.0 4.5 87.7
LM disease (n=694) 92,595 85,101 7494 (2493, 12499) 9.840 10.132 -0.292 (-1.00, 0,380) PCI dominant 0.0 80.3 9.1
3-vessel disease, no LM (n=1072) 90,803 86,967 3836 (-29, 7644) 10.842 10.106 0.735 (0.238, 1.170) 5217 2.5 0.1 97.3
SYNTAX Score ≤22 (n=562) 94,713 91,273 3440 (-2140, 9310) 10.885 11.050 -0.165 (-0.930, 0.508) PCI dominant 1.3 59.5 21.6
SYNTAX Score 23-32 (n=600) 86,828 82,456 4372 (-1005, 9338) 10.205 10.062 0.143 (-0.600, 0.825) 30,558 1.8 31.2 55.5
SYNTAX Score ≥33 (n=595) 93,310 85,186 8125 (3270, 13131) 10.264 9.273 0.991 (0.359, 1.612) 8125 0.2 0.4 99.1
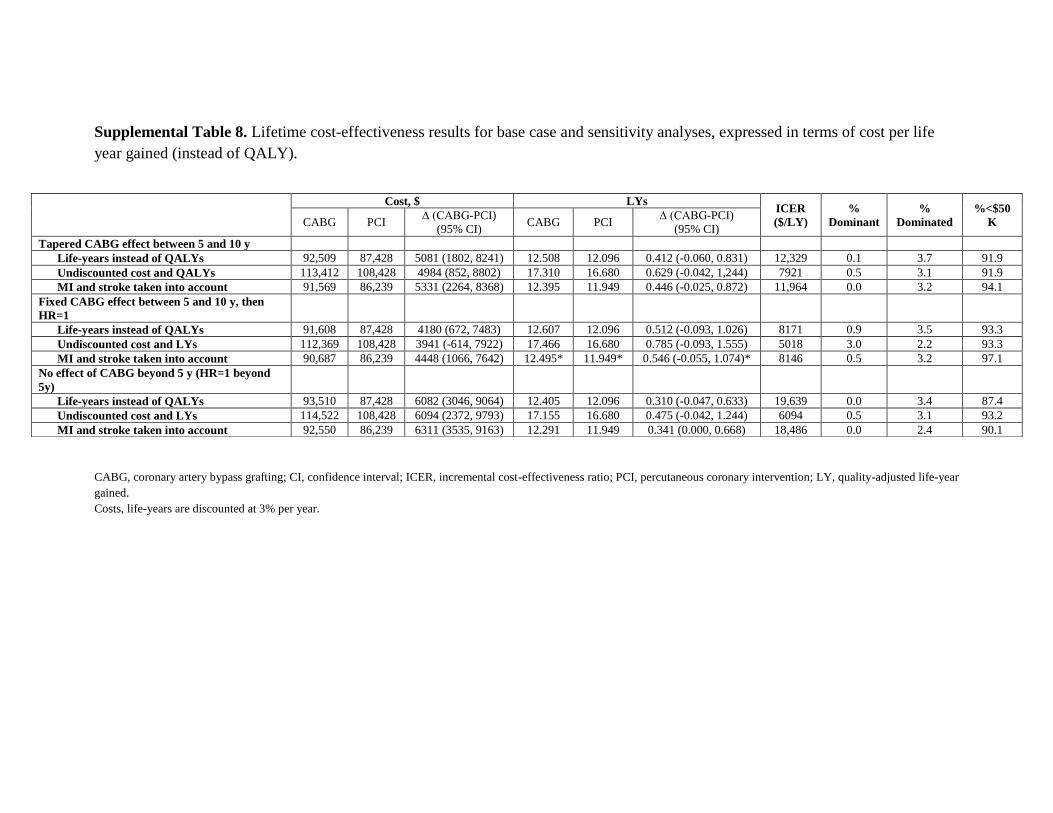
Supplemental Table 8. Lifetime cost-effectiveness results for base case and sensitivity analyses, expressed in terms of cost per life
year gained (instead of QALY).
CABG, coronary artery bypass grafting; CI, confidence interval; ICER, incremental cost-effectiveness ratio; PCI, percutaneous coronary intervention; LY, quality-adjusted life-year
gained.
Costs, life-years are discounted at 3% per year.
Cost, $ LYs ICER
($/LY)
%
Dominant
%
Dominated
%<$50
K CABG PCI ∆ (CABG-PCI)
(95% CI) CABG PCI
∆ (CABG-PCI)
(95% CI)
Tapered CABG effect between 5 and 10 y
Life-years instead of QALYs 92,509 87,428 5081 (1802, 8241) 12.508 12.096 0.412 (-0.060, 0.831) 12,329 0.1 3.7 91.9
Undiscounted cost and QALYs 113,412 108,428 4984 (852, 8802) 17.310 16.680 0.629 (-0.042, 1,244) 7921 0.5 3.1 91.9
MI and stroke taken into account 91,569 86,239 5331 (2264, 8368) 12.395 11.949 0.446 (-0.025, 0.872) 11,964 0.0 3.2 94.1
Fixed CABG effect between 5 and 10 y, then
HR=1
Life-years instead of QALYs 91,608 87,428 4180 (672, 7483) 12.607 12.096 0.512 (-0.093, 1.026) 8171 0.9 3.5 93.3
Undiscounted cost and LYs 112,369 108,428 3941 (-614, 7922) 17.466 16.680 0.785 (-0.093, 1.555) 5018 3.0 2.2 93.3
MI and stroke taken into account 90,687 86,239 4448 (1066, 7642) 12.495* 11.949* 0.546 (-0.055, 1.074)* 8146 0.5 3.2 97.1
No effect of CABG beyond 5 y (HR=1 beyond
5y)
Life-years instead of QALYs 93,510 87,428 6082 (3046, 9064) 12.405 12.096 0.310 (-0.047, 0.633) 19,639 0.0 3.4 87.4
Undiscounted cost and LYs 114,522 108,428 6094 (2372, 9793) 17.155 16.680 0.475 (-0.042, 1.244) 6094 0.5 3.1 93.2
MI and stroke taken into account 92,550 86,239 6311 (3535, 9163) 12.291 11.949 0.341 (0.000, 0.668) 18,486 0.0 2.4 90.1

Supplemental Table 9. Lifetime cost-effectiveness results for subgroups, expressed in terms of cost per life year gained (instead of
QALY).
CABG, coronary artery bypass grafting; CI, confidence interval; ICER, incremental cost-effectiveness ratio; PCI, percutaneous coronary intervention; LY, life-year gained.
Costs and LYs are discounted at 3% per year.
Cost, $ LYs
ICER ($/LY) %
Dominant
%
Dominated
%<$50
K CABG PCI ∆ (CABG-PCI)
(95% CI) CABG PCI
∆ (CABG-PCI)
(95% CI)
Male (n=1377) 89,677 86,246 3431 (-1, 7248) 12.436 12.349 0.088 (-0.410, -1.308) 39,084 0.8 25.8 64.0
Female (n=389) 103,773 91,825 11,948 (3470, 17916) 12.668 11.285 1.383 (0.323, 2.048) 8639 0.1 0.6 98.7
Age ≤60 (n=553) 105,305 101,926 3378 (-3261, 9692) 16.830 16.414 0.416 (-0.436, 1.136) 8122 7.8 8.6 76.3
Age 61-70 (n=586) 92,881 88,303 4578 (-1070, 10581) 12.415 11.995 0.420 (-0.464, 1.180) 10,901 3.6 12.8 74.0
Age >70 (n=627) 80,810 73,555 7254 (1972, 12302) 8.711 8.365 0.346 (-0.500, 1.082) 20953 0.2 18.2 70.5
Diabetes (n=1272) 97,787 91,943 5843 (-378, 12214) 12.202 11.402 0.801 (-0.099, 1.633) 7299 2.6 3.1 92.0
No diabetes (n=494) 90,383 85,644 4739 (908, 8519) 12.595 12.370 0.225 (-0.337, 0.746) 21,078 0.1 20.6 69.5
LM disease (n=694) 93,732 86,114 7618 (2225, 12734) 11.895 12.119 -0.225 (-1.027, 0.566) PCI Dominant 0.0 72.5 15.5
3-vessel disease, no LM (n=1072) 91,619 88,270 3350 (-673, 7368) 12.891 12.080 0.811 (0.234, 1.327) 4129 5.2 0.1 94.5
SYNTAX Score ≤22 (n=562) 95,624 92,582 3043 (-2826, 9205) 13.019 13.176 -0.157 (-1.009, 0.616) PCI Dominant 1.8 51.7 25.8
SYNTAX Score 23-32 (n=600) 87,747 83,540 4207 (-1432, 9544) 12.132 12.003 0.130 (-0.689, 0.876) 32,487 1.9 32.9 54.1
SYNTAX Score ≥33 (n=595) 94,309 86,384 7925 (2740, 13296) 12.364 11.156 1.208 (0.500, 1.923) 6560 0.2 0 99.7
US patients (n=241) 105,396 96,015 9382 (-1623, 20402) 12.999 12.026 0.973 (-0.262, 2.109) 9641 3.2 3.9 88.9
Non-US patients (n=1525) 90,500 86,086 4414 (1027, 7601) 12.435 12.107 0.328 (-0,170, 0.801) 13,445 0.2 8.9 88.4
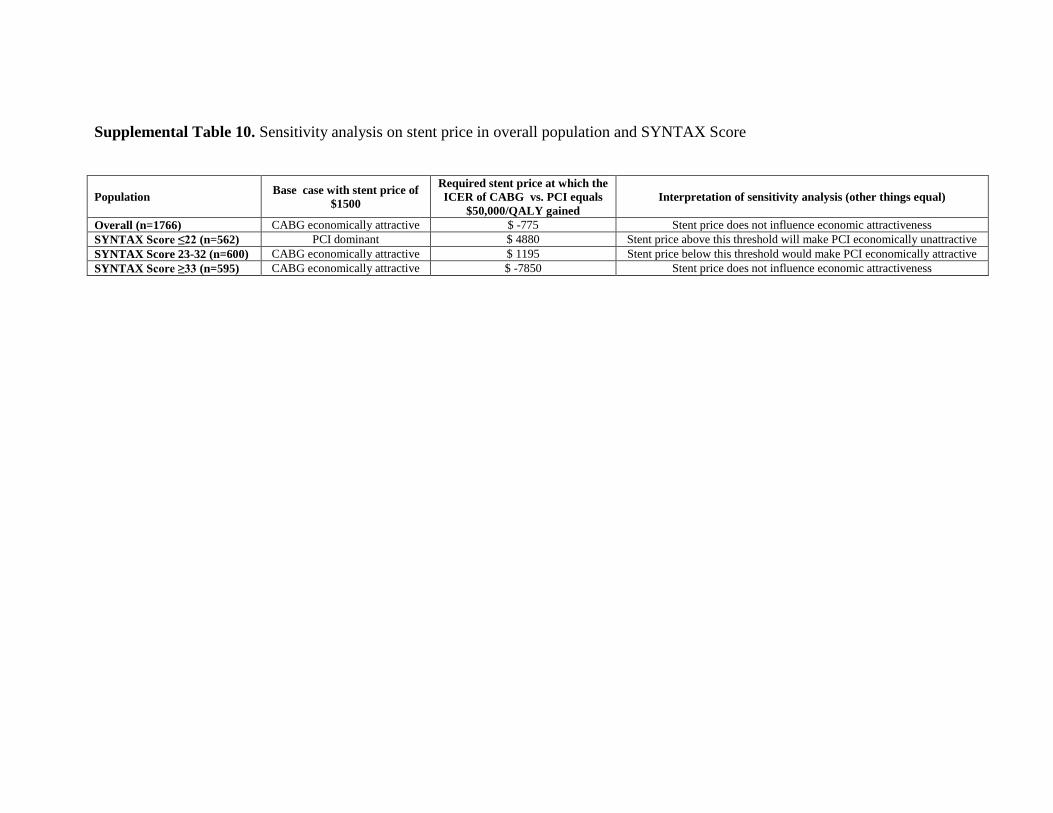
Supplemental Table 10. Sensitivity analysis on stent price in overall population and SYNTAX Score
Population Base case with stent price of
$1500
Required stent price at which the
ICER of CABG vs. PCI equals
$50,000/QALY gained
Interpretation of sensitivity analysis (other things equal)
Overall (n=1766) CABG economically attractive $ -775 Stent price does not influence economic attractiveness
SYNTAX Score ≤22 (n=562) PCI dominant $ 4880 Stent price above this threshold will make PCI economically unattractive
SYNTAX Score 23-32 (n=600) CABG economically attractive $ 1195 Stent price below this threshold would make PCI economically attractive
SYNTAX Score ≥33 (n=595) CABG economically attractive $ -7850 Stent price does not influence economic attractiveness
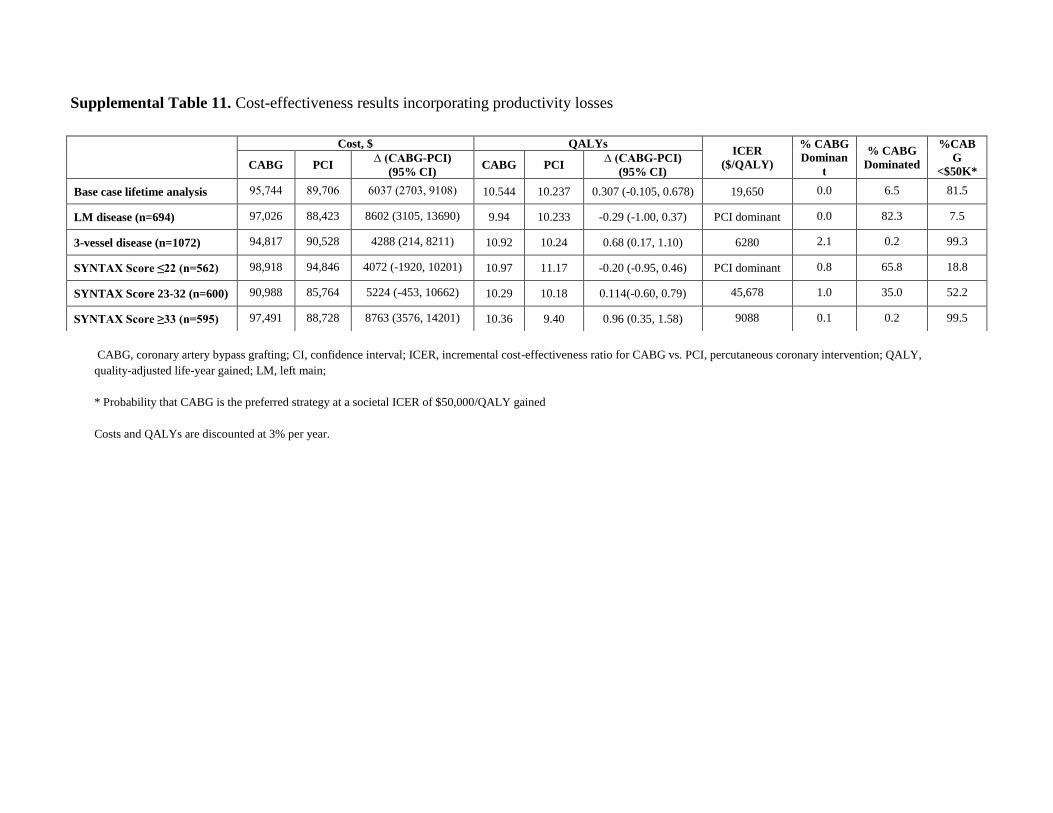
Supplemental Table 11. Cost-effectiveness results incorporating productivity losses
CABG, coronary artery bypass grafting; CI, confidence interval; ICER, incremental cost-effectiveness ratio for CABG vs. PCI, percutaneous coronary intervention; QALY,
quality-adjusted life-year gained; LM, left main;
* Probability that CABG is the preferred strategy at a societal ICER of $50,000/QALY gained
Costs and QALYs are discounted at 3% per year.
Cost, $ QALYs ICER
($/QALY)
% CABG
Dominan
t
% CABG
Dominated
%CAB
G
<$50K* CABG PCI
∆ (CABG-PCI)
(95% CI) CABG PCI
∆ (CABG-PCI)
(95% CI)
Base case lifetime analysis 95,744 89,706 6037 (2703, 9108) 10.544 10.237 0.307 (-0.105, 0.678) 19,650 0.0 6.5 81.5
LM disease (n=694) 97,026 88,423 8602 (3105, 13690) 9.94 10.233 -0.29 (-1.00, 0.37) PCI dominant 0.0 82.3 7.5
3-vessel disease (n=1072) 94,817 90,528 4288 (214, 8211) 10.92 10.24 0.68 (0.17, 1.10) 6280 2.1 0.2 99.3
SYNTAX Score ≤22 (n=562) 98,918 94,846 4072 (-1920, 10201) 10.97 11.17 -0.20 (-0.95, 0.46) PCI dominant 0.8 65.8 18.8
SYNTAX Score 23-32 (n=600) 90,988 85,764 5224 (-453, 10662) 10.29 10.18 0.114(-0.60, 0.79) 45,678 1.0 35.0 52.2
SYNTAX Score ≥33 (n=595) 97,491 88,728 8763 (3576, 14201) 10.36 9.40 0.96 (0.35, 1.58) 9088 0.1 0.2 99.5