Cost decreases in environmental technology · Milieutechnologie vormt geen uitzondering op deze...
43
Cost decreases in environmental technology Evidence from four case studies Frans Oosterhuis Report number R-07/05 July 2007
Transcript of Cost decreases in environmental technology · Milieutechnologie vormt geen uitzondering op deze...

Cost decreases in environmental technology
Evidence from four case studies
Frans Oosterhuis
Report number R-07/05
July 2007

This report was commissioned by: Milieu- en Natuurplanbureau
It was internally reviewed by: Rob Dellink
IVM
Institute for Environmental Studies Vrije Universiteit De Boelelaan 1087 1081 HV Amsterdam The Netherlands
Tel. ++31-20-5989 555 Fax. ++31-20-5989 553 E-mail: [email protected]
Copyright © 2007, Institute for Environmental Studies
All rights reserved. No part of this publication may be reproduced, stored in a retrieval system or transmitted in any form or by any means, electronic, mechanical, photocopy-ing, recording or otherwise without the prior written permission of the copyright holder.

Cost decreases in environmental technology iii
Contents
Acknowledgements v
Abstract vii
Samenvatting ix
1. Introduction 1
2. NOx emission abatement by Selective Catalytic Reduction (SCR) 3 2.1 Introduction 3 2.2 Cost estimates per tonne of NOx abated in various applications 4 2.3 Investment costs for coal fired power plants 6 2.4 Other aspects 10 2.5 Conclusions 11
3. NH3 emission abatement by air scrubbers in pig farming 13 3.1 Introduction 13 3.2 Abatement costs 13
3.2.1 Investment costs 13 3.2.2 Costs per unit of emission reduction 14 3.2.3 Perspectives for cost decreases 14 3.2.4 Comparison with earlier estimates 14
3.3 Conclusions 15
4. Catalytic converters in cars 17 4.1 Introduction 17 4.2 Chronological development of cost estimates 17 4.3 Conclusions 19
5. Compact fluorescent lamps 21 5.1 Market development 21 5.2 Development of prices and production costs 22 5.3 Conclusions 25
6. Conclusions 27
References 29


Cost decreases in environmental technology v
Acknowledgements
This study was made possible by MNP, as background information for the ‘Milieubalans 2007’. The author would like to thank Albert Faber, Kees Peek and Jan van Dam of MNP for their assistance, comments and support in obtaining data. Charles Owusu (trainee at IVM) provided some useful information sources for Chapter 5.


Cost decreases in environmental technology vii
Abstract
The cost of a new technology tends to decrease as its uptake grows, and environmental technology is no exception to this general rule. Factors that can bring about such cost re-ductions include economies of scale, ‘learning-by-doing’, incremental technological im-provements, and growing competition. In preparing environmental policies, the potential for future cost reductions is often disregarded.
The present study aims to provide some additional empirical evidence on the cost de-creases in environmental technology and the factors that lie behind them. To this end, four exemplary case studies have been selected.
The first case (NOx emission abatement by Selective Catalytic Reduction (SCR)), shows a wide variety in cost estimates, without a clear trend. This is even true for the costs of a fairly homogeneous type of investment (SCR in coal fired power plants). Nevertheless, it is clear that an important cost decrease has been achieved by prolonging the lifetime of the catalyst, which is one of the main cost components in SCR.
In the second case (NH3 emission abatement by chemical air scrubbers in pig farming) there is not yet sufficient experience with the technology to draw conclusions on the de-velopment of costs. However, it is already clear that economizing on the capacity of the system can contribute to important cost savings.
Three-way catalytic converters in cars have shown significant price decreases following their large scale introduction on the European market in the early 1990s. Probably economies of scale have played an important role in this case, as the size of the market made mass production possible. To some extent, cost reductions may also be attributed to improvements such as the need for less materials (e.g. platinum). Furthermore, the performance of catalytic converters has improved, implying that the cost per unit of emission reduction has decreased even more than the cost of the device itself.
Market prices of Compact Fluorescent Lamps (CFLs) also have decreased considerably over the past 20 years. In addition to economies of scale, increased competition (espe-cially from China) seems to have played an important role in this case. Learning-by-doing and incremental technological improvements have mainly contributed to better product quality.
The case study findings suggest that economies of scale and enhanced competition are important sources of cost reduction in standard (consumer) products, whereas ‘learning by doing’ and incremental technological improvements are relatively important factors contributing to cost reductions in process-related technology.


Cost decreases in environmental technology ix
Samenvatting
De kosten van een nieuwe technologie hebben de neiging om te dalen naarmate de toe-passing ervan toeneemt. Milieutechnologie vormt geen uitzondering op deze regel. Tot de factoren die bijdragen aan zulke kostendalingen behoren schaalvoordelen, ‘learning-by-doing’, incrementele technologische verbeteringen en toenemende concurrentie. Bij de totstandkoming van milieubeleidsmaatregelen wordt het potentieel voor zulke kosten-dalingen vaak buiten beschouwing gelaten.
Deze studie heeft tot doel om, in aanvulling op eerder onderzoek, empirische gegevens bijeen te brengen betreffende de kostendalingen van milieutechnologie en de achterlig-gende factoren. Dit is gedaan aan de hand van vier cases.
De eerste case (NOx-emissiebeperking door middel van Selectieve Katalytische Reductie (SCR)), laat een breed spectrum aan kostenschattingen zien, zonder duidelijke trend. Dat geldt zelfs voor de kosten van één tamelijk homogeen type investeringen (SCR in kolen-gestookte elektriciteitscentrales). Toch komt uit deze case wel naar voren dat er in de loop van de tijd belangrijke kostenbesparingen zijn gerealiseerd door het verlengen van de levensduur van de katalysator (een van de grootste kostencomponenten bij SCR)..
In de tweede case (NH3-emissiebeperking door chemische luchtwassers in de varkens-houderij) bleek nog onvoldoende ervaring te bestaan met de technologie om al conclu-sies te kunnen trekken over de kostenontwikkeling. Niettemin is al wel duidelijk dat het beperken van de capaciteit van het systeem kan bijdragen aan belangrijke kostenbespa-ringen.
Driewegkatalysatoren in auto’s hebben, sinds hun grootschalige introductie op de Euro-pese markt aan het begin van de jaren ’90, aanzienlijke prijsdalingen te zien gegeven. Waarschijnlijk hebben schaalvoordelen in dit geval een belangrijke rol gespeeld, aange-zien de omvang van de markt massaproductie mogelijk maakte. In zekere mate kunnen de kostendalingen ook worden toegeschreven aan verbeteringen zoals een vermindering van de benodigde hoeveelheid materialen (zoals platina). Bovendien is de prestatie van katalysatoren verbeterd, hetgeen betekent dat de kosten per eenheid emissiereductie ster-ker zijn gedaald dan de kosten van het apparaat zelf.
Ook de marktprijzen van spaarlampen zijn in de afgelopen 20 jaar sterk gedaald. Niet al-leen schaalvoordelen waren hierbij van belang, maar vooral ook de toegenomen concur-rentie (met name vanuit China). ‘Learning-by-doing’ en incrementele technologische verbeteringen hebben in deze case vooral bijgedragen aan een hogere productkwaliteit.
De bevindingen van de cases laten zien dat schaalvoordelen en groeiende concurrentie belangrijke bronnen van kostenreductie zijn bij standaard (consumenten)producten, ter-wijl ‘learning-by-doing’ en incrementele technologische verbeteringen belangrijke facto-ren zijn bij procesgerelateerde technologie.


Cost decreases in environmental technology 1
1. Introduction
The Netherlands Environmental Assessment Agency (Milieu- en Natuurplanbureau, MNP) publishes an annual ‘Milieubalans’ (Environmental Balance). In 2006, the Mi-lieubalans paid attention to the influence of technological development on the cost of emission reductions. The Milieubalans 2007 will address this issue again, and will in particular deal with cost decreases that occur during the process of development and ap-plication of cleaner technology. Such cost decreases are often reflected in so-called ‘learning curves’, which show the costs of a new technology as a function of its cumula-tive production or application.
There are several factors that can explain the cost decreases. First of all, ‘learning-by-doing’ in applying a new technology leads to efficiency gains. Furthermore, incremental technical improvements are quite common, which may lead to lower costs and/or higher quality of the process or product. Economies of scale (for example, made possible by mass production) can reduce the costs per unit significantly, as fixed costs (including R&D) can be spread over a much larger output volume. Competition among suppliers also tends to grow during a technology’s life cycle, especially when patents expire. While this competition may not reduce costs for the suppliers, it certainly does so for the users.
Cost reductions over time are common to all kinds of technology, and environmental technology is no exception. Several studies have shown that the cost estimates made in preparing environmental policies (‘ex ante costs’) often exceed the costs observed when the policy has been in place for some time (‘ex post costs’) (see, for instance, SEI, 1999; Oosterhuis (ed.), 2006 ). In other words, ex ante costs are often overestimated, which may sometimes imply that environmental policies that would have been justified from a cost-effectiveness point of view are adopted at a too low level of stringency, or not at all.
One of the explanations for the difference between ‘ex ante’ and ‘ex post’ costs of envi-ronmental technology is the fact that potential future cost reductions are usually not taken into account during the stage of policy formulation. A relevant question is there-fore, whether it is possible to formulate certain ‘rules of thumb’ regarding the cost de-creases that can be expected. An attempt to do so was already made some years ago by Honig et al. (2000), who arrived at a possible overestimation of at least 12% for the en-vironmental costs of all target groups in 2020.
The present study does not intend to arrive at a ‘better rule of thumb’, but rather aims to provide some additional empirical evidence on the cost decreases in environmental tech-nology and the factors that lie behind them. To this end, four case studies have been se-lected, which cover processes as well as products, and different types of environmental issues. The case studies relate to: NOx emission abatement by Selective Catalytic Reduc-tion (SCR) (Chapter 2); NH3 emission abatement by air scrubbers in pig farming (Chap-ter 3); catalytic converters in cars (Chapter 4); and Compact Fluorescent Lamps (Chapter 5). In Chapter 6, some tentative conclusions are formulated.
Obviously, the approach taken in this study has its limitations. Data on (average or mar-ginal) production costs are usually not directly available, and reported market prices usu-

Institute for Environmental Studies 2
ally had to be used as a proxy. Furthermore, the selected case studies are not necessarily representative for environmental technology in general. Finally, the conclusions relating to the factors behind the cost decreases are based on ‘expert judgment’ rather than statis-tical analyses. Nevertheless, the results are believed to contain some useful material il-lustrating the importance of cost reducing mechanisms in environmental innovation processes.

Cost decreases in environmental technology 3
2. NOx emission abatement by Selective Catalytic
Reduction (SCR)
2.1 Introduction
Selective Catalytic Reduction (SCR) is an ‘end-of-pipe’ technique to reduce nitrogen ox-ides (NOx) in the flue gases from combustion and other processes. Essentially, it implies a reaction between NOx and ammonia (NH3)
1, resulting in the formation of elemental ni-trogen (N2) and water (H2O). This reaction is promoted by the presence of a catalyst (such as a combination of TiO2 and V2O5, or zeolite). This technique can achieve high NOx reduction rates (over 90%), but requires considerable investments.
Japanese power companies started to apply SCR already in the 1970s, in response to stringent NOx emission standards. Initially, gas and oil fired combustion plants were equipped with SCR. In 1980 the first coal power plant followed suit.
During the mid-1980s, SCR began to conquer Europe as well. By 1987, eight SCR sys-tems (totalling 2,200 MW capacity) were operating in Germany and Austria, with an-other 20,000 MW under construction or on order in those countries (Offen et al., 1987). Following the EU’s 1988 Large Combustion Plants Directive (which required substantial NOx emission reductions from power plants) SCR found its way into several other Euro-pean countries. In the Netherlands, the first power plant was equipped with SCR in 1994. By 1995, 400 SCR units had commenced operations on coal, oil and gas fired boilers in many countries (Takeshita, 1995). Figure 2.1 shows the worldwide growth in SCR in coal fired power plants.
Figure 2.1. Cumulative installed capacity of SCR systems on coal-fired power plants in the US, Japan, Germany, and rest of the world. (Source: Rubin et al., 2004).
1 Instead of ammonia, urea is sometimes used as a reduction agent.

Institute for Environmental Studies 4
In Section 2.2, the development of cost estimates per tonne of NOx abated for a broad range of SCR applications is addressed. For comparison purposes, however, the invest-ment costs associated with SCR in a standardised plant are the preferable variable to look at. This eliminates as much as possible the variation caused by parameters such as production process (with resulting variation in NOx concentration, flue gas temperature etc.), plant size, differences in interest and depreciation rates etc.. In the present case study, SCR in coal fired power plants was selected, providing the most uniform type of application, with a reasonable number of cost estimates over time (Section 2.3).
2.2 Cost estimates per tonne of NOx abated in various applications
Table 2.1 presents a sample of SCR cost estimates found in the literature. They are grouped by area of application, and within the same area in chronological order. The fig-ures presented include both ex ante and ex post data.2Table 2.1 clearly shows a wide range of estimates, precluding any clear trend to be distinguished in the cost develop-ment over the past 25 years.
The wide variety of cost estimates is caused by a number of factors. First of all, even within one area of application there are substantial variations in types of flue gas streams (in terms of NOx concentration, presence of other pollutants, temperature etc.). Size, scale and time of operation also play an important role. Then there are of course different types (e.g. ‘high-dust’ versus ‘low-dust’) and different suppliers of SCR systems. Con-struction costs may also vary, especially if SCR is applied to an existing plant. Further-more, (assumptions regarding) abatement efficiency, the costs of materials (catalyst, ammonia etc.), operation and maintenance costs, lifetime of the catalyst3, depreciation and interest rate are not uniform. Finally, the figures include both ‘ex-ante’ cost esti-mates and ‘ex-post’ data. Against this background, it is hardly surprising that the cost es-timates as presented in Table 2.1 do not reveal a clear trend in the cost of NOx reduction by SCR over time.
Even for one specific SCR investment project different cost estimates may come up with widely diverging amounts. An example is the retrofitting of SCR on a cogeneration unit at Cerestar (a food processing plant in Sas van Gent, The Netherlands). For this project, Van Esch (2001) mentions a cost of € 2,300 per tonne of NOx removed, whereas the cost of the same project is estimated at € 1,100 per tonne in Paul and Maaskant (2001), at € 1,040 per tonne in Novem (undated a) and at € 1,750 in Novem (undated b). The latter two sources show differences in project costs as well as in emission reductions achieved. Obviously, in addition to the factors mentioned above, data availability and reliability is also a cause of uncertainty and variation in cost estimates of SCR.
2 Generally, the ex ante estimates do not yet take future cost decreases due to learning curve
effects into account. 3 To complicate things further, the catalyst costs are sometimes treated as capital cost, but in
other cases as operational cost (the lifetime of the catalyst is limited to a few years).

Cost decreases in environmental technology 5
Table 2.1. Cost estimates for SCR (per tonne of NOx abated) in various applications.
Costs per tonne of NOx abated Specifics
(type, country etc.)
Year
(*) In original
currency
In euros of 2007
(**)
Source
Power plants / combustion plants
NL, coal fired 1983 NLG 1,701 1,256 VROM (1983), Table 10 NL, gas fired 1983 NLG 608 449 VROM (1983), Table 10 NL, coal fired 1984 NLG 4,779 3,457 Van Oostvoorn and Van
Arkel (1984), Table II.2 NL, coal fired 1987 NLG 4,000 2,723 Bruggink et al. (1987), p.
69 NL, coal fired 1988 NLG 3,770 – 6,230 2,515 – 4,157 Bakema and Kroon (1988),
p. 40 Pulverized-coal boil-ers
1989 USD 4,000 – 6,000 (***)
5,754 – 8,631 Eskinazi et al. (1989)
Cyclone equipped boilers
1989 USD 600 – 700 (***)
863 – 1,007 Eskinazi et al. (1989)
Japan 1989 USD 1,000 – 1,500 1,439 – 2,158 Ando (1989) 1995 USD 1,213 – 4,681 1,546 – 5,965 Takeshita (1995), Table 7 ± 2000 EUR 1,442 – 3,016 1,661 – 3,474 European Commission
(2006), Table 3.13 800 MW plant size 2001-
2006 EUR 1,500 – 2,500 1,531 – 2,822 Rigby et al. (2001); Euro-
pean Commission (2006), p. 112
Refineries
Japan 1984-1986
FRF 25,000 – 37,000
5,790 – 8,922 Raymond (2001)
NL (gas turbines) 1987 NLG 1,957 1,332 VROM (1987), p. 57 NL 1994 NLG 6,300 (****) 3,724 RIVM (1994), p. 50 NL (furnaces) 1997-
2000 EUR 1,193 – 3,290 1,374 – 4,027 Novem (undated a and b)
Austria 2000 EUR 467 – 1,309 538 – 1,508 UBA (2000), quoted in Schindler (2001), Table 7
Waste incineration plants
NL 1988 NLG 7,800 5,204 Bakema and Kroon (1988), p. 40
NL (based on offers from suppliers)
1992 NLG 8,000 – 13,000
5,024 – 8,164 Schipper-Zablotskaja (1992)
NL, 8 plants 1992 - 1997
NLG 8,800 – 8,900 5,416 – 5,477 Timmer (2001)
NL, 4 plants 1996 NLG 7,500 – 10,000
4,257 – 5,677 Wetzels (1996)
NL, 1 plant 1996 NLG 3,850 2,186 Crocker et al. (1996) France 1999 FRF 59,000 10,508 Rossati (2001) Belgium
2000 EUR 1,800 – 2,200 2,073 – 2,534 Matthys et al. (2001)

Institute for Environmental Studies 6
General / other applications
General 1986 NLG 3,000 – 5,000 2,084 – 3,474 Olsthoorn and Thomas (1986), Tables 4.1 and 4.3
Industrial installations 1987 NLG 5,000 – 15,000
3,404 – 10,213 Bruggink et al. (1987), p. 69
Industrial boilers 1987 NLG 4,100 – 6,000 2,792 – 4,085 VROM (1987), p. 57 Cement 1996 ECU 1,200 – 2,300
(****) 1,499 – 2,872 Kossina (2001)
Gas turbine 1997 < NLG 2,750 < 1,530 Crocker et al. (1996) Gas turbines (cogene-ration) in paper indus-try
1996-1997
NLG 1,900 – 2,200 1,057 – 1,249 Van Kessel and Roukens (2001), Table 5
Gas turbine in chemi-cal industry
1997-2000
EUR 1,870 - 1,930 2,154 – 2,362 Novem (undated a and b)
Ovens in metal indu-stry
1997-2000
EUR 1,561 - 1,930 1,798 – 2,362 Novem (undated a and b)
Nitric acid plants 1997-2000
EUR 110 – 1,280 127 – 1,567 Novem (undated a and b)
Gas turbines (cogene-ration) in food indus-try
1997-2000
EUR 1,040 - 4,538 1,198 – 5,554 Van Esch (2001); Paul and Maaskant (2001); Novem (undated)
Abrasive grit produc-tion
1999 FRF 5,182 923 Wagner et al. (2001)
Various 2000 NLG 2,600 – 14,000 (****)
1,361 – 7,330 Vringer and Hanemaaijer (2000)
Glass industry 2001 EUR 588 - 904 664 – 1,020 Schindler (2001), Table 2 Gas turbines 2001 NLG 1,100; USD
1,800; USD 2,480 564 – 2,800 Maaskant and Miggelbrink
(2001), p. 17-18 Nitric acid plants 2001 USD 400 452 Maaskant and Miggelbrink
(2001), p. 17 General 2003 EUR 500 – 5,000
(*****) 542 – 5,420 European Commission
(2003a), p. 270
(*) Year of SCR installation. If this is unknown, year of publication has been used. (**) The following simplified calculation rules were used: a constant inflation rate of 2% per year, and a fixed exchange rate of EUR 1 = ECU 1 = USD 1 = DEM 2 = NLG 2.2 = FRF 6.6. (***) Costs per tonne of NO2. (****) Calculated by the present authors on the basis of the mentioned source. Actually, there is even a single SCR application (on a caprolactam plant) costing over NLG 66,000 per tonne NOx, but this is a small scale measure that is clearly not cost-effective. (*****) Unclear whether this includes annualized capital costs.
2.3 Investment costs for coal fired power plants
Identifying a trend in the development of SCR costs might be facilitated by narrowing down the application area. In this regard, we have focused on the investment cost of SCR in a coal fired power plant. In cases where estimates were available for different plant capacities, the figures in the 500-600 MWe range have been selected.
Cost decreases in environmental technology 7
In METRA (1979, p. 46.4) the capital cost of a Hitachi Zosen SCR unit on a 500 MW coal fired power plant was specified as NLG 11 million. Given the calculation rules used in the METRA report (10% annuity over 10 years), this implies an investment of NLG 135 per kW. This type of SCR units had been commissioned in 6 plants in the years 1975-1977.
Van der Brugghen et al. (1983), reporting on experiences in Japan, found a wide range of investment costs for SCR in coal power plants: between NLG 43 and NLG 100 per kW. They stated that the NLG 43 value was probably too low, as the costs of the catalyst itself was already between NLG 41 and NLG 53 per kW. According to the authors, a ‘reasonable’ estimate for the total investment was NLG 80 per kW.
Graas and Wijdeveld (1984) stated that the investment costs of SCR are strongly influ-enced by local conditions. As an indication they mentioned an amount of about NLG 100 per kW (of which 60 to 70% costs of the catalyst) for a 600 MW coal fired power plant.
In Tangena (1985, Table 5.6) the additional investment costs of SCR in a 600 MWe coal power plant were estimated at NLG 33 per kWe for a new plant, and NLG 37 per kWe for an existing plant. From VROM (1983, Table 10), Thomas et al. (1983, Table 3.3) and Olsthoorn and Thomas (1983, Table 2.2) an investment estimate of NLG 33 per kWe can be calculated as well (for a similar coal power plant). These unusual low values can only be explained by assuming that the authors did not include the cost of the catalyst in the investment cost (but in the operational cost instead).
In 1986, Schaerer and Haug (cited in SEI, 1999) made an estimation for the costs of SCR in German power plants. For a 1500 MWth power plant (which is equivalent to a 600 MWe plant, assuming an efficiency of 40%) they presented a figure of DEM 24 per kW. However, given that they express the capacity of the plant in MWth, this amount pre-sumably also relates to the costs per kWth, and it would therefore be DEM 60 per kWe.
Offen et al. (1987, p. 868) mentioned capital costs reported by European utilities ranging between USD 65 and USD 125 per kW. Competition had reportedly driven the costs of the catalyst down significantly since the first units were ordered in Germany. In the same article, a Japanese utility (EPDC) is quoted, reporting that new catalyst formulations and a halving of the catalyst pitch had reduced the capital cost of SCR systems to USD 30 per kW. On the other hand, an EPRI4-commissioned study arrived at an estimate of USD 175 per kW.
From Bakema and Kroon (1988, Table D6, p. 149) an investment cost for SCR in exist-ing coal power plants of NLG 143 to 151 per kWe can be calculated, and of NLG 94 to 102 for new plants. The capacity of the plant was not specified.
Ando (1989) stated that an SCR plant for 80% removal costs USD 50 to 70 for coal fired boilers, including the initial charge of the catalyst (which would account for about half of the cost).
In Eskinazi et al. (1989, p. 1135) the capital costs for retrofit hot-side (i.e. high-dust) SCR installations operating in Europe were reported between USD 60 and USD 180 per kW, averaging approximately USD 125 per kW. In the same article, an EPRI-sponsored
4 EPRI = Electric Power Research Institute (United States).
Institute for Environmental Studies 8
study is quoted which estimated the costs for SCR retrofits to a 500 MW boiler at USD 100 per kW (of which USD 42 for the catalyst and reactor). Another source that Eskinazi et al. refer to is the Japanese power company EPDC, which reported investment costs for SCR on a new 400 MW boiler at USD 71 per kW. The authors also stated that because of competition in Europe, catalyst costs had recently come down by a factor 3.
Schipper-Zablotskaja (1991) mentions an investment cost of DEM 66.30 for SCR retro-fitting on German power plants. This amount probably did not include the cost of the catalyst, as the catalyst depreciation costs were specified separately as DEM 14 per kW (without specifying the depreciation period, however). Assuming an economic lifetime of 3 years for the catalyst, this would imply investment costs of about DEM 100 per kW. For a Dutch demonstration plant (EPON power plant, Nijmegen), Schipper-Zablotskaja (1991) gives an investment cost figure of NLG 300 per kW. This relatively high amount can be explained by the small size of the plant involved (65 MW).
Takeshita (1995, based on different other studies) ) makes a distinction between SCR in-vestement costs for new plants (ranging from USD 70 to 90 per kWe) and existing plants (retrofit, ranging from USD 80 to 150 per kWe).
In the NEA/IEA/OECD (1998, p. 141) calculations on the cost of electricity production, an investment for SCR of USD 50 to 90 per kWe was used for (new) coal fired power plants.
From UNECE (1999, p. 18, Table 2) an investment cost for SCR of EUR 48 million can be calculated for a coal fired power plant of 1,500 MWth. Assuming an electric effi-ciency of 40%, this would be equivalent to EUR 80 per kWe.
Rigby et al. (2001), quoting a 1999 study by Staudt, mention a range of € 50 to € 100 per kW (depending on plant size) for retrofit applications removing between 60 and 90% NOx (presumably for a coal plant, though this is not mentioned explicitly). These figures are quoted again in the BREF on Large Combustion Plants (European Commission, 2006). That same BREF shows a range of SCR investment costs for a 500 MWe power plant between € 25 and € 75 million, or € 50 to € 150 per kWe. The source of this latter estimate is Eurelectric.
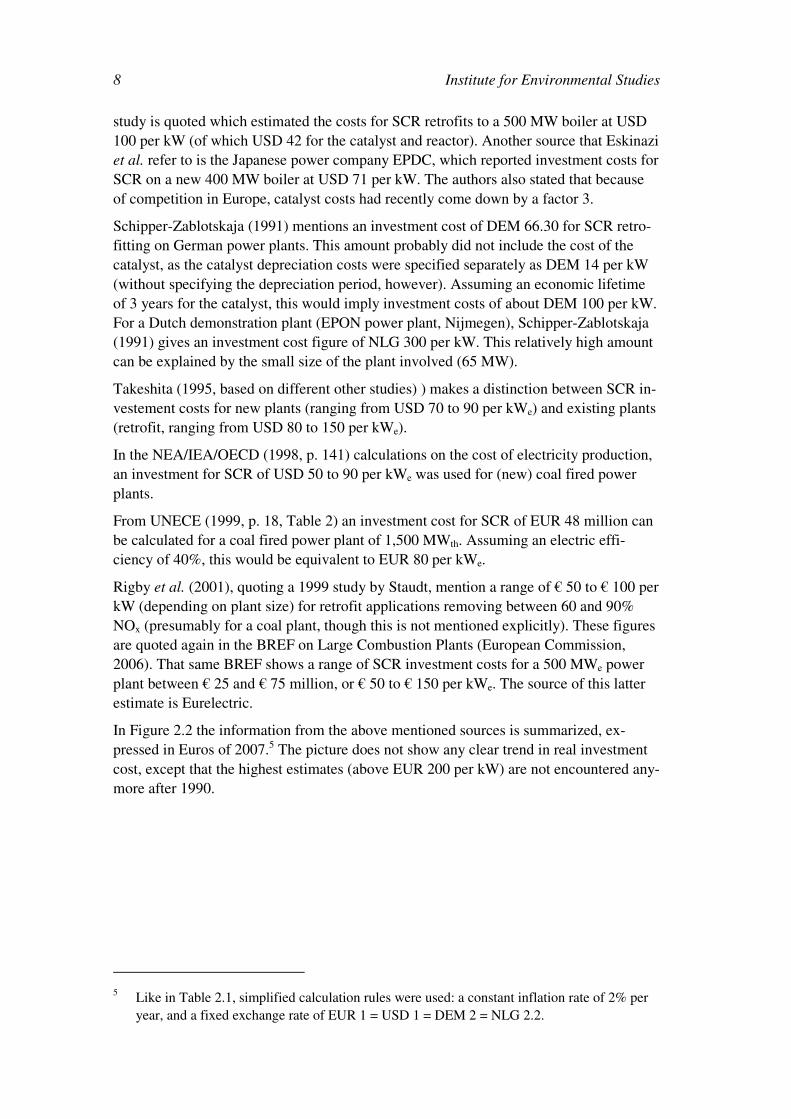
In Figure 2.2 the information from the above mentioned sources is summarized, ex-pressed in Euros of 2007.5 The picture does not show any clear trend in real investment cost, except that the highest estimates (above EUR 200 per kW) are not encountered any-more after 1990.
5 Like in Table 2.1, simplified calculation rules were used: a constant inflation rate of 2% per
year, and a fixed exchange rate of EUR 1 = USD 1 = DEM 2 = NLG 2.2.

Cost decreases in environmental technology 9
0
50
100
150
200
250
300
1975 1980 1985 1990 1995 2000 2005 2010
year
Inv
es
tme
nt
co
sts
EU
R (
20
07
) p
er
kW
Figure 2.2. SCR investment costs for coal power plants, according to various sources, expressed in Euros of 2007 per kW(e).
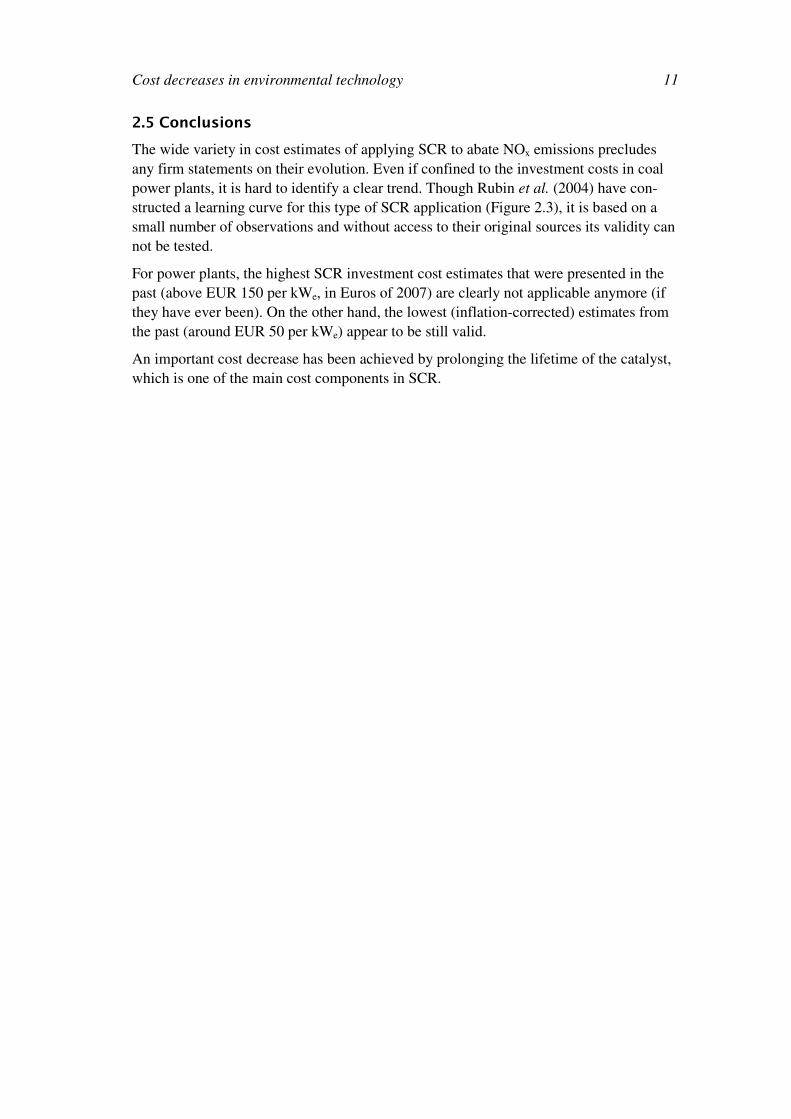
Rubin et al. (2004), however, managed to construct a learning curve for SCR (see Figure 2.3), arriving at a learning rate of 0.12 (i.e., the capital cost of SCR decreases by 12% for each doubling of cumulative installed capacity).6 According to the authors, the observed cost decreases reflect the effects of investments in R&D as well as learning by doing and other factors. SCR process improvements have substantially lengthened the average cata-lyst lifetime, while improvements in catalyst manufacturing methods, as well as competi-tion among catalyst manufacturers, simultaneously lowered catalyst prices by 50% over a 10-year period. During this time there was no systematic change in the real price of the principal metals, mainly vanadium and titanium, used for SCR catalysts. Unfortunately, Rubin et al. do not specify the sources of their cost data.
6 The learning rate follows from the learning curve’s exponent by the relationship: 1 – 2-0.18 =
0.12

Institute for Environmental Studies 10
Figure 2.3. SCR capital costs for a standardized coal-fired power plant (500 MW, 80% NOx removal) vs. cumulative installed capacity worldwide. All data points normalized on an initial (1983) value of US$ 105/kW in constant 1997$. (Source: Rubin et al., 2004).
2.4 Other aspects
The costs of SCR are to a large extent determined by the costs of the catalyst. The fre-quency of catalyst replacement is therefore an important factor. In the early sources (e.g. Van der Brugghen et al., 1983) the life of the catalyst was estimated at about 2 years. In CONCAWE (1984, p.23) it is stated that a catalyst life of more than four years had been proven in several commercial units. According to Ando (1989) the average catalyst life was 4 to 5 years. Schipper-Zablotskaja (1991) mentions a lifetime of 5 to 8 years for modern catalysts. UNECE (1999, p. 17) remarks that catalyst lifetimes are much longer than initially projected and have reached as much as 6 – 10 years for coal-fired units and 8 to 12 years for gas and oil fired units. The same figures are mentioned in the BREF on Large Combustion Plants (European Commission, 2006). In some cases catalyst lifetime can be extended by means of regeneration (see e.g. Budin et al., 2001).
For the cost-effectiveness of SCR the efficiency of NOx removal is relevant as well. Ini-tially, this was estimated at 80 to 90% (e.g. METRA, 1979; Olsthoorn et al., 1982; Van der Brugghen et al., 1983). Actual reduction percentages achieved in the Dutch Indus-trial Emissions Reduction Programme between 1997 and 2000 (Novem, undated a and b) range from 81 to 97%.7 The BREF on Common Waste Water and Waste Gas Treatment / Management Systems in the Chemical Sector (European Commission, 2003a) mentions a 90 to 94% performance rate for NOx from gas and liquid fuel boilers/heaters, and 80 to 97% for NOx from nitric acid production.
7 With the exception of an application in the steel industry, where an average efficiency of
only 60% could be achieved. See Novem (undated b), p. 19.
Cost decreases in environmental technology 11
2.5 Conclusions
The wide variety in cost estimates of applying SCR to abate NOx emissions precludes any firm statements on their evolution. Even if confined to the investment costs in coal power plants, it is hard to identify a clear trend. Though Rubin et al. (2004) have con-structed a learning curve for this type of SCR application (Figure 2.3), it is based on a small number of observations and without access to their original sources its validity can not be tested.
For power plants, the highest SCR investment cost estimates that were presented in the past (above EUR 150 per kWe, in Euros of 2007) are clearly not applicable anymore (if they have ever been). On the other hand, the lowest (inflation-corrected) estimates from the past (around EUR 50 per kWe) appear to be still valid.
An important cost decrease has been achieved by prolonging the lifetime of the catalyst, which is one of the main cost components in SCR.


Cost decreases in environmental technology 13
3. NH3 emission abatement by air scrubbers in pig
farming
3.1 Introduction
Chemical air scrubbers8 are an effective means of reducing ammonia (NH3) emissions: a reduction of 95% can be achieved. In addition, they reduce dust and odour emissions (al-though to a much more limited extent). Generally, air scrubbers are more effective in re-ducing emissions than measures in the area of sty design. Chemical scrubbers are also more effective than biological scrubbers in terms of NH3 reduction. Recently, combined chemical and biological air scrubbers have been introduced which should reduce NH3 as well as odour and dust effectively.
By 2004, about 160 chemical air scrubber systems had been installed in Dutch intenisve livestock farming (Melse and Ogink, 2004). The high investment and operational costs are still impeding a more widespread application.
The costs of air scrubbers are dependent on many factors, including the size of the farm (number of animals), and the question whether it concerns an existing situation (retrofit-ting) or a new situation (in practice mostly extension of an existing farm).
In this case study, we focus on air scrubbers in pig farming, in particular production pigs. Furthermore, the figures presented relate to application in newly built sties. It is impossi-ble to make a generally valid investment cost estimate for application in existing situa-tions, because this would depend largely on the specific design of the sty, especially the air ventilation system and the spatial lay-out of the building. If air scrubbing would re-quire a completely new ventilation system, the investment costs could be several times higher than if an existing central exhaust system could be used (Melse and Willers, 2004).
3.2 Abatement costs
3.2.1 Investment costs
Estimates of investment costs in chemical air scrubbers for new production pig housing vary. In Melse and Willers (2004, Table 4) an amount of EUR 42 per animal place is mentioned, whereas agricultural real estate organisation LTO Vastgoed mentions an amount of EUR 58 per animal place (Agrarisch Dagblad, 25 March 2006). In the trade journal ‘Boerderij’ (21 November 2006) a case is described where a pig farmer invested in a new sty for more than 2,000 production pigs. The additional construction costs for the chemical air scrubber were EUR 50,000, implying an investment of less than EUR 25 per animal place.
8 Also called ‘acid’ scrubbers, as their operation is based on the use of an acid (usually sul-
phuric acid).

Institute for Environmental Studies 14
3.2.2 Costs per unit of emission reduction
In the BREF on the intensive rearing of poultry and pigs (European Commission, 2003b, Table 4.26) the additional annual emission abatement costs of chemical wet scrubbers for production pigs (‘finishers’) are estimated at EUR 5.19 per kg NH3.
9 This estimate was based on the ‘Dutch notes on BAT for pig- and poultry intensive livestock farms’, which were made in 1999. It is unclear to what sty size this estimate relates.
Melse and Willers (2004, Table 3) estimated the cost of emission reduction by means of chemical air scrubbers at EUR 6.62 per kg NH3 removed. This estimate relates to a ‘standard’ sty for 2,160 production pigs. The main cost components are fixed costs (de-preciation, interest and maintenance; together 42%) and electricity (35%). The authors argue that the investment costs will probably decrease when the air scrubbers will be produced at a large scale. Assuming a potential halving of investment costs, they arrive at a possible decrease in overall costs by 21%, to EUR 5.21 per kg NH3 abated.
Van Horne et al. (2006) estimate the costs of chemical air scrubbers in production pig farming for new situations at EUR 4.90 per kg NH3 reduction. This estimate relates to a farm size of 1,920 production pigs.
3.2.3 Perspectives for cost decreases
Melse and Ogink (2004) have addressed the opportunities to lower the costs of air scrub-bers. Their calculations showed that a bypass system, in which the air treatment capacity is reduced by 70-80%, could lead to a cost decrease of 40-70% while still meeting Dutch emission standards.
Other attempts at reducing the costs of air scrubbers are going on as well. Many of these are directed towards a reduction of the necessary capacity of the system. For example, by combining air scrubbers with a cooling system for the ventilation air, less ventilation is needed on hot days and therefore the capacity of the air scrubber can be reduced (Agrarisch Dagblad, 5 July 2005).
3.2.4 Comparison with earlier estimates
The application of chemical air scrubbers in intensive livestock farming is a relatively recent phenomenon, and experience with this system is largely confined to the Nether-lands. In the late 1990s the technology was still in an experimental stage (see e.g. Ver-does and Zonderland, 1999), even though awareness of its applicability existed much earlier (see e.g. Baltussen et al., 1990, p. 25). Empirical time series data on its cost de-velopment are therefore not yet available over a sufficiently long period.
In a wider technology perspective, however, air scrubbers show a clear cost reduction. For example, in Tangena (1985, Table 5.14) the costs of reducing NH3 emissions from production pig sties by means of (presumably biological) air scrubbers were estimated at NLG 15.50 per kg NH3 for 1990, and at NLG 8.90 for the year 2000. In euros of 2007
9 Pellini and Morris (2002, Appendix), who also used the BREF drafts as their source of in-
formation, refer to the same costs as amounting to GBP 5.19 per kg NH3 abated, which would equal EUR 7.65 at current exchange rates.

Cost decreases in environmental technology 15
this equals EUR 11.00 and EUR 6.30, respectively. In Baltussen et al. (1990, Bijlage 2) the investment cost of a biological scrubber was estimated at NLG 163 per animal place (EUR 104 in euros of 2007).
3.3 Conclusions
Chemical air scrubbers provide an opportunity to achieve substantial ammonia emission reductions from livestock farming, at lower costs than were anticipated in the past for their main alternatives (biological scrubbers).
The main cost components of chemical air scrubbers are investment costs and electricity. To what extent the investment costs can be reduced (through economies of scale and learning by doing in production) is as yet unknown. However, it has already become clear that economizing on the capacity of the system can contribute to important cost savings (including on electricity).
Presently, air scrubbers are not yet considered as ‘Best Available Technique’ (BAT) un-der the Integrated Pollution Prevention and Control (IPPC) Directive. However, they may already be necessary at present in order to meet emission limits in areas that are par-ticularly sensitive to ammonia. Moreover, if the Netherlands will have to reduce its NH3 emissions further under the new National Emission Ceilings (NEC) Directive, chemical air scrubbers may become a necessity for a large part of intensive livestock farming. This diffusion of the technology may in turn lead to further cost reductions, which could eventually result in its ‘BAT’ status at a European level.


Cost decreases in environmental technology 17
4. Catalytic converters in cars
4.1 Introduction
The development of the catalytic converter for cars was triggered by emissions legisla-tion in the United States in the early 1980s. European car manufacturers such as Volvo, however, were the first ones to introduce cars equipped with this device on the American market. In Europe, the catalytic converter was introduced at the end of the 1980s, follow-ing EU Directives that required significant emission reductions from passenger cars.
The cost estimates in this chapter relate to the additional cost of a standard regulated three way catalytic converter (3WCC) on a standard (petrol) passenger car. In the com-parison, taxes and the costs of additional fuel consumption due to the 3WCC are ex-cluded.
4.2 Chronological development of cost estimates
Rijkeboer (1983) estimated the costs of 3WCC’s at NLG 1,000 to 1,500. This estimate was based on a study for the German Environmental Protection Agency (UBA Bericht 2/80). In the same year, the Dutch Ministry of Environment (Ministerie van VROM, 1983, Bijlage 2) arrived at a higher estimate: NLG 2,100. The latter figure is also used in Olsthoorn and Thomas (1983) and Thomas et al. (1983). This substantial difference can be explained by the fact that the latter sources relate to the price for the consumer, which includes a tax on the purchase of passenger cars (BVB; now BPM) as well as VAT. In 1983, the BVB rate was 16% on the first NLG 10,000, and 24% on the part of the price exceeding NLG 10,000. VAT at the time was 18%. Roughly estimating, the 3WCC price for the consumer would therefore be some 40% higher than the price net of tax, which means that the latter would have been about NLG 1,300.
Van Beckhoven (1984) stated that according to the German car industry the additional cost of a 3WCC would be on average DEM 1,250. In Tangena (1985, Table 5.7) the ad-ditional cost of a 3WCC was estimated at NLG 740 per vehicle, but this estimate proba-bly related to a non-regulated 3WCC. Zwalve (1985) mentioned an amount of around NLG 1,700, based on prices observed on the German market.
In March 1985, during the negotiations on the EU proposals for the introduction of (de
facto) mandatory catalytic converters, costs were an important argument, and a wide range of amounts were presented. The Economist (2 March 1985) stated that a 3WCC would add about USD 500 to the cost of a car. In two articles in that same month, the Fi-
nancial Times (7 and 8 March 1985) came up with estimates of GBP 500 and DEM 2,300 respectively. An arcticle by the Associated Press (4 April 1985) mentioned USD 470 to 900 per car.
Jantzen and Van der Woerd (2006) refer to an OECD symposium held in 1986, at which a Japanese cost estimate for a regulated 3WCC was presented of about NLG 3,000 (price level 1994).

Institute for Environmental Studies 18
In VROM (1987, Bijlage 8, p. 10) the (gross) additional cost of a regulated 3WCC was estimated at around NLG 1,500. Jantzen (1989, Bijlage 1, page B1.66) mentioned an es-timate of NLG 1,700.
The latter figure may have been an overestimation. In 1989, the Dutch government in-troduced a subsidy of NLG 1,700 on cars fitted with a regulated 3WCC, and this report-edly more than compensated for the additional cost. In any case, the sales of 3WCC cars in the Netherlands increased dramatically in response to this fiscal incentive (see Van den Bergh et al., 2004).
Also in 1989, Vauxhall became the first UK car maker to announce that catalytic con-verters would be fitted as standard to all its models. According to the car manufacturer, the modification would add between GBP 300 and GBP 400 to the cost of a car. Other UK manufacturers at the time still came up with estimates of up to GBP 1,000 (The In-
dependent, 20 April 1989). In the same year, the UK gave up its opposition against EU proposals for emission limits requiring 3WCCs to be fitted on all cars (including small ones) as from 1993.
SEI (1999) states that the motor industry, in its response to the new EU emission limits (‘Euro I’, introduced in 1991 by Directive 91/441), claimed that catalytic converter tech-nology would cost between GBP 400 and GBP 600 per vehicle. The authors added that the effect of the stricter standards on costs had not actually been studied, and few refer-ences were available on this point. Some manufacturers were reported to have added GBP 200 to 400 to the price of a car, and others more than this. Overall, however, prices did not change suddenly or markedly, according to SEI (1999).
Honig et al. (2000) refer to a study by Dings (1996), in which the development of 3WCC costs was illustrated by a decrease from NLG 1,350 in 1986 to NLG 700 in 1992. They also refer to a study by TME (Jantzen et al., 1995), in which a time series of cost data for 3WCCs was presented: NLG 3043 (1985, Japan); NLG 1764 (1986, Europe); NLG 1843 (1987, Europe); NLG 1092 (1992, The Netherlands); and NLG 1300 (1994, The Nether-lands).10
In CPB (2000, p. 129) it is estimated (based on data from Statistics Netherlands (CBS)) that the investment costs for a regulated 3WCC gradually decreased from NLG 1,700 in 1990 to NLG 750 in 1997.
Jantzen and Van der Woerd (2006) have calculated the development of the costs of a 3WCC in the Netherlands over a period of 15 years, also based upon CBS data (see Ta-ble 4.1).
10 These figures were also used in Jantzen and Van der Woerd (2006, Figure 4.1). The original
sources of these data is Jantzen et al. (1995), based on OECD (1986), CBS (1991), and Tour-ing Club der Schweiz (1994) Jantzen and Van der Woerd (2006) conclude that their findings confirm that the rate of cost decrease of environmental technologies tends to be well above the average ‘technological progress factor’ (of 2%) which is used in macro-economic models (as reported in Honig et al., 2000).

Cost decreases in environmental technology 19
Table 4.1. Development of the (investment) costs of catalysts (average for the Nether-lands).
Year Cost of catalyst per vehicle (current prices)
1985 € 771 1990 € 771 1995 € 340 2000 € 227
Source: Jantzen and Van der Woerd (2006), based on CBS data.
Figure 4.1 presents the various cost data as mentioned above graphically, using the same exchange rates and price indices as in chapter 2. Although the range of cost estimates is quite broad, the decreasing trend is obvious.
0
500
1000
1500
2000
2500
1980 1985 1990 1995 2000 2005
year
Co
sts
in
EU
R o
f 2
00
7
Figure 4.1. Cost development of a regulated 3-way catalytic converter (in euros
of 2007).
4.3 Conclusions
The available evidence suggests that significant price decreases have occurred following the large scale introduction of 3WCCs on the European market in the early 1990s. It seems reasonable to assume that economies of scale have played an important role in this case, as the size of the market (millions per year) made mass production possible. To

Institute for Environmental Studies 20
some extent, cost reductions may also be attributed to improvements such as the need for less materials (e.g. platinum).11
Some caution, however, is justified in drawing conclusions on the basis of the data pre-sented above. First of all, the validity of the cost data is unknown. Neither statements by car manufacturers nor observed market prices are necessarily reliable indicators for ac-tual production costs.
Furthermore, the 3WCC cannot be considered as a homogenous product over the whole period of observation. Car emission standards have been tightened several times, and even though the basic technology remained the same, the catalysts were adapted in order to be able to meet the stricter standards. However, this only implies that the cost effec-
tiveness of the catalysts have improved even faster than their cost level.
11 On the other hand, the price of platinum may have increased as a result of the growing de-
mand for 3WCCs. As 40% of the world platinum production is used for 3WCCs (Buijsman, 2006), this demand is likely to have a significant impact on the platinum market. Given cur-rent platinum prices of around EUR 30 per gramme (Financial Times, 15 May 2007) and a platinum content of 1 to 3 grammes per catalytic converter (Buijsman, 2006), the share of platinum costs in total production costs of a 3WCC is considerable. However, instead of platinum the less expensive palladium is increasingly being used nowadays.

Cost decreases in environmental technology 21
5. Compact fluorescent lamps
5.1 Market development
The compact fluorescent lamp (CFL) was patented in 1972 and first commercialized (by Philips) in 1980. Ten years later, CFLs began to find their way to the consumer market.
In 1989 and the early 1990s , the global CFL market increased by more than 30% annu-ally. Afterwards, growth of the global CFL market slowed down (IAEEL Newsletter 4/94) .
In a number of individual countries, dedicated market transformation programs during the 1990s led to an increased uptake of CFLs by households (see e.g. IEA, 2006; Ürge-Vorsatz and Hauff, 2001; Sathaye et al., 1994). In the Netherlands, energy distribution companies have run several promotional campaigns during the 1990s to stimulate the use of CFLs by households. In the first ‘Environmental Action Plan’ (MAP) of utilities’ as-sociation EnergieNed, a target of 3.5 CFLs per household was specified for 1995. This target was not achieved (Jeeninga, 1997).
By the mid-1990s there was some slowdown in CFL market growth in OECD countries. This coincided with cuts in DSM (Demand Side Management) programs spending, fol-lowing the uitility deregulation trend (Iwafune, 2000).
A review of CFL ownership across the OECD in 1999 estimated that there was an aver-age of 0.8 CFLs per household, with ownership levels ranging from just 0.1 CFL in Aus-tralia/New Zealand and North America to 3.2 CFLs in OECD Europe (IEA, 2006).
Since the end of the 1990s, worldwide CFL sales growth has accelerated, especially due to the spectacular growth in China and other Asian countries (see Figure 5.1). By 2003, global sales of CFLs had attained an estimated 1.1 billion units (IEA, 2006).
Traditionally, the world market for light bulbs was dominated by the ‘big three’ (Philips, Osram end GE), but recently competition from Chinese manufacturers has grown dra-matically. Nowadays there are estimated to be more than 1,000 CFL manufacturers in China and they are thought to account for about 70% of the global CFL market in vol-ume terms (IEA, 2006).

Institute for Environmental Studies 22
Source: IEA (2006)
Figure 5.1 Estimated global CFL sales by region, 1990-2004.
5.2 Development of prices and production costs
Table 5.1 presents a time series of observed and reported prices for CFLs, both in The Netherlands and abroad. Prices usually refer to CFLs with integrated ballasts12, although this is not always specified in the sources that were used. The wattage of the CFLs is not specified, as prices among different wattages tend to be rather similar. ‘Artifically’ re-duced prices (e.g. through utilities’ subsidies) are not included.
12 In the early stages, ‘modular’ CFLs (with separate ballasts and tubes) were more common.

Cost decreases in environmental technology 23
Table 5.1. Observed and reported market prices of CFLs.
Year Country Price (range) Source Notes
mid-1980s
USA USD 25 - 35 Sandahl et al. (2006), referring to Calwell et al. (1999)
1987 DK USD 50 Menanteau and Lefebvre (2000) (1) 1990 France FRF 150 Menanteau and Lefebvre (2000) (2) 1991 DK USD 20 Menanteau and Lefebvre (2000) 1991 UK GBP 10 - 17 The Guardian, 8.11.1991 1992 NL NLG 50 Algemeen Dagblad, 14.5.1992 (3) 1992 USA USD 15 - 20 Public Utilities Fortnightly, 15.7.1992 1992 UK GBP 8 - 15 The Guardian, 6.6.1992 1993 NL NLG 35 - 37 De Dordtenaar, 29.5.1993 1993 NL NLG 34-35 Algemeen Dagblad, 25.8.1993 (4) 1994 USA USD 15 Scientific American, October 1994, p. 109 1994 USA USD 13 Salt Lake Tribune (Utah), 11.7.1994 1995 USA USD 15 - 18 Energy Conservation News, February 1995 1995 NL NLG 15 De Volkskrant, 6.10.1999 1997 Hungary HUF 1350 Ürge-Vorsatz and Hauff (2001) 1997 Sweden SEK 39 IAEEL Newsletter 3-4/97 (5) 1997 UK GBP 6 - 12 The Guardian, 18.10.1997 1997 USA USD 7 - 20 Sandahl et al. (2006), referring to Decision Sci-
ences Research Associates, Inc. (1998)
1998 USA USD 10 Energy Conservation News, April 1998 1999 Hungary HUF 1125 Ürge-Vorsatz and Hauff (2001) 1999 NL NLG 6 - 7 De Volkskrant, 6.10.1999 1999 UK GBP 6 The Guardian, 25.3.1999 2000 France FRF 50 - 100 Menanteau and Lefebvre (2000) 2001 NL NLG 13 De Volkskrant, 21.8.2001 2001 USA USD 10 PR Newswire, 20.3.2001 2001 USA Up to USD
20 Newsweek, 13.8.2001 (6)
2004 USA ± USD 10 The Augusta Chronicle (Georgia), 27.6.2004 2006 USA ± USD 5 The Associated Press State & Local Wire,
21.2.2006
2006 UK GBP 3 The Mirror, 13.7.2006 2007 USA USD 2 - 4 New York Times, 2.1.2007 2007 NL EUR 7 NRC Handelsblad, 15.3.2007 2007 NL EUR 5 - 12 Algemeen Dagblad, 4.5.2007
Notes to Table5.1:
(1) Price in constant USD of 1991. (2) Price refers to “the beginning of the 1990s”. (3) By 1992, the price of CFLs in the Netherlands was reported to have decreased rather quickly from NLG 100 to NLG 50, following promotional actions by Philips and Osram, together with the Dutch energy companies. At the time, supply capacity could hardly follow the increase in demand for CFLs, temporarily preventing further price reductions. Nevertheless, a further de-crease to NLG 30 was expected. (4) Prices found in a test by consumer organisation Consumentenbond (for 8 out of the 9 best performing CFLs). (5) Refers to Ikea’s own brand CFLs (manufactured in China). (6) Refers to the newest generation CFLs.

Institute for Environmental Studies 24
Figure 5.2 presents the data from Table 5.1 graphically, using the same exchange rates and price indices as in chapter 2.13 Despite the wide range in observed prices, the rapid decline is obvious, especially during the 1990s.
0
10
20
30
40
50
60
70
80
1980 1985 1990 1995 2000 2005 2010
year
Pri
ce
in
EU
R o
f 2
00
7
Figure 5.2 Observed and reported market prices of CFLs, in euros of 2007.
A main factor behind these price decreases has been the growing competition by Asian producers. In 1997, Ikea introduced a low-price CFL, produced in China, on the Euro-pean market. In addition to low labour costs and economies of scale, the low price could also be afforded because Ikea found a way to produce the lamps without using technol-ogy patented by any of the major lamp manufacturers (IAEEL Newsletter 3-4/97). In the following years, price competition from Chinese producers became so strong that the European Commission even imposed anti-dumping duties on CFL imports from China in 2001.14
Technical improvements (such as reductions in the size of the ballast) have also contrib-uted to reductions in the production cost of CFLs. Furthermore, several kinds of other technical improvements have taken place15, implying that the ‘price-quality ratio’ has shown an even faster progress rate than the mere price data would suggest. On the other hand, the fierce price competition in China has led CFL producers there to compromise on product quality to reduce production costs (Lin, 1999).
If the price of CFLs is depicted as a function of cumulative production (rather than time), learning curves can be constructed. Iwafune (2000) has attempted to do so (see Figure 5.3). For the average observed prices, he arrived at a learning rate of 21.4%, i.e. a price
13 In addition, an exchange rate of SEK 8.5 per euro was used, and of HUF 200 and 250 per
euro for 1997 and 1999, respectively. 14 Regulations 255/2001 (OJ L38, 8.2.2001) and 1470/2001 (OJ L195, 19.7.2001). 15 Including a market shift from magnetic towards electronic ballasts

Cost decreases in environmental technology 25
decrease of 21.4% for each doubling of cumulative production. Given the wide spread of price observations, he also constructed learning curves for ‘high’ and ‘low’ prices (one standard deviation above and below the average, respectively), obtaining learning rates of 17.7% and 28.7%, respectively.
Source: Iwafune (2000)
Figure 5.3 CFL learning curve.
5.3 Conclusions
CFLs have shown considerable decreases in market prices over the past 20 years. In ad-dition to economies of scale, increased competition (especially from China) seems to have played an important role in this case. Furthermore, incremental technological im-provements have contributed to a better ‘price-quality ratio’.


Cost decreases in environmental technology 27
6. Conclusions
Just like other innovations, newly developed technologies for emission reduction tend to be expensive in their initial stages and to become cheaper once they are widely used. If this is not accounted for, the ex ante pollution control costs may be overestimated.
Learning curves are often used to estimate the possible future cost reductions in pollution control. Such curves assume a constant ‘learning rate’ (the percentage by which the cost or price of a technology drops for each doubling of cumulative sales or installed capac-ity). However, an uncritical use of learning rates may lead to misleading results. In a proper analysis, the specific factors that may (or may not) contribute to the cost decrease should be considered. These factors may include economies of scale, ‘learning by do-ing’, (incremental) technological improvements, and increased competition.
In the present study, four cases have been addressed, in which the roles of the various factors clearly differ. For example, in the cases of catalytic converters and CFLs it is likely that economies of scale in production have played a major role. For CFLs, in-creased competition has also been an important factor. In the SCR case, cost reductions have been achieved by prolonging the lifetime of the catalyst. The ‘chemical scrubbers’ case shows substantial cost reductions can be achieved by looking for options to reduce the necessary capacity of the system, especially when construction costs are the main component of the total costs. Tentatively, one might state that economies of scale and enhanced competition tend to be important sources of cost reduction in standard (con-sumer) products, whereas ‘learning by doing’ and incremental technological improve-ments are relatively important factors contributing to cost reductions in process-related technology.
One should also be aware of cost components that are unlikely to decrease, such as la-bour, energy or raw materials (unless the needed amount of these inputs can be reduced).
The present study furthermore illustrates clearly the complexities involved in comparing the costs of a technology over time. Time series data for market prices should be treated with caution, because market prices are not always accurate indicators of production costs. Moreover, as the technology or product usually develops over time (incremental innovation), the data do not refer to a ‘homogeneous’ technology. To the extent that these incremental innovations lead to improved quality or performance, the observed price decreases will underestimate the actual gains in ‘value for money’. On the other hand, growing price competition may sometimes lead to the appearance of lower quality products on the market (as in the case of CFLs).
Finally, cost estimates are always based on certain assumptions, not only regarding the technology itself and the context in which it is applied, but also regarding depreciation, interest rates, expected future price levels etcetera. In comparing cost data, one should always be aware of possible differences in these assumptions.


Cost decreases in environmental technology 29
References
Ando, J. (1989). Recent developments in SO2 and NOx abatement technology for stationary sources. Lucht en Omgeving, 115-120.
Bakema, G.F. & Kroon, P. (1988). Vermijden of bestrijden? Emissies en kosten van emissie-
beperking van SO2, NOx en stof tot 2010, behordend bij de Nationale Energie Verkenningen
1987. Report ESC-44, Energie Studie Centrum, Petten.
Baltussen, W.H.M., Os, J. van & Altena, H. (1990). Gevolgen van beperking van ammoniak-
emissie voor varkensbedrijven. Onderzoeksverslag 62, Landbouw-Economisch Instituut, The Hague.
Brugghen, F.W. van der, Graas, J.G.A., Pijnenburg, J.B.A.M., Tossaint, H.J. & Weier, W.L.C. (1983). Rookgas-denitrificatie in Japan. Ministerie van Volkshuisvesting, Ruimtelijke Orde-ning en Milieubeheer, Publikatiereeks Lucht 6.
Bruggink, J.J.C., Boonekamp, P.G.M., Bakema, G.F., Verhagen, L., Kroon, P. & Oostvoorn, F. van (1987). Nationale Energie Verkenningen 1987. Report ESC-42, Energie Studie Centrum, Petten.
Budin, R., Krotla, K. & Hartl, H. (2001). Latest developments and the state of the art of catalytic
DeNOx plants after 15 years of experience. Paper presented at the International conference on atmospheric pollution - NOx and N2O emission control: panel of available techniques, Paris-La Défense (France), 21st and 22nd March 2001.
Buijsman, E. (2006). Platinametalen in lucht. Een verkennend literatuuronderzoek. MNP report 500093001/2006. Milieu- en Natuurplanbureau, Bilthoven.
CBS (1991). Milieukosten van het verkeer, 1989 – 1990. Centraal Bureau voor de Statistiek, Voorburg.
CPB (2000). Naar een efficiënter milieubeleid. Een maatschappelijk-economische analyse van
vier hardnekkige milieuproblemen.Centraal Planbureau, The Hague.
Crocker, M., Ylstra, W. & Maaskant, O. (1996). Toepassing van een nieuwe generatie DeNOx systeem bij de reiniging van rookgassen. Lucht, 4, 116-118.
Dings, J.M.W. (1996). Kosten en milieueffecten van technische maatregelen in het verkeer. CE, Delft.
Eskinazi, D., Cichanowicz, J.E., Linak, W.P. & Hall, R.E. (1989). Stationary Combustion NOx Control. A Summary of the 1989 Symposium. Journal of the Air Pollution Control
Association 39(8), 1131-1139.
European Commission (1998). Economic evaluation of air quality targets for sulphur dioxide,
nitrogen dioxide, fine and suspended particulate matter and lead. Final Report. Office for Official Publications of the European Communities, Luxembourg.
European Commission (2003a). Reference Document on Best Available Techniques in Common
Waste Water and Waste Gas Treatment / Management Systems in the Chemical Sector. European IPPC Bureau, Sevilla.
European Commission (2003b). Reference Document on Best Available Techniques for Intensive
Rearing of Poultry and Pigs. European IPPC Bureau, Sevilla.
European Commission (2006). Reference Document on Best Available Techniques for Large
Combustion Plants. European IPPC Bureau, Sevilla.
Graas, A.J.G.A. & Wijdeveld, H.W.J. (1984). Verwijdering van stikstofoxyden uit (rook)gassen. Lucht en Omgeving, 28-31.

Institute for Environmental Studies 30
Honig, E., Hanemaaijer, A., Engelen, R., Dekkers, A. & Thomas, R. (2000). Techno 2000;
Modellering van de daling van eenheidskosten van technologieën in de tijd. Report number 773008003, RIVM, Bilthoven.
Horne, P.L.M. van, Hoste, R., Haan, B.J. de, Ellen, H., Hoofs, A. & Bosma, B. (2006). Gevolgen
van aanpassingen in het ammoniakbeleid voor de intensieve veehouderij. Onderzoek naar de
economische aspecten van en de gevolgen voor de ammoniakdoelstellingen bij intern
salderen van ammoniakemissie, versoepeling van de WAV en het niet emissiearm maken van
bestaande stallen. Rapport 3.06.03, juli 2006. LEI, Den Haag, i.s.m. Milieu- en Natuurplan-bureau, Bilthoven.
IEA (2006). Light’s Labour’s Lost. Policies for Energy-efficient Lighting. International Energy Agency, Paris.
Iwafune, Y. (2000), Technology Progress Dynamics of Compact Fluorescent Lamps. Interim Report IR-00-009, International Institute for Applied Systems Analysis (IIASA), Laxenburg.
Jantzen, J. (1989). Kosten van het milieubeheer, 1985-2010. Een drietal milieubeleidsvarianten
in het kader van ‘Zorgen voor morgen’ en het ‘Nationaal Milieubeleidsplan’. Publikatiereeks Milieubeheer no. 5, Ministerie van VROM, Den Haag.
Jantzen, J., Heijnes, H. & Duyse, P. van (1995). Technische vooruitgang en milieukosten, aanzet
tot methodiekontwikkeling (Technological progress and environmental costs, initiative for
methodological development). Institute for Applied Environmental Economics (TME), The Hague.
Jantzen, J. & Woerd, H. van der (2006). Ex-post estimates of costs to business of EU environ-
mental policies. Case study road transport. Institute for Applied Environmental Economics (TME), Nootdorp. http://ec.europa.eu/environment/enveco/ex_post/pdf/transport.pdf
Jeeninga, H. (1997). Analyse energieverbruik sector huishoudens 1982-1996. Achtergrond-
document bij het rapport ‘Monitoring energieverbuik en beleid Nederland’.Report no. ECN-1-97-051, Energieonderzoek Centrum Nederland, Petten.
Kessel, R. van & Roukens, J. (2001). The feasibility of retrofitting a gas turbine cogeneration
plant with (hybrid) DeNOx technology. Paper presented at the International conference on atmospheric pollution - NOx and N2O emission control: panel of available techniques, Paris-La Défense (France), 21st and 22nd March 2001.
Kossina, I. (2001). Reduction of NOx emissions from exhaust gases of cement kilns by selective
catalytic reduction. Paper presented at the International conference on atmospheric pollution - NOx and N2O emission control: panel of available techniques, Paris-La Défense (France), 21st and 22nd March 2001.
Lin, J. (1999). China Green Lights Program: A Review and Recommendations. Energy Analysis Department, Lawrence Berkeley National Laboratory.
LNV & VROM (1990). Plan van aanpak beperking ammoniak-emissie van de landbouw.
Regeringsbeslissing. Tweede Kamer, vergaderjaar 1990-1991, 18 225, nrs 42-43.
Maaskant, O.L. & Miggelbrink, M. (2001). A catalytic system for Nox and dioxins removal :
applications, performance and costs. Paper presented at the International conference on atmospheric pollution - NOx and N2O emission control: panel of available techniques, Paris-La Défense (France), 21st and 22nd March 2001.
Matthys, K., Boels, K., Goemans, M., Clarysse, P., Joannes, J. & Clercq, P. de (2001). SEGHERSdeDInOX : catalytic NOx reduction with simultaneous dioxin destruction in a
municipal waste incinerator in Belgium. Paper presented at the International conference on atmospheric pollution - NOx and N2O emission control: panel of available techniques, Paris-La Défense (France), 21st and 22nd March 2001.

Cost decreases in environmental technology 31
Melse, R.W. & Willers, H.C. (2004). Toepassing van luchtbehandelingstechnieken binnen de
intensieve veehouderij. Fase 1: Techniek en kosten. Report 029, Agrotechnology & Food In-novations BV, Wageningen.
Melse, R.W. & Ogink, N.W.M. (2004). Toepassing van luchtbehandelingstechnieken binnen de
intensieve veehouderij. Fase 2: Mogelijkheden tot kostenverlaging van wassers. Report 271, Agrotechnology & Food Innovations BV, Wageningen.
Menanteau, P. & Lefebvre, H. (2000). Competing technologies and the diffusion of innovations: the emergence of energy-efficient lamps in the residential sector. Research Policy, 29(3), 375-389.
METRA (1979). Manual of Air Pollution Control Techniques. In appointment of the Ministry of Health and Environmental Protection compiled by METRA consulting Ltd., London, February 1979. Published by the Government Publishing Office, The Hague.
Novem (undated a). NOx reduction from stationary sources using End-of-Pipe Technologies. Leaflet, Novem, Utrecht.
Novem (undated b). Nageschakelde NOx-reductie in de industrie. Resultaten van het programma
Reductie Luchtemissies Bedrijven. Publication 3RLB-02.01, Novem, Utrecht.
NEA/IEA/OECD (1998). Projected Costs of Generating Electricity. Update 1998. Nuclear Energy Agency, International Energy Agency and Organisation for Economic Co-operation and Development, Paris.
OECD (1986). Enclair ’86, Energy and cleaner air: costs of reducing emissions. Proceedings of a symposium held in October 1986, Italy.
Offen, G.R., Eskinazi, D., McElroy, M.W. & Maulbetsch, J.S. (1987). 1987 Joint EPRI/EPA Symposium on Stationary Combustion NOx Control. Journal of the Air Pollution Control
Association, 37(7), 864-871.
Olsthoorn, A.A., Thomas, R., Vos, J.B., Hettelingh, J.-P., Hordijk, L. & Jansen, H.M.A. (1982). Drie scenario’s voor de ontwikkeling van de NOx-emissies in Nederland 1978-2000. Instituut voor Milieuvraagstukken, Vrije Universiteit, Amsterdam, report no. 82/16, December 1982.
Olsthoorn, A.A. & Thomas, R. (1983). Kosten van bestrijding NOx-emissies. Instituut voor Milieuvraagstukken, Vrije Universiteit, Amsterdam.
Olsthoorn, A.A. & Thomas, R. (1986). Scenario’s voor vier milieugevaarlijke stoffen in 2000:
emissies en kosten van emissiebestrijding van SO2, NOx, lood en cadmium. Publikatiereeks Milieubeheer no. 6, Ministerie van VROM, Den Haag.
Oosterhuis, F. (ed., 2006). Ex-post estimates of costs to business of EU environmental legislation.
Final report. IVM Report E-06/08, Instituut voor Milieuvraagstukken, Vrije Universiteit, Amsterdam.
Paul, P.G. & Maaskant, O.L. (2001). Catalytic NOx emission reduction at a cogeneration plant
in the food industry. Paper presented at the International conference on atmospheric pollution - NOx and N2O emission control: panel of available techniques, Paris-La Défense (France), 21st and 22nd March 2001.
Pellini, T. & Morris, J. (2002). IPPC and Intensive Pig Production in England and Wales: Compliance Costs, Emission Abatement and Affordability. European Environment, 12, 332-347.
Raymond, B. (2001). NOx reduction measures at the Nippon Mitsubishi refinery of Negishi in
Yokohama, Japan. Paper presented at the International conference on atmospheric pollution - NOx and N2O emission control: panel of available techniques, Paris-La Défense (France), 21st and 22nd March 2001.

Institute for Environmental Studies 32
Rigby, K., Libuda, T., Klatt, A. & Zürbig, J. (2001). SCR: the most effective technology for NOx
reduction in large combustion plants. Paper presented at the International conference on at-mospheric pollution - NOx and N2O emission control: panel of available techniques, Paris-La Défense (France), 21st and 22nd March 2001.
Rijkeboer, R.C. (1983). The European policy on automotive emissions and the development of
car- and engine technology. Ministerie van Volkshuisvesting, Ruimtelijke Ordening en Milieubeheer, Publikatiereeks Lucht, 5.
RIVM (1994). Milieurendement van het NMP-2. Bijlagen E t/m H. Rijksinstituut voor Volksge-zondheid en Milieuhygiëne, Bilthoven.
Rossati, F. (2001). The catalytic NOx and dioxin removal unit of the sewage treatment plant of
Colombes, France. Paper presented at the International conference on atmospheric pollution - NOx and N2O emission control: panel of available techniques, Paris-La Défense (France), 21st and 22nd March 2001.
Rubin, E.S., Taylor, M.R., Yeh, S. & Hounshell, D.A. (2004). Learning curves for environmental technology and their importance for climate policy analysis. Energy, 29, 1551-1559.
Sandahl, L.J., Gilbride, T.L., Ledbetter, M.R., Steward, H.E. & Calwell, C. (2006). Compact
Fluorescent Lighting in America: Lessons Learned on the Way to Market. PNNL 15730, Pacific Northwest National Laboratory, Richland, Washington.
J. Sathaye, Friedmann, R., Meyers, S., Buen, O. de, Gadgil, A., Vargas, E. & Saucedo, R. (1994). Economic analysis of Ilumex. A project to promote energy-efficient residential lighting in Mexico. Energy Policy, 22(2), 163-171.
Schindler, I. (2001). SCR : state-of-the-art for NOx reduction across the sectors. Paper presented at the International conference on atmospheric pollution - NOx and N2O emission control: panel of available techniques, Paris-La Défense (France), 21st and 22nd March 2001.
Schipper-Zablotskaja, M. (1992). Selectieve katalytische reductie. In: RIVM/TNO (1992). Monografieën informatiesysteem technieken. Compartiment Lucht. RIVM/TNO, rapportnr. 736101007. Bilthoven.
SEI (1999). Costs and Strategies presented by Industry during the Negotiation of Environmental
Regulations. Stockholm Environment Institute, Stockholm.
Takeshita, M. (1995). Air pollution control costs for coal-fired power stations. Publication no. IEAPER/17, IEA Coal Research, London.
Tangena, B.H. (1985). Optimalisatie bestrijding verzurende emissies. Ministerie van Volkshuis-vesting, Ruimtelijke Ordening en Milieubeheer, Publikatiereeks Lucht, 40.
Thomas, R., Vos, J.B., Hettelingh, J.P., Hordijk, L., Jansen, H.M.A. & Olsthoorn, A.A. (1983). Uitworp van stikstofoxiden in Nederland in het jaar 2000. Ministerie van Volkshuisvesting, Ruimtelijke Ordening en Milieubeheer, Publikatiereeks Lucht, 7.
Timmer, G. (2001). NOx emission reduction over the past decade and environmental opportuni-
ties for the future for Waste to Energy plants in the Netherlands. Paper presented at the International conference on atmospheric pollution - NOx and N2O emission control: panel of available techniques, Paris-La Défense (France), 21st and 22nd March 2001.
Touring Club der Schweiz (1994). 10 Jahre Katalysatorautos. Emmen.
UNECE (1999). Draft Guidance Documents on Control Techniques and Economic Instruments
to the Protocol to Abate Acidification, Eutrophication and Ground-level Ozone. United Nations Economic Commission for Europe, Geneva, EB.AIR/1999/2.
Ürge-Vorsatz, D. & J. Hauff (2001). Drivers of market transformation: analysis of the Hungarian lighting success story. Energy Policy, 29(10), 801-810.
Van Beckhoven, L.C. (1984). Luchtverontreiniging door de auto. Lucht en omgeving. 74-78.

Cost decreases in environmental technology 33
Van den Bergh, J., Leeuwen, E. van, Oosterhuis, F., Rietveld, P.& Verhoef, E. (2004). Innovaties
voor duurzaam vervoer. Succes- en faalfactoren in acht casestudies. IVM Report R-04/06, Institute for Environmental Studies, Vrije Universiteit, Amsterdam.
Van Esch, F.A.J. (2001). Decreased NOx emissions by use of selective catalytic reduction on a
gas turbine in the food-processing sector. Paper presented at the International conference on atmospheric pollution - NOx and N2O emission control: panel of available techniques, Paris-La Défense (France), 21st and 22nd March 2001.
Van Oostvoorn, F. & Arkel, W.G. van (1984). Optimale strategieën voor de bestrijding van zure
regen veroorzakende SO2- en NOx-emissies gebaseerd op berekeningen met SELPE. Energie Studie Centrum, Petten.
Verdoes, N. & Zonderland, J.J. (1999). Het effect van een chemische luchtwasser op de
ammoniakemissie uit een vleesvarkensstal (The effect of a chemical air scrubber on ammonia
emission from a growing-finishing pig house). Proefverslag nummer P 4.39, Praktijkonder-zoek Varkenshouderij, Rosmalen.
Vringer, K. & Hanemaaijer, A.H. (2000). Kosteneffectiviteit van milieumaatregelen. RIVM-rapport 773008002, RIVM, Bilthoven.
VROM (1983). Technologische gegevens voor het NOx-beleid. Ministerie van Volkshuisvesting, Ruimtelijke Ordening en Milieubeheer, Publikatiereeeks Lucht, 8.
VROM (1987), Tussentijdse evaluatie verzuringsbeleid. Ministerie van Volkshuisvesting, Ruim-telijke Ordening en Milieubeheer, Den Haag.
Wagner, F., Depauw, J.P. & Hamon, C. (2001). Highly effective SCR to control the very high ini-
tial NOx content. Paper presented at the International conference on atmospheric pollution - NOx and N2O emission control: panel of available techniques, Paris-La Défense (France), 21st and 22nd March 2001.
Wetenschappelijke Raad voor het Regeringsbeleid (WRR) (1987). Ruimte voor groei. Kansen en
bedreigingen voor de Nederlandse economie in de komende tien jaar. Staatsuitgeverij. Den Haag.
Wetzels, F. (1996). Vermindering NOx-emisie bij afvalverbranding. Lucht, 4, 113-115.
Zwalve, W.J. (1985). Schone auto’s, waarom en wanneer? Lucht en omgeving, 156-160.