Cost Benefit Analysis of the Mining Sector in Karamoja, Uganda · PDF file ·...
96
Cost Benefit Analysis of the Mining Sector in Karamoja, Uganda Houdet J., Muloopa H., Ochieng C., Kutegeka S. and Nakangu B. IUCN Eastern and Southern Africa Programme
Transcript of Cost Benefit Analysis of the Mining Sector in Karamoja, Uganda · PDF file ·...

Cost Benefit Analysis of the Mining Sector in Karamoja, UgandaHoudet J., Muloopa H., Ochieng C., Kutegeka S. and Nakangu B.
IUCN Eastern and Southern Africa Programme


Cost Benefit Analysis of the Mining Sector in Karamoja, UgandaHoudet J., Muloopa H., Ochieng C., Kutegeka S. and Nakangu B.

Copyright: © 2014 International Union for Conservation of Nature and Natural Resources
The designation of geographical entities in this book, and the presentation of the material, do not imply the expression of any opinion whatsoever on the part of IUCN, Irish Aid, ISS or SYNERGIZ concerning the legal status of any country, territory, or area, or of its authorities, or concerning the delimitation of its frontiers or boundaries.
The views expressed in this publication do not necessarily reflect those of IUCN, Irish Aid, ISS or SYNERGIZ.
All rights reserved. No part of this book may be reprinted or reproduced or utilised in any form or by any electronic, mechanical, or other means, now known or hereafter invented, including photocopying and recording, or in any information storage retrieval system without permission in writing from the publishers.
Product or corporate names may be the trademarks or registered trademarks, and are used only for identification and explanation without intent to infringe.
Citation: Houdet J., Muloopa H., Ochieng C., Kutegeka S. and Nakangu B. (2014). Cost Benefit Analysis of the Mining Sector in Karamoja, Uganda. Kampala, Uganda: IUCN Uganda Country Office. ix +82p
ISBN: 978-2-8317-1657-2
Cover Photo: Gold artisanal and small scale miner along a river bed. Plastic basins are commonly used for gold separation. (Photo credit: Sophie Kutegeka)
Design & layout: Gordon Arara (IUCN Publications Unit, Nairobi)
Available From: IUCN (International Union for Conservation of Nature) Uganda Country Office Plot 39 Babiiha Avenue, P. O. Box 10950, KAMPALA, Uganda Tel +256 41 344508/233738 Fax +256 41 342298 www.iucn.org/esaro

Table of ContentsList of tables ................................................................................................................................................... v
List of figures ................................................................................................................................................. vi
List of boxes .................................................................................................................................................. vi
Acronyms ..................................................................................................................................................... vii
Acknowledgements ......................................................................................................................................viii
Executive Summary ....................................................................................................................................... ix
1.INTRODUCTION.........................................................................................................................................1
1.1 Rationale and background to the project .................................................................................................1
1.2 Project objectives .....................................................................................................................................1
1.3 Methodology ............................................................................................................................................2
1.3.1 Work Phase 1: Desktop review of relevant literature and legal frameworks ..........................................2
1.3.2 Identification of CBA case studies and scenario design .......................................................................2
1.3.3 Stakeholder identification & questionnaire design ................................................................................3
1.3.4 Project inception workshop in Kampala ................................................................................................3
1.3.5 Data collection in Karamoja – Second Multi-Stakeholder Consultative Meeting and site visits ............3
1.3.6 CBA modelling and report drafting .......................................................................................................3
2. A LITERATURE REVIEW OF THE SOCIO-ECONOMIC AND ENVRIONMENTAL IMPACTS OF ASM AND LSM ...................................................................................................................4
2.1 Positive and negative impacts of Artisanal and Small-scale Mining (ASM) .............................................4
2.1.1 The growing role played by ASM in mining worldwide .........................................................................4
2.1.2 Key socio-economic drivers of ASM .....................................................................................................5
2.1.3 Informal ASM is driving negative environmental and social impacts .....................................................5
2.1.4 The key environmental impacts of ASM ................................................................................................6
2.2 Positive and negative impacts of Large Scale Mining (LSM) ...................................................................8
2.2.1 Understanding the economic benefits of LSM ......................................................................................8
2.2.2 The social and environmental impacts of LSM ......................................................................................9
2.3 Introduction to cost-benefit analysis and its application in the mining sector .......................................14
2.3.1 Cost-benefit analysis (CBA) for mining projects – introduction to methods .......................................15
2.3.2 Assessing the net social impact of mining ..........................................................................................17
3. THE KARAMOJA REGION – STATUS QUO ...........................................................................................21
3.1 Improved security but persisting human development challenges ........................................................21
3.2 Colonial legacies of land tenure and new challenges ............................................................................23
3.3 Mining situation in Uganda and Karamoja .............................................................................................25
3.3.1 Brief history of mining in Uganda ........................................................................................................25
3.3.2 Definitions and conceptualization of LSM and ASM in Karamoja .......................................................26
3.3.3 The mining policy and legal regime in Uganda ....................................................................................26
3.3.4 The mineral taxation regime in Uganda ...............................................................................................29
3.3.5 Environmental and social regulations applicable to mining in Uganda ...............................................32
iii

4. COST-BENEFIT ANALYSIS OF KARAMOJA MINING CASE STUDIES ...............................................36
4.1 CBA of LSM case studies ......................................................................................................................36
4.1.1 Dao Marble Ltd – CBA of the Ratta Mine Marble Mining project ........................................................38
4.1.2 Tororo Cement Ltd – CBA of Kosoroi Limestone Quarry in Katikelike ................................................50
4.1.3 Jan Mangal Ltd – CBA of the Nakabat Gold Mine ...............................................................................58
4.1.4 African Minerals Ltd – CBA of Limestone ASM in Moroto ..................................................................66
4.1.5 Summary of key findings for LSM case studies ..................................................................................67
4.2 CASE STUDIES OF ARTISANAL AND SMALL-SCALE MINING (ASM) .................................................69
4.2.1 Gold artisanal mining at Rupa sub-county ..........................................................................................70
4.2.2 Gold artisanal mining at Acherer village ..............................................................................................70
4.2.3 Key findings from ASM case studies ...................................................................................................72
5. CONCLUDING REMARKS AND RECOMMENDATIONS FOR IMPROVING THE SUSTAINABILITY OF ASM AND LSM IN KARAMOJA ..........................................................................74
5.1 Building up ecosystem accounting and integrated land-use planning capacity while ensuring free access to information .......................................................................................................75
5.2 Promoting and ensuring sustainable LSM practices..............................................................................78
5.3 Providing tangible support to ASM communities for sustainable diversified livelihoods .......................79
Annex 1 – Impact rating and ranking criteria ...........................................................................................80
REFERENCES .............................................................................................................................................81
iv

List of tablesTable 2.1 ASM mining activities and their associated environmental impacts (Villegas et al., 2012) ............................... 7
Table 2.2 Top 20 countries in terms of mining production value (ICMM, 2012) ............................................................... 9
Table 2.3 Reliance on export of metallic minerals (OPM 2011) .......................................................................................................11
Table 2.4 Production, GDP, and employment magnitude options.................................................................................. 17
Table 4.1 Environmental impact rating and ranking for DML Rata Marble Mining Project............................................. 44
Table 4.2 Initial economic impacts of the Ratta Marble Mine over 50 years .................................................................. 45
Table 4.3 Selected lower, middle and higher bound values for production, GDP-regional (GDP-R) and employment impact multipliers ....................................................................................................................... 46
Table 4.4 Modelling of total direct, indirect and economic impacts of the Ratta Marble Mine over 21 years under Mining Licence .......................................................................... 46
Table 4.5 Calculating the GHG Footprint of diesel consumption for the Ratta Mine project (21 years) ....................... 49
Table 4.6 Estimates of grazing area and stocking rate in Karamoja (TLUs/ha/available grassland) (Anderson and Robinson, 2009) ..................................................................................................................... 50
Table 4.7 Estimates of minimum and maximum value of livestock using grazing land at Ratta Mine ML ..................... 50
Table 4.8 Environmental impact rating and ranking for TCL’s Kosoroi Limestone Quarry ............................................. 55
Table 4.9 Cost estimations for mitigating impacts on terrestrial habitats and air quality during site clearance and construction of temporary structures for TCL Kosoroi Limestone Quarry (Aeon and Muwanga, 2009a)....... 55
Table 4.10 Cost estimations for mitigating air quality impacts during the operational phase of TCL Kosoroi Limestone Quarry (Aeon and Muwanga, 2009a) ........................................................................ 56
Table 4.11 Closure cost estimations for TCL Kosoroi Limestone Quarry (Aeon and Muwanga, 2009a).......................... 56
Table 4.12 Minimum and maximum sales for community members selling limestone to TCL at Kosoroi Limestone Quarry .................................................................................................................. 57
Table 4.13 Minimum and maximum royalties and from TCL’s operations at Kosoroi Limestone Quarry ......................... 57
Table 4.14 Estimates of minimum and maximum value of livestock using grazing land at in TCL LL ............................. 58
Table 4.15 Environmental impact rating and ranking for JML’s Nakabat Gold Mine ....................................................... 63
Table 4.16 Expected minimum and maximum gold sales and uncollected royalties from artisanal miners within JML’s ML in 2013 ....................................................................................................... 65
Table 4.17 Estimates of minimum and maximum limestone sales and royalties from 2008 2012 – 2013 for AML LL in Moroto ................................................................................................ 67
Table 4.18 Environmental impact rating and ranking for scenario A (ASM) and B (mechanisation and blasting) at AML LL in Moroto ..................................................................................... 68
Table 4.19 Comparison of the specific modelling tasks completed for each case study ................................................ 68
Table 4.20 Estimates of minimum and maximum gold sales in 2012 – 2013 for the Rupa community ........................... 71
Table 4.21 Estimates of minimum and maximum gold sales in 2012 – 2013 for the Acherer community ....................... 73
Table 4.22 Trends in population and gold production from 2009 for the Acherer community ......................................... 73
v

List of figuresFigure 1.1 Standard methodology for undertaking a cost-benefit analysis ....................................................................... 2
Figure 2.1 Macroeconomic contributions to low and middle income economies (ICMM, 2012) .................................... 11
Figure 2.2 Impact of capital investment and operational expenditures ........................................................................... 14
Figure 2.3 The Total Economic Value of ecosystems (TEEB, 2010) ................................................................................. 18
Figure 2.4 Relationships between valuation methods and value types (TEEB, 2010) ..................................................... 18
Figure 3.1 Seasonal livelihood calendar of for the pastoral central and southern Karamoja livelihood Zone (FEG – FAO, 2010) ................................................................................................. 22
Figure 3.2 Seasonal livelihood calendar of for the agro-pastoral livelihood zone (August 2008 – Jully 2009) (FEG – FAO, 2010) ............................................................................................... 22
Figure 3.3 Map of protected areas in Karamoja in 2010 .................................................................................................. 24
Figure 3.4 Metallic mineral occurrences in Uganda ......................................................................................................... 25
Figure 4.1 Mining concessions map for Karamoja .......................................................................................................... 37
Figure 4.2 DML Mining Concessions map in Karamoja ................................................................................................... 41
Figure 4.3 Map of the DML Marble Mining Project showing the mining, processing and camp areas ........................... 42
Figure 4.4 The different scopes for assessing the GHG .................................................................................................. 48
Figure 5.1 The impact mitigation hierarchy and no-net-loss/no-net-impact principles applied to natural capital (NC) accounting, notably for the development of NC Statement of Performance (over one reporting period) and Position (over time, for at least 1 reporting period) (Houdet et al., In Press; adapted from BBOP, 2012 ; Germaneau et al., 2012) .............................................. 77
List of boxesBox 2.1 Legal evolution of ASM in Mongolia (Dore et al., 2012; Sustainable Artisanal Mining (SAM) .............................6
Box 2.2 Small-scale mining and alluvial gold panning within the Zambezi Basin: an ecological time bomb and tinderbox for future conflicts among riparian states (Shoko, 2002) ...........................................8
Box 2.3 Sustaining the socio-economic benefits and apparent low environmental footprints of ASM in the Congo Basin (Ingran et al., 2011) .....................................................................................................8
Box 2.4 The on-going dismal environmental, social and governance record of mining in the Philippines ....................10
Box 2.5 Acid Mine Water (AMD) as the legacy of gold and coal mining in South Africa................................................10
Box 2.6 AngloGold Ashanti and artisanal miners – the Geita mine in Tanzania .............................................................13
Box 2.7 Basic accounting framework for assessing the net social impact of a mine ....................................................17
Box 2.8 The development of a cost-benefit analysis of mining sites in Mongolia (UNEP, 2012b) .................................19
vi

AcronymsASM .................. Artisanal and Small Scale Mining
AML .................. African Minerals Limited
BPAF ................. Bank Payment Advice Form
CAO .................. Chief Administrative Officer
CBA .................. Cost Benefit Analysis
DGSM ............... Department of Geological Survey and Mines
DML .................. Dao Marble Limited
DNRO ............... District Natural Resources Officer
DWRM .............. Department of Water Resources Management
EIA .................... Environmental Impact Assessment
EL ..................... Exploration Licence
EPB ................... Environmental Performance Bonds
GoU .................. Government of Uganda
JML ................... Jan Mangal Limited
LL...................... Location Licence
LSM .................. Large Scale Mining
MDL .................. Mineral Dealers Licence
MEMD ............... Ministry of Energy and Mineral Development
ML .................... Mining Lease
MoFPED ........... Ministry of Finance, Planning and Economic Development
NEMA ............... National Environment Management Authority
NTR .................. Non Tax Revenues
OHS ................. Occupational Health and Safety
PL ..................... Prospecting Licence
RL ..................... Retention Licence
SAM .................. Social Accounting Matrix
TCL ................... Tororo Cement Limited
URA ................. Uganda Revenue Authority
vii

AcknowledgementsIUCN would like to extend gratitude to Irish Aid for the generous support towards the entire process of conducting this economic, social and environmental cost benefit analysis which included various activities involving different stakeholders.
The authors would like to thank all the companies for sparing time for meetings and accepting to disclose information about their operations, with special recognition to Dao Marble Limited for being so transparent.
Special gratitude also goes to the Ministry of Energy and Mineral Development, and specifically the Department of Geological Survey and Mines for effectively participating in this study and providing all the relevant information. The technical guidance and support of Mr Gabriel Data was very instrumental and is specifically acknowledged.
The team would like to thank all the stakeholders who participated in the study through the consultative meetings and the focused group discussions. Special gratitude goes to Simon Nangiro, the chairman of the Miners Association in Karamoja for supporting the team and mobilising the small scale miners to share their experiences and operations.
Finally, thanks to Mandakhbayar Sereenov for sharing information about a similar project, the cost-benefit analysis of the mining sector of Mongolia.
viii

Executive SummaryThe full range of economic, social and environmental costs and benefits of large scale mining (LSM) and artisanal and small scale mining (ASM) remain unclear in Karamoja. This study aims to conduct an economic, social and environmental cost-benefit analysis (CBA) of LSM and ASM in the region, with a view to helping inform policy makers, civil society, mining companies, and development agencies on best bet policy, legal, regulatory, investment and environmental frameworks for responsible and equitable mining.
To that end, the research team organised two Multi-Stakeholder Consultative Workshops in Kampala and Moroto, several focus group discussions with ASM communities and several meetings with identified LSM companies. Due to the limited data disclosure by mining companies and the lack of data from ASM community sites, only a limited number of CBA modelling activities could be undertaken. Nonetheless, the foundations have been laid for further in-depth research in partnership with the various stakeholders identified.
Furthermore, LSM was found to be nascent in Karamoja and to rely heavily on ASM communities, with partial (and sometimes no) mechanisation of mineral resource extraction processes. This reliance may be explained by a deliberate LSM business strategy which strives to minimise capital and operational expenditures and/or by ongoing pressures from ASM communities so as to ensure maximum casual labour opportunities. Notwithstanding this situation which significantly inhibits economic benefits at the local level, all case studies pinpoint to the general disregard of environmental regulations, OHS standard practices and human rights by most stakeholders. This can be explained by a combination of reasons, including but not limited to the lack of awareness, human resources and skills shortages for monitoring, auditing and compliance enforcement at all relevant local government levels, and the apparent lack of practical and immediate disincentives for non-compliance and, conversely, incentives for compliance or adopting best-practice.
To ensure that economically, socially and environmentally responsible and equitable mining activities occur in the future in Karamoja, this study proposes a number of key interventions which need to be urgently implemented. These recommendations are grouped into three categories: (1) building up ecosystem accounting and integrated land-use planning capacity while ensuring free access to information; (2) promoting and ensuring sustainable LSM practices; and (3) providing tangible support to ASM communities for sustainable diversified livelihoods.
ix


1. INTRODUCTION
1.1 Rationale and background to the project
Karamoja remains one of the poorest regions in Uganda, experiencing slow rates of development coupled with hard economic hardships, and is among the most prone to civil conflict and social unrest. Yet, the region is one of the most richly endowed regions in Uganda: over 50 different minerals are known to occur here, including gold, silver, copper, iron, gemstones, limestone and marble (Hinton et al., 2011). Twenty foreign and domestic companies presently have exploratory and/or mining rights in the region. These numbers are expected to rise with growing demand for metals and minerals, favourable long-term trends in global commodity prices and increased exploration.
In spite of its rich mineral potential, the commercial viability of large scale mining (LSM) and artisanal and small scale mining (ASM) and the full range of economic, social and environmental costs and benefits of mining in Karamoja remain unclear. There has been virtually no comprehensive Cost Benefit Analysis (CBA) of mining in Karamoja - an estimate of the economic, environmental and social costs and benefits of both LSM and ASM. This is not surprising since Uganda has had a history of policy, legal and regulatory constraints in the mining sector dating back to at least 1964 (UNEP 2012). The Government of Uganda (GoU) has been moving more aggressively to address these gaps, beginning with the Mineral Policy (2001), Mining
Act (2003), Mining Regulations (2004) and the Sustainable Management of Mineral Resources Project (SMMRP, 2004-11).
In the absence of comprehensive estimates of external benefits and costs of mining to stakeholders, it is impossible to determine the net benefits of Artisanal and Small-scale Mining (ASM) and Large-Scale Mining (LSM) and hence ensure sustainable development outcomes for Karamojongs and Ugandans. Filling these information gaps is required to make informed investment, policy and intervention decisions on the best bet livelihood options.
1.2 Project objectives
This study aimed to conduct an economic, social and environmental cost benefit analysis (CBA) of mining in Karamoja, with a view to helping inform policy makers, civil society, mining companies, and development agencies on best bet policy, legal, regulatory, investment and environmental frameworks for responsible and equitable mining within the region.
The results of this study will begin to fill this critical gap by identifying the costs and benefits – social, economic and environmental – in Karamoja and potential policy, legal and regulatory frameworks that might maximize the benefits of ASM and LSM to all stakeholders, and this while minimizing their external costs.
One of the mountain ranges in Moroto district. Most of these ecosystems host mineral deposits and are lined up for exploration.
1

1.3 Methodology
The methodology for undertaking this study is detailed as follows. Figure 1.1 summarises the key steps in a typical cost-benefit analysis (CBA).
1.3.1 Work Phase 1: Desktop review of relevant literature and legal frameworks
The desktop review, with specific reference to Karamoja, included:
• Secondary and ‘grey’ literature on the policy,legal and regulatory frameworks for LSM and ASM in Uganda ;
• Anyrelevantliteratureontheeconomic,socialand environmental situation in Uganda;
• Economic, social, environmental, health andhuman rights impact evaluations, if any, of key Sampled LSM projects; including a review of any environmental, social, health, human rights and biodiversity management plans;
• Relevant studies (if any) on the application/use of economic valuation tools in the case of ASM;
• Anyrelevantliteratureonthemacro-economicsituation of Uganda, with specific reference to its national social accounting matrix (SAM) and the associated impact multipliers used to assess the indirect economic benefits of proposed development projects;
• All relevant international best-practicestandards and guidelines that would be applicable to LSM and ASM projects in Uganda.
1.3.2 Identification of CBA case studies and scenario design
The aims of this work phase included:
• Determining the key ASM and LSM casestudies, their stakeholders and relevant scenarios for comparative analysis. For LSM, only companies with active mining operations were selected as actual capital and operational expenditures are required for CBA.
• Developing a concept CBA model for eachcase study which will integrate the economic, environmental and social benefits and costs of each scenario, for all relevant scenario stages (e.g. construction, operations, mine closure) over a relevant timeframe.
• Identifying key data gaps which wouldrequire further data collection through direct stakeholder engagement.
2
Figure 1.1 Standard methodology for undertaking a cost-benefit analysis
• Collection of background information on receiving area, including on stakeholders
• Collection of planning and cost data from project developper(s) or relevant agencies
• Scenario design and development
• Economic, social and environmental impact modelling per development scenario
• Comparative analysis, including qualitative impact rating and economic valuation (if data available)
• Interpresentation of results• Report drafting• Presentation of results
Baseline information collection
Scenario modelling
Interpretation & reporting

1.3.3 Stakeholder identification & questionnaire design
This work phase involved identifying key stakeholders (i.e. information holders) and designing appropriate questionnaires for further data collection so as to information the CBA of the various case studies. These stakeholders included:
• LSM companies to interview and or toadminister questionnaires to;
• ASM miners to interview and/or engage infocus group discussions;
• Informants or experts to interview, includinglocal government representatives and community members.
1.3.4 Project inception workshop in Kampala
A Multi-Stakeholder Consultative Meeting was held at the Golf Course Hotel in Kampala on August 21, 2013 and was attended by more than twenty participants. The aim was to introduce the project to various stakeholders, as well as to review and validate the project design and methodology. Discussions on potential contact persons for data collection purposes were initiated and several stakeholders warned of the risks of not finding enough information for CBA modelling.
The synthesis report of the project inception workshop is available at: http://www.iss-za.com/documents/Inception%20workshop%20report-Draft%20SK.pdf
1.3.5 Data collection in Karamoja – Second Multi-Stakeholder Consultative Meeting and site visits
The second Multi-Stakeholder Consultative Meeting was held at Kalip Hall in Moroto on November 19, 2013. The aim of this workshop, which was attended by more than fifty people, was to introduce the project to the local stakeholders, identify key informants and collect relevant information. The synthesis report of this second workshop is available at: http://www.iss-za.com/documents/Karamoja%20Regional%20Workshop%20report.pdf
Further grassroots consultations were made subsequently by research team with specific stakeholders, especially at the selected LSM and ASM mining sites. The aim was to collect specific data for CBA of LSM and ASM in Moroto and Nakapiripirit districts. This involved:
• Interviewing LSM companies with activemining operations, namely Dao Marble Limited (DML), Tororo Cement Limited (TCL), Jan Mangal Limited (JML) and African Minerals Limited (AML);
• FocusgroupdiscussionswithASMminersatAcherer, Rupa, Katikekile and Nakabat ;
• Informantorexpertinterviewswithpurposivelysampled stakeholder representatives, including Chief Administrative Officers (CAOs), Natural Resources Officers, Commercial Officers (Moroto and Nakapiripirit districts) and representatives from the Ministry of Energy and Mineral Development among others.
1.3.6 CBA modelling and report drafting
Although the main economic, social and environmental positive and/or negative impacts were identified for each study, CBA modelling was constrained by the lack of adequate quantified information as regards to their internal and external economic, social and environmental costs and benefits. The identification of key information gaps and the formulation of key recommendations were thus the priority of the research team.
Foremost, improving the governance, accountability and sustainability of ASM and LSM in Karamoja was found to be a priority to achieve sustainable development outcomes for Karamojongs and Ugandans. Emphasis was put on fostering appropriate multi-sectorial and integrated interventions, with special attention given to the interactions between ASM and LSM.
3

2. A LITERATURE REVIEW OF THE SOCIO-ECONOMIC AND ENVIRONMENTAL IMPACTS OF ASM AND LSM
The goals of this section are to provide a short review of the social, economic and environmental impacts of LSM and ASM as well as to present CBA methodological foundations and limitations. Several case studies from other countries will be used to that end.
2.1 Positive and negative impacts of Artisanal and Small-scale Mining (ASM)
2.1.1 The growing role played by ASM in mining worldwide
Artisanal and small-scale mining (ASM) constitutes an increasingly important livelihood for tens of millions of people around the world. While it generates needed income for rural communities, ASM is also a serious and growing threat to biodiversity, ecosystems and the integrity of protected areas (Villegas et al., 2012). Environmental impacts of ASM methods can be classified into 2
The term Artisanal & Small-scale Mining (ASM) broadly refers to mining practised by individuals, groups or communities often informally (illegally) and in developing nations. A common definition for this sector has not been adopted as its legal status, defining criteria, and local definitions vary from country to country. Yet, ASM is often conceptualised by comparing it to Large-Scale Mining (LSM), which involves companies with employees and mechanised operations.
The scale of LSM activities also varies greatly from one region or company to another, depending on the type of mineral extracted and the associated financial, technological and process requirements. LSM activities may involve small and medium-sized enterprises or international multinationals, with a labour force varying from a few individuals to hundreds of thousands of unskilled and skilled persons (e.g. platinum and gold mining companies in South Africa). In other words, LSM companies can be classified using standard business classification categories making use of different thresholds for the size of their labour force or their annual turnover.
A cross section of Karamoja stakeholders who participated in the Second Multi-stakeholder workshop in Moroto district.
4

categories: the direct and indirect impacts of the mining process (e.g. clear-cutting forests, river dredging, frequent use of toxic chemicals) and the associated livelihood practices necessary to support mining populations (e.g. gathering firewood, hunting for food or trade).
ASM occur in more than 80 countries (Telmer & Veiga, 2009) and on every continent except Antarctica. ASM produces some 10 per cent of the world’s mined gold (Hruschka and Echavarría, 2011), 15-20 per cent of mined diamonds (KPCS, 2008), approximately 20-25 per cent of mined tin and tantalum (Dorner et al, 2012), and a staggering 80 per cent of coloured gemstones (Lucas, 2011).
2.1.2 Key socio-economic drivers of ASM
There are many reasons why people undertake ASM. The primary motivation is usually economic and ASM generally offers (Hinton et al., 2011; Villegas et al., 2012):
• Access to immediate cash, which is oftendifficult to acquire in rural or subsistence-farming areas;
• Source of potential relief during difficultcircumstances in fragile societies which have undergone or are undergoing deepening poverty, natural disasters (e.g. Mongolia ; Dore et al., 2006), economic transition or collapse (e.g. Zimbabwe), or civil conflict or post-conflict reconstruction (e.g. Sierra Leone, Liberia and Karamoja, Uganda);
• Relatively high income opportunities tounskilled or illiterate individuals;
• Foodorotherbasicprovisionsinexchangeformining products;
• Emancipation from traditional hierarchies andsocial structures.
In other words, in the current context of high mineral prices (especially for gold), ASM is a rational economic choice for people seeking to escape absolute poverty or improve their lives: Artisanal miners may thus secure more income and faster economic returns than other livelihoods such as agriculture would ever offer them. For instance, an artisanal miner working north of Sapo National Park in Liberia has the opportunity to make 17 to 50 times more than the average Liberian per day (Villegas et al., 2012).
2.1.3 Informal ASM is driving negative environmental and social impacts
Several authors (Hinton et al., 2011; Ingram et al., 2011; Villegas et al., 2012) argue that the environmental degradation, occupational accidents and human rights abuses associated with ASM is largely due to the lack of appropriate incentives to mine in a more environmentally sensitive manner (i.e. to improve ASM techniques or to rehabilitate mining sites) and adopt appropriate OHS measures. This is, in part, further exacerbated by the political marginalisation of the sector.
According to Villegas et al. (2012), ASM’s marginalisation within the mining industry primarily stems from four issues:
• ThepersistentprioritisationofLSMoverASMwhenever possible.
• Inmostcountriesandcontexts,ASMdoesnotcontribute as much direct tax revenue to the state as LSM while its indirect contributions are often not calculated or considered.
• Informal or illegal ASM makes reform orformalisation economically unattractive and/or politically challenging.
• Local markets for high-value/low volumecommodities such as diamonds or precious stones (especially gold) often lack transparency and formal trading chains. These constitute ideal conditions for extraordinary profits in grey or black markets (i.e. money laundering or smuggling by unscrupulous middlemen) and incite stakeholders to develop and sustain direct ties to holders of economic and political power and resources so that to perpetuate the marginal and informal conditions which are crucial for the success of their businesses.
Villegas et al. (2012) further argue that these factors create a situation of minimal political will to address informal ASM situations, hence explaining the very limited numbers of successful education initiatives aiming at addressing artisanal miners’ (perceived) ignorance of how to reduce and/or mitigate their impacts on the environment or improve their working conditions (e.g. use of personal protective equipment). Designing appropriate incentives would require being mindful of the financial reality of ASM. ASM profits are in orders of magnitude
5

smaller than those of LSM, usually dispersed amongst a large group of people and most often entirely spent rapidly (within a few days) on the satisfaction of basic needs and alcohol (Hinton et al., 2011). There is thus no savings for any future environmental, OHS or educational expenditure and a complete lack of formal banking arrangements (e.g. performance bonds, study savings account) allowing for the funding of closure/rehabilitation activities or the educational costs of children.
2.1.4 The key environmental impacts of ASM
The most commonly reported ASM activities with negative environmental impacts involve the clearance of vegetation for mining activities. This, in turn, results in degraded and fragmented habitats for wildlife. Other frequently cited environmental impacts of gold and diamond ASM in particular are semi-mechanical techniques that use dredges, water pumps, hoses and vacuums to remove topsoil, riverbed sediments and riverbanks. The use of mercury and cyanide is a major issue in artisanal gold mining.
Table 2.1 provides a relatively comprehensive summary of the various environmental impacts associated with vegetation clearance, soil/rock removal, mining in or near rivers, lack of backfilling of mining pits, use of toxic materials (cyanide, mercury), bushmeat hunting and the established of settlements.
Box 2.1 Legal evolution of ASM in Mongolia
(Dore et al., 2012; Sustainable Artisanal Mining (SAM) – URL:
http://www.sam.mn/en.html)
ASM is not a longstanding traditional activity in Mongolia. Yet, it escalated from insignificance to being the main livelihood for tens of thousands of people (estimates range between 30,000 and 100,000 participants) during difficult economic times, and became a social safety net for herders who lost their herds in natural disasters. Commercial miners and local government authorities have been critical of these operations, stressing their environmental health hazards and the fact that they operate largely outside the existing legal framework for mining. In 2001 and 2002, the government attempted to accommodate ASM by enacting interim regulations for this informal activity. Those regulations proved largely ineffective and were not renewed. The government then decided to create a legal framework for ASM and drafted an Artisanal Mining Law, which failed to gain parliamentary approval, and was abandoned in 2005. Nonetheless, in 2010 - almost two decades after the emergence of ASM in Mongolia - ASM legislation was enacted to help formalise artisanal miners. As a result, nationwide ASM formalisation has been under way since 2011.
6

7
Table 2.1 ASM mining activities and their associated environmental impacts (Villegas et al., 2012)
Clearing vegetation, and harvesting timber and non-timber forest products:
● Gathering wood for camp or mineshaft construction
● Clearing vegetation to expose substrate for mining● Firewood collection for warmth and cooking in
camps● Bark removal to make pans for washing minerals● Cutting specific plants to make carrying buckets or
for medicinal purposes
ASM ACTIVITIES OBSERVERED or ANTICIPATED ECOLOGICAL IMPACT
● Food sources are diminished. E.g., in the case of apes, this includes fruit trees and terrestial herbaceous vegetation
● Habitat and migration paths are blocked by mining camps● Habitat loss due to deforestation● Increased vulnerability of forest ecosystems to invasive plant and animal species● Erosion of unsecured soil during rains, sometimes resulting in landslides● Soil degradation leading changes in vegetation including food sources● Secondary impacts from erosion, including sedimentation and siltation (see below)● Behavior modification. For example, in Sapo National Park, cleared spaces found to act
as sites for congregation of elephants● Extensive use of tracks both on foot and by cars lead to additional habitat loss, migration
range disruption and increased vulnerabilty to commercial bushmeat trade● Important non-timber forest products used in food preparation and house construction
Physical removal of soil and rock to access the deposit:● Use of high power hoses or medium and large-size
backhoes and dredges to remove topsoil or the top layer of sand and clay
● Use of spades and other manual tools to remove soil
● Increased vulnerability of affected areas to erosion● Reduced capacity of the area for recovery of the native ecosystem● Creation of ecological nichesfor non-native vegetation● Release and dispersal of corroive dusts● Exposure of mineralized rocks, soils and tailings leading to oxidization of sulphide minerals
and the subsequent release of toxic metal ions (known as ARD -"acid rock drainage"). ARD can impact groundwater and surface water quality
● Air-borne or water-borne toxic substances can detrimentally impact soils, water quality, vegetation and human health
● Destruction of riverbanks and riverbeds impact hydrological systems and aquatic ecology.
Mining in or near rivers and streams:● Increased release of silt during the washing and
panning process● Diversion of waterways to access mineralized deposits
on the riverbed or to obtain water needed for washing● Use of pumps to remove water when digging
below the water table● Direct dumping of waste, tailings and effluents in
waterways● Removal/disruption of riverbeds and riverbaks
because of intensive scooping, dredging or vacuumming
● Digging in riverbanks● Unmanaged release of tailings into waterways
through erosion
● Siltation reduces light penetration into water bodies, causing reduced photosynthesis in aquatic plants, depleting oxygen levels in the water and clogging of the gills of fish; all consequences kill aquatic life
● Increased turbidity due to siltation can reducewater quality by creating favourable conditions for harmful microbes
● Direct (tailing, diesel from pumps) and indirect (turbidity) pollution of human and animal drinking water sources
● Sedimentation can lead to loss of refuges and spawning grounds for fish● Smaller steams and waterways can cease to flow due to numerous open pits and clogging of
springs● Erosion of unprotected earth during rains leading to landslides, additional sediment release and
riverbank deterioration● Reconfiguration of hydrological systems in one area through widening and/or dredging can
affect hydrology downstream; e.g. through sedimentationa and filling of dam reservoirs, disappearance of marshland and wild bird habitats, increased flash floods
● Loss and degradation of aquatic herbaceous vegetation through riverbank impacts
Lack of backfilling when digging pits in search of gold and other minerals
● Stagnant pools of water in mining pits are breeding grounds for malaria-carrying mosquitoes and water-borne diseases
● Abandoned pits pose a risk of injury and drowning to children and animals, including livestock and endangered species
● Previously mined sites are often unstable for agriculture, forcing people into other habitats to serve their needs
● Aesthetics are affected by creating "moonscapes"● Lack of backfilling aggrevates the negative effects of erosion by making topsoil
reconstruction very difficult● Issues around re-establishment of original vegetation
Use of toxic materials in gold processing:● Use of cyanide● Use of mercury, especially vaporization and release
into waterways
● Risk of "dead zones" and localized death of animals (including birds and fish) exposed to unmanaged cyanide releases
● Exposure of humans and animal species to mercury emissions into air and water● Bioaccumulation of Hg up the food chain, especially in carnivorous fishes consumed by
local and distant populations● Pollution of drinking water for humans and animal species
Hunting animals for bushmeat to feed miners and their families, and to sell in the local markets
● Opportunistic and deliberate poaching of endangered species for trade
● Population decline of critically threatened and endangered species due to hunting● Animals maimed or mortally wounded after escaping from snares● Disturbance of wildlife habitats and migration routes due to large number of people resident in and
moving through forest, as well as light and sound pollution of mining activities● Population decline of poached species, with broad-scale ecological impacts, including the loss or
decline in seed dispersing agents like elephants and great apes, leading to forest health decline
Ancillary/support services
Establishment of permanent and semi-permanent camps, villages and towns
● Noise may alter animal habits, migration patterns, or increase resource competition and territprial warfare
● Increased human-wildlife conflict (great population density in the park means higher rate of human encounters with animals)
● Increased human-wildlife conflict due to higher proximity● Lack of household waste management and other factors lead to ground, soil, water air pollution● Spread of diseases in humans, such as cholera and typhoid● Exposure of gorillas and chimpanzees to human diseases, such as the flu, harmful parasites
and other disease stemming from sewage from mining sites● Exposure of humans to zoonotic disease due to increased animal interaction (e.g Ebola
Hemorrhagic Fever, Anthrax)
● Ecological changes due to loss of keystone species such as elephants and apes● Long-term changes in watershed due to rapid run-off in deforested areas● Downstream hydrological impacts with respect to water quality and flow due to widespread siltation and pollution of rivers and streams.
Larger ecosytem impacts

2.2 Positive and negative impacts of Large Scale Mining (LSM)
There are two ways through which it is possible to tackle the question of sustainability related to the mining sector. The first refers to sustainability of the sector itself, and is related to how to make exploitation of a non-renewable resource sustainable for companies. The second aspect is related to the mining sector´s influence on economic, environmental and cultural sustainability of those countries or regions where LSM take places. In this section, we focus on the second aspect.
2.2.1 Understanding the economic benefits of LSM
The development benefits of LSM are highly significant in many countries and are usually expressed in terms of production volumes, total investment/foreign direct investment, employment and wages, government revenues through taxation and royalties, contribution to exports, net foreign exchange earnings and direct effects on national economies (contribution to GDP) (ICMM, 2012). Table 2.2 shows the top 20 countries in terms of mining production. Figure 2.1 shows the macro-economic contributions of mining to low- and middle- income economies while Table 2.3 depicts
the risky reliance on export of metallic minerals in some countries. In recent years, great emphasis has also been placed on understanding and quantifying local development impacts, such as the procurement of local goods and services and the provision of skills and infrastructure.
While these aforementioned indicators of the contribution that the mining industry can make to local, regional and national economies are important, understanding the outcomes of mineral development for communities and society as a whole requires a different type of analysis (ICMM 2013). Stakeholders are increasingly asking what has happened within local communities and societies as a result of mineral development and associated investments: i.e. what are the effects of mining activities on quality of life and livelihoods? And what is the magnitude and longevity of these effects? Answers to these questions are more difficult to generate, requiring LSM companies to demonstrate for instance that their investments have been co-ordinated to achieve strategic outcomes in areas of greatest need, that there is progress towards human development goals that can be linked to mining and that mining has
Box 2.2 Small-scale mining and alluvial gold
panning within the Zambezi Basin: an ecological time bomb and tinderbox for future conflicts among riparian states
(Shoko, 2002)
ASM, and particularly alluvial panning of minerals, is a relatively new informal economic activity. Its intense dependence on water for the panning process and on firewood for fuel has resulted in uncontrolled siltation of rivers and other water reservoirs as well as rampant deforestation. The Zambezi Basin, with some of its fragile ecosystems and endangered species, has and is being negatively impacted upon by such small scale and alluvial panning activities. Transboundary natural resources, including water and biological resources are at the receiving end of these activities. The fact that the activities are more prominent in some countries than others is likely to cause tension and/or conflict between and among riparian states of the Zambezi Basin.
Box 2.3 Sustaining the socio-economic benefits
and apparent low environmental footprints of ASM in the Congo Basin
(Ingran et al., 2011)
Diamonds and gold contribute directly to the livelihoods of at least 5% of the population of the Sangha Tri-National (TNS) landscape covering Cameroon, the Central African Republic and Republic of the Congo. Although up to eight income-generating strategies are used, mining contributes on average to 65% of total income and is used mainly to meet basic needs. A gold miner’s average income is USD 3.10 a day, and a diamond miner earns USD 3.08, making them slightly wealthier than an average Cameroonian and three times wealthier than an average non-miner in the TNS.
However, the consequences of mining in such high value forest ecosystems are of concern; especially since ASM is likely to increase in the near future (i.e. increasing numbers of artisanal miners with low environmental awareness). Though environmental impacts are currently temporary, of low magnitude and of limited scale, measures are needed to ensure and reinforce the positive livelihood impacts of ASM and maintain its low environmental footprint in the TNS landscape.
8

left long-term positive social and environmental legacies (e.g. companies seeking International Finance Corporation – IFC - financing need to comply to the IFC Performance Standards on Environmental and Social Sustainability). In short, to demonstrate whether or not mining projects have a human development impact, measurement must be focussed on outcomes and not just inputs such as capital and operational expenditures (ICMM 2013).
2.2.2 The social and environmental impacts of LSM
Mining and metallurgic processes in all their life-cycle phases can have negative impacts on receiving ecosystems and human communities. A key difference with ASM is the sheer scale of some LSM operations: E.g. large open pits of several
hundred hectares, permanent acid mine drainage affecting entire catchments and the communities living within them in the long term (Box 2.5), complete shifts in surrounding land-use patterns due to population immigration.
Historically, the environmental and human health problems of LSM with the greatest repercussion include:
• Air contamination by emission of gases andbreathable dust particles imbued with heavy metals;
• Soilcontaminationbyparticlematter,dissolvedmetals and the presence of salts in liquid effluents;
• Marine, underground and surface watercontamination by emission of liquid effluents containing particulate matter, dissolved metals, acids and salts;
9
Table 2.2 Top 20 countries in terms of mining production value (ICMM, 2012)
Rank and country 2010 Production value (current US$ million
(1)
2010 Production value
(2)
2000 Production value (current US$ million (3)
2010 Production value
(4)
Change in production value 200-2010
(5)
2010 Production value as % of 2010 GDP
(6)
2000 Production value as % of 2000 GDP
(7)
2010 Mineral export contribution
(8)
1 Australia
2 China
3 Brazil
4 Chile
5 Russian Federation
6 South Africa
7 India
8 United States
9 Peru
10 Canada
11 Indonesia
12 Ukraine
13 Mexico
14 Kazakhastan
15 Iran, Islamic rep.
16 Phillipines
17 Sweden
18 Ghana
19 Zambia
20 Papua New Guinea
71,955
69,281
47,027
31,275
28,680
27,116
26,042
22,957
18,832
13,984
12,225
9,283
8,361
7,248
4,387
4,221
3,974
3,964
3,850
3,166
15.6%
15.0%
10.2%
6.8%
6.2%
5.9%
5.6%
5.0%
4.1%
3.0%
2.6%
2.0%
1.8%
1.6%
0.9%
0.9%
0.9%
0.9%
0.8%
0.7%
16,444
10,576
7,754
10,452
10,776
12,694
2,930
11,253
4,682
7,853
4,948
1,807
2,426
2,390
802
397
1,058
1,015
616
1,338
14.7%
9.4%
6.9%
9.3%
9.6%
11.3%
2.6%
10.0%
4.2%
7.0%
4.4%
7.6%
2.2%
2.1%
0.7%
0.4%
0.9%
0.9%
0.5%
1.2%
337.8%
555.1%
506.5%
199.2%
166.1%
113.6%
788.8%
104.0%
302.2%
78.1%
147.1%
413.6%
244.6%
203.3%
446.8%
964.1%
275.5%
290.4%
524.7%
136.5%
7.8%
1.2%
2.3%
14.7%
1.9%
7.5%
1.5%
0.2%
12.0%
0.9%
1.7%
6.7%
0.8%
4.9%
1.3%
2.1%
0.9%
12.7%
23.8%
33.4%
40.3%
1.6%
19.0%
65.9%
6.6%
37.4%
17.9%
6.2%
42.7%
11.9%
10.4%
8.2%
4.9%
13.1%
3.7%
6.8%
5.3%
25.4%
83.6%
54.0%
3.9%
0.9%
1.2%
13.9%
4.1%
9.6%
0.6%
0.1%
8.8%
1.1%
3.0%
5.8%
0.4%
13.1%
0.8%
0.5%
0.4%
20.4%
19.0%
38.0%
Total top-20
as % of World production417,867
88%

10
Box 2.4 The on-going dismal environmental,
social and governance record of mining in the Philippines
Mining has a very poor record in the Philippines as a result of the massive social and environmental problems it has caused historically. Records kept by UNEP reveal the Philippines to be among the worst countries in the world with regard to tailings dam failures whereby the surface impoundments containing the toxic waste from the mining process failed with disastrous consequences for local people and the environment (Doyle et al., 2007).
A recent fact-finding team (Doyle et al., 2007) witnessed at first hand the havoc mining is wreaking on the livelihoods, health and human rights of indigenous peoples and other local communities. They also saw the potential for massive environmental damage to critical water catchment areas, thousands of hectares of agricultural land and the valuable marine environment (fisheries offer important livelihoods to coastal communities).
Given the rapidly growing population, which is projected to rise from 84 million to 150 million by 2036, the destruction of these vital ecosystems will have serious implications for the food security and future sustainable development of the country. Unless the water catchment areas are protected and forests are replanted on a massive scale with native species, Doyle et al. (2007) estimate that at least 50 per cent of sustainable agriculture, which require irrigation, will be lost.
• Overuseofwaterresources,especiallyinareasof water scarcity;
• Contamination and destruction of renewablenatural capital and ecological infrastructures that absorb air, water and soil contaminants;
• Permanenteffectsonlandscapeaestheticsbyopen pit mining activity;
• Land subsidence caused by subterraneanmining activity;
• Direct contamination of people, both in thecommunity and work environments, bearing in mind that all the aforementioned points also affect humans, one way or another.
• Biodiversitylossthroughvegetationclearance(sometimes in areas with endemic species), habitat fragmentation (roads, infrastructures), and increased human population pressures.
Although most LSM companies had/have the financial means to ensure minimal residual social and environmental impacts, their legacies in many
countries are often far from positives, as shown for the Philippines (Box 2.4) and South Africa (Box 2.5). There are numerous reasons for this, including the lack of adequate environmental legislation, poor (or lack of) monitoring and compliance, Environmental Management Plans/or Programmes (EMPs) of poor quality, inaccurate and/or inadequate financial closure assessments, disclosure and independent third-party assurance (e.g. see Van Zyl et al., 2012 for an analysis of the South African situation as regards to closure costing and implementation). In fact, the extractive industry worldwide has been described as having an ‘enormousand intrusivesocialandenvironmental
Box 2.5 Acid Mine Water (AMD) as the legacy of
gold and coal mining in South Africa
South Africa is well endowed with vast mineral resources and the wealth created through mining, particularly gold mining, has funded the economic development of the country. As some LSM operations are being closed down or are reaching their twilight years, stakeholders have begun to look at their social and environmental legacies (McCarthy, 2011).
Foremost, Acid Mine Drainage (AMD) has been reported from a number of mining areas within South Africa, including the Witwatersrand Gold Fields and the Mpumalanga and KwaZulu-Natal Coal Fields. Risks identified with respect to the flooding of the mines and the subsequent decant of AMD to the environment include:
• Contamination of shallow groundwater resources required for agricultural use and human consumption and of surface streams with devastating ecological impacts;
• Rising mine water levels have the potential to flow towards and pollute adjacent groundwater resources;
• Geotechnical impacts, such as the flooding of underground infrastructure in areas where water rises close to urban areas;
• Increased seismic activity which could have a moderate localised effect on property and infrastructure.
The Western, Central and Eastern Basins are currently identified as priority areas requiring immediate action. This is due to the lack of adequate measures to manage and control the problems related to AMD, the urgency of implementing intervention measures before problems become more critical and their proximity to densely populated areas (Ramontja et al., 2011). Other regions are also being closely monitored; especially the Mpumalanga Coal Fields, where mining has severely impacted the freshwater sources in the upper reaches of the Vaal and Olifants River Systems and is negatively affecting drinking water quality in downstream towns.

11
Figure 2.1 Macroeconomic contributions to low and middle income economies (ICMM, 2012) Note: The percentages are not additive but indicate the range of stand-alone contribution of each segment.
Table 2.3 Reliance on export of metallic minerals (OPM, 2011)
Rank and country
1 Botsawna
2 Zambia
3 Dem. Rep. of the Congo
4 Mongolia
5 Suriname
6 French Polynesia
7 Chile
8 Guinea
9 Peru
10 Mauritania
11 Northern Mariana Islands
12 Mozambique
13 Mali
14 Sierra Leone
15 Papua New Guinea
16 Namibia
17 Nauru
18 Armenia
19 Jamaica
20 Cuba
GDP/capita (PPP at current prices, 2009, US$)
$13,384
$1,430
$319
$3,522
-
-
$14,311
$1,048
$8,629
$1,929
-
$855
$1,186
$808
$2,281
$6,410
-
$5,279
$7,633
-
58.7%
79.4%
72.4%
60.3%
68.0%
69.2%
47.7%
77.1%
48.3%
36.1%
3.3%
6.1%
8.5%
30.6%
24.5%
36.2%
73.1%
23.9%
49.7%
15.1%
86.5%
44.0%
70.2%
70.1%
64.3%
55.3%
56.5%
84.0%
57.9%
49.3%
4.5%
66.9%
37.2%
58.2%
39.2%
41.2%
25.2%
39.8%
68.5%
39.2%
83.7%
83.6%
78.3%
77.6%
75.4%
67.1%
65.9%
65.2%
62.7%
60.4%
58.9%
57.0%
54.8%
54.3%
54.0%
53.4%
50.8%
50.6%
49.6%
47.7%
25
4
6
17
7
-2
18
-12
14
24
56
51
46
24
30
17
-22
27
0
33
Mineral expoert contribution 1996
Mineral expoert contribution 2005
Mineral expoert contribution 2010
Change in mineral expoert contribution 1996-2010 (percentage points)
FoReIGN DIReCT INveSTMeNT (FDI)Mining FDI often dominates the total flow of FDI in low income economies that have only
limited other attractions for international capital
exPoRTSMineral exports can rapidly rise to be a major share of total exports in low
income agrarian economies even when starting from a low base
GoveRNMeNT ReveNUeMineral taxation has become a very significant source of total tax revenues in many low incomeeconomies
with limited tax-raising capacity
NATIoNAL INCoMe (GDP AND GNI)Modern-day mineral-process technology is sophisticated and highly capital intensive; locations are centralized as a result and most upstream value addition takes place
outside the mine-host country
eMPLoyMeNTMine employment on
its own is usually small relative to the total
national labour force
60 - 90% of total FDI
30 - 60% of total exports
3 - 20% of government revenues
3 - 10% of total national income
1 -2% of total employment
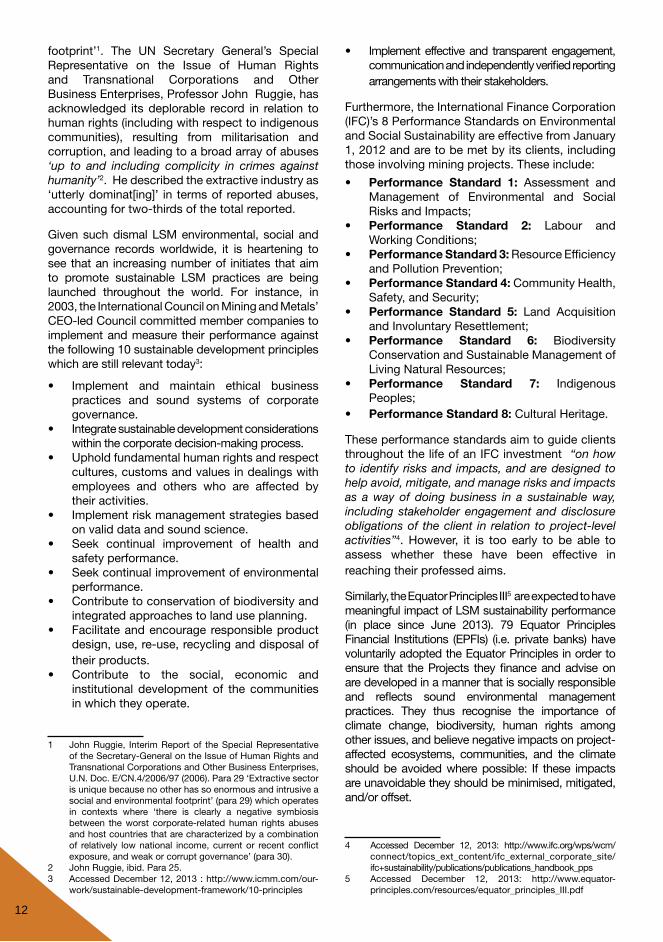
footprint’1. The UN Secretary General’s Special Representative on the Issue of Human Rights and Transnational Corporations and Other Business Enterprises, Professor John Ruggie, has acknowledged its deplorable record in relation to human rights (including with respect to indigenous communities), resulting from militarisation and corruption, and leading to a broad array of abuses ‘up to and including complicity in crimes against humanity’2. He described the extractive industry as ‘utterlydominat[ing]’ in termsof reportedabuses,accounting for two-thirds of the total reported.
Given such dismal LSM environmental, social and governance records worldwide, it is heartening to see that an increasing number of initiates that aim to promote sustainable LSM practices are being launched throughout the world. For instance, in 2003, the International Council on Mining and Metals’ CEO-led Council committed member companies to implement and measure their performance against the following 10 sustainable development principles which are still relevant today3:
• Implement and maintain ethical businesspractices and sound systems of corporate governance.
• Integratesustainabledevelopmentconsiderationswithin the corporate decision-making process.
• Upholdfundamentalhumanrightsandrespectcultures, customs and values in dealings with employees and others who are affected by their activities.
• Implementriskmanagementstrategiesbasedon valid data and sound science.
• Seek continual improvement of health andsafety performance.
• Seekcontinualimprovementofenvironmentalperformance.
• Contributetoconservationofbiodiversityandintegrated approaches to land use planning.
• Facilitateandencourageresponsibleproductdesign, use, re-use, recycling and disposal of their products.
• Contribute to the social, economic andinstitutional development of the communities in which they operate.
1 John Ruggie, Interim Report of the Special Representative of the Secretary-General on the Issue of Human Rights and Transnational Corporations and Other Business Enterprises, U.N.Doc.E/CN.4/2006/97(2006).Para29‘Extractivesectoris unique because no other has so enormous and intrusive a social and environmental footprint’ (para 29) which operates in contexts where ‘there is clearly a negative symbiosisbetween the worst corporate-related human rights abuses and host countries that are characterized by a combination of relatively low national income, current or recent conflict exposure, and weak or corrupt governance’ (para 30).
2 John Ruggie, ibid. Para 25.3 Accessed December 12, 2013 : http://www.icmm.com/our-
work/sustainable-development-framework/10-principles
• Implementeffectiveand transparentengagement,communication and independently verified reporting arrangements with their stakeholders.
Furthermore, the International Finance Corporation (IFC)’s 8 Performance Standards on Environmental and Social Sustainability are effective from January 1, 2012 and are to be met by its clients, including those involving mining projects. These include:
• Performance Standard 1: Assessment and Management of Environmental and Social Risks and Impacts;
• Performance Standard 2: Labour and Working Conditions;
• PerformanceStandard3: Resource Efficiency and Pollution Prevention;
• PerformanceStandard4: Community Health, Safety, and Security;
• Performance Standard 5: Land Acquisition and Involuntary Resettlement;
• Performance Standard 6: Biodiversity Conservation and Sustainable Management of Living Natural Resources;
• Performance Standard 7: Indigenous Peoples;
• PerformanceStandard8: Cultural Heritage.
These performance standards aim to guide clients throughout the life of an IFC investment “on how to identify risks and impacts, and are designed to help avoid, mitigate, and manage risks and impacts as a way of doing business in a sustainable way, including stakeholder engagement and disclosure obligations of the client in relation to project-level activities”4. However, it is too early to be able to assess whether these have been effective in reaching their professed aims.
Similarly, the Equator Principles III5 are expected to have meaningful impact of LSM sustainability performance (in place since June 2013). 79 Equator Principles Financial Institutions (EPFIs) (i.e. private banks) have voluntarily adopted the Equator Principles in order to ensure that the Projects they finance and advise on are developed in a manner that is socially responsible and reflects sound environmental management practices. They thus recognise the importance of climate change, biodiversity, human rights among other issues, and believe negative impacts on project-affected ecosystems, communities, and the climate should be avoided where possible: If these impacts are unavoidable they should be minimised, mitigated, and/or offset.
4 Accessed December 12, 2013: http://www.ifc.org/wps/wcm/connect/topics_ext_content/ifc_external_corporate_site/ifc+sustainability/publications/publications_handbook_pps
5 Accessed December 12, 2013: http://www.equator-principles.com/resources/equator_principles_III.pdf
12

13
Box 2.6 AngloGold Ashanti and artisanal miners – the Geita mine in Tanzania*
Problems associated with artisanal mining recently came to the fore at Geita mine in Tanzania in April 2005 when approximately 7,000 gold seekers invaded the area after word spread that a large nugget of gold had been found by artisanal miners. While the majority of the miners left on their own accord after appeals were made from management to vacate the lease area, the police had to be summoned to remove those who resisted.
Geita is now the site of a pilot project to tackle artisanal mining, developed following a request to the mine by Tanzanian President Benjamin Mkapa to assist in managing the phenomenon. A workshop, attended by 95 artisanal miners, was held in April 2005 as a result. It was a joint initiative between the mine and the UK’s Department for International Development (DFID) and addressed all issues associated with artisanal mining. During discussions, it emerged that the miners wanted more information on topics like access to small business loans, technology, safe working conditions and better mining techniques.
Thereafter, a trade fair took place, on 28 July 2005 at Nyarugusu Village, some 32 km from Geita town. The fair was aimed at providing greater information on the topics raised at the workshop. A number of local and international participants were present, including the National Microfinance Bank (NMB) providing advice on opening accounts and requesting investment loans; the Vocational Education Training Authority (VETA) which explained how to become competent in artisanal mining and even qualify for a national diploma in the practice; the Small Industries Development Organization (SIDO) advising on alternative means of employment and the dangers of using mercury in gold extraction; and the International Labour Organization (ILO) which spoke out against child labour and unsafe working conditions. Also represented were other large mining companies operating in the area, who realise the necessity to act as a group, as well as the Mwanza Regional Miners Association (MWAREMA) and the Tanzanian Women Miners’ Association (TAWOMA). In order to transcend language, educational and cultural barriers, concepts and messages were conveyed through industrial theatre, later converted into pictorial form for reinforcement.
Follow-up awareness campaigns have been planned and the mine is also looking to establish a working partnership with the United Nations Industrial Development Organisation’s (UNIDO) Global Mercury Project (GMP), aimed at reducing mercury pollution by artisanal mining through introducing cleaner technologies. Besides, AngloGold Ashanti is exploring the possibility to section off areas within its lease areas which are not necessarily viable for the company but which may well be mined through artisanal mining. This would meet the objective of legitimizing these operations while at the same time eliminating the disturbance of company operations. It would also facilitate the establishment of constructive dialogue between the company and the artisanal miners.
While each country presents its own set of issues with regard to artisanal mining, AngloGold Ashanti believes that elements of the Geita approach can be transferred to the company’s other operations. A strategic plan is currently being drawn up for its Siguiri mine in Guinea where the issue of artisanal mining requires urgent attention. The company has adopteda‘pushandpull’approach-protectingthemine’sassetswhileatthesametimegearinguptoassistminerstobecome legal entities.*Accessed on December 12, 2013 - URL: http://www.anglogoldashanti.co.za/subwebs/InformationForInvestors/ReportToSociety05/values_bus_principles/community/c_cs_tzn_5_5.htm
From a governance standpoint, the introduction of the Dodd-Frank Act (Section 1504) in the United States of America, the new Accounting and Transparency Directives in the European Union, a new implementing requirement for the Extractive Industries Transparency Initiative (EITI) among other initiatives are progressively bringing a new global transparency standard for oil, gas and mining revenues into being (Global Witness, 2013). The purpose of these changes is to tackle corruption in the natural resource sector, boosting development and creating more stable investment climates. In practice, more companies and governments are expected to publish detailed information about payments and receipts for the extractive sector, allowing greater scrutiny of extractives related revenuesandallowcitizensto‘followthemoney’.
Follow-up awareness campaigns have been planned and the mine is also looking to establish a working partnership with the United Nations Industrial Development Organisation’s (UNIDO) Global Mercury Project (GMP), aimed at reducing mercury pollution by artisanal mining through introducing cleaner technologies. Besides, AngloGold Ashanti is exploring the possibility to section off areas within its lease areas which are not necessarily viable for the company but which may well be mined through artisanal mining. This would meet the objective of legitimizing these operations while at the same time eliminating the disturbance of company operations. It would also facilitate the establishment of constructive dialogue between the company and the artisanal miners.

While each country presents its own set of issues with regard to artisanal mining, AngloGold Ashanti believes that elements of the Geita approach can be transferred to the company’s other operations. A strategic plan is currently being drawn up for its Siguiri mine in Guinea where the issue of artisanal mining requires urgent attention. The company has adopted a ‘pushandpull’approach-protectingthemine’sassets while at the same time gearing up to assist miners to become legal entities.
2.3 Introduction to cost-benefit analysis and its application in the mining sector
CBA is typically used as a tool in Economic Impact Assessments commissioned by decision-making authorities to assist them in deciding whether a project will be economically sustainable. In other words, the aim is to compare alternative land use, development or policy scenarios so as to determine whether society will benefit from a change in the status quo. This section aims to explain the principles of cost-benefit analysis (CBA) for mining projects and the associated methodologies and limitations as well as its application in the mining section.
14
Induced impact (business benefitting from household expenditure)
Indirect impact (related business upstream and downstream)
Direct impact
Figure 2.2 Impact of capital investment and operational expenditures
Capital investment/operational expenditure
Economy-wide positive social benefits• Increased income• Improved quality of life• Skills development
Production of sector
Production employment Production
employment of the sector
employment
Equipment, supplies, services, etc. Household goods
Household goods

2.3.1 Cost-benefit analysis (CBA) for mining projects – introduction to methods
Economic Impact Assessments in mining deal with the evaluation of potential impacts of a particular project on the economic environment of the receiving area. It analyses potential changes in production output, Gross Value Added, and employment during all relevant life-cycle phases of the proposed mining project (i.e. construction, operations, closure, land-use after mining). More specifically, EIA assesses the way in which the direct benefits and costs of a proposed project affect the local, regional, or national economy.
The intervention can be in the form of new investment in infrastructure, new development, adoption of a new policy or services, expansion of current operations, etc. The types of economic impacts can be:
• Positive and include the creation ofadditional jobs, generation of business sales and value-added, improved quality of life, increase in disposable income, and growth of government revenue in the form of taxes and royalties.
• Negative, through the loss of forgonealternative livelihoods/business activities (e.g. change in land-use from agriculture to mining, loss of future tourism potential) and negative social and environmental externalities6.
Assessment of economic impacts requires knowledge of expenditure on the construction of the mine and operating costs borne once mining commences. Conversion of these input data into economic impacts is done by using an econometric model. For the model to be considered valid, all the various assumptions must be adhered to and it is essential that the data required be as precise as possible, since the quality of the model’s output is directly related to the quality of the data inserted into the model.
An intervention into an economy (on any scale) not only creates direct benefits to the investor, but has spill-over effects on the other economic agents. These spill-over effects could be positive or negative. As illustrated in Figure 2.2 above, three types of economic impacts are generally assessed:
6 In economics, an externality is a cost or benefit which affects a party who did not choose to incur that cost or benefit.
• Directeconomiceffects7 are generated when the new business (e.g. mining project) creates new jobs and purchases goods and services to operate the new facility. Direct impact results in an increase in job creation, production, business sales, and household income;
• Indirect economic effects occur when thesuppliers of goods and services to the new businesses experience larger markets and potential to expand. Indirect impacts result in an increase in job creation, Gross Geographic Product (GGP), and household income; and
• Induced economic effects represent furthershifts in spending on food, clothing, shelter and other consumer goods and services as a consequence of the change in workers and payroll of directly and indirectly affected businesses. This leads to further business growth/decline throughout the local economy.
Economy-wide impacts refer to the sum of the direct, indirect and induced effects.
Using national Social Accounting matrixes and impact multiplier
Typically, national Social Accounting Matrix (SAM) and associated multipliers are used as the primary database for an economic impact model. SAM are comprehensive, economy-wide databases that contain information about the flow of resources that takes place between the different economic agents in an economy. The defining feature of multi-sectorial macro-economic models is their ability to explain the detailed interdependency between the sectors of the economy and the agents of the economy. These models therefore have the ability to quantify the impact of economic events on the various sectors and agents in the economy and also show the aggregated effect on the macro-economic variables on the total economy. The models are therefore ideally suited to assess the impact of alternative development initiatives, such as a proposed mining project which will impact on agriculture and tourism.
7 Direct impacts include initial and first round impacts. Initial impact: This is the change in a final demand component which occurs or is assumed, for example, a USD1 billion capital investment in a project, or additional operational expenditure on a sectors output. First round effects (also referred to as first order effects): These effects are the changes in business activity and production occurring as a direct consequence of a project (initial impact). These include the impact of sectors required to produce more to meet the demand from the project. For example, constructing a mining plant will create a need for brick, mortar, steel, machinery and so on, so the other sectors in the economy need to supply these materials.
15

Although multiplier analysis is a useful tool to analyse the economic contribution of spending associated with any sector, it has some limitations, which need to be considered when interpreting the multipliers:
• Firstly,multipliersassumethattheindustriesinthe economy use inputs, and produce outputs, in fixed proportions – the model is therefore technologically static.
• Secondly, multipliers do not take inducedchanges in relative prices into account.
• Thirdly, multipliers assume that labour andcapital are available in unlimited quantities.
For instance, employment multiplier shows the increase in the number of jobs supported resulting from an increase in final demand. It is very important to note this number does not necessarily mean that new jobs are created in the economy. The number of jobs created due to the activities of the sector will be determined by various factors such as capacity in other sectors, labour productivity, efficiencies, technology, labour market rigidities, and seasonal factors. An increase in the number of jobs required may also result in the reallocation of workers across the economy and not necessarily the employment of additional workers. It also does not say anything about the type of jobs created whether permanent or temporary. The employment multiplier is therefore an indicator of the number of jobs supported by the activities of a sector and not an indicator of jobs created.
Accordingly, the use of multipliers will tend to overstate the economic impact but at least provide an upper-bound to the potential impact. One of the basic assumptions of the input-output model is that there is equilibrium in the commodities market and therefore demand (input) equals supply (output). Furthermore, it is assumed that capacity in the economy is always fully utilised. This is frequently not the case which implies that the average required employment and capital multipliers overstates the employment and capital requirement case. These two multipliers therefore should be interpreted with caution. At most they state the number of jobs and capital stock utilised to produce the given final demand and do not in any way imply additional net new jobs and capital investment.
Assessing the significance of economic impacts of a proposed project
The potential or predicted impacts of a mining project can also be assessed using an approach based on a scoring system. This approach entails assessing economic impacts on the basis of their association to various possible mutually exclusive
characteristics of a number of predetermined criteria. A score is pre-assigned to each possible characteristic (per criterion) and the impact’s score is determined by a calculation that has been pre- assigned. Criteria include the geographic extent, duration, magnitude and probability of the impact (see Annex 1, p. 80). Once the evaluation exercise has been completed, the implications (both positive and negative) of the potential economic impacts are identified. These implications provide the basis for actions that could improve the positive aspects of the project and reduce the negative aspects.
Choosing the appropriate geographical extent, duration and probability options are relatively straightforward and do not require any mathematical analysis. Determining the magnitude of an impact is, however, more complex. For instance, to evaluate the direct production, GDP, or employment impacts, on the basis of magnitude, the contribution of the production/GDP/employment impact to the change in size of the relevant economic sector’s production/GDP/employment during the base period can be compared to the production/GDP/employment contribution of the relevant economic sector to the change in the size of the entire economy’s production/GDP/employment during the base period. The required calculations are summarised as follows8.
To determine the magnitude of the indirect and induced production, GDP, or employment impacts, the actual values of the indirect and induced impacts are divided by the actual values of the direct impact. Table 2.4 presents the various comparative options and their associated scores.
Finally, the following formula can be used to calculate the significance of macroeconomic impacts:
Significance Points (SP) = (Magnitude + Duration + Scale)* Probability.
Significance scores are then classified as follows:
• >71Highmacroeconomicsignificance;
• 41-70Moderatemacroeconomicsignificance;and
• <40Lowmacroeconomicsignificance.
8 This approach is one among several others.
16
A/B and B/C , where
A= Direct Production/GDP/Employment Impact
B= Δ (Year 1- Year 2) Sector Production/GDP/Employment
C= Δ (Year 1 – Year 2) Total Economy Production/GDP/Employment

2.3.2 Assessing the net social impact of mining
Unfortunately, the standard approach for Economic Impact Assessment described in the previous section (2.3.1) does not work for social and environmental externalities as there is no transaction readily recorded in the SAM. Accordingly, the CBA model of a mining project needs to be expended so as to include external costs and benefits to various stakeholders.
Using various economic valuation tools and net present value calculations, it is possible to model the net social impact of each scenario of a mining project – i.e. the integrated net economic, social and environmental impact of the scenario, expressed in monetary values. This would involve assessing the economic value(s) of each positive and/or negative social and environmental impact. In other words, calculating the net social impact of a mining project is summarised in Box 2.7 as follows.
The external costs of mining relate to all the costs to stakeholders, at the local, regional, national and/or international level, of the social and environmental impacts identified in section 2.1.4 for ASM and section 2.2 for LSM. For instance, they include:
• Thoselinkedtolandandsoildegradationandpollution, ground and surface water pollution and depletion, air pollution as well as habitat, species and ecosystem loss and destruction;
• Mining-induced loss and degradation oflivelihoods, such as loss or degradation of small scale agriculture, grazing pasture and tourism; and
• Social costs increased health care costsand increased family and social breakdown (e.g. divorce, prostitution, child labour, intra and inter community conflicts, community-company conflicts).
17
Box 2.7 Basic accounting framework for
assessing the net social impact of a mine
Net social impact of mine = Mine profitability (A) + External benefits to stakeholders (B) – External costs to society (C) = A + B - C
Mine profitability = A = net present value of revenues – net present value of internal costs
External benefits to stakeholders (positive externalities) = B = sum of net present value of direct, indirect and induced positive economic, social and environmental impacts
External costs to stakeholders (negative externalities) = C = sum of net present value of direct, indirect and induced negative economic, social and environmental impacts
Table 2.4 Production, GDP, and employment magnitude options
Magnitude Optiions Direct Impact Indirect/induced Impact (Scores)
Negative (0)
None/negligible (2)
Low (4)
Moderate (6)
High (8)
Very High (10)
A<0
B>0
A/B (=0) = B/C (=0)
A/B (>0)= B/C (>0)
A/B (>0)>B/C (>0)
A/B (=0)= B/C (=0)
A>0
B<0
The indirect/induced production/GDP/employment impact negative
The size of the indirect/induced production/GDP/employment impact is less than 25% of the size of the direct production/GDP/employment impact
The size of the indirect/induced production/GDP/employment impact is between 25% and 50% of the size of the direct production/GDP/employment impact
The size of the indirect/induced production/GDP/employment impact is between 50% and 100% of the size of the direct production/GDP/employment impact
The size of the indirect/induced production/GDP/employment impact is between 100% and 500% of the size of the direct production/GDP/employment impact
The size of the indirect/induced production/GDP/employment impact is greater than 500% of the size of the direct production/GDP/employment impact

With specific reference to environmental externalities, one may use the Total Economic Value of ecosystems (Figure 2.3) and the associated economic valuation tools to estimate use and non-use values of ecosystems (Figure 2.4).
However, it should be noted that using economic valuation techniques requires much care:
• The availability and quality of the underlyingnon-monetary data is of critical importance so as to generate robust economic values and models (see box 2.6);
18
Figure 2.4 Relationships between valuation methods and value types (TEEB, 2010)
Approach Method Value
Price-based Market prices Use value (direct and indirect) Avoided cost Use value Use value (direct and indirect)Market Cost-based Replacement cost Use value (direct and indirect) Valuation Mitigation/Restoration cost Use value (direct and indirect) Production- Production function approach Use value (indirect) based Factor income Use value (indirect)Revealed Preferance Travel cost method Direct(indirect) use value Hedonic pricing Use value (direct and indirect) Contingent valuation Use and non-use value Choice modelling/Conjoint analysis Use and non-use valueStated Preference Contingent ranking Use and non-use value Deliberative group valuation Use and non-use value
Figure 2.3 The Total Economic Value of ecosystems (TEEB, 2010)
Direct Use Value
e.g. consumption of seafood and fish, recreation and tourism
Indirect Use Value
e.g. consumption of sclimate
regulation, health effects due to
water purification
Option Value
e.g.potential fishing and
recreation options in the future
ExistenceValue
e.g. knowledge of the existence
of marine ecosystems
AltruisticValue
e.g. knowledge that marine
resources are used by the current generation
Bequest Value
e.g. knowledge of passing
marine resources to future
generations
Non-use ValueUse Value
Total Economic Value
Direct Market Valuation Revealed Preferances Stated Preferences
Benefit Transfer
Market Prices
Production Function
Averting Behavior
Hedonic Pricing
Travel Cost
Contingent Valuation
Choice Modelling

19
Box 2.8 The development of a cost-benefit analysis of mining sites in Mongolia (UNEP, 2012b)
Project background and aims
Despite the continuous environmental policy reform since the early 1990s, Mongolia’s environment is under considerable pressure from various threats, in particular livestock land use practices, mining development, hunting, rapidurbanexpansionandclimatechange.Thesecondphaseof the ‘StrengtheningEnvironmentalGovernance in Mongolia’ project is funded by the Government of Mongolia, UNDP, UNEP and the Australian Agency for International Development (AusAID). It aims to assist the Government of Mongolia to achieve its objective to “improve consistency of policies for protection, proper use and rehabilitation of natural wealth; make transparent and accessible information related to nature and the environment, and; increase public participation and monitoring in the protection of nature”. It will run for three years with a budget of US$1.5 million.
The second phase of the project is built on the results and recommendations of the first phase. It has 3 components: (1) Streamlining and strengthening of Mongolia’s environmental legislative framework; (2) Strengthening environmental mainstreaming mechanisms and (3) Strengthening capacity of NGOs/CSOs to engage in environmental governance processes. The cost-benefit analysis of the mining sector, funded by the Australian Government, is part of the second component: Strengthening environmental mainstreaming mechanisms.
The development of the methodology of the cost-benefit analysis started in 2011 and was tested with available data. A team of international (environmental economist, mining experts) and national consultants (economist, mining expert, environmental and social experts) was recruited. The team started by reviewing which data is currently available to carry out this type of work and analysing which policies are in place related to the scope of the study. Based on this initial review, the team designed the basic model for the analysis.
The CBA excel spreadsheet model
The project is believed to have just been completed, though no final report has been to the public. The project involved developing a rigorous and innovative methodology to measure, model and value the impacts of mining on the physical and social environment. The approach followed was to design a model based on Excel, using data generated from the mining sector. The Excel-based model consists of linked spreadsheets. The basic operating module consists of four spreadsheets:
• Benefits to the Mine;
• Costs to the Mine;
• Benefits to the physical and social environment;
• Costs to the physical and social environment.
The choice of Excel over other software was based on its widespread and easy use. No additional software would have to be purchased and no additional training would have to be carried out. The model in its initial design, compares benefits streams, both direct and indirect (or tangible and intangible) and costs streams, both direct and indirect (or tangible and intangible) in one master spreadsheet. By cascading several Master Spreadsheets laterally the CBA of several mines can be aggregated. By cascading several Master Spreadsheets vertically a comparison can be made between local and regional CBA values.
Besides, the model allows input values to be variable so that “what-if” scenarios can be played out and the impact of assigning costs and benefits to different stakeholders observed. By projecting into the future, the model can show the difference in cost between the current plan, called Business as Usual or BAU and a sustainable mining plan which manages mining activity to reduce environmental and social costs associated with mining, called Sustainable Ecosystem Management or SEM.
Key lessons learned and the way forward
Major lessons learnt related to data availability. There is a large amount of cost data on mining activities but very little on environmental damages and hardly any on negative social impacts. Besides, Information on environmental benefits from mining was very scarce as well and information on social benefits remained limited to financial data. In a project workshop, three separate organizations asked for permission to use the model. A recurring comment made by many parties was that the main issues of concern are social and environmental impacts. It was recommended that cognizance be taken of these comments and that social issues are given more prominence in the future.
Nonetheless, the general interest in the research and its innovative methodology, reflect the relevance of the work. It proved to be an assignment that generated high interest among international and national experts, in particular because this type of studies is still an emerging concept around the world. Besides further testing and fine-tuning the existing model, clear recommendations need to be given to the Mongolian government to review existing data collection systems at the local and national level, to avail a greater pool of existing data for future studies. As Mongolia still has a lot of strategic decisions to make as regards to mining, this can be become an important tool for improved decision-making in the future.

20
• Thevalueofexternalitiescanvarysignificantly,depending in the economic valuation tool used, local site conditions and the changing perceptions of stakeholders. It can also be highly sensitive to changes in interest rates, hence the need for sensitivity analysis of the models;
• Monetary valuesof social and environmentalimpacts are often much lower than economic impacts due to a combination of factors. Therefore, monetary values cannot be the sole basis for decision-making, hence the need to refer to ethics, laws and regulations as well as international best practices;
• Makinguseofinternationalbestpracticesandstandards can significantly increase a project’s social and environmental costs (e.g. IFC 2012 performance standards on involuntary resettlement and no-net-loss of biodiversity9).
9 Accessed on December 20, 2013:http://www.ifc.org/wps/wcm/connect/Topics_Ext_Content/IFC_External_Corporate_Site/IFC+Sustainabil i ty/Sustainabil i ty+Framework/Sustainability+Framework+-+2012/Performance+Standards+and+Guidance+Notes+2012/
Accordingly, one needs to emphasise that the use of economic models for externality valuation should be seen as one set of tools among many aimed at promoting sustainable and accountable mining practices. The actual results of the CBA are not end in themselves. The aims should be to generate discussions and secure the engagement of all key stakeholders in a long-term process of impact monitoring, economic valuation, compliance verification and information disclosure to all parties.

3. THE KARAMOJA REGION – STATUS QUO
Various strategies have been adopted in the past to address insecurity, resolve conflict and increase development opportunities for the people of Karamoja. Some successes have been registered, but huge challenges still remain. At the forefront are poverty and development challenges. In many areas, people have lost their assets and are trapped in multidimensional intergenerational poverty. Karamoja exhibits the Uganda’s lowest human development indicators, and people in Northern Uganda face the lowest probability of living to the age of 40, the highest illiteracy rate and the highest rate of children underweight for their age (UNDP, 2007). The majority of the population in Northern Uganda is now young, with little memory of living outside of camps. Many live in households headed by females and the majority have almost no assets. In Karamoja, livelihoods are transitioning more and more away from pastoralism, and some people are migrating further and often permanently, seeking work with strangers or in urban areas where they often face persecution as well as discrimination.
The government, aid agencies and the people themselves are making efforts to address these issues and build their livelihoods. The current National Development Plan (NDP) (2010/11–2010/45) explicitly recognises the need to integrate both Northern Uganda and Karamoja into the mainstream development of the country (Fergusson et al., 2010). A series of agricultural and food security programmes are being run, including such innovations as farmer field schools and
21
It is very important to create a multi-stakeholder forum to enhance transparency within the sector. The consultative workshop in Karamoja brought together different actors who were able to share and clarify a number of issues.
3.1 Improved security but persisting human development challenges
The Karamoja region of north eastern Uganda is one of the most marginalised parts of the country. For decades, it has suffered high levels of conflict and insecurity (between 30 and 90 % of the population was displaced in some sub-regions), alongside low levels of development and serious challenges to individual well-being (Fergusson et al., 2010). Apart from being affected at certain points by the conflict between the Lord’s Resistance Army (LRA) and the Government of Uganda, groups living in Karamoja have also been involved in cycles of cattle raiding and counter-raiding, sometimes involving pastoralist or semi-pastoralist groups living across the border in Kenya and Sudan.
Traditionally, men and boys were the most common targets of attack, as they are responsible for the community’s livestock. However, these new sorts of attacks are increasingly targeted at households and non-livestock assets. The most vulnerable populations are typically women, children and the elderly, given their limited protection capacities. As a consequence of porous borders, limited regulation and extensive conflict elsewhere in the region, small arms appear to be prolific, with between 30,000 and 160,000 illegal arms (Mkutu, 2008). According to Akabwai and Ateyo (2007), the possession of weapons has become the main determinant of authority, rather than age or social status.

22
Figure 3.1 Seasonal livelihood calendar of for the pastoral central and southern Karamoja livelihood Zone (FEG – FAO, 2010)
Figure 3.2 Seasonal livelihood calendar of for the agro-pastoral livelihood zone (August 2008 – Jully 2009) (FEG – FAO, 2010)
Rainy seasons
Livestock
Crops
Other
Jan Feb Mar Apr May Jun Jul Aug Sep Oct Nov Dec Dry Wet Dry
Livestock salesBirthsConceptionMilk ProductionLivestock raidsLivestock migrationLivestock diseases
PlantingWeedingHarvestConsumption of harvest
Charcoal/firewoodHoney productionLabour migrationWild food consumptionHuman diseaseFood purchaseHunger season
peak low
throughout the year with erratic peaks
back home grazing around areas of origin away from homelow lowhigh
green
peak lowlowhigh
fruits/nuts/hunting wild vegetables and white antslow lowhigh
Rainy seasons
Livestock
Other
Peak livestock salesPeak milk productionLivestock diseases
Legend LP = Land Prep P = Planting W = Weeding GC = Green Consumption H = Harvest
CropsSorghumMaizeMilletBeansSesameGround nutsPeak crop sales
Grass SalesCharcoal/firewoodPole cutting/brick makingCasual labour peakWild food consumptionHuman disease
Jan Feb Mar Apr May Jun Jul Aug Sep Oct Nov Dec
Hunger season/food purchase
low lowhigh
Dry Wet WetDry spells Dry
LP
LP
LP
LP
LP
LP
P
P
P
P
P
P
P
P
LP/P W
W
WW
W
W
W
WW
GC
GC/H
GC/H
GC/H
GC/H
H
H
H
H
H
HH
H
H
peak low
Wild vegetables

At present, customary tenure in Karamoja is characterised along four lines of sub-tenures: While the grazing lands and the shrine areas considered communal, arable land and land used for homesteads, where manyattas are constructed, are considered to be individualized customary. Within the communal areas, authority rests at two tiers, the elders, whose position derives from the initiation of age-sets and groups, and the kraal commanders whose authority is based on the ability to predict likely adversity-related diseases or raids. On individual customary land, the family heads hold conclusive rights with authority to transact by way of sale, share-cropping or renting out and to transmit through inheritance or sub-division. Heads of household are also charged with the observance the rights to access for nucleus and extended family members.
Alienation of customary tenure into registered form, mostly in leasehold, is still limited to gazetted urban centres and town councils. Whereas the Land Act 1998 and the Constitution 1995 provide avenues for obtaining Certificates of Customary Ownership and communal holding of land under Communal Land Associations, both avenues have not been utilised in Karamoja, except for the likely benefits that will arise from the pilot titling project of Uganda Land Alliance in Nabwal. Rugadya et al. (2010) argue that this is due to low levels of awareness of the existence of these options and the non-staffing of district land office which would support such processes.
Communities perceive several threats to tenure security in the region, including but not limited to mining interests, often undertaken without community knowledge and involvement, the unknown status of conservation areas (due to recent major changes in boundaries throughout Karamoja) and increasing land sales (especially in urban areas). Additionally, as a disarmament strategy, GoU is setting up protected kraals to safeguard cattle from being rustled: Grass quality, fertility and other range resources have been degraded and eroded in such locations.
Four key issues can be mentioned as regards to the status of protected areas (Wildlife and Forestry) in Karamoja:
• Approximately 53.8% of land area (wildlifeconservation areas) was de-gazetted in 2002 and was reverted to communities for access, use and ownership. Yet, this information is far from being widely known by Karamojongs. Elites have used it for personal interests, for instance by favouring entities investing in either tourism, mining or commercial agriculture ventures.
livestock extension. Aid agencies are shifting from food aid programmes towards the construction of productive assets through food for work and increased local purchase of relief food. There are also a number of conflict prevention programmes and alternative income generation projects.
However, an increasing number of programmes only target beneficiaries who have assets and can take advantage of opportunities, hence discarding the most vulnerable populations who, for one reason or another, are unable to seize these opportunities. Yet, the inability of populations, and especially young men, to engage in livelihood recovery is a directresultofpastconflicts,‘reliefdependency’oralcoholusageleadingto‘maleidleness’.
Furthermore, while the GoU acknowledges the need for better access to basic health care, education and water and sanitation, as well as social protection, policies have yet to be translated into practice. Though the government has been creating more districts in the name of basic service delivery, many suggest that this strategy is linked more to political patronage. For instance, social protection programmes are being piloted in only two districts in the Greater North, and are mostly funded by donors. As argued by Fergusson et al. (2010), many government policies are in fact undermining household coping capacities, including the impounding of cattle, the nationalisation of key resources and the promotion of sedentarisation via agriculture. They are not adapted to harsh semi-arid environments characterised by resource scarcity and limited livelihood opportunities.
3.2 Colonial legacies of land tenure and new challenges
Forms of tenure in Uganda are an everlasting mark of colonial legacy which selectively maintained customary practices of use and access in specific regions while opportunistically introducing registered tenures in areas where higher stakes for political influence could be garnered on the basis of control over land resources (Rugadya et al., 2010). Karamoja region happened to be arid and uninviting for schemes of individualised use of land given the transhumance lifestyle dictated by the harsh climatic condition and unreliable rainfall.
Throughout the colonial period, Karamoja was taken as an extensive area of land devoted to conservation of wildlife and the preservation of biodiversity species. This perception meant the traditional systems of land use and management under customary tenure thrived outside of the legal regime and dedicated themselves to opportunistic harvesting of range resources to sustain herding, with limited regard for the isles of conservation that statutory frameworks embraced.
23

24
• Even though communities are entitled tobenefits from utilisation and investment in wildlife conservation areas in their region by law (UWA Act), they are not sufficiently organised or positioned in terms of information, capacity and opportunity to engage the Uganda Wildlife Authority (UWA) on such matters.
• Due to insecurity in the region,UWAhas yetto demarcate the changes on the ground and fully communicate them to beneficiary communities, giving rise to an information gap as regards to the status of land under conservation in Karamoja. Communities are thus unable to distinguish de-gazetted lands that have been returned to them from lands still under conservation.
• Thestatusof the19CentralForestReservescovering 11.6% of the land areas in Karamoja is not likely to be reviewed, readjusted or changed in the near future. This is because of their value as water catchment areas. The National Forestry Authority has made a policy shift to collaborative management involving communities but implementation has yet to start on the ground.
All of these points contribute to tenure uncertainty, insecurity and/or conflict. As mining activities increase in Karamoja, further tenure challenges are more than likely to materialise if no pro-active steps are taken towards integrated land-use planning.
Figure 3.3 Map of protected areas in Karamoja in 2010

3.3 Mining situation in Uganda and Karamoja
3.3.1 Brief history of mining in Uganda
The mining sector in Uganda reached peak levels in the 1950s and 1960s when the industry accounted for up to 30% of Uganda’s export earnings10. Yet, political and economic instability experienced in the country in the 70s led the sector to decline to its present level of contributing only about 1% of the Growth Domestic Product (GDP).
10 Investing in Uganda’s Mineral Sector. Accessed on December 10, 2013: http://newscastmedia.com/uganda-minerals.pdf
Marked by a favorable business climate, the period after 1986 saw a number of mining companies taking up mining licences, their numbers increasing ever since. In 1990, there were under 50 exploration and mining licences issued. By the end of 2000, 136 Exclusive Prospecting Licences, 95 Location Licenses, and 15 Mining Leases had been issued. These licences are concentrated in southwest and southeast Uganda due to the lack of quality geological data for northern Uganda, including Karamoja.
Today, the mining and quarrying industry is growing at a rate of about 11% per annum. Limestone mined for the production of cement and lime caters for local market needs, while aggregate, gravel and small quantities of gold, tin and tungsten concentrates are exported.
25
Figure 3.4 Metallic mineral occurrences in Uganda*
* Investing in Uganda’s Mineral Sector. Accessed on December 10, 2013: http://newscastmedia.com/uganda-minerals.pdf

3.3.2 Definitions and conceptualization of LSM and ASM in Karamoja
Large-Scale Mining (LSM) in Uganda, both in terms of the legal framework and relative scale of activities, refers to companies holding mineral rights, especially Mining Leases (Hinton et al., 2011). For instance, Tororo Cement Limited (TCL) is considered large scale because it holds a Mining Lease in the Tapach sub-county of Moroto district. However, while TCL’s operations do have some mechanised dimensions (trucks, formal office and computers), its mining activities show over-reliance on local manual labour (limestone crushing, truck loading) and its scale of activities are low compared to internationally known large scale mining. Indeed, large scale mines around the World often process ore at rates of several hundred thousand metric tons per day, while the extraction rate on the TCL mining lease in Tapach sub-county is on the order of 1 200 tons per day (when 40 trucks per day are operating). In other words, by international standards, LSM in Karamoja can be referred to as small-scale mechanized operations.
Artisanal Small-scale Mining (ASM), in Uganda, refers to mining activities that are predominantly informally organized and un-mechanised. Because Uganda’s mining legislation does not distinguish between artisanal and small-scale mining, the two concepts have been merged in this report. In addition, ASM in Uganda typically involves hazardous working conditions, child labour, and insecurity/violence (e.g. Ngabiirwe et al., 2012). In Karamoja, ASM mining is essentially informal and nomadic given there is constant in- and out-flux of people at various ASM sites. Most artisanal miners are unaware of legal requirements and provisions for licensing. Yet, it appears that those who are aware of the latter would still prefer to work outside of the current mining legislative framework given the costs of registration, the uncertainties related to finding a viable mineral resource and the apparent lack of benefits for doing so (see section 4.2.3).
3.3.3 The mining policy and legal regime in Uganda
Mining in Uganda is governed by the National Mineral Policy of 200011, the Mining Act of 2003 as well as the Mining Regulations 2004a (rules) and Mining Regulations 2004b (First Schedule of the Mining Act). Because mining activities involve access to land, soil and water resources as well
11 Ministry of Energy and Mineral Development, 2000. The Mineral Policy of Uganda.
as generate various social and environmental impacts, it must be conducted in accordance with several other pieces of legislation, including but not limited to the National Environment Management Act, the National Forestry and Tree Planting Act, the Water Act (Cap. 157), the Wildlife Act (Cap.200 - particularly Sections 15 & 16), the Town and Country Planning Act (Cap.246), the Land Act (Cap.227), the Local Government Act (Cap. 243 - particularly the Second Schedule) and the Investment Code Act (Cap. 92). The resulting legal framework aims to be in-line with international best practice and enable Uganda to compete for investment by creating liberalised, stable and conducive conditions to mining (UNEP, 2012).
The National Mineral Policy
Under the 2000 Mineral Policy, the Government of Uganda (GoU):
• Expects to receive fair value for its mineralresources and, through private sector investment, to obtain the transfer of skills, know-how and technology to nationals;
• Gives high priority to protection of theenvironment and avoidance of waste and misuse of its resources; and
• Recognizesthatpeoplelivingintheimmediatearea of mineral development will bear significant environmental and social costs and will therefore seek to ensure that regional development, compensatory development, employment preferences, and small business opportunities offset these inevitable costs for the local residents and communities.
The specific objectives of the Policy are to:
• Stimulate mining sector development bypromoting private sector participation;
• Ensure thatmineralwealth supports nationaleconomic and social development;
• Regularizeandimprovesmallscaleminingbylocal artisans;
• Minimizeandmitigatetheadversesocialandenvironmental impacts of mineral exploitation;
• Remove restrictive practices on womenparticipating in the mineral sector and protect children against mining hazards;
• Develop and strengthen local capacity formineral development; and
• Addvaluetomineraloresandincreasemineraltrade.
26

From an accountability and transparency perspective, it is important to note that Uganda does not comply with the project-by-project reporting requirements for disclosure of government revenues from natural resources of the Extractive Industries Transparency Initiative (EITI). Accordingly, Global Witness (2013) recommends that Uganda becomes an EITI candidate country as soon as possible, amends its Public Finance Bill to require extractive companies to publish the payments they make to the GoU and associated entities and harmonises the reporting requirements contained in the Public Finance Bill with those of the new US and EU requirements and the EITI, both for publication of government receipts and disclosure of payments by companies.
The Mining Act of 2003
The Mining Act provides for various mining licenses which can be acquired by an individual person, a group of persons or by a company intending to carry-out mining or trading of minerals. The Act obliges applicants for mineral rights to declare various key information, included their capital investment and human resources commitments, a map of the area being applied for, work plans, endorsement by the appropriate Chief Administrative Officer in presence of a witness of high moral standing (e.g. local leader such as local district chairperson or councillor). The key licenses provided in the law worth mentioning in the context of this study are detailed a follows.
Prospecting License (PL)
A Prospecting License (PL) enables the holder to prospect for minerals countrywide, except in areas where other licenses (for exploration or mining) have already been granted. It is not area specific, does not bestow exclusive rights, and is granted for one year only and is not renewable (i.e. a “new” PL must be obtained annually). A Prospecting License is a prerequisite to apply for any other type of licence (with the exception of that related to mineral dealing) and can be obtained through a simple application via the DepartmentofGeologicalSurveyandMines(‘DGSM’)in Entebbe at a cost of UGX 150 000 (approx. USD80).
While an individual holder of a PL must be Ugandan and must provide a copy of a valid identification (Passport, Voter’s Card, Driving Permit), a Company or Association must provide:
• Acertifiedcopyofthecompanycertificateofregistration,
• Certified copies of constitution of theAssociation or Company, and
• Anauthority letterendorsedbytheCompanyDirectors or Executive Committee of the Association.
Exploration License (EL)
Exploration Licenses are a mineral right granted for a maximum duration of seven years (initially three years, renewable for two terms of two years each) to enable the investor carry out conclusive exploration work. On each renewal, at least half of the license area is relinquished to enable other interested parties to explore the ground. The application process requires that the area of interest is available (i.e. not covered by an existing mineral right), and is granted on a first-come, first-serve basis determined by the application date and time of signature of the Chief Administrative Officer (CAO) of the District(s) where the area is located. Although an individual or company can legally obtain as many EL as it can afford, a single license can cover a maximum area of 500 km2. Given the cost of licenses and practical constraints in exploring such large areas, most exploration Licenses are much smaller. The key requirements for an EL include:
• Payment of preparation and registration feesamounting to UGX 650 000 (approx. USD 260);
• Payment of an annual rent of UGX 10 000(approx. USD 5) per km2 - For example, Jan Mangal Limited (JML) pays mineral rent of UGX 740 300 (approx. USD 296) for its EL 10001 (74.03 km2) and UGX 1 596 200 (approx. USD 638) for its EL 1121 (159.62 km2);
• Receiptsforpaymentofroyalties;
• Certified Certificate of Incorporation andCompany Constitution;
• Environmental Performance Bond – PayableCash or Bank Guarantee; and
• Beacon Erection Witness (Local Council I -LCI, Local Council III - LCIII, Area sub-county or district Councillor) or simply execution of Form II (application form for EL).
Many CAOs in Karamoja are concerned that, once they have signed the EL application form, they have little (if any) further engagement opportunity with exploration companies despite their interests in their progress, especially their production levels and royalty payments. From a transparency and accountability perspective, although local government engagement in the EL application process partly intended to improve information sharing, there seems to be little trickle down of this information to lower levels of local governments and communities. Yet, because many EL holders are engaged in buying minerals from ASM, some district oversight would be required.
27

Retention License (RL)
The License is granted exclusively to holders of an Exploration License when a mineral deposit has been identified in the exploration area but, due to adverse temporary market conditions (i.e. economic factors and other factors beyond the EL holder’s reasonable control), commercial exploitation of the deposit is not possible at the time. It is granted for a period of three years and is renewable for a single period not exceeding two years. The key requirements for an RL are:
• CompletionofFormIII(applicationforRL);
• Payment of preparation and registration feesamounting to UGX 450 000 (approx. USD 180);
• 1 year mineral rent of UGX 10 000 (approx.USD 4) per km2; and
• A Mineral feasibility study report, indicatingeconomic prospects as well as environmental impact mitigation plan and costs.
Location License (LL)
ASM licensing is provided for in the legal framework by way of a “Location License”, which pertains to “small scale operations”, that is prospecting or mining operations which do not involve expenditure in excess of UGX 10 000 000 (approx. 3 970 USD) or the use of specialized technology. Applicants must be individuals or association members that hold Ugandan citizenship or companies with at least 51% shares belonging to one or more Ugandans. The LL is exclusive, granted for a two-year period, renewable in two-year periods and the holder is obligated to declare production and engage in selling of minerals they have produced.
While the LL category is aimed at encouraging formalisation and legalisation of ASM, only a fraction of artisanal miners hold or work on LL. The procedure and requirements for obtaining and securing a LL is quite complex for local people in Karamoja:
• CompletionofFormIVatDGSMEntebbeandpayment of preparation and registration fees of UGX 450 000 (approx. USD 180);
• Mineralrentfor1yearatrateofUGX200000(approx. USD 80) per km2 applied for;
• Aprospectinglicense(approx.80USD)througha simple process at the DGSM in Entebbe;
• Witness for LL area boundary demarcatione.g. LC I or III chairperson, councillors, parish chiefs, etc.
• MiningPlanandReclamation(miningclosure)Plan: preparation of a Project Brief (5-10 pages addressing environmental issues) and a 1:50 000 map sheet of the area (with assistance usually costing between 75 and 420 USD);
• IncaseofaLLrelatingtoaWetlandorRiverbank a separate Letter of approval to work in wetland or river bank from the Directorate of Water Resources Management (DWRM);
• ObtainingaBankPaymentAdviceForm(BAF)from the DGSM, Entebbe (for payment of the above fees and mineral rent).
The relative complexity of this process may explain why LSM companies are the ones holding LL in Karamoja (e.g. African Minerals Limited at Katikekile).
Mining Lease (ML)
A ML is for mining operations involving substantial expenditure. It is granted for a minimum period of 8 years and a maximum not exceeding 21 years or the estimated life of the ore body to be mined – whichever is shorter – and is renewable for a period not exceeding 15 years. The requirements for application for a ML include:-
• Statementastothenumberoflandownersorlawful occupiers of land;
• Waterusepermits;
• Certificate of approval of the EnvironmentalImpact Assessment (EIA) by NEMA;
• Signature and stamp of CAO, at a cost ofbetween 25 and 100 USD;
• Map1ofscale1:50000andMap2ofscale1:10 000 of the ML;
• Technologicalreportonminingandprocessingtechniques;
• Mineralfeasibilitystudyreportandmineplan;
• Proofofownershipofsurfacerights;
• Payment of preparation and registration feesof UGX 2 050 000 (approx. USD 820).
• 1 yearMineralRent ofUGX10000 (approx.USD 4) per km2 applied for. For example, Tororo Cement Ltd pays UGX 200 200 (approx. USD 80) for a total area of 20.02 Km2 under ML4622 and UGX 518 000 (approx. USD 207) for a total area of 51.8 km2 under ML0593 in Moroto district.
• Statement on employment and training ofUgandan citizens;
• CompanyBusinessPlanincludingproductionprojections.
28

For purposes of trading in minerals, the following licenses provided under the Mining Act of 2003 must be acquired before indulging oneself in mineral trade namely:
• MineralDealer’sLicence (MDL):This isgivenout to non-miners who just buy from whoever is mining (i.e. middlemen). It allows buying and selling of minerals and lasts up to end of December in the year in which the licence is granted.
• Imports and Exports Permits: These areinstruments granted to holders of mineral rights and mineral dealer’s licences to monitor trade in minerals.
• Other mineral trade related Licences: Theseinclude the Jewellers Licence granted for fabrication of artefacts using precious minerals.
Compensation of surface rights
It is important to note that none of the aforementioned licences provides for the grabbing of land by LSM. No land can be purchased via the acquisition of any licence. However, mining activities can lead to restricted access to areas previously used for livestock grazing and ASM (among other ecosystem uses) as well as to ecosystem degradation (loss of soil and vegetation, water pollution). These opportunity costs (i.e. loss of livelihoods during and after mining) need and can be taken into account.
In Uganda, the Mining Act (2003) provides for“…fair and reasonable compensation for any disturbance of the rights of the owner or occupier; and for any damage done to the surface of the land by the holder’s operations; and shall on demand made by the owner of any crops, trees, buildings, or works damaged during the course of such operations, pay compensation for any crops, trees, buildings or works so damaged” (s.82(1)).Yet, the claim for compensation for disturbance of surface rights is only enforceable within 1 year of commencement of exploration and mining operations (s.82 (3)), which constitutes very limited time.
Furthermore, section 83 states that land owners can be compensated for their surface rights by way of direct negotiations with the company for payment of surface disturbance or remittances of the share of royalties (3%). Apparently, land owners cannot claim both, which is questionable12 and discussed further in Sections 4.1.1 and 5.1.
12 Payment for the surrendering of surface rights should aim to compensate for the opportunity costs of mining (i.e. loss of livelihoods within ML) while royalties can be understood as compensation for permanent loss of a non-renewable resource. These should thus be seen to be as complementary.
Surprisingly, the Law exempts mining companies to pay compensation for disturbances of surface rights for minerals located in government held lands such as protected areas including Central Forest Reserves, National Parks and Wildlife Reserves. One can argue that this works against the purpose of protected areas – i.e. areas strictly declared for biodiversity conservation purposes so that development threats such as that of mining are prohibited. This point is discussed further in Section 5.1.
3.3.4 The mineral taxation regime in Uganda
Ugandan fiscal policy
The GoU uses fiscal policy to (i) raise revenues by implementing a “fair and equitable” system to yield financial benefits from economic activities, and (ii) guide taxpayer behaviour through “command and control” mechanisms. The fiscal and monetary policies of the GoU are usually developed by the Ministry of Finance Planning and Economic Development (MoFPED) in concert with affected government agencies. In the case of the mining sector, important factors determining fiscal measures include:
• Regionalharmonizationofroyaltiesandtaxes(a factor that can reduce cross-border illicit trade);
• International competitiveness in order toattract foreign investors;
• Licensingandmaintenancecosts(particularlyin the case of ASM and traders); and
• Financial benefit sharing, typically calling forgreater benefits to areas most affected by mining.
Regarding LSM, the GoU appreciates the unique characteristics of this activity: i.e. high level of capital expenditures (e.g. specialised machinery, trucks), often resulting in deferred profitability for several years (in some cases, a decade or more), and potential concomitant investments in infrastructure (roads, electricity, access to water) that can provide broader social benefits to surrounding communities. As a consequence, DGSM has indicated that special tax rates can be applied to the mining sector as investment incentives in specified circumstances (e.g. zero import tax on mining equipment) or for specific projects (e.g. through Mineral Development Agreements). For example, the Minister may waive a royalty with the approval of Cabinet, in the interest of mineral exploitation and production.
29

Royalties
The justification for payment of a royalty, in addition to other taxes and fees that most companies pay in other sectors (e.g. corporate tax, income tax), is that it provides some form of compensation for permanent loss of a non-renewable resource and it constitutes revenue in return for permission to mine. Rates for royalties paid on mineral production vary according to the mineral commodity as follows: 3% for precious and base metals (based on price given by international metal exchanges, which fluctuates daily), 5% for precious stones and UGX 5 000 per tonne for limestone or marble13. Buying, selling or exporting minerals also requires a royalty payment14. Royalties on mineral production are shared among Central Government (80%), District Local Government in areas where the mineral was produced (10%), the sub-county local government (7%) and land owners or lawful occupiers of the land (3%) where the mine is located15.
Despite some challenges (e.g. tax evasion through the under-reporting of mineral production by LSM), royalty payments are progressively becoming institutionalised in Karamoja. For instance, for the period from January to June 2013, Moroto District received UGX 15 683 281 (approx. USD 6 273) (10% of royalties), Tapach sub-county UGX 10 978 297 (approx. USD 4 391) (7%) and Katikekile land owners UGX 4 704 984 (approx. USD 1 881) (3%).
Mechanisms for payment and collection of royalties
DGSM compiles verified production statistics upon which basis the DGSM makes an assessment of the mineral royalty due from every mineral right holder licensed to exploit and/or process minerals from their ore16. These statistics are compiled on a monthly basis. The DGSM then grants the mineral right holder(s) a Bank Payment Advice Form (BPAF) of the Uganda Revenue Authority (URA) whose
13 MEMD Royalty Assessment Review Statement of 2012.14 The calculation of fees for import/export are shown in Reg.
72 of the Mining Regulations 2004.15 Section 98 of Mining Act, 2003.16 Some local government officials, including from Karamoja,
have expressed interest to make royalty collections on a truck-by-truck or gram-by-gram basis. This has been criticised as financially impractical to administer, besides falling outside of their mandate. When informed of the estimated production value of informal ASM in his area, one CAO enthusiastically voiced an interest in policing the situation to collect taxes on the ground. While a coordinated approach is certainly needed to ensure that production quantities are accurately reported and that the mineral trade is formalized, royalty collection by local government officials can pose significant risks for ASM (exploitation, corruption).
mandate is to collect Non Tax Revenues (NTR) accruing from royalties. When NTR is collected, URA retains a 80% share of the NTR collected (for the GoU) and remits 20% to the Ministry of Energy and Mineral Development (MEMD) which maintains a record at the DGSM of the royalty actually paid as evidenced by URA payment receipts. MEMD subsequently publishes the royalties due to each mining district in the print media and requests Accounting Officers of the different Local Governments to collect their share (17%) of the royalty collected from mineral exploitation in their respective districts via MoFPED. Owners or lawful occupiers of land subject to mineral rights are also notified to collect their share (3%) of the royalty due from the respective districts17.
Other Taxes and Charges
Like any other Ugandan business, mining companies have to pay income tax based on taxable profits. The income tax rate ranges from 25% to 45%, depending on the profitability of the venture. In addition, companies also pay a number of other taxes and fees:
• AnnualMineralRentwhichisbasedonthesizeof a license (UGX 10 000/km2/year for an EL or ML; that is USD 4/km2/year) and UGX 200 000 (USD 80/km2/year) for a LL;
• PersonalIncomeTaxforemployees,includingNSSF Contribution;
• Withholding Taxes on interest, dividends,royalties and services;
• StampDutyon legaldocuments (e.g.districtfees for endorsing application forms, which typically range between 50 000 and 150 000 UGX);
• AnyApplicableLandandBuildingTa
• xes related to the area where mines areconstructed;
• Levies,taxes,chargesanddutiesimposedbyLocal Government as approved by the Central Government.
17 Though there have been attempts by some communities to organise themselves and register as associations so as formalise their land ownership and hence be easily identified for royalty payment purposes, the process has often been hijacked by a few elite community members, hence the need for more engagement and mobilisation of the affected communities.
30

While some Local Governments in Karamoja are currently charging fees or levies (particularly on limestone producers) and others have expressed interest in revenue collection (e.g. royalties from artisanal gold miners), many of these fees appear not to be in-line with Central Government approved fees, thereby resulting in a form of “double taxation” and hence potentially requiring harmonisation between Central and Local Government tax collection practices.
Collection and distribution of mining tax revenues
Tax revenue sharing describes arrangements whereby minerals taxes collected by Central Government are partially redistributed to the Local Governments (and in some cases land owners) in the areas where mining occurs. Revenue sharing arrangements are typically structured with recognition that (i) communities around mining areas bear the brunt of environmental impacts and social disturbances (e.g. HIV/AIDS, increased price of goods, etc.) and that (ii) such revenues are also needed to respond to national development priorities. In an effort to increase local benefits, MEMD officials have indicated that a revision to this distribution arrangement is currently underway wherein Local Government royalties shall, in future, be allocated differently, with 10% going to the District Government and 7% to the Sub-county where mining activities are located (rather than 17% to the District as previously administered).
Interests in an increased royalty share by Local Governments in Karamoja are certainly well founded, particularly as the low development status of the region is partly attributed to the limited ability of Local Governments to provide essential services. However, in most countries that are now instituting such revenue sharing arrangements (e.g. Ghana, Tanzania, Sierra Leone) many problems have been encountered, most of which relate to local revenue management and translating returned royalties to development on the ground (Hinton and Levin, 2010).
Concerns over appropriate, transparent and accountable use of mineral revenues do not seem to be limited to other countries and many stakeholders in Karamoja expressed scepticism of receiving any benefits from royalty transfers. In the case of Moroto District, one official met after the Second Workshop suggested the amount received was “too little” to bother considering separate expenditure guidelines and reporting requirements.
In light of increased mine development in Karamoja and around the country, MEMD has nevertheless stated their plans to institute requirements for Local Governments to use districts specifically for local development activities (e.g. boreholes, roads, health care facilities) but one DGSM official has further suggested that guidelines, procedures and training in the use of royalties is also needed to ensure these directives are actually implemented transparently and effectively.
In any event, royalty collection from the Consolidated Fund by Local Governments (via MoFPED and URA) is a commonly voiced challenge. This is undoubtedly even more difficult for land owners, particularly given that most Karamojongs lack legal land titles. In discussions with MEMD, officials stated the intent of GoU to disburse the 3% owing to land owners to Sub-county Governments holding documents affirming that they hold the communal lands in public trust. However, this seems to be in contradiction with views of many Karamojongs, many of whom have sought Certificates of Customary Ownership (approved at District levels but seemingly confounded by central government bureaucracy) while, interestingly, private ownership (e.g. freehold title) also seems to be an increasingly desired option for many households. In fact, many individuals in both communities and government in Abim, Kaabong and Moroto indicated that, despite the absence of title or certificates, “the (individual) owner is known”. MEMD is informed of the situation and have expressed intent to revise their original intentions for disbursements to Sub-counties.
As a consequence, little disbursement to land owners in Karamoja have been made to date; which has resulted in a delay in benefits to those most affected by mining but seems appropriate until the situation is rectified. Resolution of issues concerning both land owners and Local Government would benefit all stakeholders including those in the private sector. While artisanal miners desperately need services from Local Government and royalty payments can provide a means to partly finance such efforts, companies also face high expectations to directly contribute to local development. Some companies, such as DAO Marble Limited (DML), explicitly recognize that local communities need to benefit from mining (directly or indirectly) so that they avoid facing stakeholder conflicts and pressures in the course of their activities.
31

3.3.5 Environmental and social regulations applicable to mining in Uganda
Labour conditions, child labour, gender inequalities and profit sharing for ASM
Labour conditions theoretically are regulated under the outdated and largely unknown Occupational Safety and Health in Mines Act (1964), and more commonly governed under more recent legislation (UNEP, 2012). This includes the Employment Act (2006), which under Section 5(1) requires that no person shall use or assist any other person in using forced or compulsory labour, and Section 32(1) requires that a child under the age of 12 years shall not be employed in any business, undertaking, or workplace.
Most relevant legislation refers to the responsibilities of an employer for its employees, and related provisions are not typically relevant to most ASGM scenarios as no “employees” exist, per se, i.e. miners are working in small groups or teams rather than for a company. For instance, the Employment Act (2006) outlines terms of deductions for missed work, providing for a minimum one day off per week and a maximum work week of 48 hours. Intensive support for organization of ASM specific regulations are needed to achieve any measure of compliance in these respects. In those instances where artisanal miners work under a company-held Location License, most are paid via product-purchase arrangements (e.g. gold or limestone is simply sold to the licence holder in exchange for “access” to the site) rather than through formal employment; so that application of relevant labour provisions is woefully lacking. Legislation which requires attention includes:
• The Occupational Safety and Health Act(2006) which provides for the prevention and protection of persons at all workplaces from injury, disease, death, and damage to property. Its provisions extend to the self‐employed and any other persons that may be legitimately present in the workplace. Employers are responsible for safety and health measures of employees, the protection of workers from adverse weather conditions, a clean, safe and healthy work environment, sanitary conveniences, washing facilities, first Aid and facilities for meals, as well as safe access to the workplaces and safe work practices.
• The Workers’ Compensation Act (2000)requires compensation to be paid to a worker who has been injured or who has acquired an occupational disease or has been harmed in any way in the course of his/her work. Compensation of 60 months earnings for a fatality or for permanent total incapacity is specified in Sections 5, 6, and 7.
Among multiple objectives, the Mineral Policy (2001) explicitly seeks: “To remove restrictive practices on women’s participation in the minerals sector and protect children against mining hazards.” Yet, in reality, less than 5% of persons employed in the formal mining sector are women while women’s engagement ranges between 25% to up to 90% at some sites in the case of informal ASM. Other than these legal provisions, gender is not adequately mainstreamed in the mining policy and legislation (UNEP, 2012). Numerous entry points where explicit legal reforms to promote gender equity could be introduced with respect to: licensing requirements, extension service delivery (and its decentralisation), consultation, compensation, and distribution of benefits among others.
Finally, there is no requirement specific to profit sharing within ASM producer groups are specified in the legal framework. On the ground, profits are typically shared within producer groups equally (e.g. if ASM is conducted in “teams” of 5-15 miners) or retained by individual miners or family units. In the case of the latter, women often turn over gold or earnings to their husbands. In some case, a site will pay a percentage (e.g. 10%) or, more often, a flat fee to the landowner.
EIA-related requirements and procedures – EIA scope and report content
The EIA Regulations of 1998 require that the content of an EIA report includes a description of the segment of the environment that will be affected including specific information (figures and indicators) necessary for identifying and assessing the environmental effects of the said mining activity. The report should provide detailed list of material inputs as well as the potential environmental effects of the latter. The EIA should also detail an economic analysis of the mining activity (e.g. inputs costs including machinery costs, operational expenditures, environmental costs, productions levels, profit margins, etc.) as well as the products and by-products of mining. The EIA should detail environmental effects of mining per se including the direct, indirect, cumulative, short-term and long-term effects and possible alternatives.
32

EIA-related requirements and procedures – stakeholder consultation and access to information
According to Regulation 29 of the EIA Regulations of 1998 and subject to article 41 of the Constitution and subsection (3) of section 85 of the NEMA Act, the following EIA-related documents are declared public documents that can be accessed by those who desire to read them (as per the Access to Information Act of 200518): project briefs including for mining companies, environmental impact review reports, environmental impact evaluation reports, environmental impact statement, terms of reference, public comments, the report of the presiding officer at a public hearing or any other information submitted to the Executive Director or Technical Committee of NEMA including submitted EIAs that are not yet approved or are under review. Yet, the difficulty of accessing any of the aforementioned documents during this study cannot be overemphasized19. There is no reliable resource centre in Uganda which enables free and easy access to such information.
The EIA Regulations further oblige any company to take all measures necessary to consult the people in the communities to be affected by mining during the EIA process. Companies are ordered to announce their intended mining activity, its impacts (negative and positive) through media houses in a local language for at least 2 weeks; thereafter hold meeting with the affected communities to explain the mining activity and its effects; as well as ensure that the venues and times of the meetings are convenient for the local communities as advised by LCs or Elders’ Councils in the case of the Karamoja region.
Upon submission of the EIA report by a mining company, the National Environmental Authority (‘NEMA’) is ordered to place the document tothe Lead Agency for comments. After obtaining comments from the Lead Agency, the Executive
18 The Access to Information Act (2005) provides that“(1) Every citizen has a right of access to information and records in the possession of the State or any public body, except where the release of the information is likely to prejudice the security or sovereignty of the State or interfere with the right to the privacy of any other person” (s. 5.1) and that “A person’s right of access is, subject to this Act, not affected by (a) any reason the person gives for requesting access; or (b) the information officer’s belief as to what the person’s reasons are for requesting access”.
19 This is largely due to lack of knowledge and cooperation from stakeholders, including NEMA representatives.
Director of NEMA is ordered within ten days to invite the public in a newspaper to provide written comments on the EIA. The invitation must provide a summary of the EIA report for which the public is expected to comment including the title and nature of the project, its location, the anticipated negative and beneficial impacts as well as proposed measures for the mitigation of the negative impacts of mining. The EIA Regulations further orders mandatory involvement of local communities likely to be most affected by the project to create awareness, seek their opinions and/or simply to allay their fears on the project. The law provides that this process should extend for at least 21 days and should conclude with the production of a collective document written by the community or, alternatively, of comments written by an individual from the community. Where the proposed project (e.g. mining) may general social conflicts, is surrounded by controversy or has trans-boundary impacts, NEMA is obliged to hold public hearings on the project.
EIA-related requirements and procedures – The Polluter Pays Principle Implementation Tools20
A. Performance Bonds– Companies that have significant adverse impacts on the environment may be required to deposit bonds as security for good environmental practice. According to the NEMA Environmental Economic Guidelines for Uganda of 2000, environmental performance bonds (EPBs) are economic instruments intended to shift responsibility for controlling pollution, monitoring and enforcement to individual producers and consumers who are charged in advance for the potential damage. In Uganda, EPBs are by law expected to be applied to land reclamation after mining activities. EPBs are essentially a deposit-refund system, because the amounts deposited with a performance bond can be refunded only when the affected mining company fulfils particular obligations, confirmed and approved by the supervising government agency (DGSM and NEMA). EPB guarantee sufficient funds, in the form of a bond or security, to cover the cost of rehabilitation in the event of failure of land reclamation upon closure of mines. The value of EPB in Uganda is determined by an estimation of the total cost of reclamation of mined land based on a
20 UNEP Project “Capacity building for strengthening legislation and institutions for the implementation of Rio means, focusing on poverty alleviation (MEAS and Law)” – Proceedings of the training course on environmental inspection, investigation and prosecution of environmental crimes in Uganda. Held at Sunset Hotel, 18 – 22 February 2007 Jinja, Uganda.
33

mining company’s Environmental Restoration Plan normally required to be attached on the application forms for exploration, location and mining licenses. Therefore, the EPB value is an estimate of all the expenses required for rehabilitation of the mining area including waste dumps, tailings storage facilities, stockpile areas, back filled pits, hardstand areas, plant sites, haul roads, accommodation areas and the safety zone21. Usually, the bond value is estimated for the first two years of operation as indicated in the Company’s Work Plan. However, the value of environmental bond may be progressively revised upwards or downwards annually by the Minister of Energy and Mineral Development by a statutory instrument depending on the whether the land area affected by mining increases or decreases. The bond is unconditional continuing liability and has no termination date even after the expiry of mineral rights for which it was executed. A Bond will only be retired upon satisfaction by the DGSM that the mining company has fulfilled all its obligations for land reclamation of the mined area and upon submission of a certificate of compliance issued by NEMA.
B. Environmental Improvement Notice - Improvement Notices may be issued by environmental inspectors under section 80(1)(i) of the National Environment Act Cap. 153 to require a person to cease activities deleterious to the environment.
C. Environmental Restoration Orders - Restoration Orders are issued under section 67 of Cap. 153 requiring a person to restore the environment, or to prevent a person from harming the environment. They may award compensation for harm done to the environment or/and levy a charge for restoration undertaken. Restoration Orders are issued by NEMA or a court giving the person a minimum of 21 days to restore what he has destroyed. Under Section 70(i) of the National Environment Act Cap 153, “where a person on whom an Environmental Restoration Order has been served fails, neglects or refuses to take action required by the Order, the Authority (NEMA) may with all the necessary workers and other officers, enter or authorize any other person to enter any land under the control of the person on whom that order has been served and take all the necessary action in respect of the activity to which that order relates and otherwise to enforce that order as may deem fit.”
21 However, in a telephone conversation with a DGSM representative, a research team member was told that the Minister of Energy and Mineral Development is yet to implement Environmental Performance Bonds.
D. The Use of Criminal Law & Community Service Orders - Criminal law remains a veritable instrument for the control of behaviour because of the natural tendency of people to fear the infection of pain, isolation or economic loss. Therefore, the Act provides for serious penalties for infraction of its provisions. As an alternative to imprisonment and fines, persons committing environmental wrongs may be required to perform duties in the community as a reparation to the community for the wrong done.
EIA-related requirements and procedures – Monitoring of environmental plans and non-compliance penalties and remedies
All mineral rights are subject to self-monitoring for compliance with approved environmental indicators and parameters (R. 67 of EIA Regulations of 1998). Regulation 67 (3) obliges companies to make and submit quarterly reports to the DGSM Commissioner and the NEMA Executive Director. Inspections are carried out by gazetted inspectors who have very wide powers under the National Environment Act (e.g. to take samples, seize any plant equipment or substance and close any facility or issue improvement notices).
As a first step for discouraging non–compliance, the DGSM is empowered to make public shame notices in the media for events of non-compliance. In addition, the DGSM Commissioner has powers to order mineral rights holders (company or individual) to reclaim the mined area within a specified time frame (s.111(1)). Failure to do so is punishable upon conviction by, in the case of companies, payment of UGX 10M (USD 4 000) and, in the case of individuals, either payment of UGX 2M (USD 800) or 2 years jail term or both.
As court proceedings take a long time in Uganda, the law further grants powers to the Commissioner to redeem the affected area pending legal action for non-compliance from the Directorate’s Budget and recover such money from guarantees (e.g. Environmental Performance Bonds, Bank Guarantees) executed at the time of application of a mineral right. The law also provides for the costs and expenses made by the Commissioner to reclaim the mined area a debt due to GoU from the non-compliant miner: This debt mustbe paid upon conviction of non-compliance in a court of law in addition to the aforementioned penalties.
34
EIA-related requirements and procedures – Challenges in monitoring, auditing and enforcement
Enforcement of environment regulations is expected to be done through a hierarchy of enforcement levels from national (NEMA), Districts down to community levels. Yet, based on our engagement with various stakeholders, environmental management monitoring, compliance auditing and enforcement currently fail at most – if not all - institutional levels in Uganda. This is probably due to the lack of enforcement capacity at all these levels: While the responsibility for the management of some environmental issues (e.g. wetlands) has been vested under local authorities22, cases of local authority intervention on environmental management are still few, implying that even where local authority intervention would have been enough to stop abuses, such cases still continue to be referred to NEMA (where human capacity remains limited or inexistent). It should be stressed that this state of affairs requires enforcement and intervention mechanisms that are as close as possible to the impact receiving community if tangible results are to be achieved.
22 UNEP Project “Capacity building for strengthening legislation and institutions for the implementation of Rio means, focusing on poverty alleviation “(MEAS and Law) – Proceedings of the training course on environmental inspection, investigation and prosecution of environmental crimes in Uganda. Held at Sunset Hotel, 18 – 22 February 2007 Jinja, Uganda.
35

36
4. COST-BENEFIT ANALYSIS OF KARAMOJA MINING CASE STUDIES
The lack of quantified economic, social and environmental data and of comprehensive SAM accounts and associated impact multipliers precluded the undertaking of complete CBA of each case study. This section thus presents the various case studies, the key information collected to date, key CBA results and information gaps.
4.1 CBA of LSM case studiesOut of the 4 LSM case studies selected, only DML and JML have fully mechanised mining operations (i.e. they use machines to extract marble and gold respectively), though both had direct links with ASM. AML is acting as a mere purchaser of marble while TCL relies heavily on artisanal miners for the crushing and loading of limestone.
Unfortunately, only DML - which can be congratulated for its transparency – provided the research team with the minimum information (e.g. capital and operational expenses) required to undertaken a CBA of their project. As a result, the following CBA case studies should not be taken as conclusive. They aim to propose a CBA baseline for future work on responsible and equitable mining within Karamoja.
Karamoja hosts a range of mineral resources that are yet to be optimally exploited. At least fifty different minerals and precious stones have been documented and, in Moroto District alone, there are recorded prospects of gold, silver, copper, iron, titanium, manganese, niobium, tantalite, chrome, rare earth and radioactive minerals. Yet, very little actual mining has been done for most minerals, with the exception of limestone and marble.
Accordingly, there is very little choice in the selection of case studies, especially for LSM, as only actual mining activities can be selected for cost-benefit analysis (CBA) (Figure 4.1). Three LSM operations have been identified and have thus been selected: African Minerals Limited (AML), Dao Marble Limited (DML), Jan Mangal Limited (JML) and Tororo Cement Limited (TCL). ASM activities occur within the licence areas of all these companies – though to varying extent, resulting in very specific business relationships between ASM and the aforementioned ‘LSM’ businesses.Furthermore, Rupa (gold) and Acherer (gold), both showcasing only ASM activities, have also been selected as CBA case studies.
Jan Mangal’s office at Nakabat Gold Mine.

37
Figure 4.1 Mining concessions map for Karamoja** Investing in Uganda’s Mineral Sector. Accessed on December 10, 2013 ; URL: http://newscastmedia.com/uganda-minerals.pdf

38
4.1.1 Dao Marble Ltd – CBA of the Ratta Mine Marble Mining project
Presentation of Dao Marble’s Ratta Marble Mining Project
M/s Dao Marble Limited (DML) is a limited liability company incorporated in Uganda under The Companies Act (Cap. 110). The company is engaged in mining, mineral processing and trading in minerals among others. The company holds exclusive mineral rights in the exploration area registered under Exploration License (EL) No. 638. The area is located in Ratta village, Rupa sub-county, Matheniko County, Moroto District. The total acreage is about 6 km2 and is located approximately 11 km north east of Moroto Municipality off the Moroto-Nakiloro road.
The construction phase in 2012 and early 2013 involved putting in place all the required infrastructure and facilities for the operations phase and other facilities required to ensure that all activities will be undertaken in a safe manner; including access roads, a camp (approximate 200m by 200m footprint) with both accommodation and office facilities and a parking/laydown area, waste rock dump and a storm water run-off pit.
The operation phase involves mechanical stripping of in-situ marble rocks using excavators, haulage of extracted rocks, trimming the rocks into cuboid blocks using a diamond wire saw and then transporting the trimmed blocks a distance of approximately 500m to 1km to a factory where the blocks will be sized and polished into finished products ready for marketing. In exceptional circumstances, where the rock is found to be very competent, a drilling jumbo may be used to drill holes that will be connected to a diamond wire saw to cut through blocks of the desired size from the in-situ rock. Alternatively, holes may be drilled to phase out the dimensions required and then expanding powder be placed in the holes to break the block from the in-situ rock. No conventional blasting using explosives is planned to be undertaken.
The resource in place has been estimated to be approximately 23 million tons. The production rate will be about 30m3 per day which translates to about 10 000m3 per annum. The company is targeting both national and international markets.
Discussions between the IUCN research team and DML representatives at Ratta Marble mine (photo 4.1).

39
Waste rocks available for collection by local community members (photo 4.2).
Marble blocks ready to be trucked offsite (photo 4.3).

40
Data collection, site visit and legal situation
The research team met with Dao Marble representatives at the Ratta Marble Mine and had access to the Environmental Impact Assessment (EIA) report for the Ratta Marble Mining Project (Kasande et al., 2013) which was found to be fairly comprehensive but limited to the listing of potential environmental and social impacts (rather than based on the quantification of actual impacts of proposed mining scenario – e.g. no quantified information on affected community members, their loss of livelihoods and any other opportunity costs). The following documents were requested but were not available (or not made available by DML representatives for confidentiality reasons): Mining Plan, first annual financial statements, detailed budget forecast (over the life of the Mining lease), Environmental Management Plan (HSE), Health, Safety and Environmental (HSE) plan, mine closure and environmental rehabilitation plan and costing.
Though DML is required to obtain various licenses and permits including a Mining Lease from DGSM, an EIA certificate from NEMA, Water Abstraction and Waste Water discharge permits from DWRM and a Safety Permit from DOSH well before commencement of construction activities, none had been obtained at the time of the site visit and discussions with DML representations (November 20th, 2013).
During its exploration period (Ratta Mine is under an EL), DML alleges it declared 9000 tons of marble and paid royalties (but this income has not been confirmed by DGSM). DML mining operations were stopped by DGSM in mid-2013, and DGSM asked DML to declare how much they had mined till that date. DML declared 7 000 tons of marble but DGSM rejected this declaration, sending its officers on the ground for a production verification audit for royalty calculation purposes. The officers reported that DML had mined 10 000 tons, a figure which is contested by DML. DML claims it is ready to pay royalties for the 10 000 tons but maintains it only extracted 7 000 tons. It is understood that the Certificate of approval for EIA should be obtained by DML soon and that this would be the last step for obtaining a ML.
Furthermore, stakeholder consultations have taken place (minutes in EIA report) and negotiations over surface and access rights to the mining, processing and camp area seem to have been finalised in 2013: 47 Ratta community members received compensation payments for the surrender of surface rights ranging from UGX 500 000 to UGX 2 320 000, for a total of UGX 89 220 000 (approx. USD 35 000)23. Yet, there was no disclosure of the methodology used for assessing the economic value of surface rights surrendered (i.e. which surface rights and what price?).
23 MoU between DML and Ratta Community, 2013. Specification of the compensation to the bonafide occupants of Ratta Community for the surrender of surface rights (pursuant to Mining Act No. 9, 2003).
The IUCN research team and DML representatives walking up Ratta Marble mine (photo 4.5).

41
Figure 4.2 DML Mining Concessions map in Karamoja
Baseline situation
Key environmental baseline information in the EIA report (Kasande et al., 2013) include:
• Thearea receivesmono-modal rainfall.Thereis one wet season from April to August. The dry seasons are January - February and July - August. The annual rainfall mean is low at about 300- 800. Nearly all surface water resources in the region such as rivers and streams are seasonal. The project area is traversed by Misupo river that flows from Mt Moroto hills south-westwards.
• TheRattaareaisdominatedbyaruggedandhilly terrain with ridges trending in the SW-NE direction. The area forms the western edge of the Moroto Mountain. The gradient of the hills ranges between medium to steep slopes of up to 50-60 degrees.
• Background noise levels are low due toremoteness of the area.
• Particulate matter concentrations were alsolow at 1.68 mg/m3. No SOx, NOx or toxic gases were detected.

• The vegetation pattern in the project area istypically semi-arid with dry tree savannah species dominating grass species. The main vegetation communities are savanna woodland, semi evergreen thicket, deciduous thickets, riparian communities and grass steppes are Acacia seyal, Acacia senegalus, Hyperenia rufa, Cynodon species, Ficus exosperata, Cucumis fungarei, Euphorbia candelabrum, and Cassia species.
• Assessmentoffaunainandaroundtheprojectarea revealed a relatively low population of large mammals. This is probably explained by (past and present) hunting pressures and competition with herds of cattle in this area. However, small mammals and land birds were recorded and these included rats and squirrels.
42
• ASMintheareahasresultedintoenvironmentaldegradation and exposed communities to a number of health and safety hazards. Mining is undertaken without any due consideration to the environment. Unsafe mining methods are practiced often resulting in injury of miners. No restoration works have been undertaken. It is common to find uncovered pits several feet deep.
• NofatalflawwasidentifiedbytheEIAteam.
• The EIA report mentions that “Applicable design criteria for the overall approach to mining, production and sequencing of material placement within the final landform for optimum rehabilitation and closure conditions are addressed in the EMP… (..)…
Figure 4.3 Map of the DML Marble Mining Project showing the mining, processing and camp areas

43
the Plan contains provisions for protection of the environment during the operations phase using best management practices. These practices are primarily guided by the protection of surface water and groundwater resources. Sediment transport is addressed through design of storm water control features and dust control measures”, yet the draft EMP contained in EIA report is very general/high-level and no practical measure could be explained and shown by DML representatives. Similarly, no quantified information (e.g. targets, costs) could be accessed as regards to the rehabilitation and closure plan. Yet, the EIA report states that “… The decommissioning and closure plan includes a massive tree plantation programme to be decided and executed with the assistance of forestry experts and co-operation of the local community. Major elements of the rehabilitation and closure plan are in accordance with the NEMA Act and Regulations and the Mining Act, 2003 and are clearly spelt out in the EMP…”
Key socio-economic baseline information contained in the EIA report (Kasande et al., 2013) includes:
• The population of Moroto district by 2002stood at 189 940 persons, hence exhibiting a very low population density. Out of the total population, only 4% live in urban areas. The sex ratio was 93 males per 100 females as per 2002 census implying that the number of females is slightly bigger that of males. There are high levels of poverty with about 60 % of the population living below the poverty line. There is a high maternal mortality rate (over 500/100 000) and a very low percentage of literacy (13%).
• Thereisahighdependencyratioofmorethanhalf of the population below 15 years. Actually, about 60% of the population are children (0-17 years). The birth rate is 7.2 children per woman of reproductive age and there is a high fertility rate at young age (15-19 years).
• About90%oflandintheregionisheldundercustomary law. The major land use patterns in the area are agriculture and cattle grazing. The average land area for agriculture is about 0.14 acres per household.
• Low permanent immigration but high interms of short nomadic transhumance due to lack of pasture and water for the animals. Low incidence of one-person household and high incidence of large size household. Low safe water coverage with uneven distribution (32.3%) and very low latrine coverage (15.7%).
• Cattle keeping, subsistence farming andartisanal mining are the main source of livelihoods in the region. The major food crops grown are sorghum, maize, beans, cassava and sunflower. Livestock rearing is one of the commonest activities carried out around the project area.
• The communities in the project area alsoengage in small-scale butchery, small-scale retail trade, crushing of aggregates, brewing, casual labour, sale of firewood and wood for building, charcoal and honey production.
• Somecommunitymemberswerealsoinvolvedin marble mining in the project area.
• High female participation in the agriculturaland ASM activities but few in other economic activities.
• Sub-county representatives claim that thesub county has not been able to levy taxes on the aforementioned economic activities (high levels of tax evasions) because of the negative attitude towards taxation.
• Unfortunately, no information is provided asregards to the affected community members, their current land-uses within the EL (as yet to be ML) and the associated opportunity costs (e.g. ASM, grazing, wild foods and medicines).
Rating and ranking key environmental impacts
Using the content of EIA report, the observations of the research team at Ratta Marble Mine and our discussions with stakeholders (DML representatives, Moroto Natural Resources Officer), the main environmental impacts have been identified (i.e. not an exhaustive list) and an environmental impact rating and ranking has been undertaken as per the methodology described in Annex 1 (page 80) of this report. This aims to provide greater clarity on the nature (positive/negative), geographic extent, duration, magnitude and probability of occurrence of the expected environmental impacts of the Ratta Marble Mine Project.
According to our environmental impact rating and ranking (Table 4.1), the key environmental impacts for DML Ratta Marble Mine are: (1) visual and landscape impacts, (2) biodiversity loss through vegetation clearance (over a maximum of 6 km2 or 600 ha) and (3) greenhouse gas emissions. Given the nature of marble mining, low levels of water abstraction are expected while the chemical nature of the associated geological formations (e.g. few metals, if any) are not likely to generate significant surface/groundwater pollution.

44
The majority of impacts will occur during the operations and closing phases of the mine (4 as score for the duration of impact) while the others (e.g. vegetation clearance, greenhouse gas emissions24, visual impacts) are all expected to be permanent impacts (5 as score for the duration of impact). This strongly underlines the importance of urgently developing an effective EMP or EHS plan (e.g. solid waste management and dust mitigation measures, storm-water and wastewater management), as well as a properly quantified mine closure and rehabilitation plan and costing (i.e. minimising visual impacts of final landforms, viable ecological restoration striving towards productive habitats for livestock grazing and other ecosystem uses). For permanent biodiversity impacts, opportunities for offset measures could be explored.
Identifying and quantifying key socio-economic impacts
Because of the lack of comprehensive SAM accounts in Uganda (i.e. no publically available impact multiplier), the quality of economic impact modelling can only be high for direct (initial) impacts
24 Greenhouse gas emissions accumulate in the atmosphere and may take several decades to several centuries to leave it, depending on the gas involved; URL: http://en.wikipedia.org/wiki/Greenhouse_gas#Atmospheric_lifetime.
(i.e. DML expenses). The key initial economic impacts of a mine comprise internal company costs: capital and operational expenditures, wages, royalties and other taxes, and infrastructure development spending. Direct external costs of mining activities would include opportunity costs of forgone economic activities (e.g. potential loss of access to marble sites for ASM 25) as well as environmental and social costs borne by society - but no information was found on the later apart from limited greenhouse gas (GHG) footprint.
Unfortunately, the research team granted access to DML budget forecasts for the first three years of operations (no financial statements). Estimated expenditures are USD 113 828 (year 1), USD 123 078 (year 2) and 410 803 (year 3). In addition, DML provided the following information orally in a meeting held in December 2013 at their head offices in Kampala26:
25 Access to mining area is limited by DML for health and safety reasons according to stakeholder consultation minutes in EIA report. Though DML provides waste rocks for free to local community members, it remains unclear whether all affected community members are worse or better off.
26 Because no certified financial statements of position and performance for 2013 were accessed, one cannot confirm the veracity of these amounts.
Table 4.1 Environmental impact rating and ranking for DML Rata Marble Mining Project
Key environmental impacts identified
Biodiversity & land productivity loss
Vegetation clearance
Fauna impacts (increased human population pressure, habitat loss)
Habitat fragmentation (roads, infrastructures, waste dumps)
Soil disturbance, compaction & erosion
Alien/invasive species
Water impacts
Noise and vibration
Solid waste
Air quality impacts
Visual and landscape impacts
Water abstraction
Surface water contamination
Groundwater contamination
Sewage and wastewater disposal
Greenhouse gas
Dust
Negative
Negative
Negative
Negative
Negative
Unknown
Negative
Negative
Negative
Negative
Negative
Negative
Negative
Negative
Negative
1
1
1
1
1
2
1
2
2
1
1
1
5
1
2
5
5
5
4
5
5
4
4
4
4
4
4
5
4
5
5
2
2
4
3
Unknown
2
2
2
1
3
2
1
2
5
5
4
4
5
3
3
5
2
2
5
5
5
5
5
5
125
40
40
80
45
Not applicable
40
32
32
20
60
40
125
40
250
2
6
6
3
5
5
7
7
8
6
6
2
6
1
Nature A- B- Duration C- Magnitude Probabilty Total Impact Impact of impact Geographic of =A*B*C*D ranking/ extent occurance highest (1) to lowest (8)

45
• CapitalexpenditureofUSD2.6M,includingthepurchase of 1 excavator, 2 generators, 1 wheel loader, 1 diamond wire cutting machine and 1 compressor. This corresponds to a small-scale mechanised mining operation by international standards.
• Operation costs (feeding, fuel, wages) forRatta Mine only (excluding headquarters) are USD 1400 per day, that is about USD 42 000 per month. Total operation costs per month (including headquarters) ranges from 44 000 to 55 000 USD; in conflict with the budget forecast mentioned above. Accordingly, for modelling purposes, we used the USD 42 000 per month figure after year 3 as they would apparently be appropriate under normal operating conditions.
• The total compensation costs for thesurrendering of surface rights are UGX 89M, that is an average of UGX 1.89M (USD 756) per community member for about 47 community members and their families.
• DML conducted 6 meetings for negotiatingsurface rights compensation with local communities: UGX 19M (USD 760)/meeting for a total of UGX 144 M (USD 57 600).
• Other costs include: EIA costs (USD 9 000),marble transport costs (from Moroto to Mbale - USD 45 per ton, from Mbale to Mombasa - USD 43 per ton, and port clearance at Mombasa – USD 170 per ton).
• No cost data is available for the EMP, EHSplan, and closure plan.
• Noinformationaboutearningswasdisclosed.
• The GoU presently charges royalty at UGX5000 (USD 2) per ton of marble since the beginning of 2013 having revised it from UGX 3000 (USD 1.2) per ton (2005 price).
• DML officer claims that local communitiesat Ratta Mine sell between 2 and 3 trucks of marble stones per day. Each truck is sold at UGX 100 000 (USD 40), plus UGX 40 000 (USD 16) loading fee.
The assumptions of our economic model are:
• Themarbleresourcehasbeenestimatedtobeapproximately 23 million tons, with assumed extraction efficiency of 90% (i.e. 20.7M tons) and a linear annual extraction rate of 985 714.3 tons.
• The scenario timeframe is 50 years, withan expected 15 years for vegetation re-establishment.
• A linear royalty ofUGX 5 000/ton ofmarble(USD 2/ton), even unlikely.
• AnexchangerateofUGX2500foreachUSD1 selected.
• Aninterestrateof12%wasselected(UgandanCentral Bank Rate as at 14 11 2013).
The key results of the modelling of initial direct economic impacts (Table 4.2) are as follows:
Table 4.2 Initial economic impacts of the Ratta Marble Mine over 50 years
Number of yearsTotal expenditures (Capex & Opex- constant 2013 pricesTotal of royalties (constant USD 2 per ton)
DML employment (numbers per year)
Total local community sales (USD 56 per truck- contant price, 2 trucks per day, 300 days per year
Construction phase
0.5
2600000
0
Unknown
Unknown
Operational phase
21
9719704
41400000
30 (men only) - 20 Egyptians, 10 Ugandans
703414
Rehabilitation & decommissioning
phase
2
Unknown
Unknown
Unknown
Unknown
Vegetation re-establishment
phase15
Unknown
Unknown
Unknown
Unknown
Extensive grazing
11.5
Unknown
Unknown
Unknown
Unknown
Total
50
12319704
41400000
Not applicable
703414
Economic Impacts of Ratta Mining Project (USD)

• DMLisexpectedtomakecapitalandoperationalexpenses of more than USD 12M for its Ratta Mining Project, resulting in total royalties of more than USD 41M (USD 33M for Central Government, USD 4M for Moroto District, USD 2.9M Rupa sub-county and USD 1.2M for land owners or lawful occupiers of the land27). This is significant compared to a baseline scenario with no (or marginal28) marble mining activity. However, it needs to be acknowledged that not all wages are spent locally by DML staff, as two-thirds of the latter are Egyptian nationals (i.e. likely to send a significant percentage of their salaries back home).
27 However, it remains unclear as to whether the community members who received compensation for the surrendering of their surface rights (a) are the legitimate land owners and (b) will be able to also receive royalties (i.e. the Mining Act states that a land owner can receive compensation for the loss of surface rights or obtain mining royalties - implicitly, he cannot receive both).
28 ASM with limited technology to cut marble.
• Although the expected total number ofemployees for the duration of the mine is rather small (approx. 30), it could vary significantly depending on changing market conditions and mining efficiency. Only a third of formal employees are from the local community (i.e. due to unskilled labour force), and that none of them are women due to DML’s employment policy (which is contrary to the GoU’s Mining Policy of 2001).
• Interestingly, the free supply of waste rocks isestimated to be worth approx. USD 703 000 to community members, hence sustaining artisanal miners throughout the duration of the mining operations (numbers unknown at this stage).
46
Table 4.3 Selected lower, middle and higher bound values for production, GDP-regional (GDP-R) and employment impact multipliers
Production - Total first round, indirect and
induced impacts
GDP-R- Total first round, indirect and
induced impacts
Employment - Total first round, indirect and induced impacts
Higher bound 1.5
Middle 1
Lower bound 0.5
Higher bound 1
Middle 0.5
Lower bound 0.1
Higher bound 2.5
Middle 1.75
Lower bound 7
Table 4.4 Modelling of total direct, indirect and economic impacts of the Ratta Marble Mine over 21 years under Mining Licence
Total first round, indirect & induced
impacts (higher bound)
14579556
9719704
75
Economic indicator
Expenditures
GDP-R
Employment (numbers per year)
Initial
9719704
971970.4
30
Total first round, indirect & induced
impacts (lower bound)
4859852
971970.4
30
Total first round, indirect & induced
impacts (middle value)
9719704
4859852
53
Macro-Economic Impacts During Operations (21 years ; USD, 2013 prices)

Estimating first round, indirect and induced economic impacts using lower, middle and higher bound impact multipliers (for illustration purposes only) .
The economic modelling undertaken here does not make use of the Ugandan SAM because of the lack of detailed information (informal sectors, low levels of development in Karamoja). Using the South African SAM (2013) and associated impact multipliers for mining, lower, middle and higher bound impact multipliers were selected (Table 4.3). The aim is to illustrate the full extent of economic benefits that could be generated by the Ratta Marble Mine.
As shown in Table 4.4, DML’s Ratta Marble Mine could be expected to generate (a) between approx. USD 4.8M and 15M in total first round, indirect and induced production impacts, (b) between approx. USD 0.9M and 10M in total first round, indirect and induced GDP-regional impacts, and (c) between 30 and 75 additional employment opportunities during its 21 years lifecycle.
Assessing internal and external environmental costs and the net social impact of Ratta Marble Mine – The need for additional data
As explained in section 2.3.2, calculating the net social value of a mining project can be understood from the perspective of the project developer or society as a whole. From the perspective of the latter, it involves adding all the direct and indirect social, economic and environmental benefits and subtracting all direct and indirect social, economic and environmental costs while the project-based approach would seek first to assess internal profitability (revenues – internal costs) and then add positive social, economic and environmental externalities and subtract negative ones.
The research team did not find enough quantified data for a net social value assessment for DML’s Ratta Mining Project (no information in the EIA report). Though finding all relevant data regarding externalities was not expected due to the novelty of the concept and the isolated nature of Karamoja, the research team was surprised that DML did not disclosure (or did not have) any quantified information about:
• Expected and actual key environmentalimpacts - apart from the total mining surface area (vegetation loss), daily water use and greenhouse gas (GHG) emissions due to diesel consumption - which precluded an assessment of the associated externalities;
• The actual non-monetary impacts and theassociated opportunity costs for the loss of grazing areas, ASM activities and other ecosystem-based livelihoods;
• Internalenvironmentalexpenditures,includingexpected closure liability;
• Internal social expenses (health and safety,community spending).
Nevertheless, for illustration purposes, the research team has attempted to calculate 2 key externalities: (a) external costs to society of the use of 400 l of diesel per day (26 days per month) and (b) the opportunity costs linked to the loss of grazing lands.
The external costs to society of Ratta Mine’s GHG Footprint
This exercise can be divided into 2 main steps: (i) calculating the GHG Footprint and (ii) estimating the associated social costs.
Calculating the GHG Footprint of Ratta Mine involves the following equation: GHG Footprint = activity data x emissions factor x global warming potential
• Activity data relates to the emission causingactivity (Figure 4.4);
• Emission factors convert the activity datacollected and consolidated into tons of the relevant GHG ; and
• Global warming potentials are applied tonon-CO2 GHG to convert the result to carbon dioxide equivalent (t eq. CO2).
Collecting activity data
In this case, the combustion of 400 l of diesel per day (26 days per month) was the only emission causing activity quantified by BML.
Calculating GHG emissions and their carbon dioxide equivalent
The GHG Footprint due to the diesel consumption of Ratta Marble Mine over its 21 years of operations is thus almost 7 119 tons of CO2 eq. Though it is relatively very little compared to 25 000 tons CO2 eq./year required by the IFC Performance Standards for annual GHG assessment, monitoring, reporting and mitigation plan, a more comprehensive GHG Footprint assessment (i.e. DML disclosing/recording additional activity data) may take Ratta Marble Mine’s GHG Footprint closer to the IFC threshold.
47

Estimating the external cost of Ratta Mine’s GHG Footprint
Various economic valuation techniques may be used to calculate the GHG externalities of Ratta Marble Mine, for instance:
• The costs of measures undertaken by DMLitself to offset the 7 119 tons of CO2 eq. emitted (e.g. switching to renewable energy sources, planting indigenous trees or avoiding the loss of mature trees);
• Thepricesofcarboncreditsonvariousoffsetmarkets;
• ThesocialcostsofGHGemissions29 borne by different stakeholders worldwide, by using one or more value(s) (e.g. average) derived from various studies of the negative impacts of climate change (e.g. property damages and increased insurance premiums from increased flooding risks, loss of agricultural production, human health costs).
29 The US EPA and other federal agencies use the social cost of carbon (SCC) to estimate the climate benefits of rulemakings. The SCC is an estimate of the economic damages associated with a small increase in carbon dioxide (CO2) emissions, conventionally one metric ton, in a given year. This dollar figure also represents the value of damages avoided for a small emission reduction (i.e. the benefit of a CO2 reduction). The SCC is meant to be a comprehensive estimate of climate change damages and includes, but is not limited to, changes in net agricultural productivity, human health, and property damages from increased flood risk. However, given current modelling and data limitations, it does not include all important damages: http://www.epa.gov/climatechange/EPAactivities/economics/scc.html
For illustration purposes, we choose 3 hypothetic economic values for GHG externalities (i.e. USD 1/ton, USD 10/ton and USD 150/ton) to calculate the corresponding GHG externalities of Ratta Marble Mine’s diesel consumption over 21 years. Its GHG externalities would thus be either 7 119, 71 190 or 1 067 700 USD.
Comparing these amounts to the total royalty payments of USD41 400 000, one can easily understand that DML’s future policy on GHG emissions can make a big difference – i.e. choosing between the internalisation of its GHG externalities via GHG offsets at less than USD 10/ton and doing nothing which would generate sustained GHG social costs at anything between 15 and 200 USD per ton (depending on climate change impacts accounted for, year of assessment and interest rate chosen).
The external costs to society of Ratta Mine’s loss of grazing land
A maximum of 600 ha of vegetation is expected to be lost due to DML’s Ratta Marble Mine project. To understand the full external costs to local communities of the loss of this grazing surface, various information requirements would have to be met by local consultation with relevant community members (e.g. actual number of cattle and goats/sheep and trends in the past, annual sales – meat and milk, annual reproduction rates, etc.).
48
Figure 4.4 The different scopes for assessing the GHG

49
For the purpose of this simple assessment, we will focus our attention on assessing the economic value of the potential total number of livestock units (though one must recognise that they may not rely on the mining area for grazing throughout the year and that cattle might actually have limited access to most of it given the hilly terrain).
Based on an estimation of 1.19 Total Livestock Unit (TLU)/hectare in Moroto district in 2008 (Table 4.6), we have selected 3 hypothetic TLU/ha values for modelling: a low value of 0.5 TLU/ha, a medium value of 1.19 TLU/ha and a high value of 2 TLU/ha.
Furthermore, we have selected low (UGX 20 000/livestock, that is USD 8/livestock – i.e. price for 1 sheep or goat) and high (UGX 200 000/livestock, that is USD 8/livestock – i.e. price for 1 cattle) prices per TLU so that the potential economic value of livestock sustained by DML’s EL/ML varies between USD 2400 and 768 000 (Table 4.7). This presents too much uncertainty, notwithstanding the fact that only a percentage of the DML ML will not be accessible to grazing during the 21 years of mining (probably between 5 and 15 ha in 2013; 600 ha in 21 years if full exploitation of the resource is achieved and if no effective restoration is achieved concurrently to mining).
Accordingly, one cannot overemphasise the need to get actual data for an accurate estimation of the opportunity costs of mining at Ratta Marble Mine. This would be instrumental to two main activities beyond CBA, notably for the efficient estimation of the amount required to effectively compensate for the loss of surface rights (approx. USD 35 600 or UGX 89M paid to community members by DML) as well as for tangible closure costing (i.e. what would be the cost of restoring the livestock carrying capacity of the restored areas after mining?).
Table 4.5 Calculating the GHG Footprint of diesel consumption for the Ratta Mine project (21 years)
Fuel (litres)/day 400Fuel (litres)/month 10400
Fuel (litres)/year 124800
Fuel (litres) for 21 yrs 2620800
Total amount of fuel used
Fuel consumption per Operation
Diesel
Density kg/L
(or kg/m3
for LPG
0.85
A1
Quantity of fuel
combusted
2620800
A2
Quantity of fuel
combusted in kg
2,227,680.00
B C D E F G1 H1 G2 H2 G3 H3 I J
kg 43.000 MJ/kg NCV MJ 20.2000 kg C/GJ 0.0030 kg CH4/GJ 0.0006 kg N2O/GJ 100% 0.0010
Heat/Calorific Value of
fuel
Units for A
Basis of Heating Values (GCV or NCV)
Units for C
Units for Energy
combustedAxC
C content factor
Units for G1
CH4
emission factor
Units for G2
H2O emission
factor
Units for G3
Oxidation factor
Unit emission
factor
Total CO2 emissions
K1
Total CH4 emissions
K3
Total CH4 emissions
in tons CO2e
K5
Total N2O emissions
K4
Total N2O emissions
in tons CO2e
K6
ANNUAL TOTAL
(total ton CO2e)
K7
K = ((A x C) x (G x I x J x 44/12))/1000
7,094.86 0.29 0.06 6.03 17.82 7,118.72

Would DML have disclosed its future work plans and associated detailed budgets, the research team could have modelled and compared 2 scenarios for Ratta Marble mine: (a) the first scenario based on current practices and (b) the other focusing on international social, environmental and economic best practices.
4.1.2 Tororo Cement Ltd – CBA of Kosoroi Limestone Quarry in Katikelike
Presentation of Tororo Cement’s Limestone Mining Operations
Tororo Cement Limited (TCl) is a limited liability company incorporated in Uganda under The Companies Act (Cap. 110). TCL is planning to expand their cement production capacity to almost double the present output. TCL’s plant at Tororo is currently producing about 2000/2500 tons of cement per day and the company wishes to develop it to 4000/45000 tonnes of cement per day (Aeon and Muwanga, 2009a). For this expansion to be sustained, TCL needs more raw materials (dolomitic marble, which is used as limestone). TCL have hence applied for, and been granted
exploration licences as per Sections 26, 27 and 28 of the Mining Act (2003) to excavate limestone for increased cement production. The exploration licences (El 0421/ El 101/ El 1021 El130/ El 131) are situated to the west, north and east of their existing mining lease (ML4622) in Katikekile sub-county in Moroto District, with a small portion in Loroo sub-county in Nakapiripirit District. TCL is now applying for a Special Mining lease.
TCL’s mining project covers an area of 5 200 hectares and its limestone quarry is located on the Amudat-Moroto road. It is situated 70 km north of Amudat at Nangirogomor village in Katikekile sub-county, Moroto District. It is about 235 km from Tororo Cement Factory.
The project will be implemented in three stages:
• The first stage started in 2004 involvedprospecting whereby TCL carried out reconnaissance of the area to locate outcrops of limestone, pitting and trenching to establish the quantity of the limestone and amount of overburden and channel and bulk sampling for chemical analysis to establish quality. The prospecting established over 3.5 million tonnes of good quality limestone which can sustain production for at least 20 years.
50
Table 4.6 Estimates of grazing area and stocking rate in Karamoja (TLUs/ha/available grassland) (Anderson and Robinson, 2009)
District Total area Park WL Possible Past. TLUs 2008 in (TLU/ha tot. TLU/ha 000s ha Reserves area 000s 000s area 2008) grazing area 000s ha ha 2008)
Kaabong 727 358 367 596 0.82 1.63Kotido 596 230 362 788 1.32 2.17Abim n/a n/a n/a n/a Moroto 844 490 350 417 0.49 1.19Nakapiripirit 582 250 238 726 1.25 3.05Karamoja 2,749 1,328 1,317 2,529 0.92 1.92
Table 4.7 Estimates of minimum and maximum value of livestock using grazing land at Ratta Mine ML
Ha
600
600
600
TLU/ha
0.5
1.19
2
TLU (a)
300
714
1200
Minimum value in USD (if only sheep
or goats)
8
8
8
Maximun in value in
USD (if only cattle)
80
80
80
Total minimum
value in USD
2400
5712
9600
Total maximum
value in USD
19200
456960
768000

The second and third stages involve mining:
• Mining Phase I started in 2009 and was/is mainly manual (dependence on approx. artisanal miners) though site clearance using some of the equipment at the current site and construction of some structures such as stores and offices. This will be carried out concurrently with limestone excavation that will be ferried to the plant at Tororo.
• MiningPhase2will involve theblastingof therocks and will start when the near surface exposed limestone is exhausted. According to Aeon and Muwanga (2009a), blast holes will be drilled to such depth and pattern so as to reduce noise, ground vibrations and flying stones. Explosives will then be charged into the blast holes. To further reduce noise, ground vibrations and flying stones, explosives like ANFO were recommended for use and the blasting will be controlled just to crack the rocks.
Machinery and equipment to be used include excavators, jackhammers, dumpers, wheel loaders, compressors and later a crusher plant. Quarries will be developed in benches with a maximum height of 6 to 8m and 5 to 10m width.
Data collection, site visit and legal situation
The research team met with Tororo Cement representatives at the Kosoroi Limestone Quarry and had access to the:
• Environmental Impact Statement (EIS)report for its limestone quarry (Aeon and Muwanga, 2009a) which was found to be fairly comprehensive but limited to the listing of potential environmental and social impacts (rather than based on the quantification of actual impacts of proposed mining plans);
• EnvironmentalAudit(EA)reportforitslimestonequarry (Aeon and Muwanga, 2009b), which was found to be fairly comprehensive. While it highlighted many areas of non-compliance, no indication was given with respect of the way forward to ensure future compliance with all relevant legislations (e.g. timing of next audit report, potential penalties, etc.). The Consultants recommended that the EA be approved by NEMA, based on the belief that TCL managers are all committed to operating in an environmentally sustainable manner.
51
Piles of marble crushed by artisanal miners are ready to be loaded on trucks and used as limestone for cement production (photo 4.6).

Besides, the following documents were requested but were not available (or not made available by TCL representatives for confidentiality reasons): Environmental Management Plan (EMP), Health, Safety and Environmental (HSE) plan, mine closure and environmental rehabilitation plan and costing, Mining Plan, annual financial statements, detailed budget forecast (over the life of the Mining lease). The TCL representatives did not seem to be aware of the findings of EA report and could not direct us to any HSE corrective or compliance measures put in place since 2009.
Though TCL is required to obtain various licenses and permits including a Mining Lease from DGSM, an EIA certificate from NEMA, Water Abstraction and Waste Water discharge permits from DWRM and a Safety Permit from DOSH before the expanding its operations, TCL representatives did not provide any proof of obtaining such documents at the time of the site visit (November 21st, 2013).
52
Baseline situation
According to the EIS report (Aeon and Muwanga, 2009a), key environmental baseline information include:
• Climatic conditions of Moroto District (seeDML case study – section 4.1.1);
• Thedepositstobeexploitedlieonthewesternskirts of Mt. Moroto at a height of between 1300 and 1500m. It comprises of dolomitic marble (which TCL uses as limestone), that extends all the way to the Sudan and Kenya border. The average grade of the marble is CaO 45% and MgO 3%.
• Soil development on the hills is poor. Deepblack cotton soils do exist in the valley away from outcrops. At the office site are red lateritic soils.
TCL office building at its limestone quarry (photo 4.7).

• The vegetation pattern in the area is typicallysemi-arid with tree savannah species and dominant grass species. The main vegetation communities in the district include: savannah woodland, semi-ever-green thickets, deciduous thickets, riparian communities, grass steppe communities and forests at high altitudes (dry montane forests). Forests are only found at localised patches on the hills and mountains such as Mt. Moroto. None of the species found is classified as endangered30.
• Several mammals (e.g. small antelopes,rabbits) and bird species have been observed by local residents31. None of the species is protected or endangered.
• There is no water at the site. All the nearbyrivers are season and most were dry during the time of the visit.
Key socio-economic baseline information (besides general socio-economic information about Karamoja) identified in the EIA report (Aeon and Muwanga, 2009a) include:
• The people around the site live in manyattaswhich are relatively far from the site. Settlements are found in trading centres such as Loroo.
• Intheimmediateneighbourhoodoftheproposedquarry extension, almost all the people are involved in stone crushing on the current TCL lease. TCL excavates the large boulders and the artisans break them up into smaller blocks. TCL buys the blocks from them at a rate of UGX 130 000 (USD 52)/per 10 tons truck (+ UGX 40 000 loading fee, that is USD 16). TCL also provides the implements for stone breaking e.g. hammers and crowbars. The youth and women are employed as casual labourers to load stones on to TCL trucks. Most of the income earned is used to buy food and other basic needs.
• Collection of firewood and charcoal burningare some of the emerging economic activities in the area. The items are usually sold to bigger business centres like Moroto Municipality, Amudat and Loroo. Agriculture is also being practiced by some communities in the region, especially growing of maize and sorghum, but due to harsh weather conditions, crop failure and death of poultry are common. Little agriculture is thus expected to take place on-site. Hunting is also being practised.
• Thereisnohealthandeducationfacilityatornear the site.
30 Given the size of the project, a more detailed floral survey would have been warranted.
31 Given the size of the project, a more detailed floral survey would have been warranted.
Rating and ranking key environmental impactsUsing the content of EIS and EA reports, the observations of the research team at Kosoroi Limestone Quarry and our discussions with stakeholders (TCL representatives), the main environmental impacts have been identified (i.e. not an exhaustive list) and an environmental impact rating and ranking has been undertaken as per the methodology described in Annex 1 (page 80) of this report. This aims to provide greater clarity on the nature (positive/negative), geographic extent, duration, magnitude and probability of occurrence of the expected environmental impacts of the TCL Limestone Quarry.
According to our environmental impact rating and ranking (Table 4.8), the key environmental impacts for TCL Kosoroi Limestone Mine are: (1) greenhouse gas emissions, (2) visual and landscape impacts, (3) biodiversity loss through vegetation clearance (over a maximum of 5 200 ha), (4) soil disturbance and erosion and (5) dust and particulate matter. Given the nature of limestone mining, low levels of water abstraction are expected for extraction purposes.
The majority of impacts will occur during the operations and closing phases of the mine (4 as score for the duration of impact) while the others (e.g. vegetation clearance, greenhouse gas emissions, visual impacts) are all expected to be permanent impacts (5 as score for the duration of impact). This strongly underlines the importance of urgently developing an effective EMP or EHS plan (e.g. solid waste management and dust mitigation measures), as well as a properly quantified mine closure and rehabilitation plan and costing (i.e. minimising visual impacts of final landforms, viable ecological restoration striving towards productive habitats for livestock grazing and other ecosystem uses). For permanent biodiversity impacts, opportunities for offset measures could be explored (see section 5.1).
EMP and closure cost estimations
According to Aeon and Muwanga (2009a), TCL “will adopt annual internal auditing as an environment management tool to identify areas of weakness in terms of HSE performance. This will be carried out by the HSE Committee. Monthly state of the environment and safety reports shall be compiled by the Site Manager and passed on to TCL Management. This will be used to compile annual environment reports for the quarry which will be used to assess and evaluate performance and suggest improvement. The reports will be submitted to the National Environment Management Authority
53

(NEMA). Regular external annual HSE Audits/assessments for the entire complex will be carried out by hired experts in consultation with NEMA and any other relevant stakeholder/authority”.
Unfortunately, no such monthly report was obtained from TCL. The EA (Aeon and Muwanga, 2009b) clearly showed several key non-compliance areas, such as the lack of:
• HSEcommittee tooverseehealth and safetyissues,
• Workertraininginhealthandsafety,includingthe appropriate use of personal protective equipment (PPE),
• MonitoringandenforcementofPPEusage,
• Backfillingof excavationsafter theextractionfrom each pit is complete,
• Measures to minimise air pollution beforeexcavation,
• Measures to control speedof vehicles in thequarry,
• Waste disposal, including hazardous wastes,via licensed waste transporters and handlers,
• Latrines for all workers, including artisanalmines, and
• Latrine maintaining (i.e. most in impropersanitary conditions).
This calls for urgent action, notably the establishment a dedicated budget, targets, action plans and timeframes for implementing the recommendations of the EA report (Aeon and Muwanga, 2009b). To that end, the EIS (Aeon and Muwanga, 2009a) does provide some guidelines in terms of potential costs for implementing an EMP at the site (see Tables 4.6 and 4.7) but there remains much uncertainty as to whether these estimates are accurate and comprehensive. Besides, TCL did not disclose the actual amounts (if any) spent up to this date, after probably more than 5 years of exploration and 4 years of mining.
Furthermore, the EIS report (Aeon and Muwanga, 2009a) also provided “decommissioning cost estimates” as shown in Table 4.8. These cost estimations constitute a total of UGX 135 000 000 or USD 54 000, which may be sufficient for effective closure but may fall short of restoring ecological functionality. A detailed closure costing (i.e. showcasing closure task component, rate/task component unit and number of task component units) was unfortunately not available.
54
Identifying key positive and negative socio-economic impacts
Unfortunately, TCL did not disclose any data as regards to sales or capital and operational expenditures. This precluded the research team from undertaking a CBA. Nonetheless, the key socio-economic positive and negative impacts can be described as follows.
This project is expected to employ about 40 people: 1 manager (also acting as environment manager), one accountant, one sub-accountant, four foremen, 4 drivers, 2 mechanics, and about 27 casual labourers. Their remuneration ranges from UGX 150 000 to UGX 1 750 000 per month (from USD 160 to USD 700 per month), depending on their levels of skills and responsibility. Yet, upon the site visit, only 25 workers were employed in 2013, including 3 women and 2 Indian nationals.
In addition, local community members are excavating and crushing limestone which they then sell to TCL. In 2013, there are about 500 artisans doing so. Though they are not direct employees of TCL (no employment contract), one needs to emphasise the fact that TCL is their sole client, which does generate tensions.
Production amounts to between 5 to 20 trucks per day, with 2 to 3 people breaking enough stone to fill 1 truck and 4 loaders per truck (fee of UGX 40 000 or USD 16 to load 10 tons) (Table 4.9). With USD40/23 tons/truck, ASM sales are expected to vary between approx. 88 000 and 354 000 USD, which is not negligible. However, more in-depth research is warranted to understand revenue-sharing practices among artisanal miners at Kosoroi Limestone Quarry.
Since the prospecting established over 3.5 million tonnes of good quality limestone, approx. USD 7 000 000 of royalties can be expected (at UGX 5000 or USD 2/ton of limestone). Moroto and/or Nakapiripirit Districts should receive USD 700 000 of it (10% of royalties), Katikekile and/or Loroo sub-counties USD 490 000 (7%) and land owners USD 210 000 (3%).
Because production should vary between 110 and 460 tons per day, expected royalties would range from 287.5 and 1150 USD/day and from 86 250 and 345 000 USD per year (assuming 300 working days). This should amount to a total lying anywhere between 345 000 and 1 725 000 USD of royalties received by the GoU since 2009 (Table 4.10).

55
Table 4.9 Cost estimations for mitigating impacts on terrestrial habitats and air quality during site clearance and construction of temporary structures for TCL Kosoroi Limestone Quarry (Aeon and Muwanga, 2009a)
Category/Issue
Potential Impact
Mitigation Monitoring indicator
Estimated cost (Ug. Shs.)
Responsibility Timeframe/ frequency
Monitoring Institution
Potential Negative Biophysical and Environmental ImpactsTerrestial habitat
Increased rates of erosion after laying surfaces bare
Construct bunds the edges of sites being opened to control runoff and collect sediment in settlement ponds
Constructed bunds
2,000,000/= during site clearance
TCL site manager/contractor
At opening site Katikekile/Loroo sub-county administration
Topsoil compaction and mixing from site clearance equipmentand vehicles; loss and alteration of habitats
Strip and store topsoil separated from subsoil for later restoration
Piles of soil 1,500,000/= during site clearance
TCL site manager/contractor
Rehabilitation at the end of every pit
Moroto DEOKatikekile/Loroo sub-county administration
Air quality Impairment of air quality from nuisance dust
Wet bare areas during dry conditions
Levels of dust in the air and surrounding vegetation
Quarterly records of measurements of fumes and particualtes
3,000,000/= during site clearance
TCL site manager/contractor
Dowsing everyday
Dust measurement results every four months
Moroto DEOKatikekile/Loroo sub-county administration
Table 4.8 Environmental impact rating and ranking for TCL’s Kosoroi Limestone Quarry
Key environmental impacts identified
Biodiversity & land productivity loss
Vegetation clearance
Fauna impacts (increased human population pressure, habitat loss)
Habitat fragmentation (roads, infrastructures, waste dumps)
Soil disturbance, compaction & erosion
Alien/invasive species
Water impacts
Noise and vibration
Solid waste
Air quality impacts
Visual and landscape impacts
Water abstraction
Surface water contamination
Groundwater contamination
Sewage and wastewater disposal
Greenhouse gas
Dust
Negative
Negative
Negative
Negative
Negative
Unknown
Negative
Negative
Negative
Negative
Negative
Negative
Negative
Negative
Negative
1
1
1
1
1
2
1
2
2
1
1
1
5
1
2
5
5
5
4
5
5
4
4
4
4
4
4
5
4
5
5
3
3
5
4
Unknown
1
1
1
1
4
2
2
4
3
5
4
4
5
3
2
2
2
1
5
5
5
5
5
5
125
60
60
100
60
Not applicable
8
16
8
20
80
40
250
80
150
3
6
6
4
6
10
9
10
8
5
7
1
5
2
Nature A- B- Duration C- Magnitude Probabilty Total Impact Impact of impact Geographic of = A*B*C*D ranking/ extent occurance highest (1) to lowest (8)

56
Table 4.10 Cost estimations for mitigating air quality impacts during the operational phase of TCL Kosoroi Limestone Quarry (Aeon and Muwanga, 2009a)
Category/Issue
Air Quality
Potential Impact
Mitigation Monitoring indicator
Estimated cost (Ug. Shs.)
Responsibility Timeframe/frequency
Monitoring institution
Air pollution from exhaust fumes and vehicular emisions
Ensure vehicles and machinery are always well maintained in the Company workshop
Quarterly records of measurements of fumes and particulates
Record excavator servicing
2,000,000/= per year
Part of routine maintainace
TCL site manager
TCL site manager
Particulates level results every 4 months
Servicing on routine basis
Moroto District Environmental Officer (DEO)Katikekile, Loroo sub-county administration
Moroto District Environmental Officer (DEO)Katikekile, Loroo sub-county administration
Dust level results every 4 months
300,000/= per tarpulin for 20 trucks = 6,000,000/=
3,000,000/= per year for wetting bare areas
Levels of dust in the air and surrounnding vegetation
Cover haulage trucks with tarpulin sheets; wet bare surfaces at site
Dust pollution from trucks carrying limestone to site and along the road from Katikekile to Tororo
Table 4.11 Closure cost estimations for TCL Kosoroi Limestone Quarry (Aeon and Muwanga, 2009a)
Activity Cost (UShs)
Demolition of structures at the site 10,000,000/=
Removing all material (limestone) not transported to Tororo 50,000,000/=
Backfilling pits with stockpiled soil 15,000,000/=
Scarifying and revegetating bare areas with drought resistant trees 50,000,000/=
Removing all machinery and equipment from site 10,000,000/=
In terms of its social spending, TCL disclosed orally that it had made several important contributions to the surrounding communities, including paying for (Aeon and Muwanga, 2009a; Hinton et al., 2011):
• Building1schoolmadeupof2classroomsat+/- UGX 45 000 000 (USD 18 000);
• 1motorcycle for use by a local councillor at+/- UGX 500 000 (USD 200);
• 2000ironsheetsforroofingforatotalUGX20000 000 (USD 8 000);
• Road repairs and maintenance as well asbridge erection at Amudat, Loro and Albamun (UGX 1.5 billion UGX or USD 600 000);
• Schoolfeesfor2childrenforUGX2000000000 (USD 800 000);
• Building a temporary dam for cattle at UGX750 000 (USD 300);
• Providing150mosquitonetsand jerricans tomothers at UGX 5 000 000 (USD 2 000);
• Providing drinkingwater (10 500l permonth)to workers at the Kosoroi office (1 500 l per month) and artisanal miners (9 000l per month) (no cost disclosed);
• ThesalaryofaFirstAiderforartisanalminers(minor injuries) at UGX 200 000 (USD 80)/month (UGX 2 400 000/ year or USD 960/year).
Yet, the development of the TCL Limestome Quarry in Katikekile is also expected to create potential for negative biophysical, socio-economic as well as public health and safety impacts. As explained in great details in the EA report (Aeon and Muwanga, 2009b), many corrective and mitigation measures are required to. These generate external costs on society, and especially local communities; especially if not minimised and/or offset.

Quantified biophysical, socio-economic and public health and safety impacts were limited to (a) GHG emissions due to diesel consumption by an excavator (100 l/day) and (b) the total potential loss of grazing land due to vegetation clearance (5 200 ha of mining area).
Following the same methodology used for the GHG Footprint and Externality Assessment for DML, the research team has found that diesel consumption by the excavator (assuming no change in current fuel use) would emit approx. 1 711 tons of CO2 eq. over its 21 years of operations; with potential costs to society amounting to either 1 711, 17 110 or 256 684 USD based on three hypothetic economic values for GHG externalities (i.e. USD 1/ton, USD 10/ton and USD 150/ton).
Similarly, using the same methodology for assessing the potential total economic value of livestock within TCL’s EL, the potential loss of grazing land (up to 5 200 ha) may lead to the loss of total livestock units varying from 2 600 to 10 400 with an economic value ranging from a minimum of USD 20 800 and a maximum if USD 6 656 000.
As for the CBA of DML, these figures provide only a partial indication of benefits and costs of mining. Much more detailed analysis, based on quality data, would be required to obtain the full picture of Kosoroi Limestone Quarry’s social, economic and environmental benefits and costs.
57
Table 4.12 Minimum and maximum sales for community members selling limestone to TCL at Kosoroi Limestone Quarry
Table 4.13 Minimum and maximum royalties and from TCL’s operations at Kosoroi Limestone Quarry
Minimum
Maximum
Number of
trucks/day
5
20
Price in USD/truck
52
52
Loading fee in USD/truck
7.0
7.0
Total for community/
day
294.8
1179.1
Total USD/individual/
day
0.6
2.4
Total USD/individual/year (300
days)
176.9
707.5
Total USD for
community/year (300
days)
88434.8
353739.1
Total royalties recieved from TLC by DGSM (informal
disclosure)
Total royalty potential
Annual expected royalties
Minimum
Maximum
Royalty in UGX/ton of limestone
Number of tons/day
115
460
Number of tons of limestone
287.5
1150
Royalties in UGX
86250
345000
Royalties in USD
4
5
Districts' share of royalties
(USD)
345000
1725000
Land owners' share of royalties (USD)
Sub-counties' share of royalties
(USD)
USD 615,990
UGX 1,539,974,860
5000 3500000 17500000000 7000000 700000 490000 210000

Notwithstanding these facts and based on our observations, it seems warranted to expect that the full social and environmental external costs of Kosoroi Limestone Quarry will be more significant than that of DML’s Ratta Marble Mine. This is largely because health and safety impacts (e.g. high dust levels, child labour, future use of explosives, no adequate equipment and PPE for artisanal miners) as well as vegetation clearance will occur at a bigger scale. Current levels of social spending do fall short of the labour and social needs as well as of externalities related to residual impacts.
Finally, it is important to note that tensions have arisen as regards to the levels of mechanisation of the TCL mining operations. While artisanal miners do not want any mechanisation whatsoever (i.e. so as to maximise their work and sale opportunities), TCL would like to increase productivity (i.e. via an increase use in machinery and blasting) so as to meet an increasing demand at its cement factory. The current co-existence between TCL and artisanal miners may not be the best option for sustainable development in the area. It leads to a situation where most of the social, labour and environmental impacts and risks are borne directly by artisanal miners while TCL does not maximise its production output.
Yet, this may continue to be acceptable to TCL as it ensures profit maximisation due to minimal (or much reduced) environmental, labour and social input costs. Would TCL have disclosed its future work plans and associated details budgets, it would have been possible to compare 2 development scenarios: (a) the current one versus (b) an alternative one based on mechanisation and a much improved integration of artisanal miners into the project.
4.1.3 Jan Mangal Ltd – CBA of the Nakabat Gold Mine
Presentation of Jan Mangal’s Gold Mining Operations
Jan Mangal Limited (JML) has carried out prospecting and exploration and has found the area covered by the Exploration Licence No. 1001 viable for mining and processing of gold. Accordingly, the company has obtained a Mining Lease for the area which is located in Nakabat Village, Rupa Sub-county, Moroto District. The project intends to provide direct employment to about 400 workers (Muwanga et al., 2012), many of whom should be drawn from the nearest villages of Nakiloro, Kakingol and Lomaris. The projected cost for the plant is about USD 400 000.
The project will involve site clearance to prepare the place for the mining activities as well as opening up access roads, construction of structures for accommodation and operation of the mine and processing of the ore to obtain gold.
The mining plant for gold extraction, “Exp-500”, is a gravity separation plant which uses water during the process. Ore shall be obtained from alluvial deposits and weathered rocks and there shall be no need for drilling or blasting. The plant shall not need any type of chemicals during its entire process as only water is used for beneficiation. In addition, process water is recycled as much as possible.
Material containing the gold is excavated using the open cast method. The material is mined using bucket wheel excavators which load it into dumper trucks which in tum transport it to the plant. The
58
Table 4.14 Estimates of minimum and maximum value of livestock using grazing land at in TCL LL
Ha
5200
5200
5200
TLU/ha
0.5
1.19
2
TLU (a)
2600
6188
10400
Minimum value in
USD (if only sheep or
goats)
8
8
8
Maximum value
in USD (if only cattle)
80
80
80
Total maximum
value in USD
1664000
3960320
6656000
Total minimun value in
USD
20800
49504
83200

59
material is then be dumped into a feed hopper where a heavy duty water cannon washes the gravel. The material then passes on to the grizzly channel towards the second step of machinery called Exp 500. In the process, before going to Exp 500, oversize stones (i.e. >100 mm) are rejectedthrough a rejection channel.
In the second step, Exp 500 rotates the gravel through a large turbine where the gravel is washed withwaterandoversizeparticles(i.e.>25mm)arerejected through a rejection channel. The remaining material is then passed on to two jigs. Jigs finally separate heavy particles through gravity and reject lighter particles and gravel via a secondary jig through a dedicated channel.
Data collection, site visit and legal situation
The research team met with Jan Mangal representatives at their office at Nakabat Gold Mine had access to the Environmental Impact Statement (EIS) report for the Nakabat Gold Mine (Muwanga et al., 2012). Found to be fairly comprehensive, it was nonetheless limited to the listing of potential environmental and social impacts (rather than based on the quantification of actual impacts of proposed mining plans.
Besides, the following documents were requested but were not available (or not made available by JML representatives for confidentiality reasons): capital and operational expenditures, monthly and annual production volumes and sales, Environmental Management Plan (EMP), Health, Safety and Environmental (HSE) plan, mine closure and environmental rehabilitation plan and costing, Mining Plan, annual financial statements, detailed budget forecast (over the life of the Mining lease). The JML could not indicate to the research team any EMP/HSE measures put in place since 2012. This limited significantly the ability of research team to model a CBA.
Though JML is required to obtain various licenses and permits including a Mining Lease from DGSM, an EIA certificate from NEMA, Water Abstraction and Waste Water discharge permits from DWRM and a Safety Permit from DOSH before the expanding its operations, TCL representatives did not provide any proof of obtaining such documents at the time of the site visit (November 20h, 2013) though it as suspected that a ML had been secured.
There is also no indication that formal negotiations over surface and access rights to the mining (approx. 353 ha) and camp (18 ha) area have been finalised in 2013. Besides, what is the legal situation of the ASM community within JML’s ML (e.g. possible land owners)?
Current mechanised gold mining operations at valley floor, showing the roof of gold production plant “Exp. 500” (photo 4.9).

60
Jan Mangal’s office at Nakabat Gold Mine, showing roofs necessitating repairs. Surrounding areas show extensive vegetation clearance, bare soils and presence of pioneer/exotic plant species (photo 4.10).
Machinery used to excavate and transport gold-containing materials (photo 4.11).

61
Machinery used to excavate and transport gold-containing materials in one of the gold mining sites in Moroto (photo 4.12).
Focus group discussions with ASM community members within JML’s ML (photo 4.13).

62
An artisanal miner collecting water from the riverbed for gold mine and/or drinking purposes, despite the presence of JML’s water pipes a few meters away. This form of water collection may not be feasible in the dry season, hence preventing easy gold mining and access to drinking water (photo 4.14).
Gold ASM by community members along a river bed. Plastic basins are commonly used for gold separation. ASM impacts on the functionality and biodiversity of riverbeds may be significant (photo 4.15).

63
Baseline situation
According to the EIS report (Muwanga et al., 2012), key environmental baseline information include:
• Climatic conditions of Moroto District (seeDML case study – section 4.1.1).
• Theareahassomeephemeralstreamswhichtend to dry during the dry ‘season. RiverNakiloro occurs about 1km south of the mine site. The company is drilling a borehole at the site which they use for their operations as well as serving the local communities.
• The area is typically semi-arid with dry treesavannah species and dominating grass species. Some forests patches occur on most of the mountain ranges. Vegetation includes trees (e.g. Acacia hockii, Cassia sp., Euphorbia sp.), shrubs (e.g. Aloe parunari, Bredelia micrantha, Euphorbia candlebrum) and herbs (e.g. Bidens pilosa, Acalypha ornate, Urena rabata) and weeds/grasses (e.g. Achyranthes aspera, Eichnocloa pyramidalis, Hyparrhenia rufa). Native animals occur within the area.
• No species is expected to be threatenedthough more in-depth studies are warranted given the diversity of the topography and associated habitats (personal observations).
Key socio-economic baseline information (besides general socio-economic information about Karamoja) identified in the EIA report (Muwanga et al., 2012) and through stakeholder engagement include:
• Themajoreconomicactivitiesarepastoralism,with cattle herding being predominant.
• Someopportunisticgrowingofcropssuchassorghum, maize and millet.
• Artisanal gold mining is also major activitywithin JML ML, with an ASM community of about 200 people in 2013. The gold they produce is either sold to JML or smuggled to Kenya.
• There is no health and education facilityat or near the site. There is no permanent water access to the ASM community, JML apparently using water as a bargaining tool for gold purchasing.
Table 4.15 Environmental impact rating and ranking for JML’s Nakabat Gold Mine
Key environmental impacts identified
Biodiversity & land productivity loss
Vegetation clearance
Fauna impacts (increased human population pressure, habitat loss)
Habitat fragmentation (roads, infrastructures, waste dumps)
Soil disturbance, compaction & erosion
Alien/invasive species
Water impacts
Noise and vibration
Solid waste
Air quality impacts
Visual and landscape impacts
Water abstraction
Surface water contamination
Groundwater contamination
Sewage and wastewater disposal
Greenhouse gas
Dust
Negative
Negative
Negative
Negative
Negative
Unknown
Negative
Negative
Negative
Negative
Negative
Negative
Negative
Negative
Negative
1
1
1
1
2
2
1
2
2
1
1
1
5
1
2
5
5
5
4
5
5
4
5
5
4
4
4
5
4
5
5
3
3
5
4
Unknown
3
3
3
2
3
3
2
3
5
5
5
5
5
5
3
5
2
2
5
5
5
5
5
5
125
75
75
100
200
Not applicable
60
60
60
40
60
60
250
60
250
3
5
5
4
2
6
6
6
7
6
6
1
6
1
Nature A- B- Duration C- Magnitude Probabilty Total Impact Impact of impact Geographic of =A*B*C*D ranking/ extent occurance highest (1) to lowest (8)

64
Rating and ranking key environmental impacts
Using the content of EIS report, the observations of the research team at Nakabat Gold Mine and our discussions with stakeholders (JML representatives), the main environmental impacts have been identified (i.e. not an exhaustive list) and an environmental impact rating and ranking has been undertaken as per the methodology described in Annex 1 (page 80) of this report. This aims to provide greater clarity on the nature (positive/negative), geographic extent, duration, magnitude and probability of occurrence of the expected environmental impacts of the Nakabat Gold Mine.
According to our environmental impact rating and ranking (Table 4.15), the key environmental impacts for JML Nakabat Gold Mine are: (1) visual and landscape impact + greenhouse gas emissions, (2) alien/invasive species, (3) biodiversity loss through vegetation clearance (over a maximum of 5 194 ha, i.e. 70% of ML can be mined according to JML representatives), (4) soil disturbance and erosion and (5) fauna impacts + habitat fragmentation (e.g. riverbed disturbances). Given the nature of gold mining, water impacts (abstraction, surface water pollution, groundwater pollution) are much more
significant in this case study than that in others involving limestone or marble mining. Overall, the impact rating for most environmental impact categories is much higher for JML Nakabat Gold mine than for that of the other mining case studies.
The majority of impacts will occur during the operations and closing phases of the mine (4 as score for the duration of impact) while the others (e.g. vegetation clearance, greenhouse gas emissions, visual impacts) are all expected to be permanent impacts (5 as score for the duration of impact). This strongly underlines the importance of urgently developing an effective EMP or EHS plan (e.g. wastewater management, alien species control, solid waste management and dust mitigation measures), as well as a properly quantified mine closure and rehabilitation plan and costing (i.e. minimising visual impacts of final landforms, viable ecological restoration striving towards productive habitats for livestock grazing and other ecosystem uses).
For instance, 371 ha (5% of ML) have already been mined (e.g. Photo 4.16) but no restoration or reclamation has yet taken place while no support is given to artisanal miners in that respect (e.g. Photo 4.15).
First gold mining site within JML’s ML. Closure work has yet to start (photo 4.16).

Formal and informal employment at JML Nakabat Gold Mine
As previously explained, JML plans to provide work for about 400 people at Nakabat Gold Mine (Muwanga et al., 2012). Yet, a meeting with JML representatives established that only 30 employees, including 3 women and 8 Indian nationals are currently employed. This falls way short of the expectations and/or initial promises to stakeholders. Ugandan employees earn approx. UGX 800 000/week (UGX 3 200 000/month, that is USD 1 280/month) while Indian nationals earn more than USD 10 000/month.
In addition, about 200 artisanal miners (including children) also operate in riverbeds within JML’s ML. Both JML and members of the associated ASM community claim that JML buys gold from
the artisanal miners operating within JML’s ML. Currently, between 50 and 100 grams of gold are produced in a month (Table 4.16).
Although it is unlikely that JML is the sole buyer (i.e. smuggling through the Kenyan border which is relatively close by), they could be perceived as informal or casual employees of JML. Yet, the company provides no support to ASM community: i.e. no PPE, no tools, no geological expertise, no OHS support, no support/monitoring to ensure that there is child labour, etc. Besides, it appears that the company is using its secure water supply as a bargaining tool with respect to gold price setting. Such as a strategy would be very successful in the dry season (dry riverbeds). Currently, however, the better than average rainfalls have allowed the community to rely exclusively on natural groundwater sources (Photo 4.14).
65
Table 4.16 – Expected minimum and maximum gold sales and uncollected royalties from artisanal miners within JML’s ML in 2013
Minimum number
of grams/month/person
50
Minimun sales/
month/person (UGX)
4000000
Minimum sales/year/
person (UGX)
48000000 9.6E+09
Minimum sales/year/community
(UGX)192000
Minimum uncollected
royalties/community/year (USD, 5% of value
Maximum number
of grams/month/person
100
Maximum sales/
month/person (UGX)
8000000
Maximum sales/year/
person (UGX)
96000000 1.92E+10
Maximum sales/year/community
(UGX)384000
Maximum uncollected
royalties/community/year (USD, 5% of value
Price/gram
(UGX) (1 gram = 10
points)
80000
Number of
artisanal miners
200
Minimum sales/year/
person (USD)
19200 3840000
Minimum sales/year/community
(USD)
Maximum sales/year/
person (USD)
38400 7680000
Maximum sales/year/community
(USD)

66
At this stage, the ASM community appears to be highly nomadic, relying on rainfall for the emergence of new alluvial gold deposits though surface runoff. Its future thus seems to be highly dependent on the success of its relationship with JML. Is there a way to make it more sustainable? As for TCL and its artisanal miners, the current co-existence between JML and its “local gold suppliers” is probably not be the best option for sustainable development. It leads to a situation where most of the social, labour and environmental impacts and risks are borne directly by the gold artisanal miners while JMC does not maximise its production output. Yet, this may continue to be acceptable to JMC as it ensures profit maximisation due to minimal environmental, labour and social input costs.
Assessing GHG Footprint, vegetation clearance (grazing loss) and water pollution externalities
Following the same methodology used for the GHG Footprint and Externality Assessment for DML, the research team has found that diesel consumption (15 000 l/month) and hydraulic oils/lubricants (2 000 l/month) would emit approx. 10 565 tons of CO2 eq. over its 21 years of operations; with potential costs to society amounting to either 10 565, 105 645 or 1 584 680 USD based on 3 hypothetic economic values for GHG externalities (i.e. USD 1/ton, USD 10/ton and USD 150/ton).
Similarly, using the same methodology for assessing the potential total economic value of livestock within TCL’s EL, the potential loss of grazing land (from 371 ha already mined up to 5 194 ha of mining – 70% of ML surface area) may lead to the loss of total livestock units varying:
• In 2013, from 186 to 742 with an economicvalue ranging from a minimum of USD 1 484 and a maximum if USD 474 880;
• AttheendofML(after21years),from2597to10 388 with an economic value ranging from a minimum of USD 20 776 and a maximum if USD 831 040.
As for water impacts, only water abstraction volumes are known to JML: i.e. 10 000l/ hour at 6 hours per day, 300 days a year. That amounts to 18M l/ year and 378M l over 21 years of ML. Due to the lack of water quality monitoring at Nakabat Gold Mine and the lack of wastewater treatment measures and associated costs for mine wastewater in Uganda, it is impossible to calculate a precise estimation of water externalities. Yet, assuming a range of external costs of water pollution in Moroto District between USD 0.1/l to USD 5/l, the potential externality would vary between 37.8M and 1 890M USD.
4.1.4 African Minerals Ltd – CBA of Limestone ASM in Moroto
Presentation of AML’s limestone mining project
African Minerals Limited (AML) holds Location License No. 0148 and Location License No. 0149 covering the two quarry sites for limestone extraction on the outskirts of Moroto Town (min. of 16 hectare). Mining activities are currently manual and involve around 160 miners in pits run by 75 pit “owners” or managers. In other words, mining activities can be considered as ASM with AML playing the role of limestone purchaser or middlemen.
According to Hilton et al. (2011), AML was planning the mechanisation of secondary crushing and the installation of one or more lime production kilns. The company was also pushing for artisanal miners to form a community-based association (CBO), as well as planning to improve HSE conditions and to provide blasting services to help miners break hard rocks. These plans have yet to materialise on November 20th, date of the site visit by the research team.
Site visit, data collection and key economic information
No representative from AML responded to our meeting request, thus further hampering data collection (no grey literature on the mining site was found) and the undertaking of an effective CBA modelling. Nevertheless, a small group of artisanal miners were approached so that minimal production and sales figures could be obtained (Table 4.17).
Yet, it appears that production had stopped for 3 months in 2013 due to payment delays by AML as well as disagreements over limestone price per ton. Indeed, in 2009, the price per ton of loaded limestone has decreased from UGX 6 000 (USD 2.4) in 2008 to UGX 5 556 (USD 2.22) from 2010 due to an 80% increase in truck capacity (from 5 to 9 tons) and a concurrent price per truck increase at a lower rate of 66% (from UGX 30 000 or USD 12 in 2008 to UGX 50 000 or USD 20 in 2010). Clearly, lack of trust prevails among the parties and a new basis for successful cooperation needs to be found.
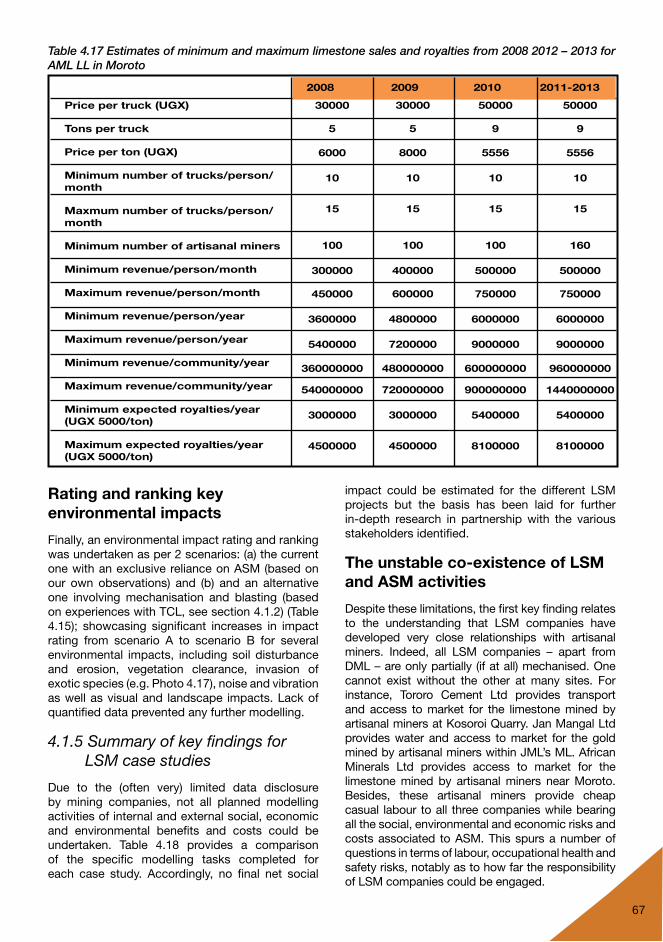
Rating and ranking key environmental impacts
Finally, an environmental impact rating and ranking was undertaken as per 2 scenarios: (a) the current one with an exclusive reliance on ASM (based on our own observations) and (b) and an alternative one involving mechanisation and blasting (based on experiences with TCL, see section 4.1.2) (Table 4.15); showcasing significant increases in impact rating from scenario A to scenario B for several environmental impacts, including soil disturbance and erosion, vegetation clearance, invasion of exotic species (e.g. Photo 4.17), noise and vibration as well as visual and landscape impacts. Lack of quantified data prevented any further modelling.
4.1.5 Summary of key findings for LSM case studies
Due to the (often very) limited data disclosure by mining companies, not all planned modelling activities of internal and external social, economic and environmental benefits and costs could be undertaken. Table 4.18 provides a comparison of the specific modelling tasks completed for each case study. Accordingly, no final net social
impact could be estimated for the different LSM projects but the basis has been laid for further in-depth research in partnership with the various stakeholders identified.
The unstable co-existence of LSM and ASM activities
Despite these limitations, the first key finding relates to the understanding that LSM companies have developed very close relationships with artisanal miners. Indeed, all LSM companies – apart from DML – are only partially (if at all) mechanised. One cannot exist without the other at many sites. For instance, Tororo Cement Ltd provides transport and access to market for the limestone mined by artisanal miners at Kosoroi Quarry. Jan Mangal Ltd provides water and access to market for the gold mined by artisanal miners within JML’s ML. African Minerals Ltd provides access to market for the limestone mined by artisanal miners near Moroto. Besides, these artisanal miners provide cheap casual labour to all three companies while bearing all the social, environmental and economic risks and costs associated to ASM. This spurs a number of questions in terms of labour, occupational health and safety risks, notably as to how far the responsibility of LSM companies could be engaged.
67
Table 4.17 Estimates of minimum and maximum limestone sales and royalties from 2008 2012 – 2013 for AML LL in Moroto
Price per truck (UGX)
Tons per truck
Price per ton (UGX)
Minimum number of trucks/person/month
Maxmum number of trucks/person/month
Minimum number of artisanal miners
Minimum revenue/person/month
Maximum revenue/person/month
Minimum revenue/person/year
Maximum revenue/person/year
Minimum revenue/community/year
Maximum revenue/community/year
Minimum expected royalties/year (UGX 5000/ton)
Maximum expected royalties/year (UGX 5000/ton)
30000
5
6000
10
15
100
300000
450000
3600000
5400000
360000000
540000000
3000000
4500000
30000
5
8000
10
15
100
400000
600000
4800000
7200000
480000000
720000000
3000000
4500000
50000
9
5556
10
15
100
500000
750000
6000000
9000000
600000000
900000000
5400000
8100000
50000
9
5556
10
15
160
500000
750000
6000000
9000000
960000000
1440000000
5400000
8100000
2008 2009 2010 2011-2013

68
Table 4.18 Environmental impact rating and ranking for scenario A (ASM) and B (mechanisation and blasting) at AML LL in Moroto
Table 4.19 Comparison of the specific modelling tasks completed for each case study
Key environmental impacts identified
Biodiversity & land productivity loss
Vegetation clearance
Fauna impacts (increased human population pressure, habitat loss)
Habitat fragmentation (roads, infrastructures, waste dumps)
Soil disturbance, compaction & erosion
Alien/invasive species
Fires
Water impacts
Noise and vibration
Solid waste
Air quality impacts
Visual and landscape impacts
Water abstraction
Surface water contamination
Groundwater contamination
Sewage and wastewater disposal
Greenhouse gas
Dust
Negative
Negative
Negative
Negative
Negative
Unknown
Negative
Negative
Negative
Negative
Negative
Negative
Negative
Negative
Negative
Nature A- B- Duration C- Magnitude Probabilty Total Impact Impact ranking/ of impact Geographic of =A*B*C*D highest (1) to lowest (8) extent occurance
Scenario A-
current ASM
Scenario B- mecha-
nisation
Scenario A-
current ASM
Scenario B- mecha-
nisation
Scenario A-
current ASM
Scenario B- mecha-
nisation
Scenario A-
current ASM
Scenario B- mecha-
nisation
Scenario A-
current ASM
Scenario B- mecha-
nisation
Scenario A-
current ASM
Scenario B- mecha-
nisation
Scenario A-
current ASM
Scenario B- mecha-
nisation
1
1
1
1
1
2
1
2
2
1
1
1
5
1
1
1
1
1
1
1
2
1
2
2
1
1
1
5
1
2
5
5
5
4
5
5
4
4
4
4
4
4
5
4
5
5
5
5
4
5
5
4
4
4
4
4
4
5
4
5
3
2
2
2
3
1
1
1
1
3
1
1
2
2
5
3
3
4
5
2
2
2
2
5
2
2
4
4
Unknown
5
1
2
2
5
2
1
1
1
1
2
2
5
4
4
5
2
3
4
5
3
2
2
2
3
5
4
5
5
5
75
10
20
16
75
4
8
8
4
24
8
125
32
40
125
30
45
64
125
16
32
32
24
100
32
250
80
200
Not applicable
2
8
6
7
2
10
9
9
10
5
9
1
4
3
3
9
7
6
3
11
8
8
10
4
8
1
5
2
Modelling task undertakenMining African Jan Mangal Ltd Tororo Dao Marble Ltd company Minerals Ltd Cement Ltd
A Initial positive No information No information No information Yes, sufficient economic impacts disclosed disclosed disclosed information
B Direct, indirect Not enough data Not enough data Not enough data Yes, support of and induced positive (from A) (from A) (from A) artisanal miners economic impacts (free waste rocks) + modelling based on assumptions rather than actual Ugandan SAM and associated impact multipliers
C Direct external None identified Potential livestock Potential livestock Potential livestock economic (opportunity) value loss value loss value loss costs
D Indirect and induced Not enough data Not enough data Not enough data Not enough data external economic (from C) (from C) (from C) (from C) (opportunity) costs
E Internal social costs Partial information, limited Partial information, limited Partial information, limited Partial information, limited to potential limestone supply gold supply costs from to potential limestone supply to wages and compensation costs from artisanal miners artisanal miners from artisanal miners for the surrender of surface rights
F Internal environmental No information No information No data disclosed - No information costs disclosed disclosed estimations of potential EMP/ disclosed HSE plan/reclamation implementation costs
G External social costs Not enough data (no social Not enough data Not enough data Not enough data impact assessment) (unquantified and (unquantified and (unquantified and incomplete social impact incomplete social impact incomplete social impact assessment) assessment) assessment)
H External environmental Not enough data Partial information, limited Partial information, limited Partial information, limited costs (from F) to simple GHG Footprint to simple GHG Footprint to simple GHG Footprint and water pollution externality externality assessment externality assessment assessment models model model
I Internal project financial No information No information No data disclosed No information viability disclosed disclosed disclosed
J Net social economic Not enough data Not enough data Not enough data Not enough data impacts of project (A to I) (A to I) (A to I) (A to I)

69
Interestingly, DML, at Ratta Marble Mine, came to an agreement with local community members involving the free access to waste marble rocks by the latter. This practice can be considered as quite progressive32 and conductive to good relationships with community members, provided fair benefit-sharing practices among beneficiaries occur and no impacted stakeholder has been excluded from the (informal?) arrangement.
Lack of environmental impact quantification, monitoring and management systems, widespread non-compliance
Vegetation clearance, landscape and visual impacts, dust, soil erosion and GHG emissions were some of the main environmental impacts identified for the case studies. JML Nakabat Gold Mine has greater (potential) water impacts than other mines (due to the nature of gold mining which requires lots of water to separate gold from waste materials), while DML Ratta Mine’s impacts were essentially limited to landscape/visual impacts and TCL Limestone Mine’s key issues relate to dust, soil erosion, noise and vegetation loss. In all cases, the lack of effective EMP, HSE plans, closure plans and dedicated budgets prevented the LSM companies internalising environmental externalities as much as possible. Yet, as shown by TCL’s Environmental Audit report, there is scope to rectify the situation in most cases as LSM activities have been occurring for a limited periodoftime(e.g.<2yearsforDML,1yearforJML, 4 to 5 years of mining for TCL and AML).
Is LSM sustainable in Karamoja?
Based on the literature review, the observations of the research team and the limited CBA undertaken all concur to indicate that Dao Marble Ratta Mining Project could potentially generate net overall positive impacts, provided DML properly costs and implements its legally-required EMP, HSE programme and closure plan. The situation is highly likely to be less positive for the other LSM case studies, especially for JML and TCL, due to the potential scale of mining activities, the associated loss of biodiversity and landscape amenities, and the unsustainable relationships with artisanal miners. Targeted integrated interventions would be required to make these LSM companies and the associated ASM communities work in tandem towards generating net positive impacts for Karamoja region.
32 i.e. sharing value-creation rather than paying for cheap casual labour – though this approach could be difficult to implement in gold and limestone mining sites due to the lack of useful co-products.
4.2 Case studies of Artisanal and Small-scale Mining (ASM)
As explained by Hinton et al. (2011), extra-legal or informal gold miners may number up to 18 000 Karamojongs which engage in mining seasonally, depending on rainfall and security conditions. Methods are extremely manual, typically including pits, shafts and tunnels dug with sticks, in some cases iron rods, while if gold is associated with hard rock (e.g. in quartz veins) rather than alluvial deposits, rock is ground to fine powder using grinding stone or pounded using hard rocks. Separation of gold from waste minerals is done either by plastic basins or calabashes.
Miners expose themselves to a number of occupational risks including chronic exposure to dust and heat (sun scorching), accidents involving flying rock fragments, falling debris and collapse of open pit walls or underground tunnels leading to loss of life (Ngabiirwe et al., 2012). “Wildcat pitting” renders livestock grazing and free passage of humans difficult, if not impossible, at ASM sites because of the risk of falling into pits. A typical artisanal small-scale gold mining day begins at dawn (5am) and ends at 2pm.
According to Hinton et al. (2011), gold selling prices range from UGX 55 000 (USD 22) to UGX 70 000 (USD 28) per gram (compared to UGX 68000 - 75 000 per gram or USD 27.20 - 30 per gram in Bushenyi District) and is mainly sold to buyers from Teso, Kampala and to a lesser extent Somalia. Pricing seems fairly reasonable considering the distance from Kampala and security issues while more formal, structured buying should, practically, provide prices closer to UGX 75 000 – 85 000/USD 30 - 34.
ASM in Karamoja is often practised as an entire family’s survival strategy involving the husband, wife(s) and children. On many days, artisanal miners yield little if any gold from non-producing pits. However, even when production is small, based on seasonal variations in production, miners are estimated to earn between 2 000 to 6 000 UGX/person/day (0.8 to 2.4 USD/person/day) in the dry season but can earn up to 6 000 to 70 000 UGX/person/day (2.4 to 28 USD/person/day) (or much more) in the rainy season. At some gold sites up to 90% of miners are women.
Because ASM is largely informal and unlicensed (and in many cases undertaken seasonally to supplement agricultural livelihoods), contributions to mineral production and local economies are not captured in official statistics. Artisanal miners rarely receive adequate, if any, support to formalise and improve their activities in order to realise its full development potential. Artisanal miners face major challenges in

70
formalising and licensing their activities, largely due to challenges related to bureaucracy, cost, literacy, and also the lack of perceived benefits of doing so33. Exploration companies often use the presence of artisanal miners as an indication of mineral potential and, therefore, availability of “free” areas for licensing poses an additional challenge.
For the purpose of this study, two gold ASM case studies have been selected, i.e. gold mining taking place in Rupa sub-county and Acherer. The goal was to assess the economic benefits generated by gold mining though the direct engagement of community members (focus group discussions). As expected, while information collection focused on data expenses for LSM case studies, sales data for the primary sources of information in the case of ASM.
Due to a lack of environmental and social monitoring, no data on such issues could be collected and no modelling of externalities could be undertaken. Besides, no additional impact rating and ranking was undertaken as it would be very similar to that of scenario A (exclusive reliance on ASM) of AML LL at Moroto (see Table 4.15 in section 4.1.4).
However, ASM in Karamoja, including the two case studies thereafter, appear not to make use of semi-mechanical techniques that use dredges, water pumps, hoses and vacuums to remove topsoil, riverbed sediments and riverbanks. The use of mercury is also not a major issue in artisanal gold mining in the selected case studies.
4.2.1 Gold artisanal mining at Rupa sub-county
Approximately 20 members of the gold ASM community at Rupa were encountered close to a road north of Moroto on November 20th. Due to the language barrier and the probable lack of trust, limited information was collected. Socio-economic conditions were similar to those of the DML Ratta Mine case study (Moroto Disrict).
The informants encountered were mining gold at the soil surface and their future plans after exhausting their current mining site remain unknown. They are likely to migrate to another one. But for how long such soil surface deposits will last?
Informants estimated total population involved in gold mining at Rupa stands at about 8 000 in 2013, with each person finding 2 to 3 points per day (UGX 8 000/point) and widespread child labour. Based
33 Why should artisanal miners pay for the cost of obtaining a Location License and the ensuing mineral rent and royalties?
on this basic set of information, our estimates of minimum and maximum gold sales in 2012 – 2013 for the Rupa community do not depict income poverty (Table 4.20). Yet, the lack of public services (e.g. roads, water access, health and educational facilities), apart in Moroto town itself, tend to bring support to the idea that community revenues are not saved and that investments into private and communal facilities are most likely inexistent.
Moreover, the environmental impacts of ASM could readily be seen as a mosaic of cleared patches and pits. As expected, no active environmental restoration work is undertaken, though natural passive succession seems to occur at several sites probably to the proximity to natural vegetation (patchwork of soil disturbances). The emergence and, at some sites, the preponderance of invasive exotic species is of particular concern, as it may prevent the vegetation from reaching its full potential for different ecosystem uses (e.g. unpalatable species for grazing such as Agave species).
4.2.2 Gold artisanal mining at Acherer village
Approximately 30 members of the gold ASM community at Acherer village were met on November 21st. Community members come from multiple clans and ethnic groups, including the Pokot, Matheniko, Tapeth and others across Karamoja as well as from Teso, Western Uganda and as far away as Rwanda and the Democratic Republic of Congo. All of them are residing together relatively peacefully, despite seemingly extreme living conditions. Gold mining activities apparently follow specific drainage patterns over a distance of 4 to 10 km (informants could not be accurate) and with a width varying from 30 to 100 meters. No water is available at the mining sites – i.e. at least 3 km walking distance from a water pump.
Estimated minimum and maximum sales were estimated in details for 2012 -2013 (Table 4.18), while population trends and gold prices from 2009 are depicted in Table 4.19. The Acherer community appears highly unsustainable given current gold production levels and the concerns voiced by several community members that they might have to move to a new site next year. If the numbers disclosed by community members for 2009 are true, one would have expected a minimum of USD 31M and a maximum of USD 94M of gold sales from ASM at Acherer during that year; which constitute impressive figures and makes one wonder where the money has been spent (i.e. clearly not at Acherer).

71
Table 4.20 Estimates of minimum and maximum gold sales in 2012 – 2013 for the Rupa community
2012 -2013People
8000
Maximum number of points/day/
person
3
Maximum number of points/day/
person
2
Price of 1 point (UGX)
8000
Maximum sales
per day/person (UGX)
24000
Maximum sales
per day/person (UGX)
16000
Maximum sales per
day (overall) (UGX)
192000000
Minimum sales per
day (overall) (UGX)
128000000
Maximum sales per month (20
working days) (UGX)
3840000000
Minimum sales per day (20
working days) (UGX)
2560000000
Maximum sales per
year/Rupa community
(UGX)
46080000000
Minimum sales per year/Rupa
community (UGX)
30720000000
Maximum sales per
year/person (USD)
2304
Minimum sales per
year/person (USD)
1536
Uncollected royalties (5% of value, in
USD)
921600
Uncollected royalties (5% of value, in
USD)
614400
One of three Agave sp. invading AML’s Location Licenses in Moroto. These species originate from Mexico. Though some species may yield beneficial products (e.g. sisal), they are unpalatable to livestock. No control of their natural expansion currently occurs at the patchwork of small limestone quarries (photo 4.17).

Besides, apart from marginal agriculture (for local household consumption) and a new watermelon agricultural venture over a few hectares, no other alternative livelihood seems to occur at Acherer (i.e. no livestock due to past theft). In addition, there is yet to be a district plan and budget for the village at the date of the site visit. No investment in community facilities and infrastructures was noticed, child labour is widespread and improper behaviour due to alcoholism at 9am was unfortunately not surprising. Both indicate a community culture based on the lack of savings and wasteful expenditures.
Adding environmental degradation to this sad situation (from uncontrolled vegetation clearance, soil disturbance/erosion and waste generation), all the aforementioned points do not bode well for the future of the Acherer community.
4.2.3 Key findings from ASM case studies
Given the minimum of USD 614 400 and maximum USD 921 600 of annual uncollected royalties (Table 4.12) at Rupa, the minimum of USD 3 600 and maximum USD 9 000 of annual uncollected royalties at Acherer (Table 4.13) and the seasonal
and nomadic nature of their gold mining activity (see population trends at Acherer – Table 4.14), one wonders what would be the benefits for those ASM communities to formalise community-based organisations and register Location Licences with DGSM. Given the limited timeframe within which ASM activities take place in a specific piece of land (e.g. potentially less than 6 years at Acherer), there seems to be no immediate benefit to do so.
This spurs the following question: Are Location Licences adapted to seasonal and nomadic mining in Karamoja, especially for isolated communities almost exclusively relying on ASM?34 Given the lack of guarantee in terms of public service delivery (health, water, education, security), the uncertainty of future gold resource availability at sites potentially subjected to LL applications (limited geological skills among artisanal miners) and the lack of clear sustainable alternative livelihoods (especially at Achere), innovative intervention strategies would need sought and implemented if we were to stop unsustainable mining practices that lead to natural capital degradation, but without the expected increases in human and financial capital at the local community.
34 Rupa artisanal miners may have better access to alternative livelihoods given their relative proximity to Moroto.
72
Focus group discussions between artisanal miners and the IUCN research team at Acherer (photo 4.18).

73
Table 4.21 Estimates of minimum and maximum gold sales in 2012 – 2013 for the Acherer community
2012 -2013
Groups of 4 people
75
Maximum number of points/day
5
Maximum number of points/day
2
Price of 1 point (UGX)
5000
Maximum sales
per day/person (UGX)
25000
Minimum sales per day/group
16000
Maximum sales per
day (overall) (UGX)
1875000
Minimum sales per day
(overall)
750000
Maximum sales per month (20
working days) (UGX)
37500000
Minimum sales per day (20
working days)
15000000
Maximum sales per year
(UGX)
450000000
Minimum sales per year
180000000
Maximum sales
per year/community
(USD)
180000
Minimum sales
per year/community
(USD)
72000
Uncollected royalties (5% of value, in
USD)
9000
Uncollected royalties (5% of value, in
USD)
3600
Table 4.22 Trends in population and gold production from 2009 for the Acherer community
2009 2010 2011 2012 2013
Number of people
Price of point (UGX)
Minimum number of
points per day
Maximum number of
points per day
1300
8000-10000
97500
32500
1300
8000-10000
6500
2600
800
8000
4000
1600
500
8000
2500
1000
300
8000
0
600

74
5. CONCLUDING REMARKS AND RECOMMENDATIONS FOR IMPROVING THE SUSTAINABILITY OF ASM AND LSM IN KARAMOJA
• Theapparent lackofpracticalandimmediatedisincentives for non-compliance and, conversely, incentives for compliance.
To ensure that economically, socially and environmentally responsible and equitable mining mining activities occur in the future in Karamoja, a number of key interventions need to be urgently implemented.
The 24 recommendations presented in this final section of the report are divided into three groups:
1. Building up ecosystem accounting and integrated land-use planning capacity while ensuring free access to information;
2. Promoting and ensuring sustainable LSM practices;
3. Providing tangible support to ASM communities for sustainable diversified livelihoods
LSM is nascent in Karamoja and it relies heavily on ASM communities, with partial (and sometimes no) mechanisation of mineral resource extraction processes. This reliance may be explained either by a deliberate business strategy which strives to minimise capital and operational expenditure in the initial years (e.g. possible option for AML and JML) or by alleged ongoing pressures from ASM communities which aim to ensure maximum casual labour opportunities (e.g. AML, TCL). Notwithstanding this situation, all LSM and ASM case studies pinpoint to the (almost) complete disregard of environmental regulations, OHS standard practices and human rights. This can be explained by a combination of reasons, including but not limited to:
• Lack of awareness from ASM communities,LSM companies and their stakeholders,
• Human resources and skills shortagesfor monitoring, auditing and compliance enforcement at all relevant local government levels,
Gold artisanal and small scale miner along a river bed.

75
5.1 Building up ecosystem accounting and integrated land-use planning capacity while ensuring free access to information
The following recommendations aim to provide all stakeholders with the right sets of tools and information about Karamoja’s natural capital (including water, land and mineral resources), land uses and new developments so as to make informed decision around livelihood scenarios. They also aim to empower local communities in biodiversity management and improve the effectiveness, protection status and long-term viability of all forms of protected areas in Karamoja.
1-1 To develop and sustain physical and monetary ecosystem accounts and maps for all key natural capital assets (habitats, water, soils, key species, minerals, ecological infrastructure such as mountain catchment, wetlands and rivers, etc.), and hence of key ecosystem services sources, trajectories and delivery areas as well as actual and potential conflicts over land use.
1-2 To integrate ecosystem accounting principles and data into all key decision making and management fora and/or processes, such as environmental impact assessment processes (EIA, EMP, closure plans), protected area expansion/planning and town planning policies and documents.
1-3 To develop and sustain a multi-stakeholder platform for discussing, informing and enabling land use decision making processes and new livelihood opportunities in the region, making active on-going use of information about physical and monetary ecosystem accounts and maps.
1-4 To review the socio-ecological robustness of protected area (PA) networks in Karamoja (representativeness of biodiversity patterns and processes, protection level against threats, management effectiveness), taking into account adjacent ones in neighbouring Ugandan districts, Kenya and South Sudan, and to develop an new PA strategy and business plan.
1-5 To empower with local communities (including ASM) as regards to natural capital stewardship through the granting of property rights (usus and fructus, but not abusus) over wildlife, water, soils and other key natural resources towards the creation of communal conservancies which core mandate would be economic and human capital development through the conservation and sustainable use of biodiversity conservation.
1-6 If mining is still allowed in certain categories of PA (after the implementation of recommendation 1.4), to develop and mainstream an effective and practical Ugandan quantitative methodology (in ecological terms, with the associated financial implications) for assessing and ensuring biodiversity no-net-loss with respect to the surrendering of surface rights within protected areas (national parks, wildlife and forest reserves) due to mining and other developments, as per international impact mitigation and biodiversity offset standards, principles and best practices (BBOP 2012).
1-7 To identify, finance and implement a business strategies for maximising the legalisation of trade in minerals where tax evasion and black markets prevail (i.e. gold, gemstones), involving direct government intervention (e.g. through the setting-up of an independent organisation whose core mandate is to be the exclusive purchaser of such metals) and close cooperation between Kenya, South Sudan and Uganda (i.e. the aforementioned organisation could operate in all countries involved).
1-8 To enable and sustain free access to information about natural capital status and trends, current land-uses/business activities as well as new projects, developments and/or policies.
Recommendation 1-1 would involve reviewing available information, identifying key data gaps and investing in targeted data collection and the associated supporting tools (database, software and hardware) and resources (local human capacity building, international technical support, account use mainstreaming). Various initiatives worldwide may be used as models to be adapted to local conditions, including the work by the European Environment Agency and its partners on land and ecosystem accounting35 and that spearheaded by the World Bank which is entitled Wealth Accounting and Valuation of Ecosystem Services (WAVES)36 and currently involves several African countries, including Botswana, Madagascar and Rwanda.
35 Accessed December 12, 2013: http://www.eea.europa.eu/themes/landuse/interactive/land-and-ecosystem-accounting-leac; http://ipbes.unepwcmc-004.vm.brightbox.net/system/assessment/75/references/files/209/original/An_experimental_framework_for_ecosystem_capital_accounting_in_Europe.PDF?1349950134 ; http://www.cbd.int/doc/meetings/development/egm-bped-02/presentation/Mauritius_Ecosystems_Accounts.pdf
36 Accessed December 12, 2013: http://www.wavespartnership.org/waves/;http://www.un.org/esa/ffd/ecosoc/springmeetings/2012/Waves_Feb2012.pdf

76
However, great care must be taken in making sure that:
• All key localnaturalcapitalassetsare takeninto account (i.e. water quantity and quality, water recharge capacity, ,
• The natural capital accounts and maps areusable at the relevant local scale,
• Theoverarchingpolicybebasedonaccountingfor annual losses or gains in ecosystem accounts (assets, stocks, flows of ecosystem services) towards ensuring their long-term maintenance,
• Thedatacollectioneffortsshouldfocusfirstondeveloping physical accounts of high quality,
• The development of monetary accountsinvolves continuous stakeholder engagement and be primarily focused on replacement and restoration costs so as to account for the costs of replacing natural capital lost (i.e. based on the aforementioned overarching policy).
Recommendation 1-2 aims at ensure that all key natural capital assets, ecological infrastructure and ecosystem services are maintained and/or restored and this by making sure all development interventions do not impact negatively on them overall. This would constitute the most important application of the natural capital physical and monetary accounts advocated in recommendation 1-1. This should be made mandatory by law37.
Recommendation 1-3 aims to bridge information gaps between stakeholder groups. Because ecosystem stewardship is best done by those depending on such ecosystems, it is critical that all Karamojongs communities:
• Understand the need for natural capitalaccount and maps,
• Understandhowtomakeuseofthem,
• Participate in discussions regarding uses ofnatural capital, including the identification of new livelihood opportunities and decision making processes involving competing land uses such as mining versus agro-pastoral activities and wildlife ranching.
37 A law to incorporate the value of natural capital in development planning was introduced in the Costa Rica legislature by MP Alfonso Pérez Gómez in late November 2013. If passed, the Government and the private sector would need to incorporate relevant natural capital data and its economic importance into proposed project plans. Accessed on December 20, 2013: http://www.wavespartnership.org/waves/costa-rica-introduces-law-mandate-valuation-natural-capital
Recommendations 1-4 and 1-5 aims to ensure that the core critical biodiversity/natural capital assets of Karamoja are secured in the long term, but this time in partnership with local communities (as opposed to the PA legacy of Karamoja; Rugadya et al., 2010). The new PA strategy and business plan should make intensive use of community-based conservation, wildlife ranching and eco-tourism models38 that have been so successful at providing sustainable income, jobs, community and human capital development in other African countries. A particular relevant model would be Namibia’s communal conservancies39 where similar livelihoods (pastoralism) and ecosystem conditions (very dry environments) prevail and where direct control over wildlife and business opportunities were given back to communities (Brown and Bird, 2010) with the technological support of NGOs and government (e.g. for negotiations with hunting and safari operators; Weaver and Petersen, 2008).
Recommendation 1-6 is a critical step to avoid losing key biodiversity and natural capital areas due to mining. Notwithstanding that PA (national park, wildlife and forest reserves) should be designed for the core purpose of protecting biodiversity against development threats such as mining (as per the IUCN Protected Areas Categories System40), there may be cases where mining potential in PA may be too high to ignore or turn down. Nevertheless, there is no excuse not to ensure that there is at least no-net-loss of biodiversity and potentially a net gain via the application of the impact mitigation hierarchy (Figure 5.1). Applying the BBOP Offset Standard (2012)41 to such cases is more than warranted. The goal would be to ensure that all residual impacts of mining in PA are offset by appropriate offset measures according to the BBOP Offset Standard principles. For instance, typical monetary payments for compensating the surrendering of surface rights (i.e. in case of communal ownerships, not public lands obviously) would not be appropriate in this context and would probably merely constitute additional conservation outcomes (e.g. to help UWA or other relevant governmental departments improve their management capacity for the impacted PA).
38 “Discover Namibia’s Communal Conservancies where local communities conserve their natural resources and collaborate with world-class establishments to offer authentic travel experiences.”: http://www.namibiawildlifesafaris.com/
39 Accessed December 12, 2013: ftp://ftp.fao.org/docrep/fao/010/aj114e/aj114e10.pdf; http://worldwildlife.org/places/namibia; http://e360.yale.edu/feature/an_african_success_in_namibia_the_people_and_wildlife_coexist/2403/; http://www.nacso.org.na/SOC_profiles/Namibia's%20Communal%20Conservancies.pdf
40 Accessed December 12, 2013: http://www.iucn.org/about/work/programmes/gpap_home/gpap_quality/gpap_pacategories/
41 Accessed December 12, 2013: http://bbop.forest-trends.org/pages/guidelines

77
Figure 5.1 The impact mitigation hierarchy and no-net-loss/no-net-impact principles applied to natural capital (NC) accounting, notably for the development of NC Statement of Performance (over one reporting period) and Position (over time, for at least 1 reporting period) (Houdet et al., In Press; adapted from BBOP, 2012 ; Germaneau et al., 2012)
Finally, recommendation 1-7 aims to make sure GoU and Karamojongs maximise value-creation and equitable revenue-sharing opportunities from the mining of gold and other gemstones. There are many ways to ensure cost-effective revenue management from mining or oil & gas production (Hailu et al., 2011), yet we suggest that a radical solution be adopted and trialled: I.e. setting up an independent non-governmental Ugandan
agency (or inter-country agency – i.e. operating at least in western and northern Kenya as well), with representatives on the ground, whose core mandate would be to be the exclusive purchaser of gold and other similar gemstones from both LSM and ASM, so as to ensure that ASM communities get fair prices for their minerals and minimise royalty payment evasion. Another core mandate of the organisation would be to generate visible
Gains/positive
Potential impacts Avoidance and reduction management measures
Potential offset and additional conservation measures
No-net-loss/no-net-impact
Avoidance and reduction
Offsets
Additional conservation measures
GHG emissions
Biodiversity
Water Footprint
Ecosystem services
Loss/negative
GHG emissions
Water FootprintWetlands
Net impacts in Year 1
Net impacts in Year 2
Net impacts in Year 3
Accumulated net impacts from years
1 to 3

78
sustainable development in the regions where gold is produced, from social and human capital development to the financing of sustainable ASM and LSM mining practices. Making sure opportunities for corruption are minimised would be a challenge for such an organisation however.
5.2 Promoting and ensuring sustainable LSM practices
The following recommendations aim to improve the governance, economic, environmental and social performance, compliance and accountability of LSM companies in Karamoja.
2-1 To build human capacity and financial resources for monitoring environmental, labour and human rights issues at all LSM sites.
2-2 To implement, introduce and/or enable appropriate financial incentives and disincentives to maximise environmental, social and human rights compliance by LSM companies.
2-3 To enable the formalisation of just and fair working relationships between LSM and ASM, ensuring win-win outcomes for both parties.
2-4 To develop transparent and practical methods for assessing the financial values (and associated performance requirements) of the surrendering of surface rights by land owners, to provide technical support for their effective implementation and to change the Mining Act so that the payment for the surrendering of surface rights does not prevent the landowner from receiving royalties.
2-5 To develop transparent and practical methods and guidelines for assessing the closure, decommissioning and rehabilitation costs of mining sites, and to and to provide technical support for their effective implementation concurrently to mining operations.
2-6 To develop, draft and train stakeholders on transparent and practical methods and guidelines clearly differentiating corporal social spending and corporate social responsibility.
2-7 To develop, make legally binding and implement an integrated reporting framework (disclosing annual sustainability and financial performance) for LSM companies in Uganda, with pilot-tests in Karamoja.
2-8 To ensure that Uganda implements all relevant steps towards becoming an Extractive Industries Transparency Initiative (EITI) candidate country, including amending its Public Finance Bill so as to provide for full disclosure of government revenues from natural resources on a project-by-project reporting basis, establishing a multi-stakeholder group to oversee the implementation of the EITI and ensuring that this multi-stakeholder group maintains a regularly updated workplan, fully budgeted and aligned with the reporting and validation deadlines established by the EITI Board.
2-9 To enable and sustain free access to all LSM social and environmental information, including but not limited to EIAs, EMPs, closure plans, audits, and annual financial statements and sustainability reports (as per recommendation 2-7).
Recommendations 2-1 and 2-2 aim to significantly change the status quo a regards to LSM compliance to environmental and OHS regulations. With specific reference to TCL’s operations (Kosoroi Limestone Quarry in Katikelike) where an environmental audit was carried out (Aeon and Muwanga, 2009b) and meaningful corrective measures have yet to take place, effective means of enforcing environmental and OHS regulations need to be sought. Among possible complementary measures are the following:
• To implementmeaningful fines (may need toreview current legal framework) no later than 3 months after audit findings of non-compliance;
• Criminalisingoffenses for companyCEOanddirectors;
• Stoppingoperationswhereappropriate;
• Providing tax incentives for appropriate andswift environmental and OHS expenditures such as corporate tax credits.
Recommendation 2-3 aims to open the debate about relationships between LSM and ASM and find appropriate win-win solutions which would (a) minimise casual labour exploitation, (b) maximise mining production output and efficiency and (c) ensure environmental stewardship for entire ML and LL areas (i.e. so as to avoid the current situation where artisanal miners are held responsible for environmental degradation and decommissioning costs by LSM companies).
Recommendations 2-4 to 2-6 aim to produce building up capacity and mainstream the right set of tools for ensuring and demonstrating sustainable mining practices.

79
More specifically:
• For recommendation 2-4, attention should be given to accounting for natural capital and associated ecosystem services (SCBD, 2013), making use of relevant quantitative physical accounting models (e.g. simple water balances) and relevant economic valuation tools, with a preference for restoration and replacement costs models.
• Forrecommendation 2-5, involved stakeholders should make intensive use of available guidelines for the rehabilitation of mines (e.g. Chamber of Mines South Africa/CoalTech, 2007) and the assessment of closure costs (e.g. Department of Minerals and Energy, 2005) from other countries, such as Australia and South Africa. The key issues to address should include, at least, the follow aspects: rehabilitation planning, permitting and financing, land preparation for mining, soil stripping, soil stockpiling, infrastructure removal, landform changes resulting from high extraction mining, the associated environmental impacts and their remediation), landform re-creation (spoil shaping), soil replacement, soil amelioration, re-vegetation and biodiversity re-establishment, rehabilitation monitoring, biodiversity offset implementation, management system during mining (i.e. how to ensure that processes remain on track between construction and closure), final closure planning, and legal compliance.
• For recommendation 2-6, involved stakeholders should make intensive use of (and adapt) all relevant international sustainability framework, disclosure and or reporting standards, guidelines and best practices, including but not limited to the Global Reporting Initiative’s guidelines42 (including sector guidance on mining and metals43) and the ICMM Sustainable Development Framework44. At a minimum, the proposed transparent and practical methods and guidelines for corporal social spending and corporate social responsibility should include the following issues: corporate governance, stakeholder engagement processes and outcomes, economic performance, social expenditure and tax contributions, labour and human resources, environmental performance, supply chain and product sustainability.
42 Accessed December 12, 2013: https://www.globalreporting.org/reporting/g4/Pages/default.aspx
43 Accessed December 12, 2013: https://www.globalreporting.org/reporting/sector-guidance/sector-guidance/mining-and-metals/Pages/default.aspx
44 Accessed December 12, 2013: http://www.icmm.com/our-work/sustainable-development-framework
5.3 Providing tangible support to ASM communities for sustainable diversified livelihoods
The following key recommendations aim to improve the economic viability and the governance, economic, environmental and social performance, compliance and accountability of ASM communities in Karamoja.
3-1 To build human capacity and financial resources for monitoring environmental, labour and human rights issues at all ASM sites.
3-2 To implement, introduce and/or enable appropriate financial and legal incentives to maximise ASM formalisation as well as environmental, social and human rights compliance.
3-3 To provide the technical and financial support for ASM communities to formalise and better organise themselves for negotiation purposes, mineral resource identification, extraction, marketing, business planning and finding appropriate ways to invest back into their communities.
3-4 To provide secure and fair market opportunities for all ASM communities, with a special emphasis on minerals subject to tax evasion and black market conditions (i.e. gold, gemstones) due to difficulties in monitoring production outputs (i.e. low volumes that are easy to hide and transport).
3-5 To provide and sustain support for improved health, education and alternative livelihood opportunities at ASM sites, especially those that are isolated such as Achere.
3-6 To enable and sustain free access of ASM communities to all relevant information about their natural capital, current land-use and potential new ones (including LSM), as per recommendations 1-8 and 2-8.
Recommendation 3-1 may involve supporting and training additional human resources at local government level (e.g. natural resource officers) as well as within ASM communities themselves (i.e. to gain local support). For recommendation 3-2, we would suggest that all or most fees and taxes from ASM received by the GoU should be invested back directly into ASM communities to support environmental and OHS best practices as well the development of public services (e.g. education and health facilities) and alternative livelihood opportunities. Furthermore, recommendation 2-3 would strive to reduce the risks that artisanal miners face, notably for identifying viable mineral resource and avoiding work-related accidents. Finally, recommendation 3-4 should be seen in tandem with recommendation 1-7 while recommendation 3-5 is directly linked to recommendations 1-3 and 1-5, notably in terms of providing support for the design, implementation and management of communal wildlife or biodiversity conservancies.

Annex 1 – Impact rating and ranking criteria
80
Criteron Criterion Options Interpretation Score
Direction
Geographic extent
Duration
Magnitude
Probability of Occurance
Positive Positive impact on variable Not Applicable
Negative Negative impact on variable Not Applicable
Neutral No impact on variable Not Applicable
Site Impact extends to primary study area level 1
Local Impact extends to municipality level 2
Regional Impact extends to provincial level 3
National Impact extends to national level 4
International Impact affects global economic relations 5
Transient Less than 1 year 1
Short Term 1 - 5 years 2
Medium Term 5 -15 years 3
LongTerm >15yearsandceasingwithclosure 4
Permanent >49years 5
None/negligible 1
Low 2
Moderate 3
High 4
Very High 5
Improbable Less than 5% chance 1
Low Probability 5-40% chance 2
Medium Probability 40-60% 3
Highly Probable 60-90% 4
Certain Definite 5

REFERENCES
Aeon, A., Muwanga, A., 2009a. An environmental impact statement of Tororo Cement Limited for expansion of quarrying operations in Katikekile, Moroto District and in Loroo, Nakapiripirit District. Final Draft Report.
Aeon, A., Muwanga, A., 2009b. An environmental audit of the Tororo Cement Liited Marble Quarry in Katikekile, Moroto District. Final Draft Report.
Akabwai, D., Ateyo, P.E., 2007. The scramble for cattle, power, and guns in Karamoja. Medford, MA: Feinstein International Center.
Anderson, I., Robinson, I., 2009. Agriculture and livestock. 10th EDF - Karamoja Livelihoods Programme (KALIP). Working Paper 2.
Business and Biodiversity Offsets Programme (BBOP), 2012. Standard on Biodiversity Offsets. BBOP, Washington, D.C.
Brown, J., Bird, N., 2010. Namibia’s story. Sustainable natural resource management in Namibia: Successful community-based wildlife conservation. Overseas Development Institute, London.
Department of Minerals and Energy, 2005. Guideline document for the evaluation of the quantum of closure-related financial provision provided by a mine. Official guideline as contemplated in Regulation 54(1) to the Mineral and Petroleum Resources Development Act, 2002 (Act 28 of 2002). South Africa, Pretoria.
Dore, G., Grayson, R.,Songwe, V., Whitten, T., 2006. Mongolia - A review of environmental and social impacts in the mining sector. The International Bank for Reconstruction and Development/The World Bank; Environment and Social Development - East Asia and Pacific Region, Discussion Paper.
Dorner, U., Franken, G., Liedtke, M., Sievers, H., 2012. Artisanal and Small-Scale Mining (ASM), a POLINARES working paper, no. 19.
Doyle, C, Wicks, C., Nally, F., 2007. Mining in the Philippines: Concerns and conflicts. Report of a fact-finding trip to the Philippines in July-August 2006. Society of St. Columban, Widney Manor Rd., Knowle, Solihull B93 9AB, West Midlands, UK.
FEG - FAO, 2010. Overview of baseline household economy assessment of Karamoja.
Fergusson, L., Flew, C., Groenewald, H., Nabudere, R., Okello, S., Sausi, C., Watson, C., 2010. Karamoja conflict and security assessment. Saferworld.
Germaneau, C., Quétier, F., Gobert, J., Persegol, L., Barra, M., Houdet, J., 2012. La compensation de la biodiversité ? Lorsqu’il n’y a pas d’autres solutions ! Principes comptables pour mettre en oeuvre la séquence « éviter – réduire – compenser », Cahier technique 2012-01, Synergiz, 25p.
Global Witness, 2013. The benefits for Uganda of joining the emerging global transparency standard for extractive industry revenues. Global Witness Briefing.
Hinton, J., Levin, E., 2010. Comparative study of fiscal and legal regimes for diamond artisanal mining. Report to USAID.
Hinton, J., Kabongo, I., Kabiswa, C., Okedi, J., Mbabazi, R., 2011. Baseline Assessment of the Mining and Minerals sector in Karamoja, Uganda: Development opportunities and constraints. Ecological Christian Organisation (ECO).
Houdet, J., et al., In Press. Corporate natural capital disclosure from an integrated reporting perspective. Designing and modelling an Integrated Financial – Natural Capital Accounting & Reporting FrameworkSynergiz Working Paper.
Hruschka, F., Echavarria, C., 2011. For the Alliance for Responsible Mining. “Rock Solid Chances for responsible artisanal mining” in ARM Series on Responsible ASM. No. 3.
ICMM 2012. The role of mining in national economies. Mining’s contribution to sustainable development. International Council on Mining and Metals, London, UK.
ICMM 2013. Approaches to understanding development outcomes from mining. International Council on Mining and Metals, London, UK.
Ingram, V., Tieguhong, J.C., Schure, J., Nkamgnia, E., Tadjuidje, M.H., 2011. Where artisanal mines and forest meet: Socio-economic and environmental impacts in the Congo Basin. Natural Resources Forum 35, 304–320.
81

Kasande, R., Kabasiita, J., Birungi Kahubire, E., 2013. Environmental and social impact statement for the proposed Ratta Marble Mining Project, Moroto Distrcit, Uganda.
KPCS, 2008. Annual Global Summary: 2007 Production, Imports, Exports and KPC Counts. Retrieved 10 11, URL: https://mmsd.mms.nrcan.gc.ca/kimberleystats/public_tables/Global_Summary%20-%202007.pdf
Lucas, A., 2011. “Mine-to-Market Solutions to Improve Lives of Artisanal Miners.” Retrieved June 2011 from GIA Insider, URL: http://app.e2ma.net/app2/campaigns/archived/13748/ee4c7f9d19da0b605f2c8868b2280eaa/#ica
McCarthy, T., 2011. The impact of acid mine drainage in South Africa. South African Journal of Science 107 (5/6), Art. #712, 7 pages.
Mkutu, K., 2008. Disarmament in Karamoja, Northern Uganda: Is this a solution for localized violent inter- and intra-communal conflict?’ The Round Table 97(394), 99–120.
Muwanga, A., Aguma-Acon, J., Twimukye, J., 2012. Environmental Impact Statement for the Nakabat Gold Mine, Rupa sub-country, Moroto District.
Ngabiirwe, W., Tumwesigye, R.B., Muloopa, H., 2012. Human rights status in the gold supply chain of Uganda: A case for artisanal small-scale mining in Karamoja region. Global Rights Alert.
Ramontja, T., Coetzee, H., Hobbs, P. J., et al. , 2010. Mine water management in the Witwatersrand Gold Fields with special emphasis on acid mine drainage. Report to the Inter-Ministerial Committee on Acid Mine Drainage.
Shoko, D.S.M., 2002. Small-scale mining and alluvial gold panning within the Zambezi Basin: An ecological time bomb and tinderbox for future conflicts among riparian states; Conference Paper, URL: http://dlcvm.dlib.indiana.edu/archive/00000921/00/shokod290502.pdf
Telmer, K.H., Veiga, M.M., 2009. “World emissions of mercury from artisanal and small scale and the knowledge gaps about them.” Retrieved 10 2011, from Mercury Watch, URL: http://www.mercurywatch.org/default.aspx?panename=researchPaper
OPM, 2011. Blessing or curse – The rise of mineral dependence among low- and middle-income countries. Available at www.opml.co.uk
Rugadya, M.A., Kamusiime, H., Nsamba-Gayiiya, E., 2010. Tenure in mystery: Status of land under wildlife, forestry and mining concessions in Karamoja Region, Uganda. TROCAIRE Uganda and Oxfam GB.
SCBD - Secretariat of the Convention on Biological Diversity, Global Mechanism of the United Nations Convention to Combat Desertification and OSLO consortium, 2013. Valuing the biodiversity of dry and sub-humid lands. Technical Series No.71. Secretariat of the Convention on Biological Diversity, Montreal.
TEEB, 2010. The Economics of Ecosystems and Biodiversity: Ecological and Economic Foundations. Edited by P. Kumar. London: UNEP/Earthprint.
UNDP, 2007. Returning to uncertainty? Addressing vulnerabilities in Northern Uganda. Kampala, United Nations Development Programme.
UNEP, 2012. Analysis of formalization approaches in the artisanal and small-scale gold mining sector based on experiences in Ecuador, Mongolia, Peru, Tanzania and Uganda: Uganda Case Study.
UNEP, 2012(b). Developing a cost-benefit analysis of mining sites in Mongolia. Annual Report 2011- “Strengthening Environmental Governance in Mongolia”, Phase II.
Van Zyl, H., Bond-Smith, M., Minter, T., Botha, M., Leiman, A., 2012. Financial Provisions for rehabilitation and closure in South African mining: Discussion document on challenges and recommended improvements. WWF – South Africa. URL: http://awsassets.wwf.org.za/downloads/wwf_mining_8_august_low_res.pdf
Villegas, C., Weinberg, R., Levin, E., Hund, K., 2012. Artisanal and Small-scale Mining in Protected areas and critical Ecosystems Programme (ASM –PACE). Working together towards responsible artisanal and small scale mining. A Global Solutions Study. Estelle Levin Limited and WWF.
Weaver, C., Petersen, T., 2008. Namibia Communal area conservancies. Best practices in sustainable hunting, 48–52.
WRI – WBCSD, 2004. Greenhouse Gas (GHG) Protocol: Corporate Accounting & Reporting Standard.
82


INTERNATIONAL UNION FOR CONSERVATION OF NATURE Uganda Country Office Plot 39 Babiiha Avenue, P. O. Box 10950, KAMPALA, Uganda Tel +256 41 344508/233738 Fax +256 41 342298 www.iucn.org/esaro