IMPACT ASSESSMENT REPORT - Danish Refugee … ASSESSMENT REPORT NUSAF2 - Northern Uganda Social...
16
IMPACT ASSESSMENT REPORT NUSAF2 - Northern Uganda Social Action Fund 2012-2013 Project in Moroto Municipality and Nadunget Sub-County Karamoja, Uganda
Transcript of IMPACT ASSESSMENT REPORT - Danish Refugee … ASSESSMENT REPORT NUSAF2 - Northern Uganda Social...
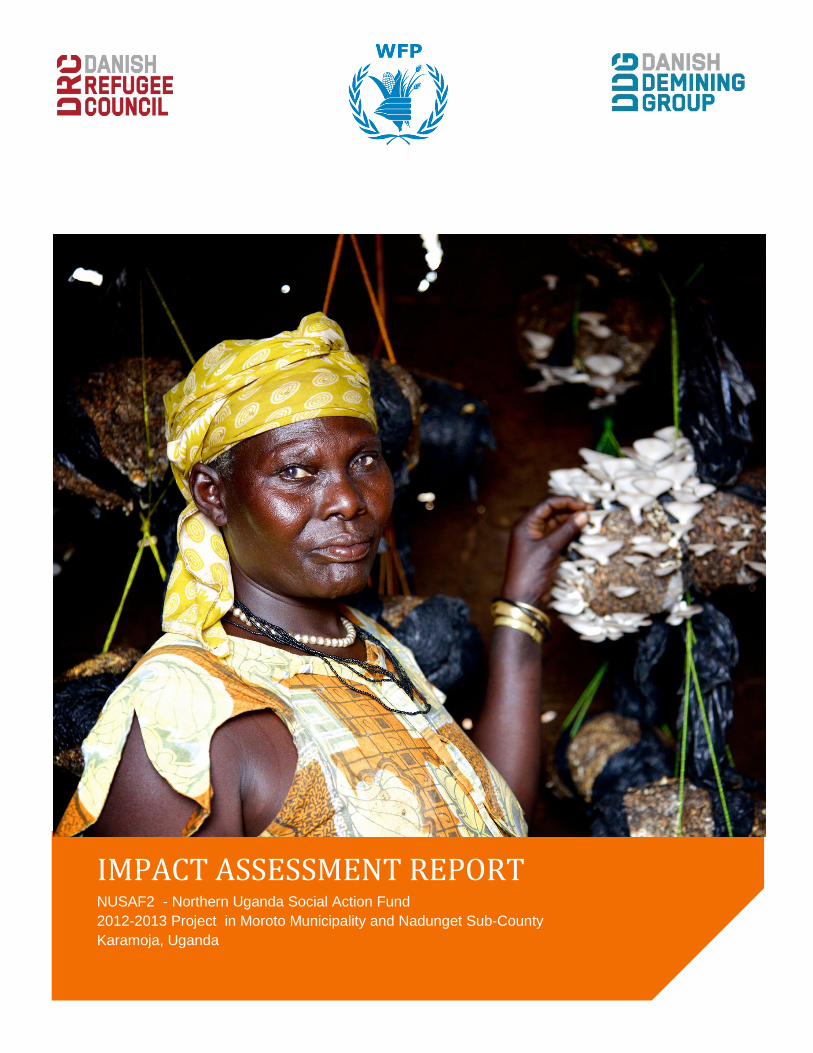
IMPACT ASSESSMENT REPORT NUSAF2 - Northern Uganda Social Action Fund
2012-2013 Project in Moroto Municipality and Nadunget Sub-County
Karamoja, Uganda

2
Summary of main findings
There is a reduction from 40% to 27% of households that live on one meal pr. day
74.5% of households have not experienced starvation in the past 12 months, while 7.4% have
Staple food and green vegetables are the main types of food consumed in households
47.3% of respondents rate their income situation as ‘good’ or ‘very good’ at the time of impact
assessment
41.4% says that their ability to meet basic needs has improved in the past 12 months
30.1% of beneficiaries allocate less than half of their monthly expenditures on food
The proportion of households that make savings has increased from 41% to 51%
50% of households would be able to cope with an economic shock
64.1% find that their access to a market has been highly improved
76.9% of beneficiaries are satisfied with the available choices between types of Household
Income Support Projects
Both NUSAF2 beneficiaries and community members are positive about the quality of the public
works projects carried out
93.9% of beneficiaries express that they were not given a clear idea about what to expect from
the project before the activities started
62.5% of beneficiaries says that DRC-DDG has lived up to commitments to a high extent or
completely

3
Table of contents
Executive summary
1. Introduction
a. DRC-DDG Program in Uganda
b. Description of project and working context
2. Methodology
a. Data collection methods
b. Sampling and characteristics of respondents
c. Data handling and analysis
d. MitHISPtion of methodological challenges
3. Findings
a. Indicator I: Food Security
b. Indicator II: Income and economic resilience
c. Indictator III: Market access
4. Quality assessment: Project relevance and accountability in delivery
5. Conclusion

4
1. Introduction
Description of project and work context
DRC-DDG has been an implementing partner to the WFP-funded Northern Uganda Social Action Fund 2
program in Karamoja from March 2012. DDG has been responsible for Public Works projects and
Household Income Support Projects (HISP) in Moroto and Nadunget, and has administered the
distribution of cash and food for work.
The overall objective for DRC-DDG’s work has been: To support livelihoods of poverty-stricken
households in Nadunget Subcounty and Moroto Municipality.
DRC-DDG has sought to contribute to this overall objective, by pursuing the immediate objective:
Improved access to income earning opportunities and basic social services of food insecure households
in Nadunget Subcounty and Moroto Municipality
The project has targeted a total of 6,492 households with an estimated 38,900 direct and indirect
individual beneficiaries.1 The beneficiaries have been organized into 135 clustered, each carrying out one
Public Works project, and one HISP. In total, the following activities have been carried out under NUSAF
2 in the period March 2012 to March 2013.
135 Public works projects:
Community Access Road 48
Cattle Crush 7
Tree Planting 80
135 Household Income Support Projects:
Vegetable garden 45
Grinding mill 16
Cereal banking 4
Field crop cultivation 30
Bee keeping 10
Mushroom growing 8
Orchards 5
Tree nursery 10
Groundnuts grinding mill 6
Poultry 1
In addition, beneficiaries have been encouraged to establish Village Savings and Loans Associations
(VSLA), and the clusters who took interest have been given training in VSLA and saving-boxes with
record books.
1 A direct beneficiary is defined as a household member who actively takes part in public works and HISP. An indirect
beneficiary is a household member of a direct beneficiary. Number of indirect beneficiaries is estimated based on an average household size of 6 persons.

5
2. Methodology
Data collection methods This impact assessment aims to explore impact of the NUSAF2 implementation phase that started in
March 2012. It is based on a mixed methodology comprising a quantitative household survey and
qualitative focus group discussions. The household survey has been carried out in August 2013, six
months after the completion of the implementation phase, and the qualitative data in October 2013 with
the purpose of leaving enough time for project outcomes and impact to materialize. A second phase has
continued after March 2013, whereby this assessment also serves as a mid-term assessment for the two-
year program phase. Data has been collected by a team of external enumerators under the management
of DRC-DDGs M&E Unit. Enumerators have undergone a one-day training prior to data collection, and
the tools have been pilot-tested prior to usage. All data collection tools have been translated into
Ngakarimojong, and respondents have been interviewed in their mother tongue.
Sampling and characteristics of respondents
The household survey is based on responses from 599 randomly sampled NUSAF2 beneficiaries in all
locations and clusters of the project. Sampling has been made proportional to number of cluster members
to ensure that all clusters have relatively equal representation in the sample, and gender and age has
been made to reflect the distribution among the beneficiary population. In consequence, 62.5% of
respondents are female and 37.5% are male, while the age distribution is as follows:
Mitigation of methodological challenges
Prior to data collection in 2013, the data collection tools have been revised and specified with a further
level of detail than the baseline data collection in 2012. The end-line data thus introduces additional
measurements that were not included in the baseline, and to enable tracking of change in the
implementation period, such new questions have been accompanied by a question assessing
respondent’s perception of change in comparison with one year earlier. Therefore, this impact
assessment comprise a combination of direct comparisons between respondents answers to questions in
2012 and 2013 respectively, and perception-based assessments of change. This will be clearly indicated
with a label of when data was collected (2012 or 2013) in all tables in the report.
Age distribution of survey respondents
25 years andbelow
26-45 years
46 years andabove
6
3. Findings
Indicator 1: Food Security
Description of the indicator:
This indicator seeks to map food beneficiaries’ food security by assessing number of meals pr. day, level
of food sufficiency and diversity of food intake.
Impact assessment:
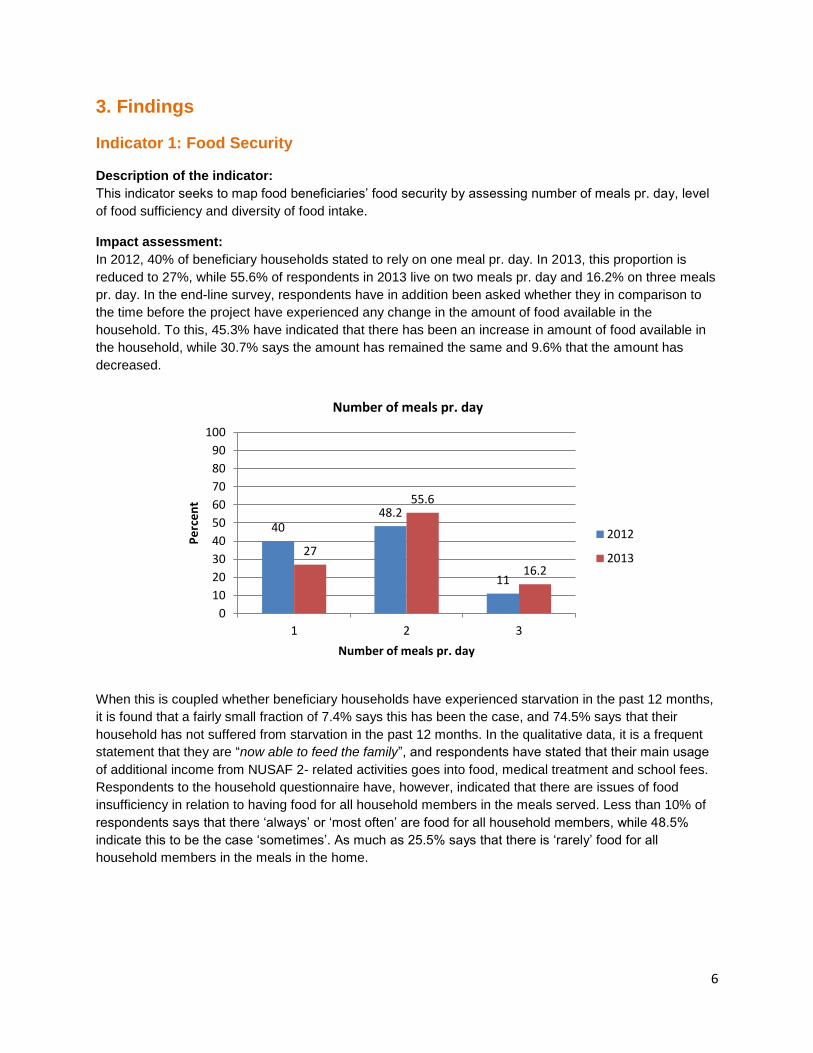
In 2012, 40% of beneficiary households stated to rely on one meal pr. day. In 2013, this proportion is
reduced to 27%, while 55.6% of respondents in 2013 live on two meals pr. day and 16.2% on three meals
pr. day. In the end-line survey, respondents have in addition been asked whether they in comparison to
the time before the project have experienced any change in the amount of food available in the
household. To this, 45.3% have indicated that there has been an increase in amount of food available in
the household, while 30.7% says the amount has remained the same and 9.6% that the amount has
decreased.
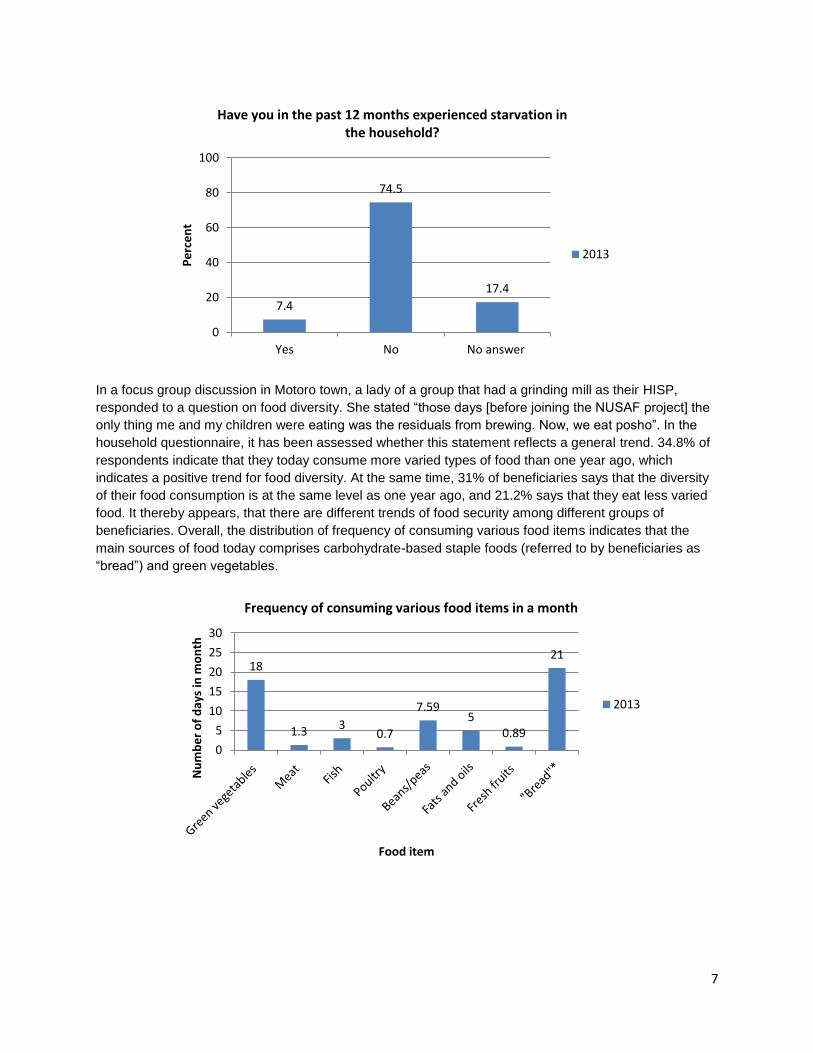
When this is coupled whether beneficiary households have experienced starvation in the past 12 months,
it is found that a fairly small fraction of 7.4% says this has been the case, and 74.5% says that their
household has not suffered from starvation in the past 12 months. In the qualitative data, it is a frequent
statement that they are “now able to feed the family”, and respondents have stated that their main usage
of additional income from NUSAF 2- related activities goes into food, medical treatment and school fees.
Respondents to the household questionnaire have, however, indicated that there are issues of food
insufficiency in relation to having food for all household members in the meals served. Less than 10% of
respondents says that there ‘always’ or ‘most often’ are food for all household members, while 48.5%
indicate this to be the case ‘sometimes’. As much as 25.5% says that there is ‘rarely’ food for all
household members in the meals in the home.
40 48.2
11
27
55.6
16.2
0
10
20
30
40
50
60
70
80
90
100
1 2 3
Pe
rce
nt
Number of meals pr. day
Number of meals pr. day
2012
2013
7
In a focus group discussion in Motoro town, a lady of a group that had a grinding mill as their HISP,
responded to a question on food diversity. She stated “those days [before joining the NUSAF project] the
only thing me and my children were eating was the residuals from brewing. Now, we eat posho”. In the
household questionnaire, it has been assessed whether this statement reflects a general trend. 34.8% of
respondents indicate that they today consume more varied types of food than one year ago, which
indicates a positive trend for food diversity. At the same time, 31% of beneficiaries says that the diversity
of their food consumption is at the same level as one year ago, and 21.2% says that they eat less varied
food. It thereby appears, that there are different trends of food security among different groups of
beneficiaries. Overall, the distribution of frequency of consuming various food items indicates that the
main sources of food today comprises carbohydrate-based staple foods (referred to by beneficiaries as
“bread”) and green vegetables.
7.4
74.5
17.4
0
20
40
60
80
100
Yes No No answer
Pe
rce
nt
Have you in the past 12 months experienced starvation in the household?
2013
18
1.3 3 0.7
7.59 5
0.89
21
0
5
10
15
20
25
30
Nu
mb
er
of
day
s in
mo
nth
Food item
Frequency of consuming various food items in a month
2013

8
28.4 29.5
41.4
0
10
20
30
40
50
Worsened Same Improved
Pe
rce
nt
Change in ability to meet basic needs
Endline: Do you think there in the past 12 months has been any change in your ability to meet basic needs?
2013
Indicator 2: Income and economic resilience
Description of the indicator:
In this section, beneficiaries’ level of income, savings and assets in the form of livestock is assessed to
explore trends in self-reliance and ability to cope with economic shocks.
Impact assessment:
Respondents in the household survey have made a subjective rating of their income situation. In the
baseline survey, the rating is made numerically on a scale from 1 to 5, and in the end-line the scale has
had five categories from ‘very bad’ to ‘very good’. Due to difference in the scales across the two surveys,
they cannot be directly compared, but the findings presented in the table below do indicate that there has
been a positive trend in the period from 2012 to 2013. In the end-line assessment, 47.3% of respondents
have rated their income situation as ‘good’ or ‘very good’.
Due to the difference in the scales, this measurement is in the end-line survey triangulated with a
question regarding beneficiaries’ perception of change in their ability to meet basic needs. In these
answers there is a similarity with the self-assessments of change in food security above as answers are
spread across the answer categories in a manner that indicates that there has been varied impact among
different groups of beneficiaries. The most significant trend among the answers is, however, that 41.4%
find that their ability to meet basic needs has been improved in the past 12 months.
5.3
15.2 18.4
23.6 23.7
0.7
26.8
46.6
18.5
8.1
0 0.8 0
10
20
30
40
50
Very bad Bad Fair Good Very good Don't know
Pe
rce
nt
How do you perceive the income situation for your household?
2013
2012

9
Additionally, respondents have answered an open-ended question about whether they think that being
part of the project has been of any benefit to their daily life, and if so in which way. The responses have
been mapped into a visual overview, with the size of the text indicating the frequency by which something
is mentioned:
The responses point at that the main benefits experienced by beneficiaries relate to improved access to
food and ability to feed the family, better possibilities of paying school fees and providing scholastic
materials to children, improved ability to buy subsidiary food, better and more balanced diet and improved
medical care and health. During focus group discussions, a number of beneficiaries highlighted that they
had found the project to motivate them to work, and that they had learnt how to engage in productive
activities that had otherwise been outside reach. This relates both to practical skills, but also to the
attitude to work. A man in Nadunget expressed the latter in the following way: “Let me say this like we
pastoralists do. If you want a cow to give milk, you first have to make the effort and take her grazing.
What we have learnt is that it is the same for earning money, you first have to work”.
In the household survey in 2013, household’s economic situation has been explored. There does not exist
equivalently detailed information in the baseline study, but these figures can be used for future reference,
and can be compared to other livelihoods studies among the target group in Karamoja.The figures will be
reported firstly in averages for the entire group of respondents followed by a detailed break-down that
describes the variance among beneficiaries. In 2013, NUSAF2 beneficiaries in Moroto and Nadunget
reportedly had the following average economic details:
Household monthly income 49,000 UGX
Household monthly expenditures 81,300 UGX
Monthly spending on food 47,900 UGX
Estimation of value of household savings 15,700 UGX
10
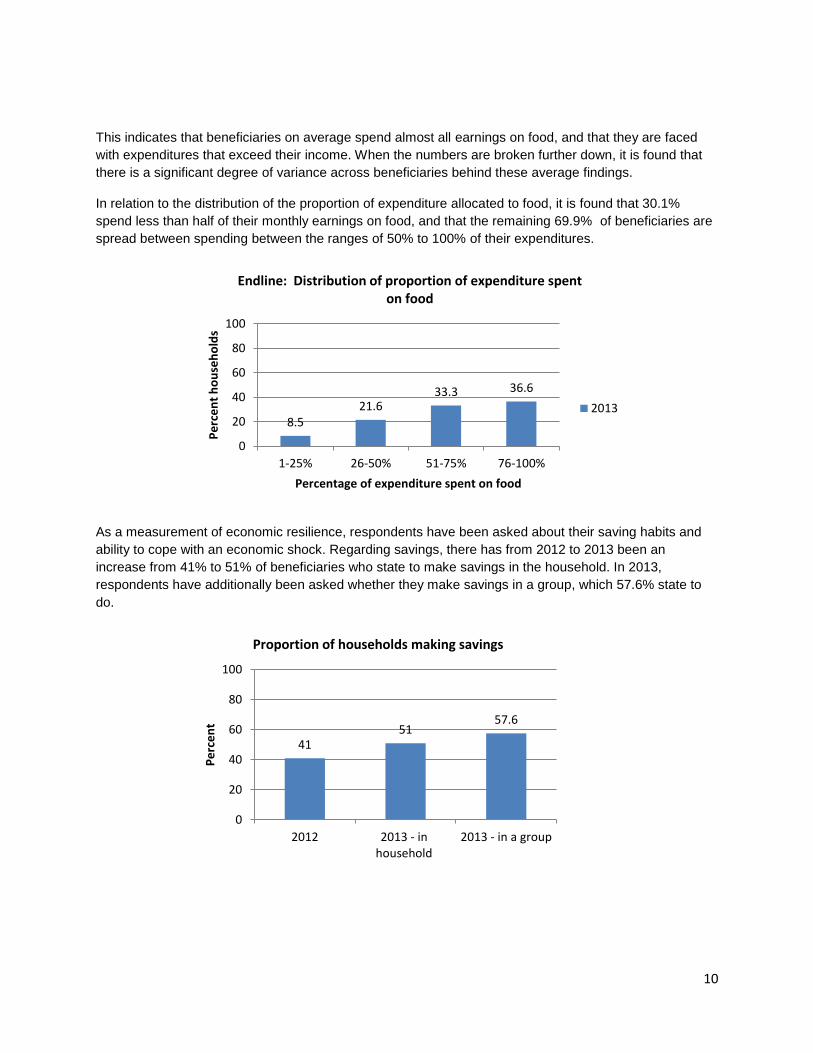
This indicates that beneficiaries on average spend almost all earnings on food, and that they are faced
with expenditures that exceed their income. When the numbers are broken further down, it is found that
there is a significant degree of variance across beneficiaries behind these average findings.
In relation to the distribution of the proportion of expenditure allocated to food, it is found that 30.1%
spend less than half of their monthly earnings on food, and that the remaining 69.9% of beneficiaries are
spread between spending between the ranges of 50% to 100% of their expenditures.
As a measurement of economic resilience, respondents have been asked about their saving habits and
ability to cope with an economic shock. Regarding savings, there has from 2012 to 2013 been an
increase from 41% to 51% of beneficiaries who state to make savings in the household. In 2013,
respondents have additionally been asked whether they make savings in a group, which 57.6% state to
do.
8.5 21.6
33.3 36.6
0
20
40
60
80
100
1-25% 26-50% 51-75% 76-100%
Pe
rce
nt
ho
use
ho
lds
Percentage of expenditure spent on food
Endline: Distribution of proportion of expenditure spent on food
2013
41 51
57.6
0
20
40
60
80
100
2012 2013 - inhousehold
2013 - in a group
Pe
rce
nt
Proportion of households making savings

11
Among the beneficiaries who make savings, the value of household savings has been broken down in
categories:
Here it is found that a greater percentage of 39.6% of respondents have less than 5,000 UGX saved, and
thus a quite limited liquidity available for crisis situations. 50.2% of beneficiaries have between 5,000 and
40,000 UGX, and 10.3 % have more than 40,000 UGX. Respondents have in addition been asked directly
whether they, in the event that member of the household urgently needed 20.000 UGX for medical care,
would be able to raise the money. To this, 50% of respondents have said yes – divided between 29.2%
who claimed to be able to get the money from household funds and 20.8% who claims they would be able
to borrow the money. It thus appears that there is a social economic resilience among the beneficiaries
that enables a larger fraction than the ones who have liquidity at hand to cope with an economic shock.
During focus group discussions, it has frequently been mentioned that beneficiaries seek to multiply
income that has been earned under NUSAF2, and that many beneficiaries succeed in setting up small
businesses. When inquiring about the types of business vested in, a common answer is brewing of local
brew. While this is a rational choice in a setting where there is a market for it, it may be considered if this
is the most constructive outcome of NUSAF activities – taken the challenges with alcohol addiction and
violence related to alcohol-intake into account.
One more measurement regarding the household’s economic situation has been made in relation to
number of livestock lost and gained in the previous 12 months. These findings indicate that 10% of
households have increased the number of livestock with 1 head, and 4% with 2 heads or more. 14.9%
state to have the same number as earlier, and 11% that they have lost livestock in the period. These
figures are at a background of a significant number of beneficiaries indicating that they neither at the time
of baseline nor end-line were in possession of livestock.
39.6
20.8 15.8 13.6
7.2 3.1
05
101520253035404550
Pe
rce
nt
Amount saved
Endline: Distribution of value of savings among households who make savings
2013

12
Indicator 3: Market Access
Description of indicator:
The measurements under this indicator are made with the purpose of exploring whether there is any
change in beneficiaries’ access to market places and thereby improved access to economic activities.
Impact assessment:
In order to establish information about changes in beneficiaries’ access to markets, a direct and an
indirect question has been included in the survey. In 2013, respondents have directly been asked,
whether their access to a market place has improved in the past 12 months. In this matter, there is a very
clear trend that beneficiaries do experience to have improved market access, as indicated in the following
table.
Also, respondents have been asked where they buy items to cover their daily basic needs, e.g. food and
other essentials. In both baseline and end-line, it is by far the majority of respondents who indicate that
they get this from a town or trading centre. The table above should thus be interpreted in the way that the
access to these trading centers is perceived to be improved in the period. At the same time, there is a
change in the proportion of respondents who indicate to purchase essential items in the village itself. At
the time of baseline it was as few as 1.7% of respondents that stated this as the main avenue for
household purchases, while it by the time of the end-line is 5.3%. This could reflect an emerging level of
economic activities in the villages, while still at a very modest level.
8.4 7.8 6.9
26
38.1
12.8
0
10
20
30
40
50
Pe
rce
nt
Level of change in access to market place
Has your access to a market place been improved in the past 12 months?
2013

13
4. Quality Assessment: Project relevance and accountability in delivery
As a result of DRC-DDG’s commitment to Humanitarian Accountability Partnership (HAP), an assessment
of beneficiaries’ rating of project relevance, delivery on commitments and rating of how accessible it is for
beneficiaries to raise complaints. In relation to project relevance, beneficiaries have rated the choices
available to them for different types of HISPs. A significantly positive trend is found here, with 76.7%
saying ‘satisfied’ or ‘very satisfied, and less than 6% expressing dissatisfaction with the available types of
HISPs.
Subsequently, beneficiaries and a sample of other community members have been asked how satisfied
they are with the quality of the public works project that has been carried out in their area. There appears
to be a high level of satisfaction with the results of public works, and community members who has not
taken part in the public works process are slightly more positive than sampled NUSAF2 beneficiaries.
0.4 5.5 4.6
13.9
62.8
12.8
0102030405060708090
100
Verydissatisfied
Dissatisfied Neitherdissatisfied
norsatisfied
Satisfied Verysatisfied
No answer
Pe
rce
nt
How satisfied have you been with the choices available to your group between different types of IGAs?
2013
2.8 3.7 5.2
15.9
59.4
12.8
1.8 3.6 7.1
23.3
64.3
0
10
20
30
40
50
60
70
Not at all Low extent Someextent
High extent Comletely No answer
Pe
rce
nt
Level of satisfaction with quality
How satisfied are you with the quality of the public works project that has been implemented under NUSAF2 in your parish?
NUSAF2Beneficiaries
Othercommunitymembers
14
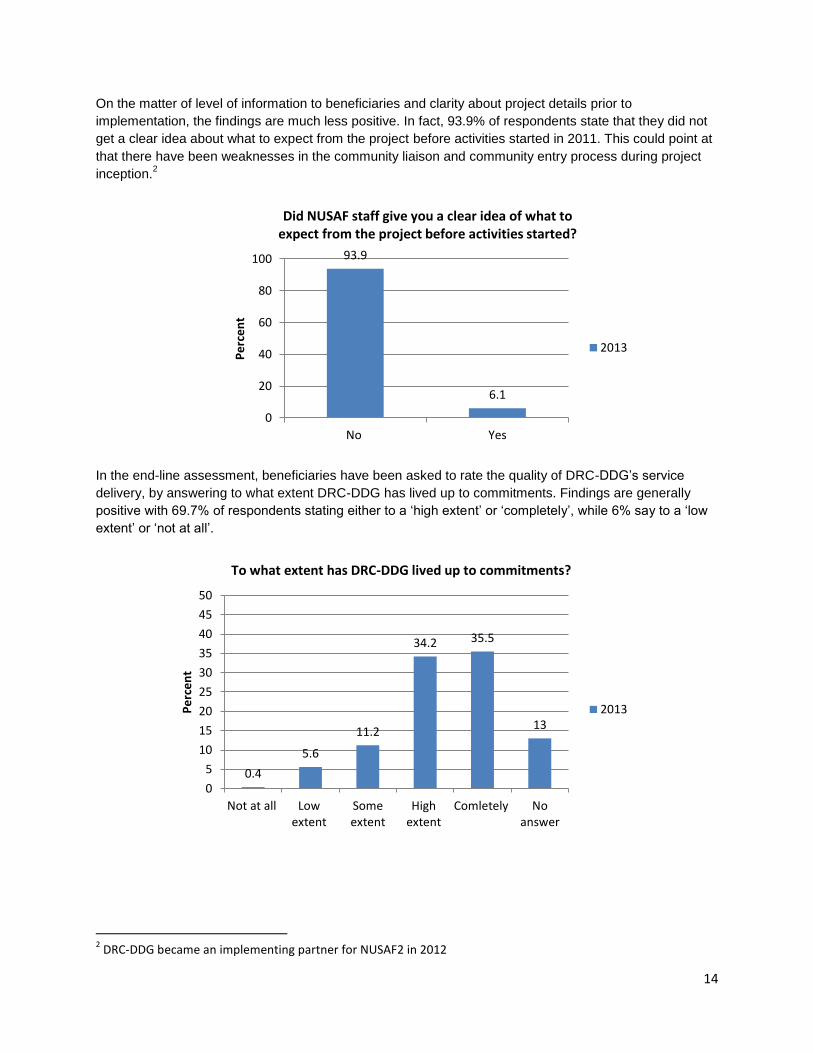
On the matter of level of information to beneficiaries and clarity about project details prior to
implementation, the findings are much less positive. In fact, 93.9% of respondents state that they did not
get a clear idea about what to expect from the project before activities started in 2011. This could point at
that there have been weaknesses in the community liaison and community entry process during project
inception.2
In the end-line assessment, beneficiaries have been asked to rate the quality of DRC-DDG’s service
delivery, by answering to what extent DRC-DDG has lived up to commitments. Findings are generally
positive with 69.7% of respondents stating either to a ‘high extent’ or ‘completely’, while 6% say to a ‘low
extent’ or ‘not at all’.
2 DRC-DDG became an implementing partner for NUSAF2 in 2012
93.9
6.1
0
20
40
60
80
100
No Yes
Pe
rce
nt
Did NUSAF staff give you a clear idea of what to expect from the project before activities started?
2013
0.4
5.6
11.2
34.2 35.5
13
0
5
10
15
20
25
30
35
40
45
50
Not at all Lowextent
Someextent
Highextent
Comletely Noanswer
Pe
rce
nt
To what extent has DRC-DDG lived up to commitments?
2013

15
Lastly, as assessment of the access to DRC-DDG’s beneficiary complaints mechanisms has been made,
by asking beneficiaries to rate implementing staff’s approachability in case a beneficiary wants to express
dissatisfaction. Here it is found that 62.5% of beneficiaries find that implementing staff are approachable
either to a ‘high extent’ or ‘completely, and that 17.1% finds that this is the case ‘to a low extent’ or not at
all.
11.1 6 7.1
19.5
43.4
13
0
10
20
30
40
50
Not at all Lowextent
Someextent
Highextent
Comletely Noanswer
Pe
rce
nt
To what extent do you think DRC-DDG staff are approachable if you want to express dissatisfaction?
2013

16
5. Conclusion
In relation to food security, a reduction has been found in the number of people who live on one meal pr.
day. Only a very limited number of households have been faced with starvation in the past 12 months,
and the amount of food available in the households has increased. There has been found increased
dietary diversity and beneficiaries have indicated to experience improved nutrition and health among their
family members. There are, however, still a significant portion of beneficiaries who point at challenges in
ensuring food for all members of the household in the number of meals prepared pr. day.
In relation to household income and economic resilience, there has been found a positive trend in
beneficiaries’ self-assessment of their income situation. In 2013, 47.3% of beneficiaries rate their income
situation as ‘good’ or ‘very good’ There is also a trend towards improved ability to meet basic needs, as it
has been found that 41.4% of beneficiaries state a positive development in this regard. In focus group
discussions, beneficiaries have emphasized that the households are able to access medical care, school
enrollment and purchase of subsidiary food which had been out of reach before.
There has been an increase in the number of persons making savings, and 50% of respondents indicate
to be able to cope with an economic shock for the household.
There has been a significant improvement in market access, and beneficiaries are found to utilize
earnings from Household Income Support Projects (HISP) for investments in small scale business.
Beneficiaries express a high level of satisfaction with the available choices of HISPs, and the quality of
the public works projects has been rated highly by NUSAF2 beneficiaries as well as by other community
members.
There have been identified weaknesses in the information provided to beneficiaries prior to launching of
the project, which DRC-DDG will take into account in the event of leading a community entry process in
the future. Lastly, the majority of beneficiaries find that DRC-DDG has lived out to its commitments in
service delivery in the implementation period.