Cost Benefit Analysis for MPA Program
58
Cost-Benefit Analysis A Monetized Decision Tool Brett Whysel Fall 2015
-
Upload
brett-whysel -
Category
Government & Nonprofit
-
view
492 -
download
2
Transcript of Cost Benefit Analysis for MPA Program

Cost-Benefit AnalysisA Monetized Decision Tool
Brett Whysel
Fall 2015

Agenda
• November 23• Preliminaries
• Introduction to CBA
• Money Math
• November 30• Cost & Benefits
• Valuations
• December 7• Critiques & Limitations
• Risk and Uncertainty
2

Preliminaries
3

Why me?
• 26 Years Public Finance Investment Banking Experience
• Clients: Non-profits, cities, states, utilities…
• Focus: Strategy, analytics, risk management, derivatives and lending, training and recruiting
• My mission: give you a powerful tool you will need to succeed
4

Goals
• Understand when and how to apply CBA
• Appreciate strengths and limitations
• How to quantify benefits/costs,
• With great power comes…
5

Order of Business
• Pre-work• Gruber, chapter 8
• Cases
• Class Plan:
• Homework: Refine the Memorandum and email
• Email: [email protected]
• Telephone: 917.488.3885
• Documents and spreadsheets at: Google Drive
Topic Discussion 15 minutes
Memorandum 15 minutes
Memo Discussion 20 minutes
Repeat
6

Discussion 1a: Introduction to CBA
7

Cost-Benefit Analysis
• Defined: Systematic, rationalized process for calculating and comparing the costs and benefits of policies, projects and investments
• Domain: Aggregate effects on individuals in society
• Not just economic effects
• Admissibility; rank order
Society
8

Why CBA?
• Systematic way to choose among alternative projects
• Limited resources/budget allocation
• Market failures (externalities, public goods)
• Current dollar measurement puts all options on same scale
• Objectivity (?), transparency
• Identify full range of program effects
• Limits arbitrary, costly government action
9

Steps
1. Define scope of project, goals, resources
2. Compile alternatives, including status quo
3. Identify each alternative’s costs/benefits, types and time horizons for all affected i.e., society (not government)
4. Quantify each c/b monetarily
5. Present value
6. Risk/sensitivity analysis, risk adjust PVs
7. Make recommendations: rank and fund the top returning projects that are admissible (benefits>costs)
10

What’s In the Report?
• Policy Rationale
• Assumptions
• Evaluation of alternatives• Scales
• Methods of provision
• Degrees of government involvement
• Sources and effects of uncertainty
• Verification (post-mortem)
11

Frames of Reference
• Positive and negative externalities operate at different scales
• Example: benefits/costs of higher education
ParentsVery
Negative
FamilyPositive
SocietyMore
Positive
12

Case Study: Your Higher Education
• Do the Benefits of College Still Outweigh the Costs?
• Wages for college grads falling
• Return on Investment (ROI)• Benefits
• Direct + Opportunity Costs
• Estimate: 14-15%
• Depends on your frame of reference
13

Memorandum 1a
1. Pick a member of your group and discuss their decision to pursue a Masters. How did they make their decision?
2. What were the strengths & weaknesses of their approach?
3. Compile a list of costs: direct; indirect and opportunity
4. Compile a list of benefits
5. Identify externalities: How do these differ based on frame of reference?
6. Did they make the right decision?
14

Discussion 1b: Money Math

Time Value of Money
• CBA puts all costs/benefits in 2015 dollars
• Intuition: would you rather have a dollar today or a dollar tomorrow?• Brains!
• Consumption preference
• Inflation
• Investment opportunity
• Risk
• Liquidity
16

• Assume 100 today can be invested at 10%
• Interest is earned on interest (compounding grows exponentially)
• Next Balance = Prior Balance*(1+r); exponential growth
• A rational person is indifferent between 100 today (Present Value) and 133.1 in year 3 (Future Value)
Future Value: Money Makes Money
17
Interpretation Year (n) Balance Interest Formula Wealth Factor Time Wealth Factor
Present Value 0 $100.00 1.0000 0 1.00
Future Value 1 $110.00 100*10%=10 100*(1+0.1) 1.1000 3 1.33
Future Value 2 $121.00 110*10%=11 110*(1+0.1) 1.2100 10 2.59
Future Value 3 $133.10 121*10%=12.1 121*(1+0.1) 1.3310 15 4.18
20 6.73
Short cut: FV in Year 3 = 100 * (1 + 0.1)^3 WF=(1+r)^n 30 17.45
Interest Rate (r) 10% 50 117.39

Present Value: A Discount for Future Cash
• If $133 in 3 years is equivalent to $100 today, we are discounting future dollars about 25% ($100/$133)
• PV is the reverse of FV; 10% is the discount rate (r)
• Prior Balance = Next Balance/(1+r)
Interpretation Year (n) Balance Formula Discount Factor Time Discount Factor
Future Value 3 $100.00 1.0000 0 1.00
Future Value 2 $90.91 100.00/(1+0.1) 0.9091 3 0.75
Future Value 1 $82.64 90.91/(1+0.1) 0.8264 10 0.39
Present Value 0 $75.13 82.64/(1+0.1) 0.7513 15 0.24
20 0.15
Short cut: PV of 100 in Year 3 = 100 / (1 + 0.1)^3 DF=1/(1+r)^n 30 0.06
Discount Rate (r) 10% 50 0.01

Net Present Value
• Investments, projects and policies usually have costs and benefits (cash flows) that occur over time
• NPV translates future cash flows to current dollars
• Multiply future cash flows by the corresponding discount factor
19
Description Year (n) Cash Flow Discount Factor PV Cash Flow
Investment 0 -$100.00 1.0000 -$100.00
Return 1 $5.78 0.9091 $5.26
Return 2 $5.78 0.8264 $4.78
Return 3 $5.78 0.7513 $4.34
Return 4 $5.78 0.6830 $3.95
Return 5 $5.78 0.6209 $3.59
Return 6 $5.78 0.5645 $3.26
Return 7 $5.78 0.5132 $2.97
Return 8 $5.78 0.4665 $2.70
Return 9 $5.78 0.4241 $2.45
Return 10 $5.78 0.3855 $2.23
Return 11 $5.78 0.3505 $2.03
Return 12 $5.78 0.3186 $1.84
Return 13 $5.78 0.2897 $1.68
Return 14 $5.78 0.2633 $1.52
Return 15 $5.78 0.2394 $1.38
Return 16 $5.78 0.2176 $1.26
Return 17 $5.78 0.1978 $1.14
Return 18 $5.78 0.1799 $1.04
Return 19 $5.78 0.1635 $0.95
Return 20 $5.78 0.1486 $0.86
Return 21 $5.78 0.1351 $0.78
Return 22 $5.78 0.1228 $0.71
Return 23 $5.78 0.1117 $0.65
Return 24 $5.78 0.1015 $0.59
Return 25 $5.78 0.0923 $0.53
Return 26 $5.78 0.0839 $0.49
Return 27 $5.78 0.0763 $0.44
Return 28 $5.78 0.0693 $0.40
Return 29 $5.78 0.0630 $0.36
Return 30 $5.78 0.0573 $0.33
Gross Total $73.49 NPV -$45.48
Discount Rate (r) 10%

(100)
(50)
-
50
100
150
200
0%
1%
2%
3%
4%
5%
6%
7%
8%
9%
10%
11%
12%
Pre
sent
Valu
e
Discount Rate
NPV Sensitivity to Discount Rate
PV of Returns Investment NPV
Internal Rate of Return
• IRR is interest rate that equates the present and future values: NPV=Zero
• Measure of return on investment (ROI)
• Higher discount rate lower NPV
• Lower discount rate higher NPV
• Calculate by• Trial & Error
• Calculator/Excel (IRR/XIRR)
IRR
20

Discount Rate Matters
• Higher rate: lower NPV
• Criteria• Opportunities
• Funding Cost
• Context (Social Discount Rate)
• Guidance• OMB: 7%
• GAO: Treasury Yields
• EPA: 2-3%; 0.5-3% intergenerational
• Discount rate choice affects long-lived projects more
21
-
100
200
300
400
500
600
700
0%
1%
2%
3%
4%
5%
6%
7%
8%
9%
10%
11%
12%
Pre
sent
Valu
e
Discount Rate
PV Returns Sensitivity to Discount Rate & Time
100 Year
30 Year
10 Year

Make the Call
• Admissibility• NPV > 0
• IRR > minimum return
• Benefit Cost Ratio (“BCR”) > 1
• Payback Period < minimum time horizon (Not time-value of money sensitive)
• Ranking
22

Memorandum 1b
1. Estimate the lifetime costs and benefits of the Masters degree.
2. What is the pay-back period?
3. What is a reasonable discount rate? Why?
4. Estimate the NPV using the table at http://www.netmba.com/finance/time-value/present/
5. What is the BCR?
6. How do these results differ for the individual, family, society?
7. Did they make the right decision?
For next week, prepare HBS Case Study, California High Speed Rail
23

Discussion 2a: Costs & Benefits
24

Review of Last Week
CBA
• What is CBA?
• Why CBA?
• What is in a CBA?
• Frames of Reference
Time Value of Money
• Future Value
• (Net) Present Value
• Internal Rate of Return
• The "Right" Discount Rate
• Make the Call
Applications
• Undergraduate education
• Graduate education
25

Which Costs & Benefits?
INCLUDE
• Everyone affected (Frame of Reference)
• Monetary and non-monetary
• Externalities/market failures
• Opportunity costs
• Distribution effects (equity)
EXCLUDE
• Sunk costs
• Rents
• Jobs created
• Transfer payments
26

Costs: Willingness to Accept
• Marginal opportunity cost• Next best use
• New jobs are a cost
• Social cost of carbon: $40/ton
• Taxes have 1.25x excess burden
http://www3.epa.gov/climatechange/EPAactivities/economics/scc.html
$0
$50
$100
$150
$200
$250
$300
2015 2020 2025 2030 2035 2040 2045 2050
EPA: Social Cost of Carbon
5% Average 3% Average
2.5% Average 3% 95th percentile
27

Benefits: Willingness to Pay
• Avoided costs/risks, probabilities
• Net out "dis-benefits"• Ignore prior, realized
benefits (like sunk costs)
• Time savings: Avg. hourly wage $19.29 in 2009
• Lives savings: PV of wages $8.7MM
• Ecosystem services
28

Case Study: California High Speed Rail
• 800 mile, $55B rail connection
• LA to SF in 2:41, up to 220 MPH
• $9.95B bond financing; $4.7B federal; P3
• CBA to 2050• NPV = +$97.4B at 4% real
• BCR = 2.84x
• IRR = 8.8%
29

Memorandum 2a
Refer to the case study, especially Exhibit 18:
1. What should the CBA include?
2. What should it exclude?
3. What would be the net effect of your inclusions & exclusions?
4. Modify the provided spreadsheet to calculate present values at 4%
30

Discussion 2b: Valuations
31

Revealed Preferences
Benefits
• Total value, not just earnings
Drawbacks
• varies widely
• excludes non-market social benefits
• Market prices usually preferred
• Indirect measurement
• Quasi-experiments
• Consumer vs. government revealed preferences
32

Contingent Valuation (Survey)
Benefits
• Straightforward
• Inexpensive
Drawbacks
• Unused to assigning $
• Trouble with small probabilities
• Framing
• Incentives to misreport
• Hypothetical
• Hypothetical questions: e.g., how much would you pay to reduce odds of dying
33
Human Capital Approach
• Set equal to PV of lifetime earnings (productivity gains/losses)
• People who don't work for pay: homemakers, students, retirees
• People who make more are worth more
• Does not account for labor market imperfections
• Non monetary alternatives e.g., quality adjusted life-years
34

Intangibles & Ripple Effects
• Some benefits are priceless
• Can subvert analysis
• Use original unit of measurement
• Non-human interests
• Second-order effects e.g. higher prices
35

Memorandum 2b
Refer to the case study, especially Exhibit 18:
1. How did the CHSRA estimate the costs and benefits?
2. What discount rate do you recommend? Why? How does it affect the results?
3. If you were governor, would you support the project? Why?
For next week, email memorandum 2a/b to [email protected] and
prepare New York Solar Study
36

Discussion 3a: Risk & Uncertainty
37

Risk vs. Uncertainty
The future is always
unknown…
Is the distribution
known?
RISK UNCERTAINTY
0%
10%
20%
Less 1.4 2.5 4.3 More
Pro
babili
tyOutcome (Cost $M/MW)
Cost of PV in 2025
0%
50%
100%
10 15 20 25 30
Pro
babili
ty
Outcome (Years)
Survival (Age 65 Female)
38

Expected Value
• Probability-weighted average of possible outcomes
• The amount you expect to win/lose over many trials
• The value of the gamble
• Observe people pay $50 to enter game 3; implies value of life of $5 million
39
GAMBLE 1
Outcome Probability Payoff Prob*Payoff
Heads 50% -$100.00 -$50.00
Tails 50% $100.00 $50.00
Expected Value $0.00
GAMBLE 2
Outcome Probability Payoff Prob*Payoff
Heads 50% -$100 -$50
Tails 50% $200 $100
Expected Value $50
GAMBLE 3
Outcome Probability Payoff Prob*Payoff
No Fire 99.999% $0 $0
Fire/Avoid Death 0.001% $5,000,000 $50
Expected Value $50

Sources of Risk & Uncertainty
Intrinsic
• Safety of nuclear power
• Environmental
• Emerging technologies
• Drug legalization
• Prescription drug approval
Analytical
• Assumptions
• Measurement error
• Model risk
• Outcomes
• Interpretation
40

Quantify Risk/Uncertainty
Sensitivity Analysis
• Identify key assumptions
• Estimate ranges
• Adjust assumptions
• Show impact on results
Monte Carlo
• Identify key assumptions
• Estimate distributions & correlations
• Generate output distributions
Decision Tree
• Identify future decisions and consequences
• Estimate probabilities, costs and utility
• Decide based on expected values
41

Report More then One Result
• Honesty, modesty & transparency
• What are the greatest sources of risk/uncertainty?
• How can these be managed?
• What are the effects?
• What is the likely range of outcomes?
42
Worst Case Best CaseExpected Case
Potential “True” NPV
Confidence Interval
Lik
elih
ood

Managing Risk 1: Public-Private Partnerships
Option Const-ruction
Financing Operat-ions
Mainten-ance
Residual Payments
Design-build Interim, completion payments
Design-build-operate
Payment penalties ensure performance
Design-build-finance
Payment at completion or via lease
Design-build-operate-maintain-finance
Availability Payments/ forgo asset revenues under concession/lease. Standard P3
Full privatization Maintain monitoring/enforcement
Risks of New Construction
Risk to public sector; Risk to private sector
More information on the Google Drive here.
43

Managing Risk 2: Pay for Performance
• Social Impact “Bonds”, Social Success Notes
• Transfer risk of program non-performance to capital markets
• Example: Bank invests $9M; returns depend on success of program to reduce recidivism
http://www.bloomberg.com/infographics/2014-05-08/how-goldman-sachs-can-get-paid-to-keep-people-out-of-jail.html 44

Looking Forward
• Modeling human behavior
• Elicit expert judgment
• Articulate decision-makers’ preferences
• Collaboration among the sciences
• Characterize reliability/robustness
45
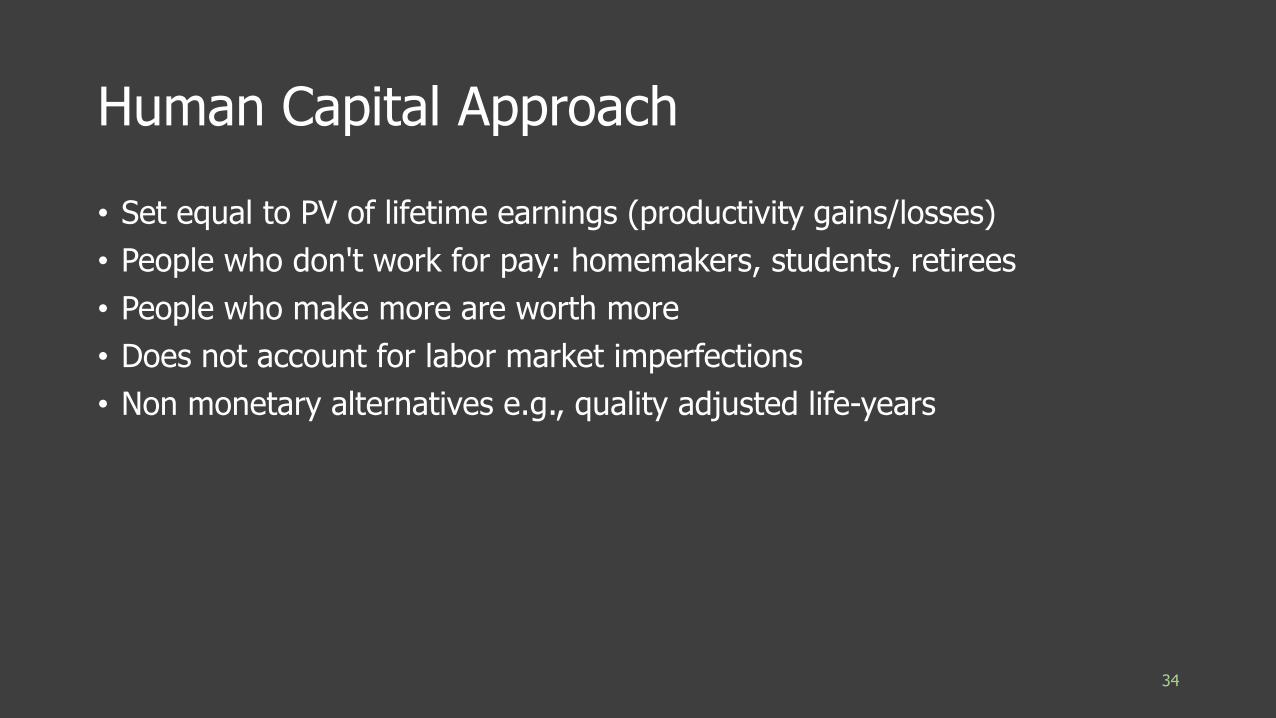
Case: New York Solar Study
• The Power Act of 2011 directs NYSERDA to do CBA of increasing PV in NYS to 5,000 MW by 2025
• Uncertainties: cost of PV and renewal of federal tax credit
46
+2
-2
-8
Low Cost Base Case High Cost
NPV ($B)

Memorandum 3a: Solar Uncertainty
1. To which assumptions is the NPV results most sensitive?
2. Which costs/benefits were excluded from the analysis? What’s the likely impact (+ or -) on NPV of each?
3. Do you agree with the report’sconclusions? Why?
4. Add NPV to a copy of the simulation spreadsheet and attach to your memo
5. What is a reasonable confidence interval for NPV?
47

Discussion 3b: Limitations & Alternatives
48

Distribution Effects & Utility
• Hicks-Kaldor criterion
• Are some groups more deserving
• Social benefits/agenda
• Does ‘society’ include future generations?
• Utility is a measure of welfare that reflects preferences
W = ∑i U (ci)
Society
$
49

Games People Play with CBA
• Labor is a cost, not a benefit
• Moving economic activity
• Secondary benefits without secondary costs
• Transfers as benefits
• Double counting benefits
50

Critiques
• Incompleteness
• Subjectivity
• Present value
• Expensive
• Biased
• Anti-regulatory, pro-laissez-faire
• Amoral
Jacob A. Riis, “Five Cents a Spot”, Unauthorized Lodgings in Bayard St Tenement, ca. 1890 in ‘How the Other Half Lives: Studies Among the Tenements of New York’. Courtesy of the Museum of the City of New York, Jacob A. Riis Collection. www.reframingphotography.com/content/jacob-riis 51

Alternative 1: Cost Effectiveness Analysis
• When: benefits of alternatives are the same, intangible or mandatory• Healthcare
• Security
• How1. Calculate costs
2. Possibly: measure effectiveness
3. Rank, select projects up to budget
52

Alternative 2: Multi-Criteria Analysis
Criteria Weight Policy 1 Policy 2 Policy 3 Policy 4
Criteria 1 50% 5 4 2 3
Criteria 2 30% 4 4 3 2
Criteria 3 15% 2 2 2 1
Criteria 4 5% 3 4 4 2
Wtd. Avg. 4.15 3.70 2.40 2.35
53

Example: Reducing Traffic Delays
• Goal: save at least $8B hours per year
• Step 1: set up matrix; Step 2: remove dimensions
ORIGINAL DIMENSIONLESS
A. Highway
B. Highway
& Buses C. Railway A. Highway
B. Highway
& Buses C. Railway
Cost
($M) 500 600 1,000 Cost 0.50 0.60 1.00
Time Saving
(M Hrs/Yr) 10,000 8,000 6,000 Time Saving 1.00 0.80 0.60
CO2
Emissions (K-
Tons/Yr) 1,000 800 200
CO2
Emissions 1.00 0.80 0.20
Wildlife and
Amenity Bad Bad Moderate
Wildlife and
Amenity 0.67 0.67 1.00
54

Reducing Traffic Delays: Step 2
• Step 3: Apply weights
• Rank alternatives based on weighted scores
55
A. Highway
B. Highway
& Buses C. Railway Weights A. Highway
B. Highway
& Buses C. Railway
Cost 0.50 0.60 1.00 0.30 Cost 0.15 0.18 0.30
Time Saving 1.00 0.80 0.60 0.30 Time Saving 0.30 0.24 0.18
CO2
Emissions 1.00 0.80 0.20 0.20
CO2
Emissions 0.20 0.16 0.04
Wildlife and
Amenity 0.67 0.67 1.00 0.20
Wildlife and
Amenity 0.13 0.13 0.20
Weighted
Score 0.78 0.71 0.72
X =

Memorandum 3b
1. In Excel, replicate the Traffic Delay matrices
2. Adjust the weights to reflect different criteria weights. How do these affect outcomes?
3. Between CBA and CEA, which tool do you recommend for transportation policy questions like this? Why?
56

What Have We Learned?
What is in a CBA?
ExternalitiesOpportunity
Cost
What a sound decision looks
like
Time Value of Money (NPV,
IRR)
The right discount rate
How to value a life?
Risk & Uncertainty
No single answer
Manage risk LimitationsDon’t Eat the Marshmallow!
57

What Have We Learned?
What is in a CBA?
ExternalitiesOpportunity
Cost
What a sound decision looks
like
Time Value of Money (NPV,
IRR)
The right discount rate
How to value a life?
Risk & Uncertainty
No single answer
Manage risk LimitationsDon’t Eat the Marshmallow!
58