COST AND MANAGEMENT ACCOUNTING (BBA4 B06)
195
1 COST AND MANAGEMENT ACCOUNTING (BBA4 B06) STUDY MATERIAL IV SEMESTER BBA (2019 ADMISSION) UNIVERSITY OF CALICUT SCHOOL OF DISTANCE EDUCATION CALICUT UNIVERSITY P.O. MALAPPURAM – 673 635, KERALA 19660
Transcript of COST AND MANAGEMENT ACCOUNTING (BBA4 B06)

1
COST AND MANAGEMENT ACCOUNTING
(BBA4 B06)
STUDY MATERIAL
IV SEMESTER
BBA
(2019 ADMISSION)
UNIVERSITY OF CALICUT
SCHOOL OF DISTANCE EDUCATION
CALICUT UNIVERSITY P.O.
MALAPPURAM – 673 635, KERALA
19660

2
UNIVERSITY OF CALICUT
SCHOOL OF DISTANCE EDUCATION
BBA4B06 COST AND MANAGEMENT ACCOUNTING
Core Course – BBA 2019 Admission
Prepared by:
1. Dr.P Siddeeque
Assistant Professor
School of Distance Education, University of Calicut
2. Smt. T. ShameeraKunhu. T,
Assistant Professor, PTM Govt. College, Perintalmanna
3. Dr. Vinesh Ottuparammal,
Assistant Professor,Govt. College, Malappuram
4. Sri.T.H. Jahfarali,
Assistant Professor,Govt. College, Malappuram
Scruitinized by:
Dr.Abbas Vattoli
Assistant Professor
Amal College of Advanced Studies
Nilambur

3
Module Contents Page
I Cost Accounting 6 - 39
2 Material and Labour 40 – 75
3 Overheads and Preparation of Cost
Sheet 76 – 101
4 Methods of Costing 102 – 158
5 Marginal Costing & Budgetary
Control 159 - 195

4
Syllabus
BBA4B06 COST AND MANAGEMENT ACCOUNTING
Lectures Hours per week: 6 Credits: 4
Internal: 20, External: 80
Objective:
The objective of the course is to acquaint the students with the basic
Conceptsand tools of cost and Management Accounting
Learning Outcomes: On completing the course students will be able to:
1. Understand cost and management accounting concepts and its
application for decision making.
2. Aware as tocost consciousness and the various methods and
techniques of costing
Module I : Cost Accounting: Definition - Meaning and scope -
Objectives - Cost classification - Elements of cost - Cost units -Cost
centre - Types - Methods and Techniques of Costing - Management
Accounting:Meaning and scope - Objectives - Difference between cost
Accounting, Financial accounting and Management accounting.
10 Hours
Module II : Material and Labour: Material- Meaning and types.
Computation of: Stock levels- EOQ - Pricing of Issue of materials -
FIFO,LIFO, Simple and Weighted Average methods. Labour:
Computation of Labour cost - Time rate and piece rate system.
15 Hours

5
Module III : Overheads and Preparation of Cost Sheet: Overhead-
Meaning and Definition – concepts of overhead Allocation,
Apportionment and Absorption of overheads. (Simple problems
only)Preparation of Cost sheet-Format – objects and methods of cost
sheet preparation. 20 Hours
Module IV : Methods of Costing: - Job order costing: Meaning –
Features – preparation of job cost sheet - Process Costing:Meaning –
Features- normal and abnormal loss.
15 Hours
Module V : Marginal Costing & Budgetary Control: Marginal
costing- Concept-Meaning and computation of contribution, PV ratio
and BEP - Construction of Break Even Chart - Profit planning.
Budgetary Control : Concepts of Budget and Budgetary Control-
preparation of cash and flexible budget
20 Hours
(Theory and problems may be in the ratio of 30% and 70% respectively)
Reference Books:
Ravi M Kishore: Cost and Management accounting, Taxmann’s
Publications
Debarshi Bhattacharyya, Cost and Management, Pearson
Dr. S.N. Maheswari : Management Accounting, Vikas Publishing
S.P.JAIN, K.L.NARANG : Cost Accounting, Kalyani Publishers
Sharma and ShahiK Gupta : Management Accounting, Kalyani
Publishers.
N.K. Prasad : Cost Accounting
Horngren : Cost Accounting : A Managerial Emphasis.

6
Module I : Cost Accounting
Introduction
Cost Accounting is a branch of accounting and has been developed
due to limitations of financial accounting. Financial accounting is
primarily concerned with record keeping directed towards the
preparation of Profit and Loss Account and Balance Sheet. It
provides information regarding theprofit and loss that the business
enterprise is making and also its financial position on a particular
date. The financial accounting reports help the management to
control in a general way the various functions of the business but it
fails to give detailed reports on the efficiency of various divisions.
Costing and Cost Accounting
The costing terminology of C.I.M.A ., London defines costing as
the “the techniques and processes of ascertaining costs”. These
techniques consist of principles and rules which govern the
procedure of ascertaining cost of products or services. The
techniques to be followed for the analysis of expenses and the
processes by which such an analysis should be related to different

7
products or services differ from industry to industry. These
techniques are also dynamic and they change with time.
The main object of traditional cost accounts is the analysis of
financial records, so as to subdivide expenditure and to allocate it
carefully to selected cost centers, and hence to build up a total cost
for the departments, processes or jobs or contracts of the
undertaking. The extent to which the analysis of expenditure
should be carried will depend upon the nature of business and
degree of accuracy desired. The other important objective of
costing are cost control and cost reduction.
Cost Accounting may be regarded as “a specialized branch of
accounting which involves classification, accumulation,
assignment and control of costs.”
The costing terminology of C.I.M.A, London defines cost
accounting as “the process of accounting for costs from the point
at which expenditure is incurred or committed to the establishment
of its ultimate relationship with cost centers and cost units. In its
widest usage, it embraces the preparation of statistical data, the
application of cost control methods and the ascertainment of
profitability of activities carried out or planned”.
Wheldon defines cost accounting as “classifying, recording and
appropriate allocation of expenditure for determination of costs of

8
products or services and for the presentation of suitably arranged
data purposes of control and guidance of management”. It is thus a
formal mechanism by means of which costs of products or
services are ascertained and controlled.
General Principles of Cost Accounting
The following may be considered as the General Principles of Cost
Accounting:
1. A cost should be related to its causes: Cost should be related as
closely as possible to their causes so that cost will be shared only
among the cost units that pass thorough the department of which
the expenses are related.
2. A cost should be charged only after it has been incurred: While
determining the cost of individual units those costs which have
actually been incurred should be considered.
For example, a cost unit should not be charged to the selling costs,
while it is still in the factory. Selling costs can be charged with the
products which are sold.
3. The convention of prudence should be ignored: Usually
accountants believe in historical costs and while determining cost,
they always attach importance to historical cost. In Cost
Accounting this convention must be ignored, otherwise, the

9
management appraisal of the profitability of the projects may be
vitiated.
According to W.M. Harper, “a cost statement should, as far as
possible, give facts with no known bias. If a contingency needs to
be taken into consideration it should be shown separately and
distinctly”.
4. Abnormal costs should be excluded from cost accounts: Costs
which are of abnormal nature (eg. Accident, negligence etc.)
should be ignored while computing the cost, otherwise, it will
distort costs figures and mislead management as to working results
of their undertaking under normal conditions.
5. Past costs not to be charged to future period: Costs which could
not be recovered or charged in full during the concerned period
should not be taken to a future period, for recovery. If past costs
are included in the future period, they are likely to influence the
future period and future results are likely to be distorted.
6. Principles of double entry should be applied wherever
necessary: Costing requires a greater use of cost sheets and cost
statements for the purpose of cost ascertainment and cost control,
but cost ledger and cost control accounts should be kept on double
entry principle as far as possible.
Objectives of Cost Accounting
10
Cost accounting aims at systematic recording of expenses and
analysis of the same so as to ascertain the cost of each product
manufactured or service rendered by an organization. Information
regarding cost of each product or service would enable the
management to know where to economize on costs, how to fix
prices, how to maximize profits and so on. Thus, the main
objectives of cost accounting are the following.
1. To analyse and classify all expenditure with reference to the
cost of products and operations.
2. To arrive at the cost of production of every unit, job, operation,
process, department or service and to develop cost standard.
3. To indicate to the management any inefficiencies and the extent
of various forms of waste, whether of materials, time, expenses or
in the use of machinery, equipment and tools. Analysis of the
causes of unsatisfactory results may indicate remedial measures.
4. To provide data for periodical profit and loss accounts and
balance sheets at such intervals, e.g. weekly, monthly or quarterly
as may be desired by the management during the financial year,
not only for the whole business but also by departments or
individual products. Also, to explain in detail the exact reasons for
profit or loss revealed in total in the profit and loss accounts.

11
5. To reveal sources of economies in production having regard to
methods, types of equipment, design, output and layout. Daily,
Weekly, Monthly or Quarterly information may be necessary to
ensure prompt constructive action.
6. To provide actual figures of costs for comparison with estimates
and to serve as a guide for future estimates or quotations and to
assist the management in their price fixing policy.
7. To show, where Standard Costs are prepared, what the cost of
production ought to be and with which the actual costs which are
eventually recorded may be compared.
8. To present comparative cost data for different periods and
various volume of output and to provide guidance in the
development of business. This is also helpful in budgetary control.
9. To record the relative production results of each unit of plant
and machinery in use as a basis for examining its efficiency. A
comparison with the performance of other types of machines may
suggest the necessity for replacement.
10. To provide a perpetual inventory of stores and other materials
so that interim Profit and Loss Account and Balance Sheet can be
prepared without stock taking and checks on stores and
adjustments are made at frequent intervals. Also to provide the

12
basis for production planning and for avoiding unnecessary
wastages or losses of materials and stores.
Importance of Cost Accounting
The limitations of financial accounting have made the
management to realize the importance of cost accounting.
Whatever may be the type of business, it involves expenditure on
labour, materials and other items required for manufacturing and
disposing of the product. The management has to avoid the
possibility of waste at each stage. It has to ensure that no machine
remains idle, efficient labour gets due incentive, by-products are
properly utilized and costs are properly ascertained. Besides the
management, the creditors and employees are also benefited in
numerous ways by installation of a good costing system. Cost
accounting increases the overall productivity of an organization
and serves as an important tool, in bringing prosperity to the
nation, thus, the importance of cost accounting can be discussed
under the following headings:
a) Costing as an aid to management:- Cost accounting provides
invaluable aid to management.
It provides detailed costing information to the management to
enable them to maintain effective control over stores and
inventory, to increase efficiency of the organization and to check

13
wastage and losses. It facilitates delegation of responsibility for
important tasks and rating of employees. For all these the
management should be capable of using the information provided
by cost accounts in a proper way. The various advantages derived
by the management from a good system of costing are as follows:
1. Cost accounting helps in periods of trade depression and
trade competition. In periods of trade depression, the
organization cannot afford to have wastages which pass
unchecked. The management must know areas where economies
may be sought, waste eliminated and efficiency increased. The
organization must wage a war not only for its survival but also
continued growth. The management should know the actual cost
of their products before embarking on any scheme of price
reduction. Adequate system of costing facilitates this.
2. Cost accounting aids price fixation. Although the law of
supply and demand determines the price of the product, cost to the
producer does play an important role. The producer can take
necessary guidance from his costing records in case he is in a
position to fix or change the price charged.
3. Cost accounting helps in making estimates. Adequate costing
records provide a reliable basis for making estimates and quoting
tenders.
14
4. Cost accounting helps in channelizing production on right
lines. Proper costing information makes it possible for the
management to distinguish between profitable and non-profitable
activities; profits can be maximized by concentrating on profitable
operations and eliminating non-profitable ones.
5. Cost accounting eliminates wastages. As cost accounting is
concerned with detailed breakup of costs, it is possible to check
various forms of wastages or losses.
6. Cost accounting makes comparisons possible. Proper
maintenance of costing records provides various costing data for
comparisons which in turn helps the management in formulating
future lines of action.
7. Cost accounting provides data for periodical Profit and Loss
Account. Adequate costing records provide the management with
such data as may be necessary for preparation of Profit and Loss
Account and Balance Sheet at such intervals as may be desired by
the management.
8. Cost accounting helps in determining and enhancing
efficiency. Losses due to wastage of materials, idle time of
workers, poor supervision etc will be disclosed if the various
operations involved in the production are studied carefully.

15
Efficiency can be measured, cost controlled and various steps can
be taken to increase the efficiency.
9. Cost accounting helps in inventory control. Cost accounting
furnishes control which management requires, in respect of stock
of materials, work in progress and finished goods.
b) Costing as an aid to Creditors.
Investors, banks and other money lending institutions have a stake
in the success of the business concern are therefore benefitted
immensely by the installation of an efficient system of costing.
They can base their judgment about the profitability and future
prospects of the enterprise on the costing records.
c) Costing as an aid to employees.
Employees have a vital interest in their employer’s enterprise in
which they are employed. They are benefited by a number of ways
by the installation of an efficient system of costing. They are
benefited, through continuous employment and higher
remuneration by way of incentives, bonus plans, etc.
d) Costing as an aid to National Economy
An efficient system of costing brings prosperity to the business
enterprise which in turn brings prosperity to the business
enterprise which in turn results in stepping up of the government
revenue. The overall economic development o f a country takes

16
place as a consequence of increase in efficiency of production.
Control of costs, elimination of wastages and inefficiencies led to
the progress of the industry and, in consequence of the nation as a
whole.
Cost units- The Chartered Institute of Management Accountants,
London, defines a unit of cost as “a unit of quantity of product,
service or time in relation to which costs may be ascertained or
expressed”. The forms of measurement used as cost units are
usually the units of physical measurements like number, weight,
area, length, value, time etc.
Following are some examples of cost unit.
Industry/product Cost unit basis
Automobile Numbers
Brick works per 1000 bricks
Cement per Tonne
Chemicals Litre, gallon, kilogram, ton
Steel Tonne
Sugar Tonne
Transport Passenger-km, tonne- km
Cost centre – According to Chartered Institute of Management
Accountants, London, cost centre means “a location, person or
item of equipment (or group of these) for which costs may be

17
ascertained and used for the purpose of cost control”. Cost centre
is the smallest organizational subunit for which separate cost
collection is attempted. Thus cost centre refers to one of the
convenient unit into which the whole factory organization has
been appropriately divided for costing purposes. Each such unit
consists of a department or a sub-department or item of equipment
or , machinery or a person or a group of persons.
For example, although an assembly department may be supervised
by one foreman, it may contain several assembly lines. Some
times each assembly line is regarded as a separate cost centre with
its own assistant foreman.
The selection of suitable cost centres or cost units for which costs
are to be ascertained in an undertaking depends upon a number of
factors which are listed as follows.
1. Organization of the factory
2. Conditions of incidence of cost
3. Requirements of the costing system ie. Suitability of the units or
centres for cost purposes.
4. Availability of information
5. Management policy regarding making a particular choice from
several alternatives.

18
Profit centre – A profit centre is that segment of activity of a
business which is responsible for both revenue and expenses and
discloses the profit of a particular segment of activity. Profit
centres are created to delegate responsibility to individuals and
measure their performance.
Difference between Profit centre and Cost centre
The various points of difference between Profit centre and cost
centre are as follows. Cost centre is the smallest unit of activity or
area of responsibility for which costs are collected whereas a profit
centre is that segment of activity of a business which is responsible
for both revenue and expenses.
(i) Cost centres are created for accounting conveniences of costs
and their control whereas as a profit centre is created because of
decentralization of operations i.e., to delegate responsibility to
individuals who have greater knowledge of local conditions etc.
(ii) Cost centers are not autonomous whereas profit centres are
autonomous.
(iii) A cost centre does not have target cost but efforts are made to
minimize costs, but each profit centre has a profit target and
enjoys authority to adopt such policies as are necessary to achieve
its targets.

19
(iv) There may be a number of cost centres in a profit centre in a
profit centre as production or service cost centres or personal or
impersonal but a profit centre may be a subsidiary company within
a group or division in a company.
Cost classification
Costs can be classified or grouped according to their common
characteristics. Proper classification of costs is very important for
identifying the costs with the cost centers or cost units.
The same costs are classified according to different ways of
costing depending upon the purpose to be achieved and
requirements of a particular concern. The important ways of
classification are:
1. By Nature or Elements. According to this classification the
costs are classified into three categories i.e., Materials, Labour and
Expenses. Materials can further be sub-classified as raw materials
components, spare parts, consumable stores, packing materials etc.
This helps in finding the total cost of production and the
percentage of materials (labour or other expenses) constituted in
the total cost. It also helps in valuation of work-in-progress.
2. By Functions: This classification is on the basis of costs
incurred in various functions of an organization ie. Production,
administration, selling and distribution. According to this

20
classification, costs are divided into Manufacturing and Production
Costs and Commercial costs.
Manufacturing and Production Costs are costs involved in
manufacture, construction and fabrication of products.
Commercial Costs are (a) administration costs (b) selling and
distribution costs.
3. By Degree of Traceability to the Product : According to this,
costs are divided as direct costs and indirect costs.
Direct Costs are those costs which are incurred for a particular
product and can be identified with a particular cost centre or cost
unit. Eg:- Materials, Labour.
Indirect Costs are those costs which are incurred for the benefit of
a number of cost centre or cost units and cannot be conveniently
identified with a particular cost centre or cost unit. Eg:- Rent of
Building, electricity charges, salary of staff etc.
4. By Changes in Activity or Volume: According to this costs are
classified according to their behavior in relation to changes in the
level of activity or volume of production. They are fixed, variable
and semi-variable.
Fixed Costs are those costs which remain fixed in total amount
with increase or decrease in the volume of the output or productive
activity for a given period of time. Fixed Costs per unit decreases

21
as production increases and vice versa. Eg:- rent, insurance of
factory building, factory manager’s salary etc. Variable Costs are
those costs which vary in direct proportion to the volume of
output. These costs fluctuate in total but remain constant per unit
as production activity changes. Eg:- direct material costs, direct
labour costs, power, repairs etc.
Semi-variable Costs are those which are partly fixed and partly
variable. For example; Depreciation, for two shifts working the
total depreciation may be only 50% more than that for single shift
working. They may change with comparatively small changes in
output but not in the same proportion.
5. Association with the Product: Cost can be classified as
product costs and period costs. Product costs are those which are
traceable to the product and included in inventory cost, thus
product cost is full factory cost. Period costs are incurred on the
basis of time such as rent, salaries etc. thus it includes all selling
and administration costs. These costs are incurred for a period and
are treated as expenses.
6. By Controllability: The CIMA defines controllable cost as “a
cost which can be influenced by the action of a specified member
of an undertaking” and a non-controllable cost as “a cost which

22
cannot be influenced by the action of a specified member of an
undertaking”.
7. By Normality: There are normal costs and abnormal costs.
Normal costs are the costs which are normally incurred at a given
level of output under normal conditions. Abnormal costs are costs
incurred under abnormal conditions which are not normally
incurred in the normal course of production.Eg:- damaged goods
due to machine break down, extra expenses due to disruption of
electricity, inefficiency of workers etc.
8. By Relationship with Accounting Period: There are capital
and revenue expenses depending on the length of the period for
which it is incurred. The cost which is incurred in purchasing an
asset either to earn income or increasing the earning capacity of
the business is called capital cost, for example, the cost of a
machine in a factory. Such cost is incurred at one point of time but
the benefits accruing from it are spread over a number of
accounting years. The cost which is incurred for maintaining an
asset or running a business is revenue expenditure. Eg:- cost of
materials, salary and wages paid, depreciation, repairs and
maintenance, selling and distribution.
9. By Time..Costs can be classified as 1) Historical cost and 2)
Predetermined Costs. The costs which are ascertained and

23
recorded after it has been incurred is called historical costs. They
are based on recorded facts hence they can be verified and are
always supported by evidences. Predetermined costs are also
known as estimated costs as they are computed in advance of
production taking into consideration the previous periods’ costs
and the factors affecting such costs. Predetermined costs when
calculated scientifically become standard costs. Standard costs are
used to prepare budgets and then the actual cost incurred is later-
on compared with such predetermined cost and the variance is
studied for future correction.
Types, Methods and Techniques of Costing
The general fundamental principles of ascertaining costs are the
same in every system of cost accounting, but the methods of
analysis and presenting the costs vary from industry to industry.
Different methods are used because business enterprises vary in
their nature and in the type of products or services they produce or
render. Basically, there are two principal methods of costing,
namely (i) Job Costing, and (ii) Process costing.
1. Job costing: It refers to a system of costing in which costs are
ascertained in terms of specific jobs or orders which are not
comparable with each other. Industries where this method of
costing is generally applied are Printing Process, Automobile

24
Garages, Repair Shops, Shipbuilding, House building, Engine and
Machine construction, etc. Job Costing includes the following
methods of costing:
(a) Contract Costing: Although contract costing does not differ in
principle from job costing, it is convenient to treat contract cost
accounts separately. The term is usually applied to the costing
method adopted where large scale contracts at different sites are
carried out, as in the case of building construction.
(b) Bach Costing: This method is also a type of job costing. A
batch of similar products is regarded as one job and the cost of this
complete batch is ascertained. It is then used to determine the unit
cost of the articles produced. It should, however, be noted that the
articles produced should not lose their identity in manufacturing
operations.
(c) Terminal Costing: This method is also a type of job costing.
This method emphasizes the essential nature of job costing, ie, the
cost can be properly terminated at some point and related to a
particular job.
(d) Operation Costing: This method is adopted when it is desired
to ascertain the cost of carrying out an operation in a department,
for example, welding. For large undertaking, it is frequently
necessary to ascertain the cost of various operations.

25
2. Process Costing: Where a product passes through distinct
stages or processes, the output of one process being the input of
the subsequent process, it is frequently desired to ascertain the cost
of each stage or process of production. This is known as process
costing. This method is used where it is difficult to trace the item
of prime cost to a particular order because its identity is
lost in volume of continuous production. Process costing is
generally adopted in textile industries, chemical industries, oil
refineries, soap manufacturing, paper manufacturing, tanneries,
etc.
3. Unit or single or output or single output costing: This method
is used where a single article is produced or service is rendered by
continuous manufacturing activity. The cost of the whole
production cycle is ascertained as a process or series of processes
and the cost per unit is arrived at by dividing the total cost by the
number of units produced. The unit of costing is chosen according
to the nature of the product. Cost statements or cost sheets are
prepared under which various items of expenses are classified and
the total expenditure is divided by total quantity produced in order
to arrive at unit cost of production. This method is suitable in
industries like brick-making, collieries, flour mills, cement

26
manufacturing, etc. this method is useful for the assembly
department in a factory producing a mechanical article eg. Bicycle.
4. Operating Costing: This method is applicable where services
are rendered rather than goods produced. The procedure is same as
in the case of single output costing. The total expenses of the
operation are divided by the units and cost per unit of services is
arrived at. This method is employed in Railways, Road Transport,
Water supply undertakings, Telephone services, Electricity
companies, Hospital services, Municipal services, etc.
5. Multiple or Complete Costing: Some products are so complex
that no single system of costing is applicable. It is used where
there are a variety of components separately produced and
subsequently assembled in a complex production. Total cost is
ascertained by computing component costs which are collected by
job or process costing and then aggregating the costs through use
of the single or output costing system. This method is applicable to
manufacturing concerns producing Motor Cars, Aeroplanes,
Machine tools, Type-writers, Radios, Cycles, Sewing Machines,
etc.
6. Uniform Costing: It is not a distinct method of costing by
itself. It is the name given to a common system of costing

27
followed by a number of firms in the same industry. This helps in
comparing performance of one firm with that of another.
7. Departmental Costing: When costs are ascertained department
by department, the method is called “Departmental Costing”.
Usually, for ascertaining the cost of various goods or services
produced by the department, the total costs will have to be
analysed, say, by the use of job costing or unit costing.
In addition to the above methods of costing, mention can be made
of the following techniques of costing which can be applied to any
one of the above method of costing for special purposes of cost
control and policy making:
a) Standard or Predetermined Costs.
b) Marginal Costs
Elements of Cost- The management of an organization needs
necessary data to analyze and classify costs for proper control and
for taking decisions for future course of action. Hence the total
cost is analyzed by elements of costs ie by the nature of expenses.
The elements of costs are three and they are materials, labour and
other expenses. These can be further analyzed as follows.

28
→ Production/ works Overheads
→ Administration overheads
→ Selling overheadsssss
→ Distribution overheads
By grouping the above elements of cost, the following divisions of
cost are obtained.
1. Prime cost = Direct Materials + Direct Labour+ Direct
Expenses
Elements of cost
Material
Direct
Indirect
Labour
Direct
Indirect
Expenses
Direct
Indirect
Overhead

29
2. Works or Factory Cost = Prime Cost + Works or Factory
Overheads
3. Cost of Production = Works Cost + Administration Overheads
4. Total Cost or Cost of Sales = Cost of Production + Selling and
Distribution Overheads
The difference between the cost of sales and selling price
represents profit or loss.
Illustration 1. Find the Prime Cost, Works Cost, Cost of
production, total Cost and profit from the following:- Direct
Materials Rs.20000; Direct Labour Rs. 10000; Factory Expenses
Rs. 7000; Administration Expenses Rs. 5000; Selling Expenses
Rs. 7000 and Sales Rs.60,000.
Solution:
Prime Cost = Direct Materials + Direct Labour = Rs.20,000 +
Rs.10,000 = Rs.30,000.
Works Cost = Prime Cost + Factory Expenses = Rs.30,000 +
Rs.7,000 = Rs.37,000.
Cost of Production = Works Cost + Administration
Expenses=Rs.37000+ Rs.5, 000 = Rs.42, 000.
Total Cost or Cost of sales= Cost of Production + Selling
Expenses = Rs.42, 000+ Rs.7, 000 = Rs.49, 000.
Profit = Sales - Total Cost = Rs.60,000 - Rs.49,000=Rs.11, 000.

30
These terms can be explained as follows
1. Direct Materials are those materials which can be identified in
the product and can be conveniently measured and directly
charged to the product. For example, bricks in houses, wood in
furniture etc. Hence all raw materials, materials purchased
specifically for a job or process like glue for book making, parts or
components purchased or produced like batteries for radios and
tyres for cycles, and primary packing materials are direct
materials.
2. Indirect Materials are those materials which cannot be
classified as direct materials. Examples are consumables like
cotton waste, lubricants, brooms, rags, cleaning materials,
materials for repairs and maintenance of fixed assets, high speed
diesel used in power generators etc.
3. Direct Labour is all labour expended in altering the
construction, composition, confirmation or condition of the
product. Thus direct wages means the wages of labour which can
be conveniently identified or attributed wholly to a particular job,
product or process or expended in converting raw materials into
finished goods. Thus payment made to groups of labourers
engaged in actual production, or carrying out of an operation or

31
process, or supervision, maintenance, tools setting, transportation
of materials, inspection, analysis etc is direct labour.
4. Direct Expenses are expenses directly identified to a particular
cost centre. Hence expenses incurred for a particular product, job,
department etc are direct expenses. Example royalty, excise duty,
hire charges of a specific plant and equipment, cost of any
experimental work carried out especially for a particular job,
travelling expenses incurred in connection with a particular
contract or job etc.
5. Overheads may be defined as the aggregate of the cost of
indirect materials, indirect labour and such other expenses
including services as cannot conveniently be charged direct ot
specific cost units. Overheads may be sub-divided into
(i) Manufacturing Overheads;
(ii) Administration Overheads;
(iii) Selling Overheads;
(iv) Distribution Overheads;
(v) Research and Development Overheads.
Cost Accounting and Financial Accounting-
Both financial accounting and cost accounting are concerned with
systematic recording and presentation of financial data. Financial
accounting reveals profits and losses of the business as a whole

32
during a particular period, while cost accounting shows, by
analysis and localization, the unit costs and profits and losses of
different product lines. The main difference between financial
accounting and cost accounting are summarized below.
1. Financial accounting aims at safeguarding the interests of the
business and its proprietors and others connected with it. This is
done by providing suitable information to various
parties, such as shareholders or partners, present or prospective
creditors etc. Cost accounting on the other hand, renders
information for the guidance of the management for proper
planning, operation, control and decision making.
2. Financial accounts are kept in such a way as to meet the
requirements of the Companies Act, Income Tax Act and other
statues. On the other hand cost accounts are generally kept
voluntarily to meet the requirements of the management. But now
the Companies Act has made it obligatory to keep cost records in
some manufacturing industries.
3. Financial accounting emphasizes the measurement of
profitability, while cost accounting aims at ascertainment of costs
and accumulates data for this very purpose.
4. Financial accounts disclose the net profit and loss of the
business as a whole, whereas cost accounts disclose profit or loss
33
of each product, job or service. This enables the management to
eliminate less profitable product lines and maximize the profits by
concentrating on more profitable ones.
5. Financial accounting provides operating results and financial
position usually gives information through cost reports to the
management as and when desired.
6. Financial accounts deal mainly with actual facts and figures, but
cost accounts deal partly with facts and figures, but cost accounts
deal with facts and figures and partly with estimates.
7. In case of financial accounts stress is on the ascertainment and
exhibition of profits earned or losses incurred in the business. On
account of this reason in financial accounts, the transactions are
recorded, classified and analyzed in a subjective manner i.e.
according to the nature of expenditure. In cost accounts the
emphasis is more on aspects of planning and control and therefore
transactions are recorded in an objective manner.
8. Financial accounts are concerned with external transactions i.e.
transactions between the business concern on one side and third
parties on the other. These transactions form the basis for payment
or receipt of cash. While cost accounts are concerned with internal
transactions which do not form the basis of payment or receipt of
cash.

34
9. The costs are reported in aggregate in financial accounts but
costs are broken into unit basis in cost accounts.
10. Financial accounts do not provide information on the relative
efficiencies of various workers, plants and machinery while cost
accounts provide valuable information on the relative efficiencies
of various plants and machinery.
11. In financial accounts stocks are valued at cost or market price
whichever is less, whereas stocks are valued at cost price in cost
accounts.
Management Accounting
Management accounting is developedmainly to help the
management in the discharge of its functions and for taking
various decisions.
According to the Institute of Chartered Accountants of England
and Wales “any form of accounting which enables a business to be
conducted more efficiently can be regarded as Management
Accounting “
The term management accounting is composed of 'management'
and 'accounting ‘It is the use of Accounting Information for
discharging Management functions, especially planning and
decision making.

35
Scope of Management Accounting
Management accounting is concerned with presentation of
accounting information in the most useful way for the
management. Its scope is, therefore, quite vast and includes within
its fold almost all aspects of business operations.
However, the following areas can rightly be identified as falling
within the ambit of management accounting:
(i) Financial Accounting: Management accounting is mainly
concerned with the rearrangement of the information provided by
financial accounting. Hence, management cannot obtain full
control and coordination of operations without a properly designed
financial accounting system.
(ii) Cost Accounting: Standard costing, marginal costing,
opportunity cost analysis, differential costing and other cost
techniques play a useful role in operation and control of the
business undertaking.
(iii) Revaluation Accounting: This is concerned with ensuring
that capital is maintained intact in real terms and profit is
calculated with this fact in mind.
Cost Accounting and Management Accounting
Cost accounting is the process of accounting for costs. It embraces
the accounting procedures relating to recording of all income and

36
expenditure and the preparation of periodical statements and
reports with the object of ascertaining and controlling costs. It is,
thus, the formal mechanism by means of which the costs of
products or services are ascertained and controlled. On the other
hand, management accounting involves collecting, analyzing,
interpreting and presenting all accounting information, which is
useful to the management. It is closely associated with
management control, which comprises planning, executing,
measuring and evaluating the performance of an organization.
Thus, management accounting draws heavily on cost data and
other information derived from cost accounting.
Today cost accounting is generally indistinguishable from the so-
called management accounting or internal accounting because it
serves multiple purposes. However, management accounting can
be distinguished from cost accounting in one important respect.
Management accounting has a wider scope as compared to cost
accounting. Cost accounting deals primarily with cost data while
management accounting involves the considerations of both cost
and revenue. Management accounting is an all inclusive
accounting information system, which covers financial accounting,
cost accounting, and all aspects of financial management. But it is
not a substitute for other accounting functions. It involves a

37
continuous process of reporting cost, financial and other relevant
data in an analytical and informative way to management. We
should not be very much concerned with boundaries of cost
accounting and management accounting since they are
complementary in nature. In the absence of a suitable system of
cost accounting, management accountant will not be in a position
to have detailed cost information and his function is bound to lose
significance. On the other hand, the management accountant
cannot effectively use the cost data unless it has been reported to
him in a meaningful and informative form.
Objectives of Management Accounting
The primary objective is to enable the management to maximize
profits or minimize losses. The fundamental objective of
management accounting is to assist management in their functions.
The other main objectives are:
1. Planning and policy formulation: planning is one of the primary
functions of management. It involves forecasting on the basis of
available information.
2. Help in the interpretation process: The main object is to present
financial information. The financial information must be presented
in easily understandable manner.

38
3. Helps in decision making: Management accounting makes
decision making process more modern and scientific by providing
significant information relating to various alternatives.
4. Controlling: The actual results are compared with pre
determined objectives. The management is able to control
performance of each and every individual with the help of
management accounting devices.
5. Reporting: This facilitates management to take proper and
timely decisions. It presents the different alternative plans before
the management in a comparative manner.
6. Motivating: Delegation increases the job satisfaction of
employees and encourages them to look forward. so it serves as a
motivational devise.
7. Helps in organizing: “return on capital employed” is one of the
tools if management accounting. All these aspects are helpful in
setting up effective and efficient organization.
8. Coordinating operations: It provides tools which are helpful in
coordinating the activities of different sections
Distinction between Financial Accounting and Management
Accounting

39
Financial accounting is concerned with the recording of day to day
transactions of the business. Management accounting is to provide
the quantitative as well as the qualitative to the management.
Financial Accounting Management Accounting
It gives the periodical reports to
owners, creditors and government.
Its assist the internal management.
It concerned with historical
records.
It concerned with future plans and
policies
It deals the business as a whole. It deals only a limited coverage.
Here standards are fixed by
externalparties.
Standards are fixed by
management itself.
Statutory for every business. Adopted on voluntary basis.
The period is longer. It’s prepared when its required.
Transactions are very accurate. Sometimes approximate figures
are used.
Recognizes whole business as unit
of account.
Results of the divisions.
Covers entire range of business
inmonetary items.
Non monetary items are
considered.
It’s very essential for the use of
public.
It’s for management only.
It has principles and conventions. No such principles.

40
Module II : Material and Labour
Materials
The materials are a major part of the total cost of producing a
product and are one of the most important assets in majority of the
business enterprises. Hence the total cost of a product can be
controlled and reduced by efficiently using materials.
The materials are of two types, namely:
(a).Direct materials: The materials which can be easily
identified and attributable to the individual units being
manufactured are known as direct materials. These materials
also form part of finished products. All costs which are
incurred to obtain direct materials are known as direct material
costs.
(b).Indirect materials: Indirect materials, on the other hand, are
those materials which are of small value such as nuts, pins,
screws, etc. and do not physically form part of the finished
product.
Costs associated with indirect materials are known as indirect
material costs.

41
Factory supplies, office supplies and selling supplies are generally
termed as stores.
Storekeeping
Store keeping is a service function. The storekeeper is a custodian
of all the items kept in the store. The stores should be maintained
properly and cost minimized.
The main objectives of store keeping are:-
i) To protect stores against losses
ii) To keep goods ready for delivery/issue
iii) To provide maximum service at minimum cost.
The duties and functions of Store-keeper can be summarized as
follows:
i) Materials should be received, unloaded, inspected and then
moved to stores. The materials have to be stored in appropriate
places and records the receipts in proper books.
ii) The stores records should be maintained in an efficient and
orderly manner so that materials can be easily located and
information can be obtained for various departments.
iii) The stores should provide maximum protection and safety
and accessibility and utilize minimum space. Suitable storage
devices should be installed.

42
iv) The materials should be given special covering to prevent
damage due to atmospheric conditions.
v) All issues should be properly recorded, efficiently, promptly
and accurately. All issues should be duly authorized and
procedures laid down should be duly followed.
vi) The storekeeper is responsible for co-ordination with
materials control according to the type of production, size of
the company, the organization structure etc.
vii) Ensure that all transactions are posted in the Bin Card see
that the Bin Card is up-todate.
viii) All items should be in its proper place.
ix) Maintenance of stores at required levels.
x) Neatness in stores to facilitate physical verification.
xi) Co-ordination and supervision of staff in the stores
department.
xii) Periodical review of various scales, measuring instruments,
conversion ratios etc.
xiii) Protect stores from fires, rust, erosion, dust, theft,
weather, heat, cold, moisture and deterioration etc.
Requisitioning for Stores
One of the duties of the storekeeper is to send requisitions for
materials for replenishment in time so that the production is not
43
held up due to shortage of materials. The storekeeper should also
see that there is no unnecessary blocking of capital due to
overstocking of materials. For this he keeps a check on the re-
order level, economic ordering quantity, and the maximum and
minimum quantity which he is authorized to store in respect of
each kind of material.
(a) Re-ordering Level
Re-ordering level is that point of level of stock of a material where
the storekeeper starts the process of initiating purchase requisition
for fresh supplies of that materials. This level is fixed somewhere
between the maximum and minimum levels in such a way that the
difference of quantity of the material between the re-ordering level
and minimum level will be sufficient to meet the requirements of
production until the fresh supply of the materials is received.
Re-ordering Level= Minimum Level + Consumption during the
time required to get the fresh delivery
According to Wheldon,
Re-ordering Level= Maximum Level x Minimum re-order period.
Here, maximum re-order period means the maximum period taken
to get the material once the order for new material is placed.
Wheldon has taken the maximum period and maximum

44
consumption during that period so that factory may not stop
production due to shortage of materials.
Illustration: 3. Calculate the ordering level of material A from the
following particulars:
Minimum Limit 1,000 units.
Maximum Limit 5,000 units.
Daily requirement of material 200 units.
Time required for fresh delivery 10 days.
Solution
Ordering Level=Minimum limit + Consumption during the time
required for fresh delivery
= 1000 units+ 200 units x 10 days = 3000 units
Order for the purchase of material should be placed when the
material in stock reaches 3,000 units.
Illustration: 4. Calculate the re-ordering level from the following
information:
Maximum consumption = 500 units per day
Minimum consumption = 400 units per day
Re-order period = 10 to 12 days
Solution
Re-order Level = Maximum consumption x maximum re-order
period

45
= 500 units x 12 days = 6000 units.
(b) Economic Ordering Quantity
The quantity of material to be ordered at one time is known as
economic ordering quantity. This quantity is fixed in such a
manner as to minimize the cost of ordering and carrying the
stock.
The total costs of a material usually consist of:
Total acquisition cost + total ordering cost + total carrying
cost.
Since the acquisition cost per unit of material is same whatever
is the quantity purchased, it is usually excluded when deciding
the quantity of a material to be ordered at one time. The only
costs to be taken care of are the ordering costs and carrying
costs which vary with the quantity ordered.
Carrying Cost: It is the cost of holding the materials in the
store and includes:
1. Cost of storage space which could have been utilized for
some other purpose.
2. Cost of bins and racks
3. Cost of maintaining the materials to avoid deterioration.
4. Amount of interest payable on the amount of money locked
up in the materials.

46
5. Cost of spoilage in stores and handling.
6. Transportation cost in relation to stock.
7. Cost of obsolescence of materials due to change in the
process or product.
8. Insurance cost
9. Clerical cost etc.
In India all these costs amount to 20 to 25 % of the cost of
materials per year. Hence it becomes necessary to reduce
such carrying cost for efficient operations.
Ordering Cost: It is the cost of placing orders for the purchase of
materials and includes:
1. Cost of staff posted in the purchasing department,
inspection section and stores accounts department.
2. Cost of stationary postage and telephone charges.
Thus, this type of costs includes cost of floating tenders, cost of
comparative evaluation of quotations, cost of paper work, and
postage involved in placing the order, cost of inspection and cost
of accounting and making payments. In other words, the cost
varies with the number of orders.
When the quantity of materials ordered is less, the cost of carrying
will decrease but ordering cost will increase and vice versa.

47
Q = √2𝐶𝑂
I
Q = Quantity to be ordered
C = Consumption of the material concerned in units during a year.
O = Cost of placing one order including the cost of receiving the
goods i.e. the cost of getting an item into the firms inventory
I = Interest payment including variable cost of storing per unit per
year i.e holding costs of inventory.
Illustration 4: Find out the economic ordering quantity (EOQ)
from the following particulars.
Annual usage: 6000 units
Cost of material per unit: Rs. 20
Cost of Placing and receiving one order: Rs.60
Annual carrying cost of one unit: 10% of inventory value.
Solution
EOQ =√2𝐶𝑂
I
Where C = Annual usage of material ie6,000 units
O = Cost of placing one order ie Rs.60
Annual carrying cost of one unit: Rs. 20 x 10% = Rs. 2
EOQ =√2×6000 𝑢𝑛𝑖𝑡𝑠 ×60
2 = √3600 = 600 units
c) Minimum Level or Safety Stock level

48
The minimum level is the minimum quantity of the material
which must be maintained in hand at all times. The quantity is
fixed so that the production is not held up due to shortage of the
materials. In fixing this level, the following factors should be
considered:
1. Lead time i.e. time lag between indenting and receiving of
the material. It is the time required to replenish the supply.
2. Rate of consumption of the material during the lead time.
3. Nature of the material. Minimum level is not required in
case of a special material which is required against
customer’s specific order.
Formula for calculating minimum level or safety stock level given
by Wheldon is as follows:
Minimum Stock Level = Re-ordering level – (Normal
consumption x Normal Re-order period)
d) Maximum Level
It is the maximum of stock which should be held in stock at any
time during the year. The quantity is fixed so as to avoid
overstocking as it leads to the following disadvantages.
1. Overstocking leads to increase in working capital
requirement which could be profitable used somewhere
else.
49
2. Overstocking will need more godown space, so more rent
will have to be paid.
3. It may also lead to obsolescence on account of
overstocking.
4. There are chances that the quality of materials will
deteriorate because large stock will require more time
before they are consumed.
5. There may be fear of depreciation in market values of the
overstocked materials.
According to Wheldon,
Maximum Stock level = Reordering level + Re-ordering
Quantity –
(Minimum consumption x Minimum re-
ordering period)
e) Danger Level
This level means that level of stock at which normal issues of the
material are stopped and issues are made only under specific
instructions. The purchase officer will make special arrangements
to get the materials which reach at their danger levels so that the
production may not stop due to shortage of materials.
Danger Level = Average consumption x Max.re-order
period for emergency purchases.

50
f) Average Stock Level
The average stock level is calculated by the following formula:
Average Stock Level = Minimum Stock Level + ½ of Re-order
Quantity.
Or ½ (Minimum Stock Level + Maximum Stock Level)
Illustration 5: Calculate the minimum stock level, maximum
stock level, re-ordering level and average stock level from the
following information:
(i) Minimum consumption = 100 units per day
(ii) Maximum consumption = 150 units per day
(iii) Normal consumption = 120 units per day
(iv) Re-order period = 10-15 days
(v) Re-order quantity = 1,500 units
(vi) Normal re-order period = 12 days
Solution
Re-ordering Level = Maximum Consumption x Maximum re-
order period
= 150 units x 15 days = 2,250 units
Minimum Stock Level = Re-ordering Level-(Normal
consumption x Normal re-order period)
= 2,250 – (120 x12) = 810 units

51
Maximum Stock Level = Re-ordering Level + Re-order Quantity
– (Minimum Consumption x Minimum
Re-Order Period)
= 2,250 + 1500 – (100 x 10) = 2,750 units
Average stock Level = Minimum Stock Level + ½ Re-order
Quantity
= 810 units + ½ x 1500 units = 1,560 units
Stores (or Materials) records
In the stores the most important two records kept are bin cards and
stores ledger.
(a) Bin Card: A bin card is a record of the receipt and issue of
material and is prepared by the store keeper for each item of
stores. A bin card is also known as bin tag or stock card and is
usually kept in the rack where the material is kept. In a bin
card not only the receipt and issue of material is recorded,
minimum quantity, maximum quantity and ordering quantity
are stated on the card. This helps the store keeper to send the
material requisition for the purchase of material in time.
(b) Stores Ledger: This ledger is kept in the costing department
and is identical with the bin card except that receipts, issues
and balances are shown along with their money values. This

52
provides the information for the pricing of materials issued and
the money value at any time of each item of stores.
Issue of materials
Materials issued from stores are debited to the jobs or work
orders which received them and credited to the materials
account. These jobs are debited with the value of materials
issued to them.
Theoretically the value includes the invoice price less trade
discount, the freight, cartage, octroi and insurance on incoming
materials, expenses of purchase, receiving, storing and record
keeping and carriage from the stores up to the process plant.
However, in practice, it involves minute calculations for
including all these expenses and is a big task compared to the
benefit derived from it.
Moreover the price changes according to the market conditions
and at any given time there will be stock of materials
purchased at different times at different prices. Hence the
problem as to at what price the materials should be
issued?There are many methods of pricing material issues. The
most important being: FIFO, LIFO, simple and weighed
average methods.
1) First in First Out (FIFO)

53
Under this method material is first issued from the earliest
consignment on hand and priced at the cost at which that
consignment was placed in the stores. In other words, materials
received first are issued first. The units in the opening stock of
materials are treated as if they are issued first, the units from
the first purchase issued next, and so on until the units left in
the closing stock of materials are valued at the latest cost of
purchases.
This method is most suitable in times of falling prices because
the issue price of materials to jobs or work order will be high
while the cost of replacement of materials will be low. But in
case of rising prices this method is not suitable because the
issue price of materials to production will be low while the
cost of replacement of materials will be high. The following
example will illustrate how issues of materials are valued
under this method.
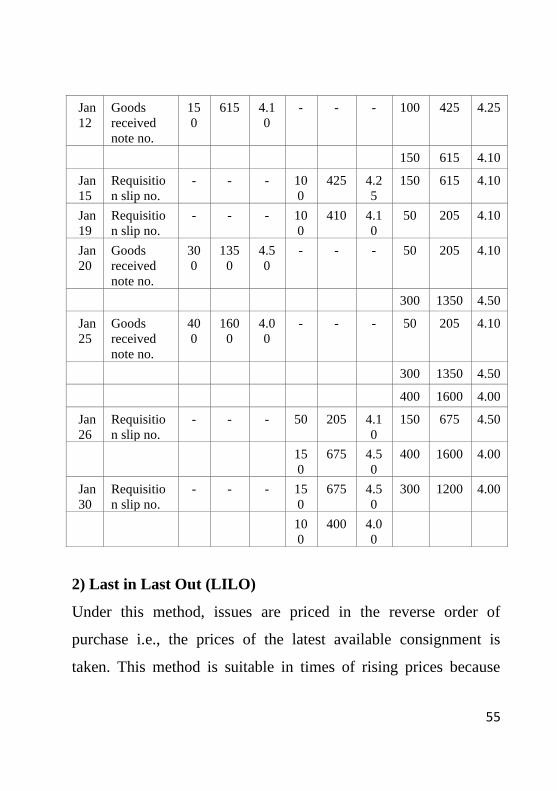
Illustration 6: The received side of the Stores Ledger Account
shows the following particulars:
Jan. 1 Opening Balance: 500 units @ Rs. 4
Jan. 5 Received from vendor: 200 units @ Rs. 4.25
Jan.12 Received from vendor: 150 units @ Rs. 4.10

54
Jan.20 Received from vendor: 300 units @ Rs. 4.50
Jan.25 Received from vendor: 400 units @ Rs.4
Issues of material were as follows:
Jan. 4- 200 units; Jan.10- 400 units; Jan. 15- 100 units; Jan
19- 100 units; Jan.26- 200 units; Jan.30- 250 units.
Issues are to be priced on the principle of “first in first
out”. Write the Stores Ledger Account in respect of the
materials for the month of January.
Solution:
Dat
e Particulars
Receipts Issues Balance
Qu
anti
ty
(Un
its)
To
tal
Co
st(R
s)
Un
it
cost
(Rs)
Qu
anti
ty
(un
its)
To
tal
Co
st(R
s)
Un
it
cost
(Rs)
Qu
anti
ty
(un
its)
Am
ou
nt
(Rs)
Per
un
it(R
s)
Jan
1
Balance
b/d
- - - - - - 500 2000 4
Jan
4
Requisitio
n slip no.
- - - 20
0
800 4 300 1200 4
Jan
5
Goods
received
note no.
……
20
0
850 4.2
5
- - - 300 1200 4
200 850 4.25
Jan
10
Requisitio
n slip no.
- - - 30
0
120
0
4
10
0
425 4.2
5
100 425 4.25
55
Jan
12
Goods
received
note no.
15
0
615 4.1
0
- - - 100 425 4.25
150 615 4.10
Jan
15
Requisitio
n slip no.
- - - 10
0
425 4.2
5
150 615 4.10
Jan
19
Requisitio
n slip no.
- - - 10
0
410 4.1
0
50 205 4.10
Jan
20
Goods
received
note no.
30
0
135
0
4.5
0
- - - 50 205 4.10
300 1350 4.50
Jan
25
Goods
received
note no.
40
0
160
0
4.0
0
- - - 50 205 4.10
300 1350 4.50
400 1600 4.00
Jan
26
Requisitio
n slip no.
- - - 50 205 4.1
0
150 675 4.50
15
0
675 4.5
0
400 1600 4.00
Jan
30
Requisitio
n slip no.
- - - 15
0
675 4.5
0
300 1200 4.00
10
0
400 4.0
0
2) Last in Last Out (LILO)
Under this method, issues are priced in the reverse order of
purchase i.e., the prices of the latest available consignment is
taken. This method is suitable in times of rising prices because

56
material will be issued from the latest consignment at a price
which is closely related to the current price levels. Valuing
material issues at the price of the latest available consignment will
help the management in fixing the competitive selling prices of the
products.
Illustration 7: Prepare Stores Account on Last in First Out
method assuming the same particulars as in Illustration 6:
SOLUTION
Date
Par
ticu
lars
Receipts Issues Balance
Qu
anti
ty
(Un
its)
To
tal
Co
st(R
s)
Un
it
cost
(Rs)
Qu
anti
ty
(un
its)
To
tal
Co
st(R
s)
Un
it
cost
(Rs)
Qu
anti
ty
(un
its)
Am
ou
nt
(Rs)
P
er
un
it(R
s)
Jan 1 Balance
b/d
- - - - - - 500 2000 4
Jan 4 Requisiti
on slip
no.
- - - 200 800 4 300 1200 4
Jan 5 Goods
received
note no.
200 850 4.25 - - - 300 1200 4
200 850 4.25
Jan
10
Requisiti
on slip
no.
- - - 200 850 4.25
200 850 4.00 100 400 4.00
Jan
12
Goods
received
note no.
150 615 4.10 - - - 100 400 4.00
150 615 4.10

57
Jan
15
Requisiti
on slip
no.
- - - 100 410 4.10 100 400 4.00
50 205 4.10
Jan
19
Requisiti
on slip
no.
- - - 50 205 4.10
50 200 4.00 50 200 4.00
Jan
20
Goods
received
note no.
300 1350 4.50 - - - 50 200 4.00
300 1350 4.50
Jan
25
Goods
received
note no.
400 1600 4.00 - - - 50 200 4.00
300 1350 4.50
400 1600 4.00
Jan
26
Requisiti
on slip
no.
- - - 200 800 4.00 50 200 4.00
300 1350 4.50
200 800 4.00
Jan
30
Requisiti
on slip
no..
- - - 200 800 4.00 50 200 4.00
50 225 4.50 250 1125 4.50
3) Simple Average Method
In this method, price is calculated by dividing the total of the
prices of the materials in the stock from which the material to be
priced could be drawn by the number of the prices used in that

58
total. This method may lead to over-recovery or under-recovery of
cost of materials from production because quantity purchased in
each lot is ignored.
Eg:- 1000 units purchased @ Rs. 10
2000 units purchased @ Rs. 11 3000
units purchased @ Rs. 12
In this example, simple average price will be Rs.11 calculated as
below:
Rs.10 + Rs.11 + Rs.12 = Rs. 11
3
4) Weighted Average Methods
In this method, price is calculated by dividing the total cost of
materials in the stock from which the materials to be priced could
be drawn by the total quantity of materials in that stock.
In the above example, the weighted average price is Rs.11.33 per
unit calculated as follows:
1000 x Rs.10+ 2000 x Rs.11 + 3000 x Rs.12 = Rs. 11.33
1000+2000+3000
In the periods of heavy fluctuations in the prices of materials, the
average cost method gives better results because it tends to smooth
out the fluctuations in prices by taking the average of prices of
various lots in stock.

59
Labour
Labour cost is a second major element of cost. The control of
labour cost and its accounting is very difficult as it deals with
human element. Labour is the most perishable commodity and as
such should be effectively utilized immediately.
Importance of Labour Cost Control
Labour is of two types
(a) direct labour, and
(b) indirect labour.
Direct Labour is that labour which is directly engaged in the
production of goods or services and which can be conveniently
allocated to the job, process or commodity or process. For
example labour engaged in spinning department can be
conveniently allocated to the spinning process.
Indirect Labour is that labour which is not directly engaged in the
production of goods and services but which indirectly helps the
direct labourengaged in production. The examples of indirect
labour are supervisors, sweepers, cleaners, time-keepers,
watchmen etc. The cost of indirect labour cannot be conveniently
allocated to a particular job, order, process or article.

60
The distinction between direct and indirect labour must be
observed carefully because payment of direct labour is a direct
expenditure and is a part of prime cost whereas payment of
indirect labour is an item of indirect expenditure and is shown as
works, office, selling and distribution expenditure according to the
nature of the time spent by the indirect worker.
Management is interested in the labour costs due to the following
reasons.
• To use direct labour cost as a basis for increasing the efficiency
of workers.
• To identify direct labour cost with products, orders, jobs or
processes for ascertaining the cost of every product, order, or
process.
• To use direct labour cost as a basis for absorption of overhead,
if percentage of direct labour cost to overhead is to be used as a
method of absorption of overhead.
• To determine indirect labour cost to be treated as overhead
• To reduce the labour turnover.
Hence control of labour cost is an important objective of
management and the realization of this objective depends upon the

61
co-operation of every member of the supervisory force from the
top executive to foremen.
Time Wage System
Under this method of wage payment, the worker is paid at an
hourly, daily, weekly or monthly rate.
This payment is made according to the time worked irrespective of
the work done. This method is highly suitable for following types
of work:
1. Where highly skilled and apprentices are working.
2. Where quality of goods produced is of extreme importance
eg., artistic goods
3. Where the speed of work is beyond the control of the
workers.
4. Where close supervision of work is possible.
5. Where output cannot be measured.
The disadvantages of this method are:
1. Workers are not motivated.
2. Workers will get payment for idle time.
3. Efficient workers will become inefficient in the long run as
all of them get same wages.
4. Employer finds it difficult to calculate labour cost per unit
as it varies as production increases and decreases.

62
5. Strict supervision is necessary to get the work done.
6. Inefficiency results in upsetting the production schedule
and increases the cost per unit.
7. It will encourage a tendency among workers to go slow so
as to earn overtime wages.
Thus this method does not establish a proportionate relationship
between effort and reward and the result is that it is not helpful in
increasing production and lowering labour cost per unit.
Piece Rate System (payment by result)
Under this system of wage payment, a fixed rate is paid for each
unit produced, job completed or an operation performed. Thus,
payment is made according to the quantity of work done no
consideration is given to the time taken by the workers to perform
the work.
There are four variants of this system.
a) Straight piece rate system
b) Taylor’s differential piece rate system
c) Merrick’s multiple piece rate system
d) Gant’s task and bonus plan
(a) Straight piece rate system
Payment is made as per the number of units produced at a fixed
rate per unit. Another method is piece rate with guaranteed time

63
rate in which the worker is given time rate wages if his piece rate
wages is less than the time rate.
Advantages
1. Wages are linked to output so workers are paid according to
their merits.
2. Workers are motivated to increase production to earn more
wages.
3. Increased production leads to decreased cost per unit of
production and hence profit per unit increases.
4. Idle time is not paid for and is minimized.
5. The employer knows his exact labour cost and hence can make
quotations confidently.
6. Workers use their tools and machinery with a greater care so
that the production may not be held up on account of their
defective tools and machinery.
7. Less supervision is required because workers get wages for
only the units produced.
8. Inefficient workers are motivated to become efficient and earn
more wages by producing more.
Disadvantages
1. Fixing of piece work rate is difficult as low piece rate will not
induce workers to increase production.

64
2. Quality of output will suffer because workers will try to
produce more quickly to earn more wages.
3. There may not be an effective use of material, because of the
efforts of workers to increase the production. Haste makes
waste. Thus there will be more wastage of material.
4. When there is increased production, there may be increased
wastage of materials, high cost of supervision and inspection
and high tools cost and hence cost of production might
increase.
5. Increased production will not reduce the labour cost per unit
because the same rate will be paid for all units. On the other
hand, increased production will reduce the labour cost per unit
under the time wage system.
6. Workers have the fear of losing wages if they are not able to
work due to some reason.
7. Workers may work for long hours to earn more wages, and
thus, may spoil their health.
8. Workers may work at a very high speed for a few days, earn
good wages and then absent themselves for a few days,
upsetting the uniform flow of production.

65
9. Workers in the habit of producing quality goods will suffer
because they will not get any extra remuneration for good
quality.
10. The system will cause discontentment among the slower
workers because they are not able to earn more wages.
This method can be successfully applied when:
1. The work is of a repetitive type.
2. Quantity of output can be measured.
3. Quality of goods can be controlled.
4. It is possible to fix an equitable and acceptable piece rate
5. The system is flexible and rates can be adjusted to changes
in price level.
6. Materials, tools and machines are sufficiently available to
cope with the possible increase in production.
7. Time cards are maintained so that workers are punctual and
regular so that production may not slow down.
(b) Taylor’s Differential Piece Rate system
This system was introduced by Taylor, the father of scientific
management to encourage the workers to complete the work
within or less than the standard time. Taylor advocated two piece
rates, so that if a worker performs the work within or less than the

66
standard time, he is paid a higher piece rate and if he does not
complete the work within the standard time, he is given a lower
piece rate.
Illustration 9 : Calculate the earnings of workers A and B under
Straight Piece-rate System and Taylor’s Differential Piece-rate
System form the following particulars.
Normal rate per hour = Rs.1.80
Standard time per unit = 20 seconds
Differentials to be applied:
80 % of piece rate below standard
120 % of piece rate at or above standard.
Worker A produces 1,300 units per day and worker B produces
1,500 units per day.
SOLUTION
Standard production per 20 seconds = 1 unit
Standard production per minute = 60/20= 3 units
Standard production per hour = 3 x 60 = 180 units
Standard production per day of 8 hrs(assumed) = 180 x 8 = 1440
units
Normal rate per hour = Rs.1.80
Normal piece rate = Rs.1.80/ 180 units = 1 paisa
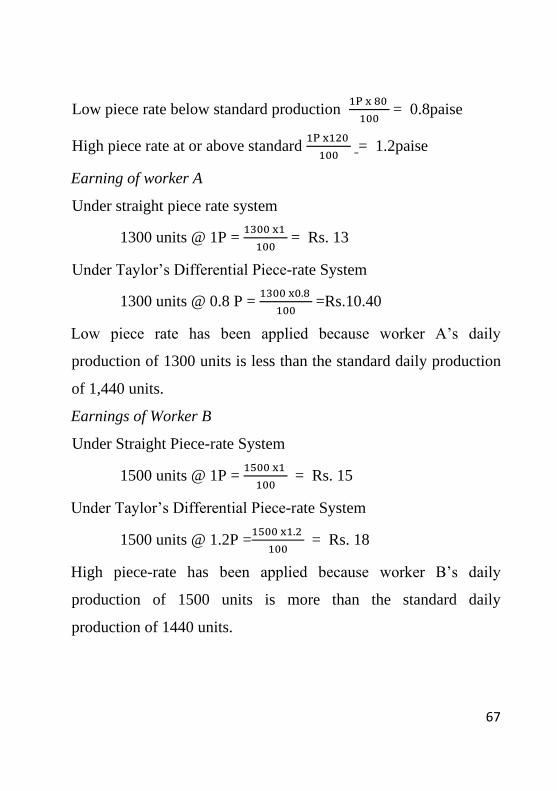
67
Low piece rate below standard production 1P x 80
100 = 0.8paise
High piece rate at or above standard 1P x120
100 = 1.2paise
Earning of worker A
Under straight piece rate system
1300 units @ 1P = 1300 x1
100 = Rs. 13
Under Taylor’s Differential Piece-rate System
1300 units @ 0.8 P = 1300 x0.8
100 =Rs.10.40
Low piece rate has been applied because worker A’s daily
production of 1300 units is less than the standard daily production
of 1,440 units.
Earnings of Worker B
Under Straight Piece-rate System
1500 units @ 1P = 1500 x1
100 = Rs. 15
Under Taylor’s Differential Piece-rate System
1500 units @ 1.2P =1500 x1.2
100 = Rs. 18
High piece-rate has been applied because worker B’s daily
production of 1500 units is more than the standard daily
production of 1440 units.

68
c) Merrick’s Multiple Piece Rate System
This method seeks to make an improvement in the Taylor’s
differential piece rate system. Under this method, three piece rates
are applied for workers with different levels of performance.
Wages are paid at ordinary piece rate to those workers whose
performance is less than 83% of the standard output, 110% of the
ordinary piece rate is given to workers whose level of performance
is between 83% and 100% of the standard and 120% of the
ordinary piece rate is given to workers who produce more than
100% of the standard output.
This method is not as harsh as Taylor’s piece rate because penalty
for slow workers is relatively lower.
Illustration 10: Calculate the earnings of workers A, B and C
under straight piece rate system and Merrick’s multiple piece rate
system from the following particulars:
Normal rate per hour Rs.1.8
Standard time per unit1 minute
Output per day is as follows:
Worker A : 384 units
Worker B : 450 units
Worker C : 552 units
Wording hours per day are 8

69
SOLUTION
Standard output per minute = 1 unit
Standard production per hour = 60 units
Standard production per day of 8 hours = 480 units( 8 x 60)
Normal rate per hour = Rs.1.80
Normal output per hour = 60 units
Normal piece rate = Rs.1.80
60 =3 paise
Calculation of level of performance:
Standard output per day = 480 units
Worker A’s output per day = 384 units
Worker A’s level of performance = 384
480× 100 = 80%
Worker B’s output per day = 450 units
Worker B’s level of performance =450
480× 100 = 93.75%
Worker C’s output per day = 552 units
Worker C’s level of performance =450
480× 100 = 115%
Earnings of Worker A
Under straight piece rate system:
For 384 units @ 3 paise per unit =384x0.03=Rs.11.52
Under Merrick’s multiple piece rate system:
For 384 units @ 3 paise per unit =384 x 0.03 = Rs.11.52

70
Earnings of Worker B
Under straight piece rate system:
For 450 units @ 3 paise per unit = 450 x 0.03 = Rs.13.50
Under Merrick’s multiple piece rate system:
For 450 units @ 3.3 paise per unit =450 x 0.033= Rs.14.85
Earnings of Worker C
Under straight piece rate system:
For 552 units @ 3 paise per unit = 552 x 0.03 = Rs.16.56
Under Merrick’s multiple piece rate system:
For 552 units @ 3.6paise per unit =552 x 0.036 = Rs.19.87
Worker C’s level of performance is 115% which is more than
100% of standard output; so he is entitled to get 120% of normal
piece rate (ie. 120% of 3 paise or 3.6 paise per unit)
Premium and Bonus Plan
The object of a premium plan is to increase the production by
giving an inducement to the workers in the form of higher wages
for less time worked.
Under a premium plan, a standard time is fixed for the completion
of a specific job or operation at an hourly rate plus wages for a
certain fraction of the time saved by way of a bonus. The plan is
also known as incentive plan because a worker has the incentive to
earn more wages by completing the work in less time.

71
This system of wage payment is in between the time wage system
and piece work system. In time wage system, worker does not get
any reward for the time saved and in piece work system, the
worker gets full payment for time saved whereas in a premium
plan both the worker and the employer share the labour cost of the
time saved.
The following are some of the important premium plans.
(i) Halsey Premium Plan:
Under this method, the worker is given wages for the actual time
taken and a bonus equal to half of wages for time saved. The
standard time for doing each job or operation is fixed. In practice
the bonus may vary from 33⅓ % to 66⅔ % of the wages of the
time saved.
Thus if S is the standard time, T the time taken, R the labour rate
per hour, and % the percentage of the wages of time saved to be
given as bonus, total earnings of the worker will be:
T x R + % (S-T) R
Under Halsey-Weir plan, the premium is set at 30% of the time
saved.
Illustration 11:
Rate per hour = Rs.1.50 per hour
Time allowed for job = 20 hours

72
Time taken = 15 hours
Calculate the total earnings of the worker under the Halsey Plan.
Also find out effective rate of earnings.
SOLUTION:
Standard time (S) = 20 hours
Time taken (T) = 15 hours
Rate per hour (R)= Rs.1.50 per hour
Total Earnings = T x R + 50% (S-T) x R
= 15 X Rs. 1.50 + 50
100 (20-15) xRs. 1.50
=Rs.26.25
Total wages for 15 hours = Rs.26.25
Therefore, effective rate of earning per hour
= Total Wages = Rs.26.25 = Rs. 1.75
Actual Time Taken
( The percentage of bonus is taken as 50% when not given )
The advantages of the Halsey Premium Plan are:
It is simple to understand and relatively simple to calculate.
1. It guarantees time wages to workers.
2. The wages of time saved are shared by both employers and
workers, so it is helpful in reducing labour cost per unit.

73
3. It motivates efficient workers to work more as there is
increasing incentive to efficient workers.
4. Fixed overhead cost per unit is reduced with increase in
production.
5. The employer is able to reduce cost of production by
having reduction in labour cost and fixed overhead cost per
unit. So, he is induced to provide the best possible
equipment and working conditions.
Disadvantages
1. Quality of work suffers because workers are in a hurry to
save more and more time to get more and more bonus.
2. Workers criticize this method on the ground that the
employer gets a share of wages of the time saved.
(ii) Rowan Plan
The difference between Halsey plan and Rowan Plan is the
calculation of the bonus. Under this method also the workers are
guaranteed the time wages but the bonus is that proportion of the
wages of the time taken which the time saved bears to the
standard time allowed.
Total Earnings = T x R + S-T x T x R
S
Illustration 12:

74
A worker completes a job in a certain number of hours. The
standard time allowed for the job is 10 hours, and the hourly rate
of wages is Rs.1. The worker earns a 50% rate of bonus of Rs. 2
under Halsey Plan. Ascertain his total wages under the Rowan
Premium Plan.
Solution: The worker earns Rs.2 as bonus at 50 %; so total bonus
at 100% should be Rs.4. The hourly rate of wages being Re.1, the
time saved should be 4 hours.
Standard time allowed 10 hours
Less: Time Saved 4 hours
Time Taken 6 hours
Earnings under the Rowan Premium Plan
Earnings =T x R + 𝑆 −𝑇
𝑆x T x R
Where, T = 6 hours
S = 10 hours
R = Re.1 per hour
Earnings = 6 x 1 + 10−6
10 x 6 x 1
= 6 + Rs.2.40 = Rs. 8.40
Advantages
1. It guarantees time wages to workers

75
2. The quality of work does not suffer as they are not induced
to rush through production as bonus increases at a
decreasing rate at higher levels of efficiency.
3. Labour cost per unit is reduced because wages of time
saved are shared by employer and employee.
4. Fixed overhead cost is reduced with increase in production.
Disadvantages
1. The Rowan plan is criticized by workers on the ground that
they do not get the full benefit of the time saved by them as
they are paid bonus for a portion of the time saved.
2. The Rowan plan suffers from another drawback that two
workers, one very efficient and the other not so efficient,
may get the same bonus.
Module III : Overheads and Preparation of
Cost Sheet

76
Overheads
Cost related to a cost center or cost unit may be divided into two
ie. Direct and Indirect cost. The Indirect cost is the overhead cost
and is the total of indirect material cost, indirect labour cost,
indirect expenses.
CIMA defines indirect cost as “expenditure on labour, materials
or services which cannot be economically identified with a
specific salable cost per unit”.
Indirect costs are those costs which are incurred for the benefit of
a number of cost centers or cost units. So any expenditure over and
above prime cost is known as overhead. It is also called ‘burden’,
‘supplementary costs’, ‘on costs’, ‘indirect expenses’.
Classification of Overheads
Overheads can be classified on the following basis:
i) Function-wise classification: Overheads can be divided into
the following categories on functional basis.
a) Manufacturing or production overheads eg:- indirect
materials like lubricants, cotton wastes, indirect labour
like salaries and wages of supervisors, inspectors,
storekeepers, indirect expenses like rent, rates and
insurance of factory, power, lighting of factory, welfare
expenses like canteen, medical etc.

77
b) Administration overheads eg:- indirect materials like
office stationery and printing, indirect labour salaries of
office clerks, secretaries, accountants, indirect expenses
rent, rates and insurance of office, lighting heating and
cleaning of office, etc.
c) Selling and Distribution overheads eg:- indirect materials
like catalogues, printing, stationery, price list, indirect
salary of salesmen, agents, travellers, sales managers,
indirect expenses like rent, rates and insurance of
showroom, finished goods, godown etc., advertising
expenses, after sales service, discounts, bad debts etc.
ii) Behavior-wise classification: Overheads can be classified
into the following categories as per behavior pattern.
a) Fixed overheads like managerial remuneration, rent of
building, insurance of building, plant etc.
b) Variable overheads like direct material and direct labour.
c) Semi-variable overheads like depreciation, telephone
charges, repair and maintenance of buildings, machines
and equipment etc.
iii) Element-wise classification: Overheads can be classified into
the following categories as per element.
a) Indirect materials

78
b) Indirect labour
c) Indirect expenses
Allocation and Apportionment of Overhead to Cost Centres
(Depart-mentalisation of Overhead)
When all the items are collected properly under suitable account
headings, the next step is allocation and apportionment of such
expenses to cost centres. This is also known as departmentalization
or primary distribution of overhead.
A factory is administratively divided into different departments
like Manufacturing or Producing department, Service department,
partly producing departments.
Allocation of Overhead Expenses
Allocation is the process of identification of overheads with cost
centres. An expense which is directly identifiable with a specific
cost centre is allocated to that centre. Thus it is allotment of a
whole item of cost to a cost centre or cost unit. For example the
total overtime wages of workers of a department should be
charged to that department. The electricity charges of a department
if separate meters are there should be charged to that particular
department only.
Apportionment of Overhead Expenses

79
Cost apportionment is the allotment of proportions of cost to cost
centres or cost units. If a cost is incurred for two or more divisions
or departments then it is to be apportioned to the different
departments on the basis of benefit received by them. Common
items of overheads are rent and rates, depreciation, repairs and
maintenance, lighting, works manager’s salary etc.
Basis of Apportionment
Suitable bases have to be found out for apportioning the items of
overhead cost to production and service departments and then for
reapportionment of service departments costs to other service and
production departments. The basis selected should be correlated to
the expenses and the expense should be measurable by the basis.
This process of distribution of common expenses over the
departments on some equitable basis is known as ‘Primary
Distribution’.
The following are the main bases of overhead apportionment
utilized in manufacturing concerns:
Direct Allocation. Under direct allocation, overheads are directly
allocated to the department for which it is incurred. Example
overtime premium of workers engaged in a particular department,
power, repairs of a particular department etc.

80
(i) Direct Labour/Machine Hours. Under this basis,
overhead expenses are distributed to various departments
in the ratio of total number of labour or machine hours
worked in each department. Majority of general overhead
items are apportioned on this basis.
(ii) Value of materials passing through cost centres. This
basis is adopted for expenses associated with material such
as material handling expenses.
(iii) Direct wages. Expenses which are booked with the
amounts of wages eg:-worker’s insurance, their
contribution to provident fund, worker’s compensation etc.
are distributed amongst the departments in the ratio of
wages.
Illustration 13: The Modern Company is divided into four
departments: A, B and C are producing departments, and D is a
service departments. The actual costs for a period are as follows:
Rent Rs.1000 Repairs to Plant Rs.600
Supervision Rs.1500 Fire Insurance in respect of
Stock Rs.500
Depreciation of
Plant
Rs.450 Power Rs.900
Light Rs.120 Employers’ liability for
insurance Rs.150

81
The following information is available in respect of the four
departments;
Dept.A Dept.B Dept.C Dept.D
Area (sq.mtrs) 1,500 1,100 900 500
Number of Employees 20 15 10 5
Total Wages (Rs.) 6,000 4,000 3,000 2,000
Value of Plant (Rs.) 24,000 18,000 12,000 6,000
Value of stock (Rs.) 15,000 9,000 6,000 -
H.P. of Plant 24 18 12 6
Apportion the costs to the various departments on the most
equitable basis.
SOLUTION
OVERHEADS DISTRIBUTION SUMMARY
Items Basis of
apportionment
To
tal
Am
ou
n
t Rs.
Product Departments
Ser
vic
e
Dep
t
D
Rs.
A
Rs.
B
Rs.
C
Rs.
Rent Floor Area 1,000 375 275 225 125
Supervision No. of
Employees
1,500 600 450 300 150
Depreciation Plant Value 450 180 135 90 45
Light Floor area 120 45 33 27 15
Repairs to Plant Plant Value 600 240 180 120 60
Fire Insurance Stock Value 500 250 150 100 -
Power HP. Of Plant 900 360 270 180 90
Employer’s
Liability
No. of
Employees
150 60 45 30 15

82
Total 5,220 2,110 1,53
8
1,072 500
Re-apportionment of Service Department Costs to Production
Departments
Service department costs are to be reapportioned to the
production departments or the cost centres where production is
going on. This process of re-apportionment of overhead expenses
is known as ‘Service Distribution’. The following is a list of the
bases of apportionment which may be accepted for the service
departments noted against
Service Department Cost Basis of Apportionment
1. Maintenance Department
2. Payroll or time-keeping
department
3. Store keeping department
4. Employment or Personnel
epartment.
5. Purchase Department
6. Welfare, ambulance, canteen
service, recreation room
expenses.
7. Building service department
8. Internal transport service or
overhead crane service
-Hours worked for each department
-Total labour or Machine hours or
number of employees in each
department
-no. of requisitions or value of
materials of each department.
-Rate of labour turnover or number
of employees in each department.
-no. of purchase orders or value of
materials -No. of employees in each
department.
-Relative are in each department
-Weight, value graded product
handled, weight and distance
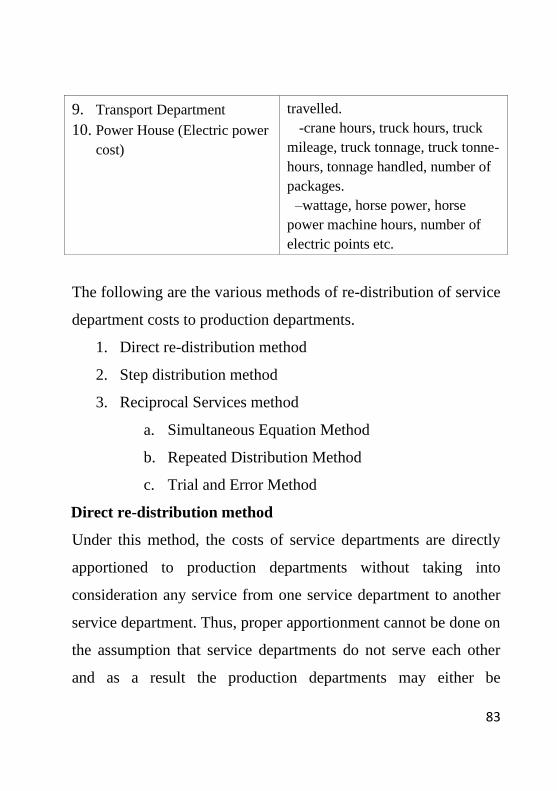
83
9. Transport Department
10. Power House (Electric power
cost)
travelled.
-crane hours, truck hours, truck
mileage, truck tonnage, truck tonne-
hours, tonnage handled, number of
packages.
–wattage, horse power, horse
power machine hours, number of
electric points etc.
The following are the various methods of re-distribution of service
department costs to production departments.
1. Direct re-distribution method
2. Step distribution method
3. Reciprocal Services method
a. Simultaneous Equation Method
b. Repeated Distribution Method
c. Trial and Error Method
Direct re-distribution method
Under this method, the costs of service departments are directly
apportioned to production departments without taking into
consideration any service from one service department to another
service department. Thus, proper apportionment cannot be done on
the assumption that service departments do not serve each other
and as a result the production departments may either be

84
overcharged or undercharged. The share of each service
department cannot be ascertained accurately for control purposes.
Budget for each department cannot be prepared thoroughly.
Therefore, Department Overhead rates cannot be ascertained
correctly.
Illustration 14:In an Engineering factory, the following
particulars have been collected for the three months’ period ended
on 31st March, 2007. You are required to prepare Production
Overheads Distribution Summary showing clearly the basis of
apportionment where necessary.
Production Departments
Service
Departments
A B C D E
Direct Wages Rs.
Direct Material Rs.
Staff Nos.
Electricity Kwh.
Light Points No.
Asset Value Rs.
Area Occupied
Sq.m.
2000
1000
100
4000
10
60,000
150
3000
2000
150
3000
16
40,000
250
4000
2000
150
2000
4
30,000
50
1000
1500
50
1000
6
10,000
50
2000
1500
50
1000
4
10000
50
The expenses for the period were:
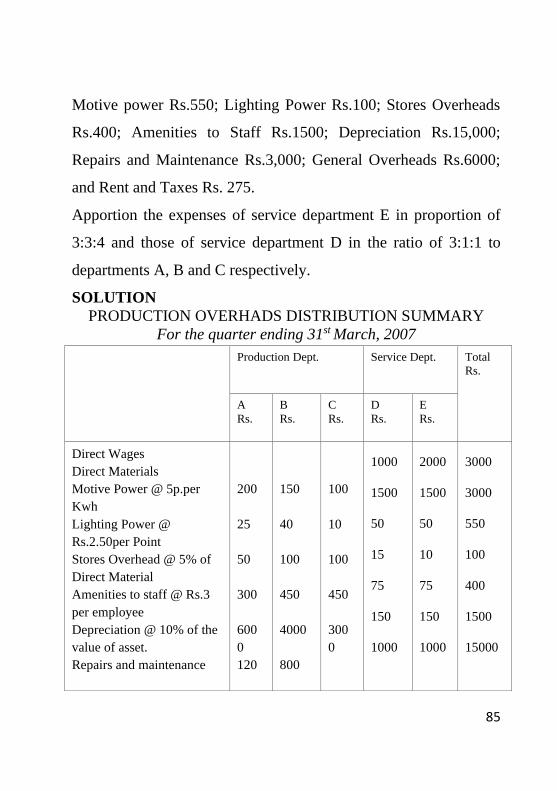
85
Motive power Rs.550; Lighting Power Rs.100; Stores Overheads
Rs.400; Amenities to Staff Rs.1500; Depreciation Rs.15,000;
Repairs and Maintenance Rs.3,000; General Overheads Rs.6000;
and Rent and Taxes Rs. 275.
Apportion the expenses of service department E in proportion of
3:3:4 and those of service department D in the ratio of 3:1:1 to
departments A, B and C respectively.
SOLUTION
PRODUCTION OVERHADS DISTRIBUTION SUMMARY
For the quarter ending 31st March, 2007
Production Dept. Service Dept.
Total
Rs.
A
Rs.
B
Rs.
C
Rs.
D
Rs.
E
Rs.
Direct Wages
Direct Materials
Motive Power @ 5p.per
Kwh
Lighting Power @
Rs.2.50per Point
Stores Overhead @ 5% of
Direct Material
Amenities to staff @ Rs.3
per employee
Depreciation @ 10% of the
value of asset.
Repairs and maintenance
200
25
50
300
600
0
120
150
40
100
450
4000
800
100
10
100
450
300
0
1000
1500
50
15
75
150
1000
2000
1500
50
10
75
150
1000
3000
3000
550
100
400
1500
15000

86
@ 2% of value
General Overheads @ 50%
of Direct Wages
Rent and Taxes @Re.0.50
per sq.meter
0
100
0
75
1500
125
600
2000
25
200
500
25
200
1000
25
3000
6000
275
Total
Dept. E ( 3: 3 : 4)
Dept. D (3 : 1 : 1)
8,85
0
1,80
3
2,70
9
7,165
1,803
903
6,28
5
2,40
4
903
4,515
(4,515
)
6,010
(6,01
0)
32,825
Total 13,3
62
9,871 9,59
2
32,825
Absorption of Overhead
Absorption means the distribution of the overhead expenses
allotted to a particular department over the units produced in that
department. Overhead absorption is accomplished by overhead
rates.
Methods of Absorption of Manufacturing Overhead

87
The following are the main methods of absorption of
manufacturing or factory overheads.
(a) Direct Material Cost Method. Under this method percentage
of factory expenses to value of direct materials consumed in
production is calculated to absorb manufacturing overheads.
The formula is Overhead Rate
= Production Overhead Expenses (Budgeted)
Anticipated Direct Material Cost
If in a factory the anticipated cost of direct material is Rs. 4,00,000
and the over head budgeted expenses are Rs. 1,00,000, then the
overhead rate will be 25% ie.( Rs.1,00,000 ÷ Rs.4,00,000) of the
materials used. It is assumed that relationship between materials
and factory expenses will not change. This method is simple and
can be adopted under the following circumstances:
(i) Where the proportion of overheads to the total cost is
significant.
(ii) Where the prices of materials are stable.
(iii) Where the output is uniform ie. Only one kind of article is
produced.

88
(b) Direct Labour Cost (or Direct Wages) Method. This is a
simple and easy method and widely used in most of the
concerns. The overhead rate is calculated as under:
Overhead Rate= Production Overhead Expenses
Direct Labour Cost
If from past experience, the percentage of factory expenses to
direct wages is 50%, then the factory expenses in the next year is
taken as 50% of the direct wages.
This method is suitable under the following situations:
(i) Where direct labour constitutes a major proportion of the
total cost of production.
(ii) Where production is uniform.
(iii)Where labour employed and types of work performed are
uniform.
(iv) Where the ratio of skilled and unskilled labour is constant.
(v) Where there are no variations in the rates of pay ie., the
rates of pay and the methods are the same for the majority of
the workers in the concern.
In some concerns a separate rate is calculated for the fringe
benefits and applied on the basis of direct labour cost.
(c) Prime Cost Method. Under this method the recovery rate is
calculated dividing the budgeted overhead expenses by the

89
aggregate of direct materials and direct labour cost of all the
products of a cost centre. The formula is
Overhead Recovery Rate =
Production Budgeted Overhead Expenses
Anticipated Direct Materials and Direct Labour Cost
Suppose if the budgeted overheads are Rs.50,000 and the
estimated values of direct materials and direct labour are
Rs.30,000 and Rs.20,000, then overhead recovery rate will be
100%
ie = 50000 x 100.
30000+20000
(d) Direct Labour (or Production) Hour Method. This rate is
obtained by dividing the overhead expenses by the aggregate
of the productive hours of direct workers. The formula is
Overhead rate = Production Overhead Expenses
Direct Labour Hours
If in a particular period the overhead expenses are Rs.50,000 and
direct labour hours are 1 ,00,000, then overhead labour rate will be
Re.0.50 (i.e., Rs.50,000 ÷ 1,00,000).
This rate is suitable where:
i. The production is done using more of labour and less
technology is used.

90
ii. It is desired to taken into consideration the time factor.
iii. The rate may not be affected by the method of wage
payment or the grade or the rate of workers.
Illustration17: From the following particulars find out “Direct
Labour Rate”.
(a) Total number of labourers working in the department. 400
(b) Total working days in a year 300
(c) Number of working hours per day 8
(d) Total departmental overheads per year Rs.1,82,400
(e) Normal idle time allowed. 5 %
SOLUTION:
CALCULATION OF DIRECT LABOUR RATE FOR
DEPARTMENTAL OVERHEADS
Total working days in a year 300
Number of working hours per day 8
Total working hours available per worker per year 2,400
(300 x 8)
Less:normal idle time allowed (5% of 2,400hrs) 120
Effective working hours per worker per year (2400-120) 2,280

91
Number of workers working in the department 400
Total effective working hours in the department(2280 x 400)
9,12,000
Total departmental overheads per year Rs. 1,82,000
Direct Labour Rate for absorption of overheads per hour Rs.0.20
(Rs.182,400÷9,12,000hrs=Rs.0.20)
(e) Machine Hour Rate. Machine hour rate is the cost of running
a machine per hour. It is one of the methods of absorbing
factory expenses to production. There is a basic similarity
between the machine hour and the direct labour hour rate
methods, in so far as both are based on the time factor. The
choice of one or the other method depends on the actual
circumstances of the individual case. In respect of departments
or operations, in which machines predominate and the
operators perform a relatively a passive part, the machine hour
rate is more appropriate. This is generally the case for
operations or processes performed by costly machines which
are automatic or semi-automatic and where operators are
needed merely for feeding and tending them rather than for
regulating the quality or quantity of their output. In such cases,
the machine hour rate method alone can be depended on to
correctly apportion the manufacturing overhead expenses to

92
different items of production. What is needed for computing
the machine hour rate is to divide overhead expenses for a
specific machine or group of machines for a period by the
operating hours of the machine or the group of machines for
the period. It is calculated as follows:
Machine hour rate = Amount of overheads
Machine hours during a given period
The following steps are required to be taken for the
calculation of machine hour rate:
1) Each machine or group of machine should be treated as a
cost centre.
2) The estimated overhead expenses for the period should be
determined for each machine or group of machines.
3) Overheads relating to a machine are divided into two parts
i.e., fixed or standing charges and variable or machine
expenses.
4) Standing charges are estimated for a period for every machine
and the amount so estimated is divided by the total number of
normal working hours of the machine during that period in
order to calculate an hourly rate for fixed charges. For
machine expenses, an hourly rate is calculated for each item

93
of expenses separately by dividing the expenses by the normal
working hours.
5) Total of standing charges and machines expenses rates will
give the ordinary machine hour rate.
Some of the bases which may be adopted for apportioning the
different expenses for the purpose of calculation of machine
hour rate are given below.
Some of the expenses and the basis of apportionment are given
below.
1. Rent and Rates - Floor area occupied by each machine
including the surrounding space.
2. Heating and Lighting - The number of points used plus
cost of special lighting or heating for any individual machine,
alternatively according to floor area occupied by each
machine.
3. Supervision – estimated time devoted by the supervisory
staff to each machine.
4. Lubricating Oil and Consumable Stores – On the basis of
past experience.
5. Insurance – Insurable value of each machine
6. Miscellaneous Expenses – Equitable basis depending upon
facts.

94
Machine Expenses
1.Depreciation – cost of machine including cost of stand-by
equipment such as spare motors, switchgears etc., less
residual value spread over its working life.
2.Power – Actual consumption as shown by meter readings or
estimated consumption ascertained from past experience.
3.Repairs – Cost of repairs spread over its working life.
Illustration 18: A machine is purchased for cash at Rs.9,200. Its
working life is estimated to be 18 ,000 hours after which its scrap
value is estimated at Rs.200. it is assumed from past experience
that:
(i) The machine will work for 1,800 hours annually.
(ii) The repair charges will be Rs.1,800 during the whole period
of life of the machine.
(iii) The power consumption will be 5 units per hour at 6 paisa
per unit.
(iv) Other annual standing charges are estimated to be: Rs.
(a) Rent of department (machine occupies 1/5th of total space)
780
(b) Light (12 points in the department-2 points engage d in the
machine) 288

95
(c) Foreman’s salary (1/4th of his time is occupied in the
machine) 6000
(d) Insurance premium (fire) for machinery 36
(e) Cotton waste 60
Find out the machine hour rate on the basis of above data for
allocation of the works expenses to all jobs for which the machine
is used.
SOLUTION:
CALCULATION OF MACHINE HOUR RATE
Standing Charges:
Rent[ Rs.780 ÷Rs.5]
Light [ 2/12 x Rs.288]
Insurance Charges
Cotton waste
Total Standing Charges Hourly
rate of standing charges Rs.1800
1800
Machine Expenses:
Depreciation (Rs.9,200-Rs.200)÷18,000
= Rs.9000 ÷18,000
Repairs and Maintenance
(Rs.1,080÷18,000)
Power (0.06 x 5)
Per
Annum
Rs.
156
48
36
60
1,500
1,800
Per Hour
Rs.
1.00
0.50
0.06
0.30

96
Machine Hour Rate 1.86
f.Rate Per Unit of Production. This method is simple, direct and
easy. It is suitable for mining and other extractive industries,
foundries and brick laying industries, where the output is
measured in convenient physical units like number, weight,
volume etc. the rate is calculated as under:
Overhead Rate= Overhead expenses (budgeted)
Budgeted production
For example, if the overhead expenses (budgeted) are Rs. 30,000
and the budgeted production is 10,000 tonnes, then overhead rate
according to this method will be Rs. 3 per tonne.
The main limitation of this method is that it is restricted to those
concerns which produce only one item of product or a few sizes,
qualities or grades of the same product. If more than one item are
produced, then it is essential to express dissimilar units against a
common denominator on weightage or point basis.
g. Sale Price Method: Under this method, budgeted overhead
expenses are divided by the sale price of units of production in
order to calculate the overhead recovery rate. The formula is sale

97
price of units of production in order to calculate the overhead
recovery rate, the formula is
Overhead Recovery Rate= Budgeted overhead expenses
Sale value of units of production
The method is more suitable for apportioning of administration,
selling and distribution, research, development and design costs of
products. It can also be used with advantage for the appropriation
of joint products costs.
Cost sheet or Statement of Cost
When costing information is set out in the form of a statement, it
is called “Cost Sheet”. It is usually adopted when there is only one
main product and all costs almost are incurred for that product
only. The information incorporated in a cost sheet would depend
upon the requirement of management for the purpose of control.
Specimen of Cost Sheet or Statement of Cost
Total Cost
Rs.
Cost per
Unit Rs.
Direct Material
Direct Labour
Prime Cost
Add: Works Overheads
Works Cost
Add: Administrative Overheads
Cost of Production
xxx xx
xxx xx
xxx xx
xxx xx
xxx xx
xxx xx
xxx xx

98
Add: Selling & Distribution
Overheads
xxx xx
Total Cost/ Cost of Sales xxx xx
Illustration 2: Calculate Prime Cost, Factory Cost, Cost of
Production, Cost of Sales and profit from the following
particulars:
Rs. Rs.
Direct Materials 1,00,000 Consumable stores 2,500
Direct Wages 30,000 Manager’s Salary 5,000
Wages of Foreman 2,500 Directors’ fees 1,250
Electric power 500 Office Stationery 500
Lighting: Factory 1,500 Telephone Charges 125
Office 500 Postage and Telegrams 250
Storekeeper’s wages 1,000 Salesmen’s salary 1,250
Oil and water 500 Travelling expenses 500
Rent: Factory 5,000 Advertising 1,250
Office 2,500 Warehouse charges 500
Repairs and Renewals: Sales 1,89,500
Factory plant 3,500 Carriage outward 375
Transfer to Reserves 1,000 Dividend 2,000
Discount on shares written off 500
Depreciation: Factory Plant 500

99
Office Premises 1,250
Solution
STATEMENT OF COST AND PROFIT
Rs.
Direct Materials 1,00,000
Direct Wages 30,000
Prime Cost 1,30,000
Add: Factory Overheads:
Wages of foreman 2,500
Electric power 500
Storekeeper’s Wages 1,000
Oil and Water 500
Factory rent 5,000
Repairs and renewals-Factory Plant 3,500
Factory lighting 1,500
Depreciation-Factory Plant 500
Consumable stores 2,500
17,500
Factory Cost 1,47,500
Add: Administration Overheads:
Office rent 2,500
Repairs and Renewals-Office Premises 500

100
Office lighting 500
Depreciation : Office Premises 1,250
Manager’s Salary 5,000
Director’s fees 1,250
Office Stationery 500
Telephone charges 125
Postage and telegrams 250
11,875
Cost of Production 1,59,375
Add: Selling and Distribution Overheads:
Carriage Outward 375
Salesmen’s Salaries 1,250
Travelling Expenses 500
Advertising 1,250
Warehouse charges 500
3,875
Cost of Sales 1,63,250
Profit 26,250
Sales 1,89,500

101
Module IV : Methods of Costing
Job Costing
It means ascertaining costs of an individual job, work order or
project separately. According to ICMA London, “job costing is
that form of specific order costing which applies where work is
undertaken to customer’s specific requirements and each order is
of comparatively of short duration.” Under this method of costing,
each job is considered to be a distinct cost unit. As such, each job
is separately identifiable.
In the case of a job, work is usually carried out within the factory
or workshop. Sometimes, a job is accomplished even in the

102
customer’s premises. This method of costing is applicable to ship
building, printing, engineering, machine tools, readymade
garments, shoes, hats, furniture, musical instruments, interior
decorations etc. Features:
1. Each job has its own characteristics, depending up on the
special order placed by the customer.
2. Each job is treated as a cost unit.
3. A separate job cost sheet is made out for each job on the basis
of distinguishing numbers.
4. A separate work in progress ledger is maintained for each job.
5. The duration of the job is normally a short period.
6. Profit or loss is determined for each job independently of
others
Advantages of Job costing:
1. It helps to distinguish profitable jobs from unprofitable jobs
2. It helps to identify defective work and spoilage with a
department or person
3. Selling price of special orders can easily be fixed.
4. It helps to prepare estimates of cost for submitting quotations
and tender for similar jobs

103
5. It helps to control future cost.
Requisites of Job costing system:
1. A sound system of production control
2. An effective time booking system
3. Clearly defined cost centre
4. Appropriate overhead absorption rate, and
5. Proper material issue pricing method.
Procedure for Job order costing system:
The Procedure for job order costing system may be summarized as
follows:-
1. Receiving an enquiry from the customer regarding price,
quality etc
2. Make an estimation of the price of the job after considering the
cost incurred for the execution of similar job in the previous
year
3. Receiving an order, if the customer is satisfied with the
quotation price and other terms of execution.

104
4. If the job is accepted, a production order is made by the
Planning department.
5. The costs are collected and recorded for each job under separate
production order Number, and a Job Cost Sheet is maintained
for that purpose.
6. On completion of job, a completion report is sent to costing
department.
Illustration I
From the following particulars calculate the cost of Job No.505
and price for the job to give a profit of 25 % on the selling price.
Material : Rs. 6820
Wage details:
Department X : 60 hrs @ Rs. 3 per hr
Y : 50 hrs @ Rs. 3 per hr
Z : 30 hrs @ Rs. 5 per hr

105
The variable Overheads are as follows:
Department X : Rs. 5000 for 5000 hrs
Y : Rs. 4000 for 2000 hrs
Z : Rs. 2000 for 500 hrs
The total fixed expenses amounted to Rs. 20,000 for
10,000 working hours. Calculate the cost of Job No. 505
and price for the job to give a profit of 25% on selling
price.
Solution:
Job Cost Sheet No. 505
Rs.
Direct Material
Wages:
6,820
Department X 60x3=180
Department Y 50x3=150
Department Z 30x5=150 480

106
------------------
Prime Cost
Overheads: - Variables
7,300
Department X 60 x1 = 60
Department Y 50 x 2= 100
Department Y 30x 4= 120 280
------------------
7,580
Fixed OH 140 x 2 = 280(60+50+30 x 2) 280
------------------
Total cost 7,860
Profit 25% on selling price ie 1/3 of cost 7860 x1/3 2 , 620
-----------------
Selling price 10,480
Practical problem 1
The following information is extracted from the Job ledger in
respect of Job No. 205
Materials Rs. 8,500
Wages : 80 hours @ Rs. 6 per hour

107
Variable OH incurred for all jobs is Rs. 10,000 for 4,000 labour
hours. Find the profit if the job is billed for Rs. 8,400.
Practical Problem 2
From the following information, ascertain the work cost of Job
No. 505
The job was commenced on 10th January 2011 and completed on
1st Feb.2011. Materials used were Rs. 2,400 and labour charges
were Rs. 1,600. Other details were as follows:
1. Indirect labour cost in the factory amounted to Rs. 1,200
2. Machine X was used for 50 hours @ Rs. 20 per hour
3. Machine Z was used for 40 hours @ Rs. 22 per hour
Contract Costing
Meaning
It is a special form of job costing and it is the most
appropriate method to be adopted in such industries as building
and construction work, civil engineering, mechanical fabrication
and ship building. In other words, it is a form of specific order
costing which applies where the work is undertaken to customer’s

108
requirements and each order of long duration as compared to job
costing. It is also known as terminal costing.
The official CIMA terminology defines contract costing as
“ a form of specific order costing in which costs are attributed to
individual contracts.”
Basic features:
1. Each contract itself a cost unit.
2. Work is executed at customers site
3. The existence of sub contract
4. Most of the expenses incurred upon the contracts are
direct.
5. Cost control is very difficult in contract costing.
Types of contracts
Generally there are three types of contracts:
1. Fixed price contracts: Under these contracts both parties
agree to a fixed contract price.
2. Fixed price contract with Escalation clause
3. Cost plus contract: Under this contract no fixed price could
be settled for a contract.
Contract Account

109
A contract account is a nominal account in nature. It is prepared
to find out the cost of contract and to know profit or loss made on
the contract. A contractor may undertake a number of contracts at
a time. For each contract a separate account is opened. In the
contract account all direct cost such as material, labour and other
direct expenses incurred during an accounting period are debited
and the indirect expenses are apportioned on an equitable basis.
The differences between the two sides are known as Notional
profit or notional loss.
Special Terms in Contract Account
1. Work in Progress: It is the unfinished contract at the end of
the accounting period and it includes amount of work certified
and amount of work uncertified. Work in progress is an asset,
shown in the balance sheet by deducting there from any
advance received from the contractee.
2. Work certified: The sales value of work completed as
certified by the architect is known as ‘work certified’. In the
case of contracts of long duration, the amount payable by the
customer to the contractor is based on the sales value of work
done as certified by the architect. At the end of the financial

110
year, the total sales value of work done and certified by the
architect is credited to the contract account.
3. Work Uncertified: It means work which has been carried out
by the contractor but has not been certified by the architect.
Sometimes, work which is complete remains uncertified at the
end of the financial year. The reasons for the same may be
a. Work not sufficient enough to be certified
b. Work has not reached the stipulated stage to qualify for
certification It is always valued at cost and credited to the
contract account.
4. Retention money: - Regardless of the amount of work
certified, the contractor is paid a specified percentage of the
same and the balance is held or retained by the contractee.
This is because of the fact that the contractee has to safe guard
himself against any contingency arising from the non
fulfillment of the terms of the contract by the contractor. The
unpaid balance of work certified or the amount held back or
retained by the contractee is known as ‘retention money’.
5. Sub contract: Sometimes the contractor enters into contracts
with another contractor to give a portion of work undertaken
by him. In such cases the work performed by the
subcontractor s forms a direct charge to the contract

111
concerned. Sub contract cost will be shown on the debit side
of the contract account.
6. Escalation clause: This is clause which is provided in the
contract to cover up any increase in the price of the contract
due to increase in the prices of raw material or labour or in the
utilization of any other factors of production. If material and
labour utilization exceeds a particular limit, the customer
agrees to bear the additional cost occasioned by excessive
utilization. Here, the contractor has to satisfy the customer
that excessive utilization is not the result of decreased
efficiency.
Specimen Form of Contract Account (Unfinished contract)
Contract A/C
To materials
To Labour
To Plant
To Overheads
To cost of sub
contracts
To Notional Profit
c/d(B/F)
xxx
xxx
xxx
xxx
xxx
xxx
By work in progress:
Work certified
Work un certified
By material returned
By Plant xxxx
Less:Depreciation xxx
By material lying at site
By Notional profit B/d
xxx
xxx
xxx
xxx
xxx
xxx
xxx xxx

112
To Profit and Loss
A/C
To WIP (B/F)
xxx
xxx
xxx
xxx
=====
xxx
=====
Treatment of Plant and Machinery
One of the distinguishing features of a contract is the use of
special plant and machinery. The cost of these is capital
expenditure, but yet, the usage of these should be reflected in the
form of depreciation. There are two distinct methods of charging
depreciation.
1. At the time of issue of plant to contract the contract
account is debited with the full value of the plant. At the
end of the period contract account is credited with the
depreciated value. This method is used when plant and
machinery is used at the contract site for a long period.
2. In the second method, contract account is debited with an
hourly rate of depreciation for the number of hours the
plant is used on the contract. A cost centre is set up for
each machine. An estimate is made is made of the cost
such as maintenance, depreciation, driver’s wage etc to be

113
incurred. The total of this cost is divided by the number of
hours that the machine is expected to be used.
Profit on Incomplete Contract
In the case of a small contract extending over the financial period,
profit or loss on the same may be ascertained by crediting it with
the contract price due by the contractee. This procedure cannot be
adopted in the case of contracts extending beyond the accounting
period, and taking a long time for completion. If there is any
profit upon the incomplete contract, it cannot be taken as actual
profit. The profit upon the incomplete contract is called notional
profit.
For the purpose of determining the amount of profit to be
transferred to profit and loss account and making provision for
future contingencies, the following guidelines may be kept in
mind.
1. When the work has not reasonably advanced (1/4 or
less than ¼) : - No profit should be taken to the credit of p/L
account in the case of contracts which have just commenced and
a small portion of the work is complete.

114
2. Where the work is complete more than ¼ but less than
½ of contract price: In this case 1/3 of the notional profit as
reduced by the percentage of cash received may be credited to
profit and loss account. The usual formula is
Notional profit x1/3 x Cash received
Work certified
The balance of notional profit shall be kept as reserve till the
completion
3. If the contract completed is more than 1/2 but less than
90%: Here 2/3 rd of the notional profit should be taken to profit
and loss account.
Notional profit x2/3 x Cash received
Work certified
The balance of notional profit shall be transferred to work in
progress as reserve. It is to be noted that in order to find out how
much portion of contract is completed, work certified should be
compared with contract price.
4. If the contract is nearing completion: Here, estimated
profit may be ascertained by deducting the total cost of contract
to date plus estimated additional expenses to complete the
contract , from the contract price. It is calculated by using the
following formula

115
Estimated profit x Cash received
Contract price
The loss on incomplete contract should be fully transferred to
profit and loss account.
Example 1
The following was the expenditure on a contract for Rs. 6,00,000
Material 1 , 20,000
Wages 1 , 64,000
Plant 20,000
Overheads 8,600
Cash received on account of the contract was Rs. 2,40,000 being
80% of the work certified. The Value of material in hand was Rs.
10,000. The plant has undergone 20% depreciation.
Solution:
Contract Account
Rs. Rs.
To materials 1,20,000 By material in hand 10,000
To Wages 1,64,000 By plant on hand 16,000
To Plant 20,000 By work certified
To overheads 8,600 (2,40,000x100/80) 3 , 00,000
To Notional profit 13,400

116
_______ ______
3,26,000 3 , 26,000
====== =====
To P/L account 7,147 By notional profit b/d 13,400
To Balance c/d 6,253
---------- ---------
13, 400 13,400
Example 2
XY Ltd undertook a contract, the following was the expenditure
on a contract for Rs. 6,00,000.
Material issued to contract Rs. 1,02,000
Plant issued for contract Rs. 30000
Wages Rs.1,62,000
Other expenses Rs. 10,000
Cash received on account of contract up to 31st march 2011
amounted to Rs. 2,56,000 being 80% of work certified. Of the
plant and material charged to the contract plant costing Rs. 3000
and material costing Rs. 4000/ were lost. On Ist March 2011,
Plant which cost Rs. 2,000 was returned to the store, the cost of
work done but not certified was Rs. 3000 and material costing Rs.

117
2,500 were in hand on site. Provide 10% depreciation on plant,
reserve 1/3 of profit received and prepare contract account from
the above particulars.
Solution
Contract Account
To materials
To Plant
To wages
To other expenses
To Notional profit
c/d (B. F)
To P/L
Account
52800x2/3x80/100
1,02,000
30,000
1,62,000
10,000
52800
By work in progress:
Work certified
256000x100/80
3,20000
Work uncertified
3000
By P & L Account
Plant lost 3000
Material lost 4000
By plant returned:
2,000
Less: depreciation
200
By material in hand
By plant at site(30000-
3000-
2000) 25000
Less: depr 2500
By notional profit B/d
3 , 23,000
7000
1,800
2,500
22500
356800
28160
24640
356800
=========
52 800

118
Reserve BF 52 800
========
52 800
======
WORK IN PROGRESS ACCOUNT
To contract A/c 3 23,000 By Contract A/c
(reserve)
By Balance c/d
24640
2 , 98,360
3,23,000
=======
3 , 23,000
========
Note: It is assumed that the contract has begun on 1/4/10.
Example- 3
Mr. A has undertaken several contract works. He maintains a
separate record for each contract. From the records for the year
ending 31-12-98, Prepare contract account for Contract No.50 and
find the amount transferred to profit and loss account.
Direct purchase of material 1 , 80,000
Material issued from stores 50,000
Wages 2,44000
Direct expenses 24,000
Machinery purchased 1 , 60,000

119
Establishment charges 54,000
The contract price was Rs. 15,00,000. Cash received up to 31-12-
2008 wasRs. 6,00,000 which is 80 % of work certified . Material
at site Rs. 16,000. Depreciation for Machine Rs. 16,000.
Solution:
To materials:
Direct purchase
Issued from stores
Wages
Direct expenses
Machinery
purchased
Establishment
Notional profit
To P/L account
Work in progress
A/c
1,80,000
50,000
2,44,000
24,000
1 , 60,000
54,000
1 , 98,000
9,10,000
=======
1,05,600
92,400
1,98,000
======
By material at site
Machinery on hand
(1,60,000- 16000)
Work certified
By notional profit b/d
16,000
1 , 44,000
7 , 50,000
9 , 10,000
=======
1 , 98,000
1 , 98,000
=======

120
Process Costing
Process costing is the method of costing applied in the industries
engaged in continuous or mass production. Process costing is a
method of costing used to ascertain the cost of a product at each
process or stage of manufacturing.
According to ICMA terminology, “Process Costing is that form of
operation costing which applies where standardized goods are
produced”.
So it is a basic method to ascertain the cost at each stage of
manufacturing. Separate accounts are maintained at each process
to which expenditure incurred. At the end of each process the cost
per unit is determined by dividing the total cost by the number of
units produced at each stage. Hence, this costing is also called as
“Average Costing” or “Continuous Costing”. Process
Costing is used in the industries like manufacturing industries,
chemical industries, mining works and public utility undertakings.
Characteristics of Process Costing
1. Production is continuous
2. Products pass through two or more distinct processes of
completion.

121
3. Products are standardized and homogeneous.
4. Products are not distinguishable in processing stage.
5. The finished product of one process becomes the raw material
of the subsequent process.
6. Cost of material, labour and overheads are collected for each
process and charged accordingly.
Advantages of Process Costing
1. It is easy to compute average cot because the products are
homogeneous in Process Costing.
2. It is possible to ascertain the process costs at short
intervals.
3. Process Costing is simple and less expensive in relation o
job costing.
4. By evaluating the performance of each process effective
managerial control is possible.
Disadvantages of Process Costing
1 Valuation of work in progress is difficult.
2 It is not easy to value losses, wastes, scraps etc.

122
3 The apportionment of total cost among joint products and by-
products is difficult.
4 Process cost are not accurate, they are only average costs
5 Process costs are only historical.
Principles of Process Costing
The following points are considered while determining the cost
under Process Costing.
1 Production activity should be divided into different processes
or departments.
2 A separate account is opened for each process.
3 Both direct and indirect costs are collected for each process.
4 The quantity of output and costs are recorded in the respective
process accounts.
5 The cost per unit is determined by dividing the total cost at the
end of each process by the number of output of each process.
6 Normal loss and abnormal loss are credited in the process
account
7 The accumulated cost of each process is transferred to
subsequent process along with output. The output of the last

123
process along with cost is transferred to the finished goods
account.
8 In case of by-products and joint products their share in joint
cost should be estimated and credited to the min process.
9 When there is work in progress at the end of the period the
computation of inventory is made I terms of complete units.
Difference between Process Costing and Job Costing
Process Costing Job Costing
1. Production is continuous
2. Production is for stock
3. All units produced are
identical or homogeneous
4. There is regular transfer of
cost of one process to
subsequent processes
5. Work in progress always
exists
1. Production is according to
customers’ orders
2. Production is not for stock
3. Each job is different from
the other
4. There is no regular transfer
of cost from one job to
another
5. Work in progress may or
may not exist
Procedure for Process Costing
124
1. Each process is separately identified. Separate process
account is opened for each process.
2. Along with ‘Particulars Column’, two columns are
provided on both sides of the process account – units
(quantity) and amount (Rupees).
3. All the expenses are debited in the respective process
account.
4. Wastage, sale of scrap, by-products etc are reordered on
the credit side 0f the process account.
5. The difference between debit and credit side shows the
cost of production and output of that particular process
which is transferred to the next process.
6. The cost per unit in every process is calculated by dividing
the net cost by the output.
7. The output of last process is transferred to the Finished
Stock Account.
8. Incomplete units at the end of the each period ion every
process s converted in terms of completed units.
Specimen of Process Account
Process Account

125
Units Rs. Units Rs.
To Direct materials
To Direct Wages
To Direct
Expenses
To Indirect
expenses
To Other Expenses
(if any)
By Loss in
weight
( Normal
Loss)
By sale of Scrap
By Next Process
Account(Transfer)
Preparation of Process Accounts
The preparation of Process Account depends upon the
following situations
1. Simple Process Account
2. Process costing with normal process loss
3. Process costing with abnormal process loss
4. Process costing with abnormal process gains
5. Inter – process profits.
Simple Process Account

126
Under this case it is very easy to prepare process account. A
separate account is opened for each process. All costs are debited
to the process account. The total cost of the process is transferred
to the next process. At the end of each process the cost per unit is
obtained by dividing the total cost by the number of units.
Illustration 1: Product A requires three distinct processes and
after the third process the product is transferred to finished stock.
Prepare various process accounts from the following information.
Total P1 P2 P3
Direct Materials
Direct Labour
Direct Expenses
Production overheads
5000
4000
800
6000
4000
1500
500
600
1600
300
400
900
Production overheads to be allocated to different processes on the
basis of 150% of direct wages. Production during the period was
200 units. Assume 5here is no opening or closing stock.
Solution:
Process I Account

127
Uni
ts
Rs. Uni
ts
Rs.
To Direct
materials
To Direct
Wages
To Direct
Expenses
To Production
overheads
(1500x150
%)
200 4000
1500
500
2250
By Process II
Account(Transfer)
Cost per unit 8250
41.25
=200
200
8250
200 8250 200 8250
Process II Account
Uni
ts
Rs. Uni
ts
Rs.
To Process I A/c
To Direct
materials
To Direct Wages
To Direct
Expenses
To Production
overheads
(1600x150%)
200 8250
600
1600
300
2400
By Process III
Account(Trans
fer)
Cost per unit
13150 = 200
65.75
= 200 13150
200 13150 200 13150

128
Process III Account
Unit
s
Rs. Uni
ts
Rs.
To Process II A/c
To Direct materials
To Direct Wages
To Production
overheads
(900x150%)
200 13150
400
900
1350
By Finished stock
A/c
(OutputTransferred )
Cost per unit
15800 = 79
200
200 15800
200 15800 200 15800
Process losses
The process loss is classified into two- normal process loss and
abnormal process loss.
Normal process loss
This is the loss which is unavoidable on account of inherent nature
of production process. It arises under normal conditions. It is
usually calculated as a certain percentage of input. Normal process
los includes either waste or scrap r both. Waste is unsalable and
has no value. Loss in weight is an example of waste. Loss in

129
weight should be credited to the concerned process account. It
should be recorded only in terms of quantity.
Loss in weight = Opening Stock + output from the preceding
process – (output of the Concerned process + closing stock)
Illustration 2: From the following figures, show the cost of three
processes of manufacture. The production of each process is
passed on to the next process immediately on completion.
Process
A
Process
B
Process
C
Wages and Materials
Works Overhead
Production ion units
Stock on 1 July 2012 (units from
preceding process)
Stock on 31 July 2012 (units from
preceding process)
30400
5600
36000
12000
5250
37500
4000
1000
29250
6000
48000
16500
5500
Solution:
Process A Account
Units Rs. Units Rs.

130
To Wages
and
Materials
To Works
Overhead
36000 30400
5600
By Process
B A/c
(Transfer )
Cost per unit
36000 = 1
36000
36000 36000
36000 36000 36000 36000
Process B Account
Units Rs. Units Rs.
To Opening Stock (Re.1
p.u)
To Process A A/c
(transfer)
To Wages and Materials
To Works Overhead
4000
36000
4000
36000
12000
5250
By loss in weight
(Bal. fig) By Closing
stock @ Re.1p.u
By Process C A/c
(Transfer ) Cost per
unit
56250 = 1.50
37500
1500
1000
37500
1000
56250
40000 57250 40000 57250
Process C Account
Units Rs. Units Rs.
To Opening
Stock (Rs
16500
24750
By loss in weight (Bal.
fig)
500 8250

131
.1.50 p.u)
To Process
B A/c
(transfer)
To Wages
and
Materials
To Works
Overhead
37500
56250
29250
6000
By Closing
By Finished stock A/c (
Transfer )
Cost per unit
108000 = 2.25
48000
5500
48000
108000
54000 116250 54000 116250
Illustration 3: Bihar Chemicals Ltd produced three chemicals
during the month of July 2012 by three consecutive processes. In
each process 2% of the total weight put in is lost and 10 % is scrap
which from process 1 and 2 realizes Rs.100 a ton and from process
3Rs.20 a ton.
The product of three processes is dealt with as follows:
Process 1 Process 2 Process 3
Passed on to the next
process
Sent to warehouse for
sale
75%
25%
50 %
50%
100 %
Expenses incurred:

132
Rs Tons Rs Tons Rs Tons
Raw materials
Manufacturing wages
General expenses
120000
20500
10300
1000 28000
18520
7240
140 107840
15000
3100
1348
Prepare Process Cost Accounts showing the cost per ton of each
product.
Solution:
Process 1 Account
Tons Rs. Tons Rs.
To Raw materials
To Manufacturing
wages
To General expenses
1000 120000
20500
10300
By loss in weight
(2%)
By Sale of scrap
(10%)
By Warehouse -
transfer
(880x25%)
By Process 2
A/c(Transfer )
Cost per unit
140800 = 160
880
20
100
220
660
10000
35200
105600
1000 150800 1000 150800

133
Process 2 Account
Tons Rs. Ton
s
Rs.
To Process 1
A/c(Transfer )
To Raw materials
To Manufacturing
wages
To General
expenses
660
140
105600
28000
18520
7240
By loss in weight
(2%)
By Sale of scrap
(10%)
By Warehouse -
transfer
(704x50%)
By Process
2
A/c(Transfer )
Cost per unit
151360 = 215
704
16
80
352
352
8000
75680
75680
800 159360 800 159360
Process 3 Account
Tons Rs. Tons Rs.
To Process 2
A/c(Transfer )
To Raw materials
To Manufacturing
wages
To General expenses
352
1348
75680
107840
15000
3100
By loss in weight
(2%)
By Sale of scrap
(10%)
By Warehouse -
transfer
Costper unit
198220
34
170
1496
3400
198220

134
1496 =132.5
1700 201620 1700 201620
Abnormal Process Loss
Any loss caused by unexpected or abnormal conditions such as
plant break don, substandard materials, carelessness, accident etc.
or loss in exceeds of the margin anticipated for normal process
loss can be called as abnormal process loss. It is controllable and
avoidable. When actual loss in the process is greater than the
estimated normal loss, it is a case of abnormal loss. It may also be
determined by comparing actual output with expected or normal
output. If actual output is les than the normal output, the difference
is abnormal loss.
Value of Abnormal loss
= Normal cost of normal output x Units of Abnormal loss
Normal output
Normal cost of normal output = Total expenditure (i.e., total debit
of process A/c) – Sale

135
Proceeds of scrap (i.e. Value
of normal loss)
Normal output = Input – Units of normal loss
Illustration 4: In process A 100 units of raw materials were
introduced at a cost of Rs.1000. the other expenditure incurred by
the process was Rs. 602. Of the units introduced 10% are normally
lost in the course of manufacture and them posses a scrap value of
Rs.3 each. The output of process A was only 75 units. Prepare
Process A A/c and Abnormal loss A/c.
Solution:
Process A A/c
Units Rs. Units Rs.
To Raw Materials
To Other expenses
100 1000
602
By Normal loss-
100x10% @Rs.3
each
By Abnormal loss
( Bal.Fig )
By Process B A/c
( transfer )
10
15
75
30
262*
1310
100 1602 100 1602
Working Note:
Normal cost of normal output = Total expenditure – Sale Proceeds
of scrap

136
= 1602-30= 1572
Normal output = Input – Units of normal loss
= 100 – 10 = 90
= x 15 = Rs. 262
Abnormal Loss A/c
Units Rs. Units Rs.
To Process A 15 262 By Cash ( scrap
value of
loss @ Rs.3)
By Costing P&L A/c
15 45
217
15 262 15 262
Abnormal Gain (or Abnormal Effective)
Sometimes actual loss or wastage in a process is less than expected
normal loss. In this case the difference between actual loss and
expected loss is known as abnormal gain or abnormal effective. It
is the excess of actual production over normal output.
Abnormal gain is valued in the same manner as abnormal loss.
The value of abnormal gain is debited to process A/c and credited
to abnormal gain A/c. the value of scrap is debited to abnormal
gain A/.c and credited to normal loss A/c. finally abnormal loss

137
A/c is closed by transferring the credit balance to Costing P&L
A/c.
Value of Abnormal Gain =
= Normal cost of normal output x Units of Abnormal gain
Normal output
Normal cost of normal output = Total expenditure– Sale
Proceeds of scrap
Normal output = Input – Units of normal loss
Units of Abnormal gain = Normal loss- Actual loss
Or = Actual output - Normal output
Illustration 5: Product X is obtained after it passes through three
distinct processes. 2000 kg of materials at Rs.5 per kg were issued
to the first process. Direct wages amounted to Rs.900 and
production overhead incurred was Rs.500. Normal loss is
estimated at 10% of input. This wastage is sold at Rs.3 per kg. The
actual output is 1850 kg. Prepare process I A/c and Abnormal
Gain/ Abnormal loss A/c as the case may be.
Solution:
Process I Account
Kg Rs. Kg Rs.

138
To Materials
To Direct wages
To Production OH
To Abnormal gain
(Bal.)
2000
501
10000
900
500
3003
By Normal loss
(Sale of scrap )
By Process II -
transfer
200
1850
600
111002
2050 11700 2050 11700
Abnormal Gain A/c
Kg Rs. Kg Rs.
To Normal loss (loss
income)
To Costing P&L A/c
(Bal.)
of 50 150
150
By Process I A/c 50 300
50 300 50 300
Working note:
1. (200+1850)-2000=50
2. (10000+900+500)-600 = Rs.6
1850-50
1850x6=11100
3. 50x6=30
Illustration 6: The product of a company passes through three
distinct processes to completion – A,B and C. from the past
experience it s ascertained that los s incurred in each process as –
A-2 %, B-5% and C-10 %.

139
In each case the percentage of loss is computed on te number of
units entering the process concerned. The loss of each process
possesses a scrap value. The los of processes A and B sold at Rs.5
per 100 units and that of C at Rs.20 per 100 units.
The output of each process passes immediately to the next process
and the finished units are passed from process C into stock.
Process A Process B Process C
Materials consumed
Direct labour
Manufacturing expenses
6000
8000
1000
4000
6000
1000
2000
3000
1500
20000 units have been issued to process A at a cost of Rs.10000.
the output of each process has been as under:
A-19500, B- 18800 and C - 16000.
There is no work in progress in any process. Prepare process
accounts. Calculations should be made to the nearest rupee.
Solution:
Process A Account
Units Rs. Units Rs.

140
To Units introduced
To Materials
To Direct labour
To Manufacturing
Expenses
20000 10000
6000
8000
1000
By Normal loss
By Abnormal loss
(Bal.)
By Process B -
transfer
400
100
19500
20
127
24853
20000 25000 20000 25000
Process B Account
Units Rs. Units Rs.
To Process A A/c
To Materials
To Direct labour
To Manufacturing
Expenses
To abnormal gain
19500
275
24853
4000
6000
1000
532
By Normal loss
By Process C -
transfer
975
18800
49
36336
19775 36385 19775 36385
Process C Account
Units Rs. Units Rs.
To Process B A/c
To Materials
To Direct labour
To Manufacturing
Expenses
18800 36336
2000
3000
1500
By Normal loss
By To abnormal
loss
By Finished stock
A/c transfer
1880
920
16000
376
2309
40151
18800 42836 18800 42836
Finished Stock A/c

141
Units Rs. Units Rs.
To Process C A/c 16000 40151
16000 40151 16000 40151
Abnormal Loss A/c
Units Rs. Units Rs.
To Process A
To Process C
100
920
127
2309
By Cash (100 @ Rs .5
100)
By Costing P&L A/c
1020
189
2247
1020 2436 1020 2436
Normal loss A/c
Units Rs. Units Rs.
To Process A
To Process B
To Process C
400
975
1880
20
49
376
By Abnormal Gain
By Cash/Debtors A/c
275
2980
14
431
3255 445 3255 445
Abnormal Gain A/c

142
Units Rs. Units Rs.
To Normal loss (loss
income)
To Costing P&L A/c
(Bal.)
of 275 14
538
By Process C A/c 275 532
275 532 275 532
Working note:
Process A:
Value of Abnormal loss = Rs.24980/19600 units x 100 units = Rs.
127.
Process B:
Value of Abnormal gain = Rs.35804/18525 units x 275 units = Rs.
532.
Process C:
Value of Abnormal loss = Rs.42460/16920 units x 920 units =
Rs. 2309.
Work-in-Progress
In most of the firms manufacturing is on a continuous basis and
the problem of work-inprogress is quite common. The work-in-
progress consists of direct materials, direct wages and production
overhead.

143
Equivalent Production
Equivalent production represents the production of a process in
terms of completed units. In other words, it means converting the
incomplete units into its equivalent of completed units. It is also
known as effective production. For calculating equivalent
production, work-in-progress needs to be inspected. Then an
estimate is made of the degree of completion, usually on a
percentage basis.
Steps and procedure of computation of Equivalent Production
1. Ascertain Equivalent Production in respect of opening work-in-
progress, if any. In this case the Equivalent Production is
computed by taking into consideration the percentage of work
required to finish now in the process. The following formula is
used.
Opening WIP (Units) x % of work needed to complete.
2. Find the units introduced and completed and add this to (1). It
is calculated as follows:
Units completed and transferred – Opening work-in-
progress.
3. Convert the equivalent production of closing work-in-progress
and add to the above. The formula is:
Closing work-in-progress (units) x% of work completed.

144
4. Obtain the total Equivalent Production terms of materials,
labour and overhead separately (if degree of completion is
different). For this, ‘Statement of Equivalent Production’ is
prepared.
5. Find out the net process costs, element wise- materials, labour
and overheads.
6. Ascertain the cost per unit of Equivalent Production for each
element of cost separately.
Material cost per unit= Material cost .
Equivalent Production in respect of materials
Labour cost per unit = Labour cost .
Equivalent Production in respect of labour
Overhead cost per unit = Overhead cost .
Equivalent Production in respect of overhead
For this purpose ‘Statement of Cost is prepared’
7. Find out the value of opening work-in-progress, finished units
and closing work-in-progress. The formula is:
Equivalent Production in respect of materials x Material cost
per unit
Equivalent Production in respect of labour x Labour cost per
unit
Equivalent Production in respect of overhead x Overhead cost
per unit

145
For this purpose ‘Statement of Evaluation or Apportionment’ is
prepared.
In short, the following three statements are to be prepared:
1. Statement of Equivalent Production
2. Statement of Cost
3. Statement of Evaluation.
I. When there is only closing work-in-progress but with no
process losses
Under this case the closing work-in-progress is converted into
equivalent units on the basis of estimate as regards degree of
completion o materials, labour and production overhead.
Illustration 7: Input 3800 units, Output 3000 units and closing
work-in-progress 800 units.
Degree of
completion
Process costs
Rs.
Materials
Labour
Overheads
80%
70%
70%
7280
10680
7120
Find out Equivalent Production, Cost per unit of equivalent
production and prepare the Process A A/c assuming that there is
no opening work-in-progress and process loss.
Solution:

146
Statement of Equivalent Production
Input Output Equivalent Production
Items Units Items Units Materials
Labour&
Overhead
Units % Units %
Units
introduced 3800
Units completed &
transferred
Work in
progress
3000
800
3000
640
100
80
3000
560
100
70
3800 3800 3640 3560
Statement of Cost
Elements of
cost Cost (Rs.)
Equivalent Production
(units)
Cost per completed
unit
Materials
Labour
Overheads
7280
10680
7120
3640
3560
3560
2.00
3.00
2.00
25080 7.00
Statement of Evaluation
Finished goods 3000x7
Work in progress:
Materials 640 x2
Labour 560 x3
Overhead 560 x2
21000
1280
1680
1120
4080

147
Units Rs. Units Rs.
To Materials
To Labour
To Overhead
3800 7280
10680
7120
By Finished stock
A/c transfer
By Work-in-
progress
3000
800
21000
4080
3800 25080 3800 25080
II. When there is only closing work-in-progress but with process
losses
In case of normal loss, nothing should be added as equivalent
production. However, abnormal loss should be considered as
production of good units completed during the period.
Illustration 8: During January 2000 units were introduced into
Process I. the normal loss was estimated at 5% on input. At the
end of the month, 1400 units had been produce and transferred to
the next process, 460 units were uncompleted and 140 units had
been scrapped. It was estimated that uncompleted units had
reached a stage in production as follows:
Material 75% completed
Labour 50% completed
Overheads 50% completed

148
The cost of 20000 units was Rs.5800
Direct material introduced during the process Rs.1440
Direct wages Rs.3340
Production overheads incurred were Rs. 1670
Units scrapped realized Re.1 each.
Units scrapped passed through the process, so were 100%
completed as regards material, labour and overhead.
Find out Equivalent Production, Cost per unit and prepare the
necessary accounts.
Solution:
Statement of Equivalent Production
Input
Units
Output
Units
Equivalent Production
Materials Labour
Overhead
&
Units % Units %
2000 Normal loss
Abnormal loss
Finished production
Work in progress
100
40
1400
460 40
1400
345
100
100
75
40
1400
230
100
100
50
2000 2000 1785 1670
Statement of Cost
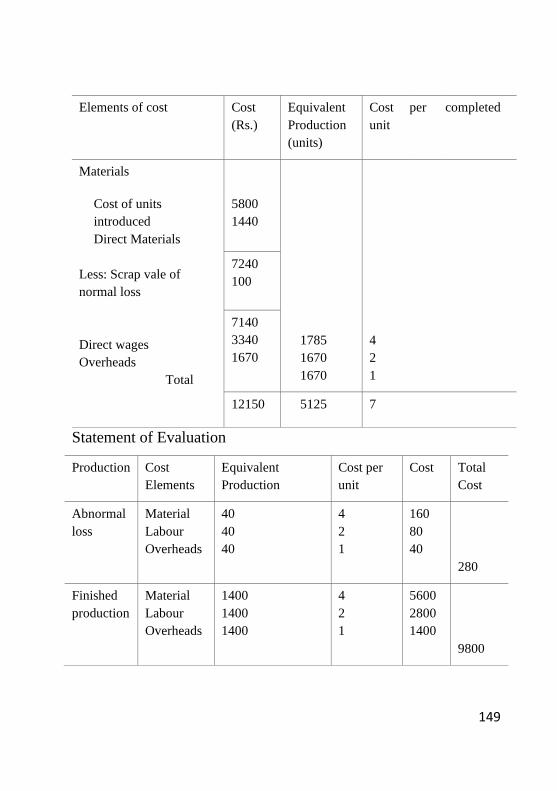
149
Elements of cost Cost
(Rs.)
Equivalent
Production
(units)
Cost
unit
per completed
Materials
Cost of units
introduced
Direct Materials
Less: Scrap vale of
normal loss
Direct wages
Overheads
Total
5800
1440
1785
1670
1670
4
2
1
7240
100
7140
3340
1670
12150 5125 7
Statement of Evaluation
Production Cost
Elements
Equivalent
Production
Cost per
unit
Cost Total
Cost
Abnormal
loss
Material
Labour
Overheads
40
40
40
4
2
1
160
80
40
280
Finished
production
Material
Labour
Overheads
1400
1400
1400
4
2
1
5600
2800
1400
9800

150
Work-
inprogress
Material
Labour
Overheads
345
230
230
4
2
1
1380
460
230
2070
12150
Process I A/c
Units Rs. Units Rs.
To Units introduced
To Materials
To Labour
To Overhead
2000 5800
1440
3340
1670
By Normal loss
By abnormal loss
By Finished
production
By Balance c/d
(Work-in-
progress)
100
40
1400
460
100
280
9800
2070
2000 12250 2000 12250
Finished Production A/c
Units Rs. Units Rs.
To Process I A/c 1400 9800
Abnormal Loss A/c
Units Rs. Units Rs.
To Process I A/c 40 280 By Cash (sale @
Re.1 p.u)
40 40
240

151
40 280 By Costing P&L A/c
(loss)
40 280
III. When there is opening as well as closing work in progress but
with no process loss.
Sometimes in a continuous process there will be opening as well
as closing work in progress which are to be converted into
equivalent of completed units for apportionment of process costs.
The procedure of conversion of opening work in progress will
vary depending upon whether average cost or FIFO or LIFO
method of apportionment of costs is followed.
Illustration 9: From the following details, prepare statement of
equivalent production, statement of cost, statement of evaluation
and process A/c by following FIFO method.
Opening work-in-progress (2000 units):
Materials (100% complete) Rs. 5000
Labour (60% complete) Rs. 3000
Overheads (60% complete) Rs. 1500
Units introdu4ed into the process Rs. 8000
There are 2000 units in progress and the stage of completion is
estimated to be:
Materials 100 %
Labour 50 %

152
Overheads 50 %
8000 units are transferred to the next process :
The process costs for the period are:
Materials Rs.96000
Labour Rs. 54600
Overheads Rs. 31200
Solution:
Statement of Equivalent Production
Output
Units
Equivalent Production
Materials Labour&
Overhead
Units % Units %
Opening WIP
Completed
processed
period(8000-2000)
Closing WIP
Total
during the 2000
6000
2000 6000
2000 10
0
10
0
800
6000
1000
40
100
50
10000 8000 7800
Statement of Cost
Elements of cost Cost
(Rs.)
Equivalent
Production
(units)
Cost per
completed unit

153
Materials
Labour
Overheads
Total
96000
54600
31200
8000
7800
7800
12
7
4
181800 23
Statement of Evaluation
Opening Work-in-progress (current cost)
Materials
Labour 800x7
Overhead 800x4
Closing WIP
Materials 2000x12
Labour 1000x7
Overhead 1000x4 units
completely processed during the period
6000@23
5600
3200
24000
7000
4000
8800
35000
138000
181800
Process A/c
Units Rs. Units Rs.
To Opening WIP
To Materials
To Labour
To Overhead
2000
8000
9500
96000
54600
31200
By Finished stock
transferred to next
process
(9500+8800+138000)
By Closing WIP
8000
2000
156300
35000
10000 191300 10000 191300

154
IV. When there is opening as well as closing work-in-progress but
with losses.
Under this equivalent production units regarding opening and
closing work in progress are to be calculated with due adjustment
for process losses.
Illustration 10: Following data are relating Process A for March
2012.
Opening WIP – 1500 units for Rs. 15000
Degree of completion:
Materials 100%, Labour and overheads 33 1/3%
Input of materials 18500 units at Rs.52000
Direct labourRs. 14000
Overheads Rs. 28000
Closing WIP - 5000 units.
Degree of completion: Materials 90% and labour and overheads
30%.
Norma process loss is 10% of total input (opening WIP units +
units put in)
Scrap value Rs. 2 per unit.
Unit transferred to the next process 15000 units.
Compute equivalent units of production, cost per equivalent unit
for each cost element and cost of finished output and closing WIP.

155
Also prepare Process and other accounts. Assume that FIFO
method is used by the company and the cost of opening WIP is
fully transferred to the next process.
Solution:
Statement of Equivalent Production and Cost
Input
Units
Output Units Equivalent Production
Materials Labour Overhead
Units % Units % Units %
1500
18500
Opening WIP
transfer
Normal loss
Finished
goods Closing
WIP
less:
Abnormal
gain
Materials
less: scrap
value
Cost per
equivalent
unit
1500
2000
13500
5000
13500
4500
100
90
100
1000
13500
1500
662/3
100
30
100
1000
13500
1500
16000
2000
14000
28000
Rs.2
66
2 /
3
100
30
100
20000 22000
2000
20000
52000
4000
18000
2000
16000
48000
Rs.3
16000
2000
14000
14000
Rs.1

156
Statement of Evaluation
Opening Work-in-progress
Materials
Labour 1000x1
Overhead 1000x2
Finished goods 13500×6
Abnormal gain 2000×6
Closing WIP
Materials 4500x3
Labour 1500x1
Overhead 1500x2 units
1000
2000
13500
1500
3000
3000
81000
12000
18000
Process I A/c
Units Rs. Units Rs.
To Opening WIP
To Materials
To Labour
To Overhead
To Abnormal gain
1500
18500
2000
15000
52000
14000
28000
12000
By normal loss
By Finished
stock
(18000+81000)
By Closing
WIP
2000
15000
5000
4000
99000
18000
22000 121000 22000 121000
Normal loss A/c
Units Rs. Units Rs.
To Process I 2000 4000 By Abnormal Gain 2000 4000

157
Abnormal Gain A/c
Units Rs. Units Rs.
To Normal loss (loss of
income)
To Costing P&L A/c
(Bal.)
2000 4000
8000
By Process I A/c 2000 12000
2000 12000 2000 12000

158
Module V : Marginal Costing & Budgetary Control
The basic objectives of Cost Accounting are cost
ascertainment and cost control. In order to help
management in cost control and decision making, cost
accounting has developed certain tools and techniques.
Marginal costing and Break even analysis are important
techniques used for cost control and decision making.
Marginal Cost
The term Marginal cost means the additional cost incurred
for producing an additional unit of output. It is the addition
made to total cost when the output is increased by one
unit.
Marginal cost of nth unit = Total cost of nth unit- total
cost of n-1 unit.
Eg. When 100 units are produced, the total cost is Rs.
5000.When the output is increased by one unit, i.e, 101
units, total cost is Rs.5040.Then marginal cost of 101th
unit is Rs. 40[5040-5000]

159
Marginal cost is also equal to the total variable cost of
production or it is the aggregate of prime cost and
variable overheads. The chartered Institute of
Management Accountants [CIMA] England defines
Marginal as “the amount at any given volume of output
by which aggregate costs are changed if the volume of
output is increased or decreased by one unit.
Marginal Costing
It is the technique of costing in which only marginal costs or
variable are charged to output or production. The cost of
the output includes only variable costs .Fixed costs are not
charged to output. These are regarded as ‘Period Costs’.
These are incurred for a period. Therefore, these fixed
costs are directly transferred to Costing Profit and Loss
Account.
According to CIMA, marginal costing is “the
ascertainment, by differentiating between fixed and variable
costs, of marginal costs and of the effect on profit of
changes in volume or type of output.
Under marginal costing, it is assumed that all costs can be
classified into fixed and variable costs. Fixed costs remain
constant irrespective of the volume of output. Variable costs

160
change in direct proportion with the volume of output. The
variable or marginal cost per unit remains constant at all
levels of output
Features of Marginal Costing [Assumptions in
Marginal Costing]
All costs can be classified into fixed and variable
elements. Semi variable costs are also segregated into
fixed and variable elements.
The total variable costs change in direct proportion with
units of output. It follows a linear relation with volume of
output and sales.
The total fixed costs remain constant at all levels of
output. These are incurred for a period and have no
relation with output.
Only variable costs are treated as product costs and are
charged to output, product, process or operation
Fixed costs are treated as ‘Period costs’ and are directly
transferred to Costing Profit and Loss Account.
The closing stock is also valued at marginal cost and not
at total cost.

161
The relative profitability of product or department is
based on the contribution it gives and not based on the
profit
It is also assumed that the selling price per unit
remains the same i.e, any number of units can be sold at
the current market price.
The product or sales mix remains constant over a period
of time.
Concept of Contribution
Contribution is the excess of sales over marginal cost. It
is not purely profit. It is the profit before recovery of
fixed assets. Fixed costs are first met out of contribution
and only the remaining amount is regarded as profit.
Contribution is an index of profitability. It has a fixed
relationship with sales. Larger the sales more will be the
contribution and vice versa.
Contribution = Sales – Marginal cost
Marginal cost equation
Sales-Marginal cost = Contribution
Contribution = Fixed costs + Profit
Therefore, Fixed cost = Contribution – Profit’
Profit Volume Ratio [P/V RATIO]

162
Contribution is an absolute measure of profitability but it
cannot be used for comparison of two products or
departments. Therefore, the contribution is related to volume
of sales. It is called Contribution / Sales Ratio or
Profit/Volume Ratio [P/V Ratio]
P/V Ratio = Contribution x100
Sales
When the P/V Ratio is higher, profitability of the product
will also be higher. It is an index of relative profitability
of products or departments.
Sales = Contribution
P/V Ratio
Contribution = Sales x P/V Ratio
P/V Ratio can also be find out by the following formula:-
P/V Ratio = Change in Profit x100
Change in Sales
Or P/V Ratio = Fixed Cost x 100
Break even sales
Marginal cost statement
The Marginal cost statement is a profitability statement
prepared according to marginal costing principles. It is
prepared in the following format.

163
Sales
Less: Variable/Marginal cost
Direct Labour
Direct Expenses
Variable Factory overheads
Variable Administration overheads
Variable Selling and distribution overheads
Contribution
Less Fixed Costs Profit
xx
Illustration 1
You are given the following information relating to a
company for the year 2012 Output 20000 units
Selling price per unit Rs.12
Direct materials per unit Rs.5
Direct Labour per unit Rs.2
Variable overhears per unit Rs.1
Fixed cost per year Rs.60000
Calculate [1] Total Marginal cost [2] Contribution
[3]Profit [4]P/V Ratio
Solution:-

164
MARGINAL COST STATEMENT
Output 20000 Units Sales Less: Marginal Cost
Less :Marginal Cost
Direct Materials
Direct Labour
Direct Expenses
Total Marginal Cost
Contribution
Less: Fixed Costs
Profit
12 240000
5
2
100000
1 20000
8
160000
4 80000
60000
20000
P/V Ratio = Contributionx 100
Sale
= 80000 x 100 = 33.33%
240000
Advantages of Marginal Costing
Following are the advantages of Marginal costing
1. It is simple to understand and easy to apply to any
firm
2. There is no arbitrary apportionment of fixed cost in
this system. Fixed costs are transferred to costing

165
profit and Loss account.
3. It also prevents the illegal carry forward in stock
valuation of some proportion of current years fixed cost.
4. The effect of different sales mix on profit can be
ascertained and management can adopt the optimum
sales mix
5. It is used in control of cost by concentrating on
variable cost of production.
6. It helps in profit planning by break even and cost
volume profit analysis
7. It helps management to take a number of short term
decisions like pricing, output, closing down of
department, sales mix, make or buy etc..
Disadvantages of Marginal Costing
Important disadvantages of marginal costing are ;
1. All Assumptions of marginal costing are not
appropriate. The assumption fixed cost remains
constant for all levels may not hold good in the long
run.
2. The assumption that changes in direct proportion
with the volume of also do not hold good under all
circumstances.

166
3. It is difficult to segregate all costs into fixed and
variable elements.
4. The exclusion of fixed costs in ascertaining cost of
production may give misleading results and lead to
non recovery of total costs.
5. The exclusion of fixed costs from inventories affect
profit and financial statements may not reflect true and
fair view of financial affairs.
Break Even Analysis
Every business is interested in ascertaining the breakeven
point. It is the level of operation where total revenue or
sales are equal to total cost. It is the point of no profit or
no loss. The contribution received at Break even point is
just sufficient to meet the fixed costs, leaving nothing as
profit. The firm ceases to incur losses at this point or it
starts to earn a profit from this point. Breakeven point can
be expressed in algebraic method or graphical method.
Algebraic Method
Breakeven point may be expressed in terms of number
of units to be produced, or in terms of volume of sales or in
terms of the capacity of operation. It can be calculated by
the following formula.
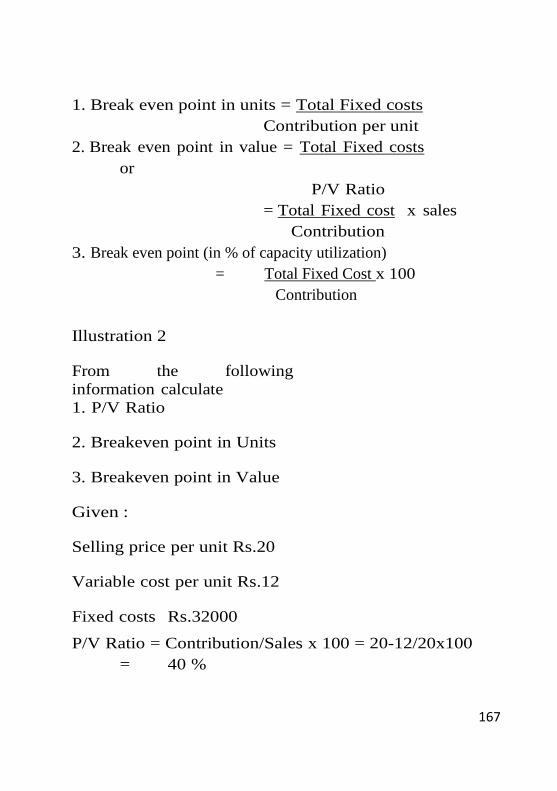
167
1. Break even point in units = Total Fixed costs
Contribution per unit
2. Break even point in value = Total Fixed costs
or
P/V Ratio
= Total Fixed cost x sales
Contribution
3. Break even point (in % of capacity utilization)
= Total Fixed Cost x 100
Contribution
Illustration 2
From the following
information calculate
1. P/V Ratio
2. Breakeven point in Units
3. Breakeven point in Value
Given :
Selling price per unit Rs.20
Variable cost per unit Rs.12
Fixed costs Rs.32000
P/V Ratio = Contribution/Sales x 100 = 20-12/20x100
= 40 %

168
Breakeven point in units = Fixed costs/ Contribution
per unit = 32000/8= 4000 units
Breakeven point in value = Fixed costs = 32000/40 x100
P/V Ratio
= Rs.80000
Target Profit
The Break even analysis can guide an organization to
determine the volume of sales required to earn a desired
level of profit. The firm can decide upon the target
return or profit in advance. To achieve this profit, efforts
would be taken to increase the volume of sales. The
volume of sales required to achieve the desired level of
profit may be computed as follows:-
Number of units to be sold = Fixed costs + desired Profit
Contribution per unit
Sales volume required =Fixed costs+ Desired Profits
P/V Ratio
Illustration 3
Product A is sold at a unit selling price of Rs. 40 and
the variable cost incurred per unit is Rs.32.The firm’s
fixed cost are Rx.40000.Find out
1. The number of units to be produced to break even
2. The number of units to be sold to earn a profit of

169
Rs.10000
Solution
Contribution = SP-VC
= 40-32 = 8 per unit
1. Number of units to be produced to Break even
BEP= Fixed cost/ Contribution per unit = 40000/8
= 5000 units.
2. Number of units to be sold to earn a profit of Rs.10000
Fixed Cost + Desired Profit
Contribution per unit
= 40000+10000/8 = 6250 Units
Break Even Chart [Graphic Method]
It is the graphical presentation of breakeven point. It shows
the relationship between sales volumes, variable and fixed
costs. It also shows the profit or loss at different levels of
output or volume of sales.
Construction of Break even Chart
A Break even chart shows the total sales line, total cost
line and the point of intersection called the breakeven
point. It is constructed using a database of variable costs,
fixed costs, total costs and sales at different levels of
output.

170
The units of output or sales revenue are plotted along the
X axis, using suitable scale of measurement. The costs
and sales are plotted along the Y axis. The fixed costs line
is plotted first. It forms a parallel line to the X axis
indicating that the fixed cost remain constant at all levels
of output. The variable cost line is plotted next, starting
from zero it progresses continuously indicating that the
variable cost increase with the volume fixed cost line of
sales. The total cost line is plotted above the variable cost
line. It starts from the fixed cost line on the Y axis and
follows the same pattern of variable cost line. The sales
line is plotted finally. It starts from the zero and
progresses continuously, indicating that the sales increase
with larger units of output. The point of intersection of
sales line and total cost line indicates the Break even
point. A vertical line drawn to the X axis from this point
shows the volume of output required to Break even.
Illustration 4
Draw a Break even chart using the following data Selling
price per unit Rs.12
Variable cost per unit Rs.7
Fixed costs Rs. 2000

171
Budgeted output 800 units
Solution
Output
[units]
Variable
costs
Fixed
costs
Total costs Sales
200 1400 2000 3400 2400
400 2800 2000 4800 4800
600 4200 2000 6200 7200
800 5600 2000 7600 9600
400
4800

172
Angle of Incidence
It is the angle caused by the intersection of the total sales
line and total cost line at the Break even point. The width
of the angle represents the rate of profitability i.e, the larger
the angle the greater will be the profit the business is making
on additional sales
Margin of Safety
Margin of safety represents the strength of the business to
face an adverse market condition. It is the excess of actual
sales over break even sales. Higher the Margin of safety,
better the position of the firm.
Margin of safety = Actual sales- Break even sales
Margin of safety = Profit / P/V Ratio
Or Profit = margin of safety x P/V Ratio
Illustration 5
Calculate BEP and Margin of safety from the following?
Sales 50000 units @ Rs.6 per unit
Prime cost Rs. 3 per unit
Variable overhead Rs. 1 per unit
Fixed costs Rs.75000 per annum
Solution:-

173
BEP =. Fixed Cost . = 75000 =37500 units
SP-VC per unit 6-4
BEP in value = 37500 x 6 = 225000
Margin of safety = Actual sales – BE sales
= [50000x6]-225000= Rs.75000
Illustration 6
The following data have been obtained from the records of
a manufacturing firm.
Period I Period II
Sales 300000 320000
Total cost 260000 272000
Calculate
1. Break even sales
2. Profit when sales are Rs.360000.
3. Sales required to earn a profit of Rs.50000
Solution:
P/V Ratio = Change in Profit x 100
Change in Sales
Change in profit = 48000-40000= 8000
Change in Sales = 320000-300000 = Rs.20000
P/V Ratio = 8000/20000x 100 = 40%
Contribution = Sales x P/V Ratio
Period I = 300000 x 40/100 = Rs.120000
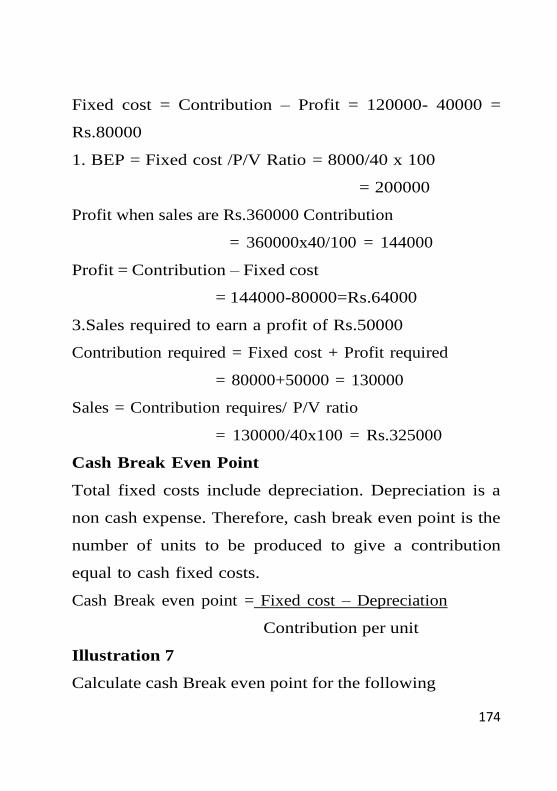
174
Fixed cost = Contribution – Profit = 120000- 40000 =
Rs.80000
1. BEP = Fixed cost /P/V Ratio = 8000/40 x 100
= 200000
Profit when sales are Rs.360000 Contribution
= 360000x40/100 = 144000
Profit = Contribution – Fixed cost
= 144000-80000=Rs.64000
3.Sales required to earn a profit of Rs.50000
Contribution required = Fixed cost + Profit required
= 80000+50000 = 130000
Sales = Contribution requires/ P/V ratio
= 130000/40x100 = Rs.325000
Cash Break Even Point
Total fixed costs include depreciation. Depreciation is a
non cash expense. Therefore, cash break even point is the
number of units to be produced to give a contribution
equal to cash fixed costs.
Cash Break even point = Fixed cost – Depreciation
Contribution per unit
Illustration 7
Calculate cash Break even point for the following

175
Selling price per unit Rs.40
Variable cost per unit Rs.32
Fixed cost [including depreciation of Rs.20000] Rs.60000
per annum
Solution
Contribution per unit = S- VC = 40-32 = 8
Cash break even point = Fixed cost – depreciation
Contribution per unit
= 60000-20000/8 = 5000 units
COMPOSITE BREAK EVEN POINT
In the case of companies producing more than one product
an over all or composite break even point is calculated.
Composite Break even point = Total Fixed Costs
Composite P/V Ratio
Composite P/V Ratio = Total contribution x 100
Total Sales of all products
Cost-Volume Profit Analysis [CVP Analysis]
It is the study of the impact of a change in cost , price and
volume on profit. Break even analysis is a narrow
interpretation of cost volume profit analysis. But it is mainly
confined to finding out the Break even point. In CVP
analysis the relationship between cost, volume and profit is

176
studied in detail. It helps management in profit planning,
decision making and cost control.
Assumptions in CVP analysis
The assumptions in CVP analysis are the same as that
under marginal costing.
1. Cost can be classified into fixed and variable
components.
2. Total fixed cost remain constant at all levels of output
3. The variable cost change in direct proportion with the
volume of output
4. The product mix remains constant
5. The selling price per unit remains the same at all the
levels of sales
6. There is synchronization of output and sales, i.e, what
ever output is produced , the same is sold during that
period.
Profit Volume Chart or [P/V Chart]
It shows the amount of profit or loss at different levels of
output. When the output is zero, total loss will be equal to
fixed costs. The fixed costs are recovered gradually when
the volume of output is increased. When the output reaches
the Break even point, the whole fixed costs are recovered.

177
The firm incurs no loss or earns no profit. Thereafter, the
firm makes a profit and the amount of profit increases with
the increase in sales volume.
Construction of P/V Chart
The same data used for drawing a Break even chart may
be used for constructing a P/V chart. The following steps
may be followed for constructing a P/V chart.
1. Sales or units of output are plotted along the X axis
2. The Y axis is used for marking fixed costs losses and
profits
3. Points of Profits or losses are marked at different
levels of sales and these points are joined to get the
profit or loss line.
4. The point where the profit or loss line intersects the
X axis is marked as the Break even point.
5. The angle at the BEP measures the angle of incidence
6. The distance between BEP and actual sales on the
X axis measures the margin of safety
Illustration 8
Draw a Profit/ Volume graph from the following data and
find out the BEP?
Sales for the year [ 20000units] Rs.2000000

178
Total revenue
600,000
500,000
Total expenses
Profit area 400,0
00
• Variable
expense (
300,000 Loss
area 200,000
Annual
fixed expen
ses 100,000
5,000
10,000
15,000
20,000
25,000
30,000
Variable Costs Rs.1600000
Fixed costs for the year Rs.200000
What would be the profits when the output is 22000
units?
Cost-volume-profit graph
.

179
Budget and Budgetory Control
Meaning and definition of budget
A budget is a plan of action for a future period. It simply means a
financial plan expressed in terms of money. The budget
pertaining to any of the activities of business is always forward
looking. The term ‘budget’ has been derived from the French
word, ”bougette”, which means a leather bag into which funds are
appropriated to meet the anticipated expenses.
The CIMA Official Terminology defines a budget as “ A
quantitative statement, for a defined period of time, which may
include planned revenues, expenses, assets, liabilities and cash
flows.”
Budgeting and Budgetary control
Budgeting simply means preparing budgets. It is a process of
preparation, implementation and the operation of budget. Being a
plan of action, a budget guides every manager in the decision
making process.
In the words of Rowland Harr, “Budgeting is the process of
building budgets”.

180
Budgetary control is a system of using budgets for planning and
controlling costs. The official terminology of CIMA defines the
term ‘budgetary control , as “ the establishment of budgets relating
to the responsibilities of executives to the requirement of a policy,
and the continuous comparison of actual with budgetary result,
either to secure by individual action the objectives of that policy or
to provide a basis for its revision.” Thus, when plans are
embodied in a budget and the same is used as the basis for
regulating operations, we have budgetary control. As such
budgetary control starts with budgeting and ends with control.
Objectives of Budget and Budgetary control:
The following points reveal the objectives of Budget and
budgetary control:-
1. To aid the planning of annual operations
2. To co ordinate the activities of the various parts of the
organization
3. To communicate plans to the various responsibility centre
managers
4. To motivate managers to strive to achieve the
organizational goals.
5. To control activities

181
6. To eliminates the wastes of all kinds
7. To provide a yard stick against which actual results can be
compared
8. To evaluate the performance of managers.
9. To reduce the uncertainties
Meaning of Estimate Forecast and Budget:
An estimate is predetermination of future events either on the basis
of simple guess work or following scientific principles.
Forecast is an assessment of probable future events. Budget is
based on the implication of a forecast and related to planned
events. To establish a realistic budget, it is necessary to forecast a
wide range of factors like sales volume, sales prices, material
availability, wage rate, the cost of overheads etc.
Steps involved in Budgetary Control:
The following steps may be considered necessary for a
comprehensive budgetary control programme:-
1. Laying down organizational goals or objectives
2. Formulating the necessary plans to ensure that the desired
objectives are achieved.
3. Translating plans into budget

182
4. Relating the responsibilities of executives to the
requirements of a policy.
5. Recording and reporting actual performance
6. Continuous comparison of actual with budgeted results
7. Ascertainment of deviations, if any
8. Focusing attention on significant deviations
9. Investigation into deviations to establish causes
10. Presentation of information to management, relating the
variations to individual responsibility.
11. Taking corrective action to prevent recurrence of
variations.
12. Provide a basis for revision of budgets.
Essentials of a Budgetary Control system
Successful implementation of a budgetary control system depends
up on the following essentials.
1. Support by top management: The wholehearted support of
all managerial persons is very necessary for the success of a
budgetary control system.
2. Formal organization: The existence of a formal and sound
organizational structure is of an absolute necessity for an
effective system of budgetary control.

183
3. Budget centers: For budgetary control purposes, the entire
organization will be split into a number of departments, area or
functions, known as ‘centres’, and budgets will be prepared
for each such centers
4. Clear cut objectives and reasonably attainable goals:- If
goals are too high to be attained, the purpose of budgeting is
defeated. On the other hand, if the goals are so low that they
can be attained very easily, there will be no incentive to special
effort.
5. Participative budgeting: Every executive responsible for the
implementation of budgets should be given an opportunity to
take part in the preparation of budgets.
6. Budget committee: The work of preparing a budget manual
should be entrusted to a Budget committee. The work of
scrutinizing the budgets as well as approving of the same
should be the work of this committee.
7. Comprehensive budgeting: Budgeting should not be partial,
it should cover all the functions .
8. Adequate accounting system: There should be an adequate
accounting system for the successful budgetary control system,
because those who are involved in the preparation of estimates
depend heavily on the accounting department.
184
9. Periodic reporting: - There should be a prompt and timely
communication and reporting system for the effective
implementation of a budgetary control system.
Budget manual:
CIMA England, defines a budget manual as “ a document ,
schedule or booklets which sets out;
inter alia, the responsibilities of the persons engaged in the routine
of and the forms and records required for budgetary control”. In
other words, it is a written document which guides the executives
in preparing various budgets.
Budget period: This may be defined as the period for which a
budget is prepared and employed. The budget period will depend
on the type of business and the control aspects. There is no
general rule governing the selection of the budget period.
Classification of Budget
1 . Classification according to time factor
2 . Classification according to flexibility factor
3 . Classification according to function.
I. Classification according to time factor: - On this basis,
budgets can be of three types:
1. Long term budget – for a period of 5 to 10 years

185
2. Short term budgets – Usually for a period of one to two
years
3. Current budgets - Usually covers a period of one month or
so,
II. Classification according to flexibility: It includes
1. Flexible budgets and
2. Fixed budgets
Flexible budgets: It is a dynamic budget. It gives different
budgeted cost for different levels of activity. It is prepared
after making an intelligent classification of all expenses
between fixed , semi variable and variable because the
usefulness of such a budget depends up on the accuracy with
which the expenses can be classified.
Steps in preparing flexible budgets:
1. Identifying the relevant range of activity
2. Classify cost according to variability
3. Determine variable cost
4. Determine fixed cost
5. Determine semi variable cost
6. Prepare the budget for selected levels of activity

186
Example 1
The expenses budgeted for production of 10,000 unit in a factory
are furnished below:
Per unit in Rs
Material cost 70
Labour cost 25
Variable factory over head 20
Fixed over head (Rs. 1,00,000) 10
Variable expenses(Direct) 5
Selling expenses (20% fixed) 15
Distribution overhead (10% fixed) 10
Administration expenses (Rs, 50,000) 5
Prepare a flexible budget for production of 8,000 units.
Solution:

187
Output Per
unit(Rs)
10,000
units
Total
Out put
Per unit
(Rs)
8 ,000
units
Total
(Rs.)
Material
Labour
Direct expe, (variable)
Factory overhead :
Variable
Fixed
Administrative expenses:
Selling expenses:
Fixed (20% of 15)
Variable (80% of 15)
Distribution expenses:
Fixed (10% of Rs. 10)
Variable (90% of 10)
70.00
25.00
5.00
7,00,000
2,50,000
50,000
70.00
25.00
5.00
5 , 60,000
2 , 00,000
40,000
100.00
20.00
10.00
10,00,000
2,00,000
1,00,000
100.00
20.00
12.50
8,00,000
1, 60,000
1,00,000
130.00
5.00
13,00,000
50,000
132.50
6.25
10,60,000
50,000
135.00
3.00
12.00
1.00
9.00
13,50,000
30,000
1,20,000
10,000
90,000
138.75
3.75
12.00
1.25
9.00
11, 10,000
30,000
96,000
10,000
72,000
160.00 16,00,000 164.75 13 , 18,000
Fixed Budget

188
It is a budget which is designed to remain unchanged irrespective
of the level of activity attained. It does not change with the
change in the level of activity. This type of budget are most suited
for fixed expenses. It is a single budget with no analysis of cost.
III. Classification according to function: It includes:
1. Functional budgets and
2. Master budgets
Functional budgets are those which are prepared by heads of
functional department s for their respective departments and are
subsidiary to the master budget. Functional budget may be
Operating budgets or financial budget. Operating budgets are
those budgets which relate to the different activities or operations
of a firm. These are the primary budgets. Financial budgets are
those which incorporate financial decisions of an organization.
They show in detail the inflow and outflow of cash and the overall
financial position.
Master budget is the summary of all functional budgets. It
summarizes sales, production, purchase, labour, finance budgets
etc. It is considered as the overall budget of the organization.

189
Different types of functional budgets:
1. Sales budget: It is forecast of total sales expressed in quantities
and money. It is prepared by the sales manager. While
preparing sales budget we have to consider the past sales data ,
market conditions, general trade and business conditions etc
Illustration 1
A manufacturing company submits the following figures of
product ‘Z’ for the first quarter of 2018
Sales (in units)January 50,000
February 40,000
March 60,000
Selling price per unit Rs. 100
Sales target of 1st quarter 2019:
Sales quantity increase 20% Sales price increase 10%
Prepare sales budget for the first quarter of 2019.
Solution:
Sales budget
For the first quarter of 2019
Months Units Price per
unit
Value

190
January
February
March
60,000
48,000
72,000
110
110
110
66 , 00,000
52 , 80,000
79 , 20,000
1,80,000
============
1 ,98, 00,000
==========
2. Production budget: It is the forecast of the quantity of
production for the budget period. It is usually expressed in
physical quantity.
Illustration 2
A manufacturing company submits the following figures relating
to product X for the first quarter of 2018.
Sales targets: January 60 ,000 units
February 48 ,000 units
March 72 ,000 units
Stock position: 1-1-2018(% of January 2010 sale) - 50 %
Stock position: 31-3-2018 40 ,000 units
Stock position: End January & February 50 %
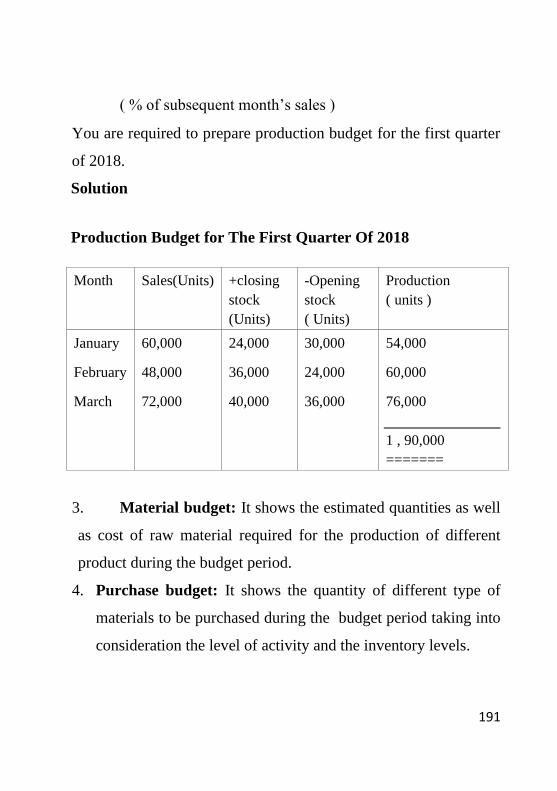
191
( % of subsequent month’s sales )
You are required to prepare production budget for the first quarter
of 2018.
Solution
Production Budget for The First Quarter Of 2018
Month Sales(Units) +closing
stock
(Units)
-Opening
stock
( Units)
Production
( units )
January
February
March
60,000
48,000
72,000
24,000
36,000
40,000
30,000
24,000
36,000
54,000
60,000
76,000
1 , 90,000
=======
3. Material budget: It shows the estimated quantities as well
as cost of raw material required for the production of different
product during the budget period.
4. Purchase budget: It shows the quantity of different type of
materials to be purchased during the budget period taking into
consideration the level of activity and the inventory levels.

192
5. Cash budget: It is prepared only after all the other functional
budgets are prepared. It is also known as financial budget. It
is a statement showing estimated cash inflows and cash
outflows over the budgeted period.
The cash budget is prepared on the basis of the cash forecast.
The cash forecast is an estimate showing the availability or
otherwise of adequate amount of cash in a future period for
meeting the operating expenses and all other commitments. It
summarizes the anticipated cash receipts and cash payments
for the budget period.
There are three methods for preparing the cash budget. They are:
a. The receipts and payment method
b. Adjusted Profit and Loss account method
c. Balance sheet method.
Example 2(Receipts and Payment method)
A company is expecting to have Rs. 25000cash in hand on 1st
April 2018 and it requires you to prepare an estimate of cash
position during the three month, April to June 2018. The
following information is supplied to you.
Months Sales(Rs) Purchase(Rs) Wages(Rs) Expenses(Rs)
February 70,000 40,000 8,000 6,000

193
March 92,000 52,000 9,000 7,000
May 1,00,000 60,000 10,000 8,000
June 1,20,000 55,000 12,000 9,000
Other information:
1. Period of credit allowed by suppliers – two months
2. 25 % of sale is for cash and the period of credit allowed to
customers for credit sale is one month.
3. Delay in payment of wages and expenses – one month.
4. Income tax of Rs.25,000 is to be paid in June 2018.
Solution:
Cash Budget for the Period Ending June 2018
Opening balance
Receipts:
Cash sales
Cash from debtors
Total
Payments:
Creditors
Wages
Expenses
Income Tax
April (Rs.)
25,000
23,000
60,000
May(Rs.)
53,000
25,000
69,000
June(Rs.)
81,000
30,000
75,000
Total(Rs.)
-------
78,000
2 , 04,000
83,000
========
40,000
8,000
7,000
---
94,000
=======
50,000
9,000
7,000
-----
1,05,000
========
52,000
10,000
8,000
25,000
2 , 82,000
=======
1 , 42,000
27,000
22,000
25,000

194
Total
Closing balance
55,000
========
53,000
66,000
=======
81,000
95,000
91,000
2 , 10,000
=======
----
b. Adjusted Profit and Loss method: Under this method,
profit is adjusted by adding back depreciations, provisions, stock
and work in progress, capital receipts, decrease in debtors,
increase in creditors etc. Similarly, dividends, capital payments,
increase in debtors, increase in stock and decrease in creditors are
deducted. The adjusted profit will be the estimated cash available.
Under this method, the following information becomes necessary.
1. Expected opening balance
2. Net profit for the period
3. Changes in current asset and current liabilities
4. Capital receipts and capital expenditure
5. Payment of dividend
c. Balance sheet method: Under this method, a budgeted
balance sheet is prepared for the budgeted period, showing all
assets and liabilities except cash. The two sides of the balance
sheet are then balanced. The balance then represents cash at bank
or overdraft, depending upon whether the assets total is more than

195
that of the liabilities total or the latter is more than that of the
former.
Advantages of Cash budget
1. It helps to ascertain the shortage of cash
2. It helps to identify excess of cash, so that the surplus cash
can be invested for a short period
3. It helps to ensure sufficient cash is available when
required.


![Pirc & Modern Defence [B06 09]terrycucf.weebly.com/uploads/1/9/2/9/19295043/pircmoderndefence.pdf · Pirc & Modern Defence [B06 ... he Pirc Defence remains a solid and reliable option](https://static.fdocuments.in/doc/165x107/5a9d04167f8b9ab6188e7d42/pirc-modern-defence-b06-09-modern-defence-b06-he-pirc-defence-remains-a-solid.jpg)


![Pirc & Modern Defence [B06-09]](https://static.fdocuments.in/doc/165x107/615a990933c29412ef79c9e2/pirc-amp-modern-defence-b06-09.jpg)