cosmos-lab.org file · Web viewSummarize-Come up with a class definition for the word...
16
Equivalence with Code Name:___________________________Class:_____________Date: _________ Subject Ms. _________________________ Extension Lesson on Equivalence Lab: A follow-up on Equivalence relevant to Common Core State standards in Algebraic Expressions & Equations and Multiple Representations in both Algebra & Number Sense. NOTE: It is the teacher’s prerogative to choose up to how many experiments/trials they wanted to give their students depending on the grade level they are teaching. Problem: What is the difference between the sound waves produced by an AM Radio Signal versus the one produced by an FM Radio Signal? How is sound wave transformed into multiple forms in an AM Modulation and FM Modulation? Hypothesis What do you think will happen? Write your hypothesis in the “If…(independent variable), then…(dependent variable)” format?
Transcript of cosmos-lab.org file · Web viewSummarize-Come up with a class definition for the word...

Equivalence with Code
Name:___________________________Class:_____________Date: _________Subject Ms. _________________________
Extension Lesson on Equivalence Lab: A follow-up on Equivalence relevant to Common Core State standards in Algebraic Expressions & Equations and Multiple Representations in both Algebra & Number Sense.
NOTE: It is the teacher’s prerogative to choose up to how many experiments/trials they wanted to give their students depending on the grade level they are teaching.
Problem:What is the difference between the sound waves produced by an AM Radio Signal versus the one produced by an FM Radio Signal?
How is sound wave transformed into multiple forms in an AM Modulation and FM Modulation?
HypothesisWhat do you think will happen?Write your hypothesis in the “If…(independent variable), then…(dependent variable)” format?
If __________________________________________________________________________________________________________________________________ then __________________________________________________________________________________________________________________________________

Materials● COSMOS Tool kit● SDR receiver (500 hz -1.7 Ghz)● Laptops● Post-it Chart Paper● Markers● Graph Paper ● Graphic Organizer to record data● Vocabulary Sheet for the students
Day 1- ActivityUsing the website https://www.asciitohex.com/ students will translate their name from ASCII (text) → hex → binary
Students will look for patterns within their names and those of their neighbors.
How does this activity relate to math? When do we see something represented in multiple ways but still mean the same thing?What is the math word for this?
Summarize-Come up with a class definition for the word “equivalence”.
Using the cosmos translation program 1) Have student enter their name in ASCII 2) Program will produce a wave equivalence
Ask: Why do you think that we need to be able to translate everyday text (ASCII) into waves? What is a wave?Is there an everyday use for waves?
Day 2-5 Experiment
SOME BASIC NOTES FOR REFERENCE BEFORE THE EXPERIMENT:
What is a wave?noun
1. a long body of water curling into an arched form and breaking on the shore.
2. a sudden occurrence of or increase in a specified phenomenon, feeling, or emotion.

3. a gesture or signal made by moving one's hand to and fro.
Waves in Nature:
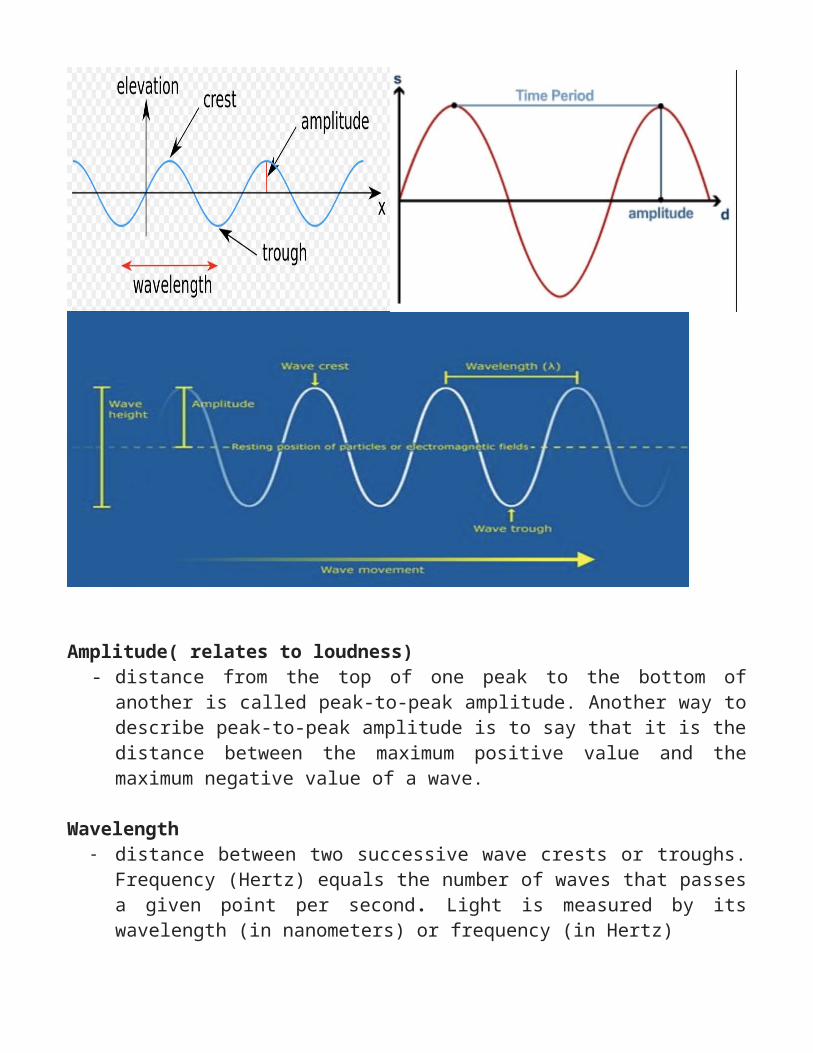
What’s in a wave?

Amplitude( relates to loudness)- distance from the top of one peak to the bottom of another is called peak-to-
peak amplitude. Another way to describe peak-to-peak amplitude is to say that it is the distance between the maximum positive value and the maximum negative value of a wave.
Wavelength- distance between two successive wave crests or troughs. Frequency (Hertz)
equals the number of waves that passes a given point per second . Light is measured by its wavelength (in nanometers) or frequency (in Hertz)
Period- is the time it takes to complete one cycle. The standard unit of a wave period
is in seconds, and it is inversely proportional to the frequency of a wave,
which is the number of cycles of waves that occur in one second. In other words, the higher the frequency of a wave, the lower the wave period.
Frequency - is how often an event repeats itself over a set amount of time. In physics, the
frequency of a wave is the number of wave crests that pass a point in one second (A wave crest is the peak of the wave). Hertz (symbol Hz) is the unit of frequency.
- is how many waves pass by in a single second Wavelength is the distance between two crests or troughs.
https://study.com/academy/lesson/wave-parameters-wavelength-amplitude-period-frequency-speed.html
Important Analogy:
If you were at the beach, frequency is how often a wave hits you and amplitude is the height of the wave. Wavelength and Amplitude Let's use the beach analogy again.

AM wavelength is longer wavelength and weaker- so it is less frequent, needs longer antenna
FM wavelength are shorter wavelength and stronger-so it is more frequent, needs shorter antenna
ProcedurePre-lab preparations
1. In your group, decide which job each person will havea. Timer: __________________________________________________
b. Data Recorder/Program Runner: _______________________________________________________
c. Facilitator_______________________________________________
2. Set-up the COSMOS Toolkit a. Check if the toolkit has all its complete set-up: antenna, SDR receiver
and the monitor.b. Put the whole thing in a stable surface like a table.c. Have papers/graphic organizer ready for recording results.d. Phone used to take a picture of what’s visualized on the screen or
make sure the laptop will be used to take screenshots of the various things you need to capture.

3. Discuss how you will orchestrate the whole process or create a system where you can perform the whole process within the allotted time.
4. Perform the experiment when your teacher gives you the signal to start.
PART 1
a. You will be grouped in 5’s and each group will be given a COSMOS tool kit.b. You will download the following programs and observe the different types of
graphs/waves you see from the screen. Samples are seen below.
Experiment A 1.2.1 AM-modulation.grc at 500 Hertz
Describe what happen when the carrier frequency slider moves to the right.What changes have you noticed in the waves produced by:
Graphic Organizer:Take a screenshot or a picture of each type of wave changes & paste it on the boxes
AM Modulated Signal Carrier Wave Informational Signal
500 Hertz
1000 Hertz
1500 Hertz
2000 Hertz

2500 Hertz
3000 Hertz
3500 Hertz
4000 Hertz
4500 Hertz
5000 Hertz
Experiment B 1.2.2 FM-modulation.grc at 1000 Hertz
Describe what happen when the frequency deviation slider moves to the right.
What changes have you noticed in the waves produced by:
Graphic Organizer:Take a screenshot or a picture of each type of wave changes & paste it on the boxes
FM or FSK modulated signal: information on carrier
Informational Signal
1000 Hertz

1500 Hertz
2000 Hertz
2500 Hertz
3000 Hertz
3500 Hertz
4000 Hertz
4500 Hertz
5000 Hertz
Experiment C 1.2.3 ASK-modulation.grc at 1000 Hertz
Describe what happen when the career frequency slider moves to the right.
Graphic Organizer:Take a screenshot or a picture of each type of wave changes & paste it on the boxes
Informational Signal Carrier Wave ASK modulated signal: information on carrier

1000 Hertz
1500 Hertz
2000 Hertz
2500 Hertz
3000 Hertz
Questions:How does moving the slider affect the size or the nature of each type of wave in Part 1? Explain /Justify your reasoning.
PART 2- This will be assigned for Project and will be investigated by the students.
a. You will be grouped in 5’s and each group will be given a COSMOS tool kit.b. You will download the following programs and observe the different types of
graphs/waves you see from the screen.
Experiment D 1.3 am-frequency-time.grc at 1000 Hertz

Graphic Organizer:Take a screenshot or a picture of each type of wave changes & paste it on the boxes
AM Modulation of a Signal
Spectogram Frequency View
1000 Hertz
1500 Hertz
2000 Hertz
2500 Hertz
3000 Hertz
3500 Hertz
4000 Hertz
4500 Hertz
5000 Hertz
Experiment E 1.3 fm-frequency-time.grc

Graphic Organizer:Take a screenshot or a picture of each type of wave changes & paste it on the boxes
FM or FSK modulated signal: information on carrier
Spectogram Frequency View
1000 Hertz
1500 Hertz
2000 Hertz
2500 Hertz
3000 Hertz
3500 Hertz
4000 Hertz

4500 Hertz
5000 Hertz
c. Question:How does moving the slider affect the size or the nature of each type of wave?
ReflectionThink about your experiment!!Your discussion must be detailed and include answers to the following questions:
● How did your data from part 1 and part 2 the same?● How is the data from part 1 and part 2 different? ● What are some factors that could’ve led to differences between the two
parts?● Do you feel the data is valid (reliable and accurate)? Why or Why not?● What were the sources of error in this experiment (factors that may have
affected your results)? Explain.● If you had the opportunity to redo the experiment, what changes would you
make? How would you improve it? Explain.● What new questions did the experiment generate? Explain.● What did you learn from the experiment? Explain.