Correlation of Material properties to the Reliability...
43
Correlation of Material properties to Correlation of Material properties to the Reliability performance of High the Reliability performance of High Density BGA Package solder joints: Density BGA Package solder joints: By By Vasu.S. Vasudevan Vasu.S. Vasudevan Intel Corporation Intel Corporation For For IPC Reliability Summit IPC Reliability Summit February 23, 2007 February 23, 2007
Transcript of Correlation of Material properties to the Reliability...

Correlation of Material properties to Correlation of Material properties to the Reliability performance of High the Reliability performance of High Density BGA Package solder joints: Density BGA Package solder joints:
ByBy
Vasu.S. VasudevanVasu.S. VasudevanIntel CorporationIntel Corporation
For For
IPC Reliability SummitIPC Reliability Summit
February 23, 2007February 23, 2007

2Vasu Intel Corporation
Legal InformationLegal InformationTHIS DOCUMENT AND RELATED MATERIALS AND INFORMATION ARE PROVIDED "AS IS" WITH NO WARRANTIES, EXPRESS OR IMPLIED, INCLUDING BUT NOT LIMITED TO ANY IMPLIED WARRANTY OF MERCHANTABILITY, FITNESS FOR A PARTICULAR PURPOSE, NON-INFRINGEMENT OF INTELLECTUAL PROPERTY RIGHTS, OR ANY WARRANTY OTHERWISE ARISING OUT OF ANY PROPOSAL, SPECIFICATION, OR SAMPLE. INTEL ASSUMES NO RESPONSIBILITY FOR ANY ERRORS CONTAINED IN THIS DOCUMENT AND HAS NO LIABILITIES OR OBLIGATIONS FOR ANY DAMAGES ARISING FROM OR IN CONNECTION WITH THE USE OF THIS DOCUMENT.
INTEL MAY MAKE CHANGES TO SPECIFICATIONS, PRODUCT DESCRIPTIONS, AND PLANS AT ANY TIME, WITHOUT NOTICE.Copyright © 2007, Intel Corporation. All rights reserved.

3Vasu Intel Corporation
AgendaAgenda
IntroductionIntroduction
LF Alloy Selection LF Alloy Selection
LF Material PropertiesLF Material Properties
LF Reliability Concerns and Test ResultsLF Reliability Concerns and Test Results
Reliability Data AnalysisReliability Data Analysis
SummarySummary
Q&AQ&A

4Vasu Intel Corporation
Scope/Objective Scope/Objective
ObjectiveObjective––To provide an overview of PbTo provide an overview of Pb--free (LF) free (LF)
material properties, LF challenges, LF and material properties, LF challenges, LF and LF reliability results BGA componentsLF reliability results BGA components
ScopeScope––LF challenges and solder joint reliability LF challenges and solder joint reliability
(SJR) performance of LF alloys for 2(SJR) performance of LF alloys for 2ndnd level level interconnect with main emphasize on SAC interconnect with main emphasize on SAC alloy system alloy system

5Vasu Intel Corporation
Motivation for LF TransitionMotivation for LF Transition
Government RegulationsGovernment Regulations––The European Union (EU) leads in environmental The European Union (EU) leads in environmental
regulation, but China follows closelyregulation, but China follows closelyCalifornia Bill AB 48 would follow UK adoption of RoHSCalifornia Bill AB 48 would follow UK adoption of RoHS
––RoHS ( EU Directive) restricts the use of the Lead RoHS ( EU Directive) restricts the use of the Lead substances in electronic products placed on the EU substances in electronic products placed on the EU market after July 1, 2006 or later depending on market after July 1, 2006 or later depending on market segmentmarket segment
Deployment TimelinesDeployment Timelines––Consumer electronics, July 2006Consumer electronics, July 2006
––Sever and Telecom infrastructure exemption to be Sever and Telecom infrastructure exemption to be reviewed by EU in 2008reviewed by EU in 2008

6Vasu Intel Corporation
Position StatementPosition Statement
Intel recognizes the magnitude and technical complexity involved with converting the world’s board assembly industry from Pb/Sn to LF solders
Intel has completed a major milestone in driving the LF technology across the industry by closely working with our customers and the supply chain to achieve a successful LF transition in worldwide electronics markets
Intel has done extensive reliability testing on LF solder and processes for board assembly
Intel believes its LF products and reference processes to be low risk

7Vasu Intel Corporation
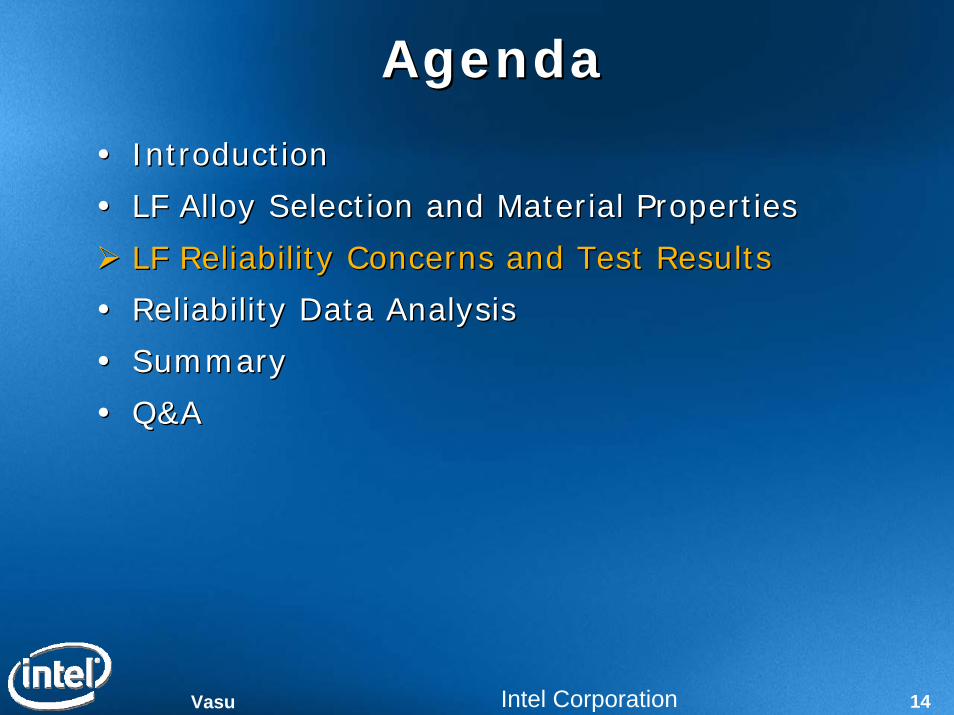
AgendaAgenda
IntroductionIntroduction
LF Alloy Selection and Material PropertiesLF Alloy Selection and Material Properties
LF Reliability Concerns and Test ResultsLF Reliability Concerns and Test Results
Reliability Data AnalysisReliability Data Analysis
SummarySummary
Q&AQ&A

8Vasu Intel Corporation
SynopsisSynopsisWhat we know about PbWhat we know about Pb--free solder jointfree solder joint……
––Solidification characteristics and microstructureSolidification characteristics and microstructure
––Mechanical properties Mechanical properties
––Impact of material properties on solder joint Impact of material properties on solder joint reliabilityreliability
Improved fatigue performance vs. PbSnImproved fatigue performance vs. PbSn
–– Longer fatigue life and better solder joint reliabilityLonger fatigue life and better solder joint reliabilityReduced shock performance vs. PbSn, Reduced shock performance vs. PbSn, but passed board but passed board level shock & Vibe test conditions level shock & Vibe test conditions
––Solder joint fatigue can be modulated by Solder joint fatigue can be modulated by Enabling configuration (e.g. w/ vs. w/o heat sink solution)Enabling configuration (e.g. w/ vs. w/o heat sink solution)
Board design (e.g. pad size & type)Board design (e.g. pad size & type)
Test methods (e.g. dwell time, temp range)Test methods (e.g. dwell time, temp range)
LF (SAC405) showed improved solder fatigue margin

9Vasu Intel Corporation
SAC TerminologySAC TerminologySAC stands for Sn-Ag-Cu solderComposition is sometimes written as SACxyz–Where
x.y = Silver (Ag) content in solder by weight0.z = Copper (Cu) content in solder by weight
100-x.y-0.z = Tin (Sn) Content
Examples:SAC305 = 96.5%^ Sn / 3.0%^ Ag / 0.5%^ Cu (JIETA)SAC405 = 95.5%^ Sn / 4.0%^ Ag / 0.5^% Cu (Intel)
^ Percentages by weight

10Vasu Intel Corporation
PbPb--free Solder (Snfree Solder (Sn--AgAg--Cu ) SAC alloyCu ) SAC alloy
Pb-free SAC alloys range from 1% to 5 % Ag
Different SAC alloys have different material properties
and microstructure, so variations in performance are
expected
SAC405 & SAC305 are similar enough they can be used
together (i.e., SAC405 solder balls with SAC305 paste)
SAC105
Best Practices: SAC305 - SAC405 for most applications SAC105 – Handheld Equipment
Phase Diagram Source: K-W Moon et al, J. Electronic Materials, 29 (2000) 1122-1236
SAC205
SAC305
SAC405

11Vasu Intel Corporation
The effect of Ag Content on LF Reliability
% Ag content in SAC alloy
Better Shock performanceVolu
me
Frac
tion
of P
hase
s
% of Compliant Primary Sn phase
% of Ag3Sn IMC
Better Temp Cycle performance
Increase in Ag content helps solder fatigue performance
SAC 305
SAC405
Literature Reference: P. Snugovsky et al : “Failure mechanism of SAC 305 and SAC405 in harsh environments and influence of board defects including black pad”SMTA 2007
SAC305-SAC405 alloy showed better long term reliability in temp cycle test (iNEMI Recommendation)
% F
ailu
res
Cycles to Failure
Larger Better

12Vasu Intel Corporation
SiliconPackage
PCB
MicrostructureMicrostructure
Pb-free & PbSn interfacial intermetallics similarBulk solder microstructure different Performance difference to stem from bulk properties
Ni
(Ni,Cu)6Sn5Ni3Sn5
Ni
PbSn
PbSn
Cu6Sn5
Cu
Ag3Sn Particles
Ag3SnPlatelet
Cu
Cu6Sn5
PbSn SAC405

13Vasu Intel Corporation
Typical Properties: PbSn vs. SnAgCuTypical Properties: PbSn vs. SnAgCu
PropertyProperty PbSnPbSn SnAgCuSnAgCu SAC AlloySAC Alloy
Melting PointMelting Point 183 C183 C 217 217 –– 219 C219 C SAC405SAC405
YoungYoung’’s Moduluss Modulus 35 GPa35 GPa 53 GPa53 GPa SAC405SAC405
Tensile Strength Tensile Strength (20C (20C at 0.004sat 0.004s--11))
40 40 N/mmN/mm22
48 N/mm48 N/mm22 SAC387SAC387
Joint Shear Strength Joint Shear Strength (20C at 0.1mm/min)(20C at 0.1mm/min)
23 23 N/mmN/mm22
27 N/mm27 N/mm22 SAC387SAC387
Creep Strength Creep Strength (100C (100C at 0.1mm/min)at 0.1mm/min)
1.0 1.0 N/mmN/mm22
5.0 N/mm5.0 N/mm22 SAC387SAC387
SAC405 is stiffer and stronger than PbSnConsequences of properties:
Improved fatigue performanceReduced shock performance
Com
piled from m
ultiple sources
14Vasu Intel Corporation
AgendaAgenda
IntroductionIntroduction
LF Alloy Selection and Material PropertiesLF Alloy Selection and Material Properties
LF Reliability Concerns and Test ResultsLF Reliability Concerns and Test Results
Reliability Data AnalysisReliability Data Analysis
SummarySummary
Q&AQ&A

15Vasu Intel Corporation
LF Reliability ConcernsLF Reliability Concerns
LF Failures Concern
Stress Test
Comments
Solder fatigue
Overstressing
Overstressing
PCB trace, via corrosion
Temp Cycle
IMC growth, Diffusion & Solder creep
Shock Test
Electrical open/solder crack
Electrical open/solder crack
Electrical open/solder crack
Electrical open due to via, trace corrosion
Vib Test
Temp/Humid85/85°C
Electrical open IMC growth, diffusion, & shorts due to solder creep
Bake Test
LF solder joint reliability requirement established based on expected failure mechanism

16Vasu Intel Corporation
Transient Bend: PbSn vs. PbTransient Bend: PbSn vs. Pb--free SJfree SJ1.1. Lead free is stiffer than PbSnLead free is stiffer than PbSn
2.2. Pad adhesion strength is Pad adhesion strength is equivalent for Pbequivalent for Pb--free and PbSnfree and PbSn
3.3. Board bending pulls apart the Board bending pulls apart the opposite surfaces of the solder opposite surfaces of the solder ballball
4.4. Stiffer PbStiffer Pb--free ball generates free ball generates higher forces on the pad. The higher forces on the pad. The softer PbSn ball deforms to softer PbSn ball deforms to accommodate bending, accommodate bending, resulting in lower forces acting resulting in lower forces acting on the padon the pad
5.5. PbPb--free ball reaches the critical free ball reaches the critical level of force required to pull level of force required to pull the pad out at lower strain. the pad out at lower strain. This is a consequence of the ball This is a consequence of the ball material property, not the pad material property, not the pad propertyproperty
3
1
2
3
1
2
PCB micro-strainsTens
ile fo
rce
on p
ad
PbSn
LF
PbSn limitLF limit
Pad load bearing capabilityremainsconstant
4
5
LF PbSn
Pb-free PbSn
Pb-free stiffness reduces transient bend performance, but ICT fixtures redesigned to accommodate the need

17Vasu Intel Corporation
CTF @ Row 3
Shock Test Performance Comparison Shock Test Performance Comparison Between Sn/Pb vs. LF 2LIBetween Sn/Pb vs. LF 2LI
Stiffer LF solder joint reduced shock toleranceHowever, passed intensive baseline S&V testing
LF
LF
LF
4000ue
2700ue
1900ue
Corner
Board Strain
000050Sn/Pb00020100
10010010010010000075100Sn/Pb00401001000005050Sn/Pb
54321
CTFNon CTFCrack (%)RowSolder
LF
LF
LF
4000ue
2700ue
1900ue
Corner
Board Strain
000050Sn/Pb00020100
10010010010010000075100Sn/Pb00401001000005050Sn/Pb
54321
CTFNon CTFCrack (%)RowSolder
1
2
3
Shock Level
FEA Model
Design recommendation to include corner sacrificial (NCTF) balls for BGA packages12345

18Vasu Intel Corporation
Factors Affecting Solder FatigueFactors Affecting Solder FatigueComponent to board CTE mismatchComponent to board CTE mismatchComponent type: BGA vs. SocketComponent type: BGA vs. SocketPad size (component and board)Pad size (component and board)Pad size ratioPad size ratioMetallurgy (PbSn vs. SAC405)Metallurgy (PbSn vs. SAC405)Component die size ( Range : 8 mm to 12 mm)Component die size ( Range : 8 mm to 12 mm)Body size (package size ranging from 14 to 42.5 mm sq)Body size (package size ranging from 14 to 42.5 mm sq)Body (package) thickness/stiffnessBody (package) thickness/stiffnessBall Array designBall Array designPCB Board thickness/stiffnessPCB Board thickness/stiffnessJoint shapeJoint shapeLoad on Solder jointLoad on Solder jointBend modeBend modeSurface finish compatibilitySurface finish compatibility

19Vasu Intel Corporation
1 mm LF FCBGA Temp Cycle Test Vehicle Details1 mm LF FCBGA Temp Cycle Test Vehicle Details
Test Vehicle (15 components per board)Test Vehicle (15 components per board)
–– 1 mm FCBGA on 0.062 inch thick board1 mm FCBGA on 0.062 inch thick board (no load)(no load)
1 mm pitch FCBGA packages with no heat sinks1 mm pitch FCBGA packages with no heat sinks–– Package Size : 37.5 mm SqPackage Size : 37.5 mm Sq–– Ball pattern: Full array and DepopBall pattern: Full array and Depop–– Die Size: 11.7 X 8.0 mmDie Size: 11.7 X 8.0 mm
Sample size for each leg: 45 units (3 boards) Sample size for each leg: 45 units (3 boards)
PCB Pad parametersPCB Pad parameters–– Pad Type: Mixed (MD & SMD) Pad Type: Mixed (MD & SMD)
PCB parameterPCB parameter–– Im/Ag surface finish, 18 mil PCB pad,& one PCB Supplier Im/Ag surface finish, 18 mil PCB pad,& one PCB Supplier
Nominal reflow condition ( SMT + wave)Nominal reflow condition ( SMT + wave)
Control Leg (Sn/Pb solder with HASL SF)Control Leg (Sn/Pb solder with HASL SF)–– Sample size : 45 units (3 boards)Sample size : 45 units (3 boards)

20Vasu Intel Corporation
1 mm FCBGA Temp Cycle Test Vehicle1 mm FCBGA Temp Cycle Test Vehicle

21Vasu Intel Corporation
Start
Perc
ent
2500225020001750150012501000
99
95
90
80
7060504030
20
10
5
1
Table of Statistics
118.1687.10703 0.0937068 2.8976.97849 0.0937068 1.110
Loc Scale A D*7.54120 0.0937068 3.6577.34854 0.0937068
Var
Pb-15minPb-30min
LF-15minLF-30min
Probability Plot for Start
Arbitrary Censoring - ML EstimatesLognormal
30 15min
30 15 min
The Effect of Temp Cycle dwell Time on The Effect of Temp Cycle dwell Time on Temp Cycle Performance (Temp Cycle Performance ( -40 to +85 C)
Increased dwell reduced cycles to failurePb-free better than PbSn for 15 and 30 min dwell
LFPb
% F
ailu
res
Failure Criteria: E-test open
Largeris
Better
Package Size: 37.5 mm sqDie size: 11.7 X 8 mm, 4 Layer
Normalized Life

22Vasu Intel Corporation
Dwell Time ConcernsDwell Time Concerns
Stress Relaxation
Time
Stre
ss
Pb Free
PbSn
?
Historical dwell time
Does SAC405 cross-over Sn/Pb?
Does SAC405 show poor performance in extended dwell time (use condition) compared to Sn/Pb solder even though better performance seen in short time test?
FatigueLife
23Vasu Intel Corporation
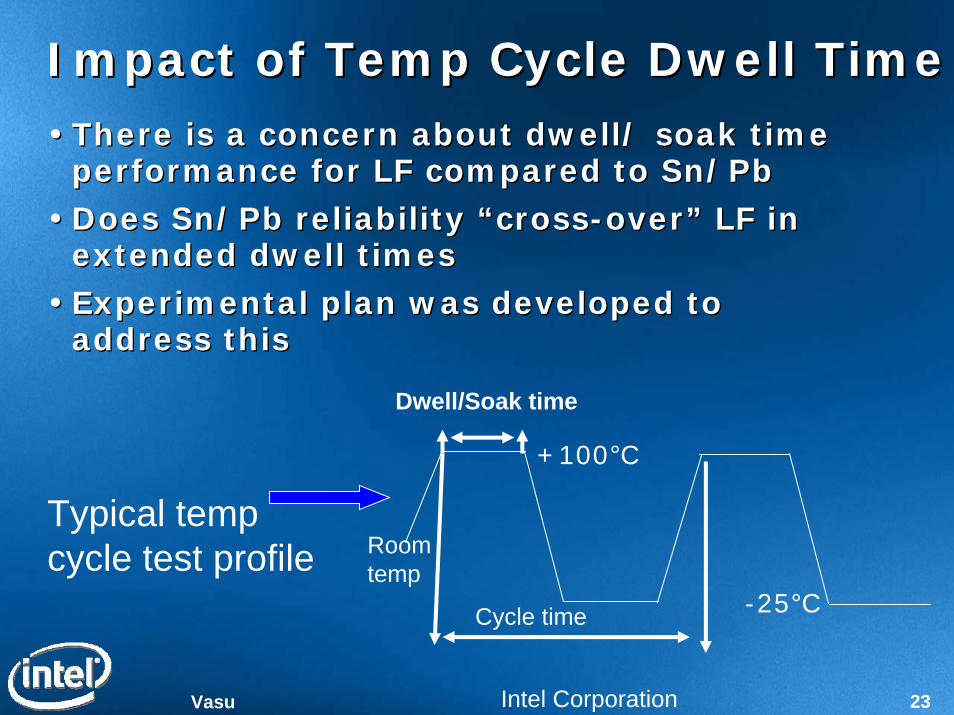
Impact of Temp Cycle Dwell TimeImpact of Temp Cycle Dwell TimeThere is a concern about dwell/ soak time There is a concern about dwell/ soak time performance for LF compared to Sn/Pbperformance for LF compared to Sn/Pb
Does Sn/Pb reliability Does Sn/Pb reliability ““crosscross--overover”” LF in LF in extended dwell timesextended dwell times
Experimental plan was developed to Experimental plan was developed to address this address this
Room temp
+100°C
-25°C
Dwell/Soak time
Cycle time
Typical temp cycle test profile

24Vasu Intel Corporation
Dwell Time Impact StudyDwell Time Impact StudyPurpose: To assess fatigue risk to LF products utilizing Purpose: To assess fatigue risk to LF products utilizing two different sockets and FCBGA packagestwo different sockets and FCBGA packagesExperimental DescriptionExperimental Description
––VehiclesVehiclesDesktop Test Vehicle board (TV1)Desktop Test Vehicle board (TV1)
–– Sn/Pb and LFSn/Pb and LF–– Fully enabledFully enabled
DualDual--proc server test vehicle board (TV2)proc server test vehicle board (TV2)–– Sn/Pb and LFSn/Pb and LF–– Fully enabledFully enabled
––Thermal CyclingThermal Cycling--2525°°C to 100C to 100°°CC1, 4, and 8 hr cycle times1, 4, and 8 hr cycle timesIn situIn situ electrical continuity monitoringelectrical continuity monitoring
Hypothesis: SAC405 Hypothesis: SAC405 ≥≥ PbSnPbSn
TV1

25Vasu Intel Corporation
Description of Test VehiclesDescription of Test Vehicles
LP MTB with load fixture
Server motherboard (TV2) with LGA sockets and 1.0 mm pitch FCBGA
Motherboard (TV1) with LGA socket and 0.8 mm pitch FCBGA
Thermal solution Assembly

26Vasu Intel Corporation
Temp Cycle ProfilesTemp Cycle Profiles
Room temp
+100°C
-25°C
Cycle Cycle TimeTime
Cycle Cycle TimeTime
Ramp Ramp TimeTime
11--hourhour 60min60min 8min8min
44--hourhour 240min240min 31min31min
88--hourhour 480min480min 31min31min
•Temperature range: -25°C to 100°C

27Vasu Intel Corporation
Dwell Time Study TimelineDwell Time Study Timeline
Intel/3rd PartyDOE Proposal
DOE Plan / TV Build
240/480 minute TV1
Q2, 05 Q3,05 Q4,05 Q1, 06 Q2,06 Q3,06 Q4,06 Q1,07480 minute TV2
240 minute TV2
90 minute TV2
60 TV1 60 TV1

28Vasu Intel Corporation
PbSn vs. PbPbSn vs. Pb--free 1.0mm FCBGAfree 1.0mm FCBGA--15 to 12515 to 125°°C, 90 min dwellC, 90 min dwell
At 90 min dwell Pb-free performed better than PbSn
Pb-free
PbSn
% F
ailu
res Failure Criteria:
E-test open
Largeris
Better
Package Size: 37.5 mm sqDie size: 11.7 X8 mm, 4 Layer
Normalized Life
Vasudevan etal “Solder fatigue creep performance of LF (SAC) solder”, ECTC 2007

29Vasu Intel Corporation
LF (SAC405) solder showed improved fatigue performance and no early LF failures observed in all legs of the DOE
Results for Dwell Time Effect Study ^Results for Dwell Time Effect Study ^
^
Test Vehicle
Cycle Time
Solder Alloy
# of Cycles Completed
socket FCBGAPb 2480 5/10 fails 0/7 Fail
LF 2480 1/10 Fails 0/7 fail
Pb 2407 2/9 1/9LF 2407 1/9 0/9Pb 1121 0/8 0/8LF 1121 0/8 0/8Pb 846 8/16 0/8LF 846 5/16 0/8Pb 1044 0/8 0/4LF 1044 0/10 0/5Pb 925 9/10 1/5LF 925 4/10 0/58 hr
TV Design 1
1 hr
4 hr
8 hr
TV Design 2
1.5 hr
E-test Cumulative Solder Joint Fails
4 hr
Long Dwell Time Temp Cycle Results
Vasudevan etal “Solder fatigue creep performance of LF (SAC) solder”, ECTC 2007

30Vasu Intel Corporation
Socket Socket ““YY”” Temp Cycle Results Temp Cycle Results ((--2525°°C to 100C to 100°°C 1 hr cycle time)C 1 hr cycle time)
Start
Perc
ent
600050004000300020001500
99
95
90
80
7060504030
20
10
5
1
8.06939 0.254316 26.5967.65566 0.254316 1.274
Loc Scale A D*Table of Statistics
LFPb
Alloy
Probability Plot for Start
Arbitrary Censoring - ML EstimatesLognormal
Pb-free solder showed better solder fatigue performance compared to PbSn
% F
ailu
res
Normalized Life
Failure Criteria: E-test open
Larger Better
Socket Size: 37.5 mm sq
PCB pad size: 20 mm
Vasudevan etal “Solder fatigue creep performance of LF (SAC) solder”, ECTC 2007

31Vasu Intel Corporation
Socket X 480 Minute Temp Cycle ResultsSocket X 480 Minute Temp Cycle Results
Start
Perc
ent
3000
2000
1500
100090
080
070
060
050
040
030
0
99
95
90
80
7060504030
20
10
5
1
7.02075 0.375320 41.8896.52926 0.375320 2.227
Loc Scale A D*Table of S tatistics
LFPb
A lloy
Probability Plot for Start
Arbitrary Censoring - ML EstimatesLognormal
-25 to + 100°C
LF (SAC405) solder showed improved fatigue performance at 8 hrs cycle timeNo reliability issues observed with LF fatigue creep
PbLF
% F
ailu
res
Failure Criteria: E-test open
Largeris
Better
Socket Size: 37.5 mm sq
PCB pad size: 20 mm
Normalized Life
Vasudevan etal “Solder fatigue creep performance of LF (SAC) solder”, ECTC 2007

32Vasu Intel Corporation
Socket Y 480 Minute Cycle Time Socket Y 480 Minute Cycle Time After 1121 CyclesAfter 1121 Cycles
Sn/Pb Sample LF Sample
Max solder crack < 40%
Max solder crack ~75%
LF samples showed smaller solder crack size (worst case) compared to Sn/Pb at extended dwell
Vasudevan etal “Solder fatigue creep performance of LF (SAC) solder”, ECTC 2007

33Vasu Intel Corporation
Socket Y 240 Minute Cycle TimeSocket Y 240 Minute Cycle TimeDye Penetrant Results After 1900 Cycles Dye Penetrant Results After 1900 Cycles
Sn/Pb Sample LF Sample
Max solder crack ~70%
Max solder crack ~90%
LF samples showed smaller solder crack size (worst case) compared to Sn/Pb at extended dwell
34Vasu Intel Corporation
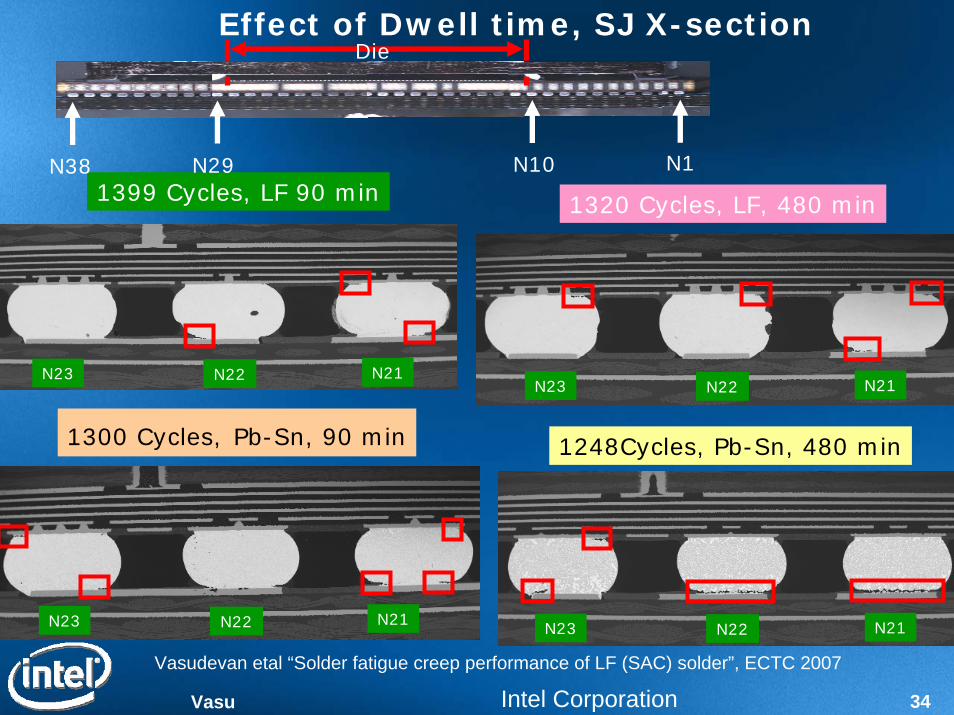
Effect of Dwell time, SJ X-section
1399 Cycles, LF 90 min
N23 N22 N21
1320 Cycles, LF, 480 min
N23 N22 N21
N23 N22 N21
1300 Cycles, Pb-Sn, 90 min
N23 N22 N21
1248Cycles, Pb-Sn, 480 min
N38 N1
Die
N29 N10
Vasudevan etal “Solder fatigue creep performance of LF (SAC) solder”, ECTC 2007

35Vasu Intel Corporation
FCBGA Temp cycle results ( 0 to +100 FCBGA Temp cycle results ( 0 to +100 oo C) C)
MetallurgyMetallurgy Characteristic Characteristic LifeLife BetaBeta
EutecticEutectic 61536153 10.610.6
PbPb--FreeFree 86968696 10.110.1
1000.00 100000.0010000.001.00
5.00
10.00
50.00
90.00
99.00
Probability - Weibull
Time, (t)
Unr
elia
bilit
y, F
(t)
Weibull42.5mm IHS (Eu) ED
W2 RRX - SRM MEDF=32 / S=0
β1=10.8560, η1=6152.6881, ρ=0.9474
42.5mm IHS (LF) ED
W2 RRX - SRM MEDF=30 / S=2
β2=10.1072, η2=8696.2408, ρ=0.9908
42.5mm-1752 FCBGA
1000.00 100000.0010000.001.00
5.00
10.00
50.00
90.00
99.00
Probability - Weibull
Time, (t)
Unr
elia
bilit
y, F
(t)
Weibull15mm Eu ED
W2 RRX - SRM MEDF=28 / S=4
β1=14.2008, η1=7649.0974, ρ=0.9844
15mm LF ED
W2 RRX - SRM MEDF=32 / S=0
β2=12.0757, η2=1.0273Ε+4, ρ=0.8287
MetallurgyMetallurgy Characteristic Characteristic LifeLife BetaBeta
EutecticEutectic 76497649 14.214.2
PbPb--FreeFree 1027310273 12.112.1
15mm-196 FCBGA

36Vasu Intel Corporation
AgendaAgenda
IntroductionIntroduction
LF Alloy Selection and Material PropertiesLF Alloy Selection and Material Properties
LF Reliability Concerns and Test ResultsLF Reliability Concerns and Test Results
Reliability Data AnalysisReliability Data Analysis
SummarySummary
Q&AQ&A

37Vasu Intel Corporation
Effect of Temperature on Solder FatigueEffect of Temperature on Solder Fatigue
Source:
Yan Qi a, Rex Lam a, Hamid R.
Ghorbani a, Polina Snugovsky b, Jan
K. Spelt a, .
Microelectronics Reliability 46
(2006) 574–588
Pb-free performed better in normal temp cycle testing which is typical of use condition, but performed worse in extreme test condition unrealistic for telecom central offices & data centers
Unrealistic stress condition
Larger Better

38Vasu Intel Corporation
Ceramic LCC Solder fatigue Results (*)Ceramic LCC Solder fatigue Results (*)
Temp Cycle: 0 to 100°C Temp Cycle: 25 to 125°C
* Reference: Michael Osterman Æ Abhijit Dasgupta “Life expectancies of Pb-free SAC solder interconnects in electronic hardware” “ J Mater Sci: Mater Electron (2007) 18:229–236
In head-to-head tests:Pb-free performed better than SnPb with Tmax up to 100°CSnPb performed better than Pb-free with Tmax over 120°C

39Vasu Intel Corporation
0
15
30
-60 -20 20 60 100 140Temp in °C
Ram
p ra
te (°
C/m
in)
~120°C
Recommended LF temp cycle test range ( LF better than Sn/Pb)
Typical use conditionStorage
Region
Mixed Reliability Results
Mixed or Poor Reliability Results for LF Compared to Sn/Pb
Thermal Shock Region ( > 15°C ramp & Delta T > 125°C
LF Temp Cycle Data Analysis
* J. Barleto etal Ceramic BGA * M. Osterman etal Ceramic LCC
**Y, Qi etal
Temp Cycle Test Recommendation: Tmax <110°C and ramp rate < 15°C/min (IPC spec)

40Vasu Intel Corporation
AgendaAgenda
IntroductionIntroduction
LF Alloy Selection and Material PropertiesLF Alloy Selection and Material Properties
LF Reliability Concerns and Test ResultsLF Reliability Concerns and Test Results
Reliability Data AnalysisReliability Data Analysis
SummarySummary
Q&AQ&A

41Vasu Intel Corporation
Reliability Tests for PbReliability Tests for Pb--free Solder Jointsfree Solder Joints
Stress TestStress Test ReasonReason StatusStatusTemp Cycle at Temp Cycle at --40 to 8540 to 85°°C, C, ΔΔT = 125T = 125°°CC--25 to +10025 to +100°°C, C, ΔΔT = 125T = 125°°CC
Solder fatigueSolder fatigue Completed/ Completed/ PassedPassed
Bake 150Bake 150°°C for C for 1000 hrs1000 hrs
Diffusion and IMC Diffusion and IMC growthgrowth
Completed/ Completed/ PassedPassed
Temp/Humidity Temp/Humidity (85(85°°C/85% RH) unbiasedC/85% RH) unbiased
For 1000 hrsFor 1000 hrs
Corrosion for Corrosion for Trace and viaTrace and via
Completed/ Completed/ PassedPassed
Board Level Shock Board Level Shock (50 g) & Vibration (50 g) & Vibration (3.13 g Rms) (3.13 g Rms)
Shipping and Shipping and handlinghandling
Completed/ Completed/ PassedPassed
Pb-free solder passed the established baseline reliability testing
42Vasu Intel Corporation
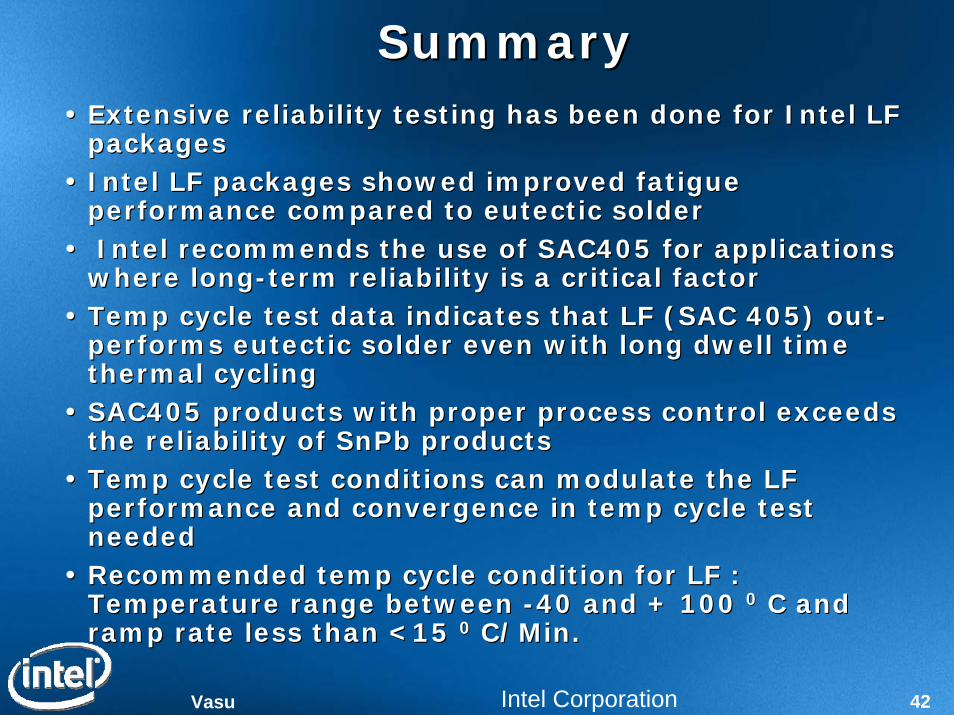
SummarySummaryExtensive reliability testing has been done for Intel LF Extensive reliability testing has been done for Intel LF packagespackagesIntel LF packages showed improved fatigue Intel LF packages showed improved fatigue performance compared to eutectic solderperformance compared to eutectic solderIntel recommends the use of SAC405 for applications Intel recommends the use of SAC405 for applications
where longwhere long--term reliability is a critical factorterm reliability is a critical factorTemp cycle test data indicates that LF (SAC 405) outTemp cycle test data indicates that LF (SAC 405) out--performs eutectic solder even with long dwell time performs eutectic solder even with long dwell time thermal cyclingthermal cyclingSAC405 products with proper process control exceeds SAC405 products with proper process control exceeds the reliability of SnPb productsthe reliability of SnPb productsTemp cycle test conditions can modulate the LF Temp cycle test conditions can modulate the LF performance and convergence in temp cycle test performance and convergence in temp cycle test neededneededRecommended temp cycle condition for LF : Recommended temp cycle condition for LF : Temperature range between Temperature range between --40 and + 100 40 and + 100 00 C and C and ramp rate less than <15 ramp rate less than <15 00 C/Min.C/Min.

43Vasu Intel Corporation
Q & AQ & A