Analytic Properties of Statistical Total Correlation ... · Analytic Properties of Statistical...
30
Couto Alves et al. Properties of STOCSY for Metabolite Characterization 19/12/08 1 Analytic Properties of Statistical Total Correlation Spectroscopy (STOCSY) Based Information Recovery in 1 H NMR Metabolic Data Sets Alexessander Couto Alves, Mattias Rantalainen, Elaine Holmes, Jeremy K. Nicholson* and Timothy M. D. Ebbels* Department of Biomolecular Medicine, Division of Surgery, Oncology, Reproductive Biology and Anaesthetics, Faculty of Medicine, Imperial College London, Sir Alexander Fleming Building, South Kensington, London SW7 2AZ, UK. *To whom correspondence should be addressed. Running head: Analytic Properties of STOCSY for Metabolic Data Page 1 of 30 ACS Paragon Plus Environment Submitted to Analytical Chemistry 1 2 3 4 5 6 7 8 9 10 11 12 13 14 15 16 17 18 19 20 21 22 23 24 25 26 27 28 29 30 31 32 33 34 35 36 37 38 39 40 41 42 43 44 45 46 47 48 49 50 51 52 53 54 55 56 57 58 59 60
Transcript of Analytic Properties of Statistical Total Correlation ... · Analytic Properties of Statistical...

Couto Alves et al. Properties of STOCSY for Metabolite Characterization 19/12/08
1
Analytic Properties of Statistical Total Correlation Spectroscopy
(STOCSY) Based Information Recovery in 1H NMR Metabolic
Data Sets
Alexessander Couto Alves, Mattias Rantalainen, Elaine Holmes,
Jeremy K. Nicholson* and Timothy M. D. Ebbels*
Department of Biomolecular Medicine, Division of Surgery, Oncology, Reproductive Biology and
Anaesthetics, Faculty of Medicine, Imperial College London, Sir Alexander Fleming Building,
South Kensington, London SW7 2AZ, UK.
*To whom correspondence should be addressed.
Running head: Analytic Properties of STOCSY for Metabolic Data
Page 1 of 30
ACS Paragon Plus Environment
Submitted to Analytical Chemistry
123456789101112131415161718192021222324252627282930313233343536373839404142434445464748495051525354555657585960
Couto Alves et al. Properties of STOCSY for Metabolite Characterization 19/12/08
2
Abstract
Structural assignment of resonances is an important problem in NMR spectroscopy and
Statistical Total Correlation Spectroscopy (STOCSY) is a useful tool aiding this process for
small molecules in complex mixture analysis and metabolic profiling studies. STOCSY
delivers intramolecular information (delineating structural connectivity) and in metabolism
studies can generate information on pathway related correlations. To understand further the
behavior of STOCSY for structural assignment, we analyze the statistical distribution of
structural and non-structural correlations from 1050 1H NMR spectra of normal rat urine
samples. We find that the distributions of structural/non-structural correlations are
significantly different (p<10-112
). From the area under the curve of the receiver operating
characteristic (ROC AUC) we show that structural correlations exceed non-structural
correlations with probability AUC=0.98. Through a bootstrap resampling approach, we
demonstrate that sample size has a surprisingly small effect (e.g. AUC=0.97 for a sample size
of 50). We identify specific signatures in the correlation maps resulting from small matrix-
derived variations in peak positions but find that their effect on discrimination of structural
and non-structural correlations is negligible for most metabolites. A correlation threshold of
r>0.89 is required to assign two peaks to the same metabolite with high probability (positive
predictive value, PPV=0.9), while sensitivity and specificity are equal at 93% for r=0.22. To
assess the wider applicability of our results, we analyze 1H NMR spectra of urine from rats
treated with 115 model toxins or physiological stressors. Across the data sets, we find that the
thresholds required to obtain PPV=0.9 are not significantly different and the degree of overlap
between the structural and nonstructural distributions is always small (median AUC=0.97).
The STOCSY method is effective for structural characterization under diverse biological
conditions and sample sizes provided the degree of correlation resulting from non-structural
associations (e.g. from non-stationary processes) is small. This study validates the use of the
STOCSY approach in the routine assignment of signals in NMR metabolic profiling studies
and provides practical benchmarks against which researchers can interpret the results of a
STOCSY analysis.
Page 2 of 30
ACS Paragon Plus Environment
Submitted to Analytical Chemistry
123456789101112131415161718192021222324252627282930313233343536373839404142434445464748495051525354555657585960

Couto Alves et al. Properties of STOCSY for Metabolite Characterization 19/12/08
3
1 Introduction
In any complex mixture analysis and especially in metabolic studies the correct structural
assignment of spectroscopic signals is paramount. While databases of known metabolites are
becoming more common for NMR and mass spectrometry, the high degree of signal overlap
seen in complex metabolic NMR spectra1 often precludes direct database matching even at
high field strengths. More importantly, in many cases the available databases do not contain
the molecule of interest, requiring de novo structural characterization. In biomarker discovery,
this activity can be time and labor intensive, involving multiple analytical techniques and
technologies. Statistical methods can be of great help in this regard by identifying groups of
linked signals which may correspond to the same metabolite2. In NMR metabolic profiling,
Statistical Total Correlation Spectroscopy3 (STOCSY) has become a key tool for this task,
increasing the structural information obtainable from typical high throughput 1-dimensional
NMR spectra and allowing better targeting of subsequent analytical procedures for structure
elucidation.
In the STOCSY approach, correlation coefficients are calculated between all spectral
intensities across a set of complex mixture spectra. A high statistical correlation between two
chemical shifts implies either that the two signals derive from the same molecule, or that there
is some other factor (e.g. biological or analytical) leading to the relationship. In this paper, we
term the former ‘structural correlations’ and the latter ‘non-structural correlations’. The
STOCSY approach complements conventional structure assignment experiments such as
physical separation and 2-dimensional correlation NMR in that it can exploit both the higher
sensitivity and resolution of 1-dimensional experiments, and is not limited by the physical
distance (number of bonds) between the correlated nuclei. Molecules whose levels are related
by a common biological process may also exhibit high correlations and therefore STOCSY
can also be useful as a tool to follow biological pathways4. It is also possible that correlations
may derive from other sources of variation such as common response to analytical error etc.;
however these sources have not as yet been identified as major contributors to the correlation
profile.
Page 3 of 30
ACS Paragon Plus Environment
Submitted to Analytical Chemistry
123456789101112131415161718192021222324252627282930313233343536373839404142434445464748495051525354555657585960

Couto Alves et al. Properties of STOCSY for Metabolite Characterization 19/12/08
4
There are now numerous applications of STOCSY and closely related covariance techniques
for enhanced information recovery from low dimensional NMR data sets on multiple and
single samples3-13
. The STOCSY approach has been applied to the structural assignment
problem in a variety of NMR metabolic profiling contexts, such as deconvolution of
overlapped chromatographic peaks in LC-NMR7, delineation of drug metabolism in
molecular epidemiology studies5 and separation of different molecular signatures in diffusion
edited spectroscopy6. The technique has been used to correlate signals from different NMR
observed nuclei, termed HET-STOCSY8-10
, allowing cross-assignment of signals between 1H,
31P and
19F spectra, as well as editing of the homonuclear STOCSY according to
heteronuclear correlations. It is also possible to apply the analysis to cross-platform
comparisons such as the cross-correlation of mass spectrometric and NMR signals, known as
Statistical HeteroSpectroscopy (SHY)14
.
The use of STOCSY for structural characterization relies on the ability to differentiate
structural correlations from non-structural ones. An obvious question in the practical use of
STOCSY for metabolite identification is: considering a positive correlation of a given level,
what is the probability that it represents a true structural association? We would also like to
know whether on average structural correlations are greater than non-structural correlations,
to what extent the method depends on the number of samples in the data set and whether the
ability to identify structural correlations changes under different biological conditions. A
further issue is the effect of preprocessing methods, particularly normalization, on the level of
correlation between any two chemical shifts. The answer to these questions depends on the
statistical distributions of structural and non-structural correlations and particularly on their
degree of overlap. To reliably identify structural associations the two distributions must not
be heavily overlapped.
In this paper we present an in-depth study of the statistical properties of the STOCSY
methodology for identification of structural correlations. Our aim is to derive statistically
rigorous correlation thresholds above which putative structural associations may be assigned
with a given degree of confidence. Our strategy is shown schematically in Figure 1. First, a
Page 4 of 30
ACS Paragon Plus Environment
Submitted to Analytical Chemistry
123456789101112131415161718192021222324252627282930313233343536373839404142434445464748495051525354555657585960

Couto Alves et al. Properties of STOCSY for Metabolite Characterization 19/12/08
5
set of structural correlations are identified manually, verified and compared to all other
correlations, using a large set of 1H NMR metabolic profiles of normal rat urine collected as
part of the Consortium on Metabonomic Toxicology (COMET)15, 16
. We employ a strict set of
criteria to select a set of ‘target’ metabolites that we expect to be representative of the full
metabolome and use these to estimate the distribution of structural correlations. We examine
two different methods for defining the set of intensity variables representing each metabolite
and investigate the effect of two common normalization methods. Through a bootstrap
resampling approach, we study the impact of our particular choice of metabolites and sample
size on the discrimination between structural and non-structural correlations. Finally we apply
the analysis to 1H NMR urinary metabolic profiles from rats subject to a wide variety of
physiological or toxicological stresses to examine the effect of different biological conditions
on the correlation distributions. The main result of our analysis is a set of correlation
thresholds and associated probabilities which may be used by STOCSY practitioners to help
determine the likelihood of a structural association between any two unknown resonances. In
the Discussion, we give explicit practical advice on how the derived thresholds and
probabilities may be used in a step-by-step procedure for peak assignment based on
STOCSY. Overall, this study indicates that STOCSY is a robust and practical tool for
structure elucidation in metabolic profiling studies and provides practical benchmarks against
which researchers can evaluate their results.
Page 5 of 30
ACS Paragon Plus Environment
Submitted to Analytical Chemistry
123456789101112131415161718192021222324252627282930313233343536373839404142434445464748495051525354555657585960

Couto Alves et al. Properties of STOCSY for Metabolite Characterization 19/12/08
6
Methods
Animal studies, NMR spectroscopy and preprocessing
Urine samples were collected from male Sprague-Dawley rats exposed to a toxicological or
physiological intervention and corresponding control groups. Samples were collected at !16 h
and 0 h (pre-treatment), and 8 h, 24 h, 48 h, 72 h, 96 h, 120 h, 144 h and 168 h (7 days) post-
treatment. In this paper, we analyze 5 subsets of the full COMET database (numbers of
spectra after outlier removal given in parentheses): 1) controls at 48h (n=1050), 2) caloric
restriction (50% of normal intake) at 48h -168h (9 animals, n=34), 3) ammonium chloride
treatment (0.28M in drinking water) at 48h - 96h (10 animals, n=50), 4) hydrazine treatment
(90mg/kg) at 48h (n=39), and 5) a collection of 115 treatments (including the data in 2,3, and
4) at 48h (n=1113). Chronic administration of ammonium chloride induces renal acidosis,
while acute hydrazine dosing induces hepato-, nephro- and neurotoxicity. The above subsets
were chosen to represent a range of group sizes from a wide variety of normal and
pathophysiological conditions.
Urine samples were prepared as described elsewhere16
by addition of phosphate buffer,
sodium azide preservative and TSP internal reference. 1H NMR spectra were acquired at 600
MHz with suppression of the water resonance using a standard pre-saturation pulse sequence
(90º-3µs-90º-100ms--90º-acquire). Sixty-four transients were collected into 64 K data points
using a spectral width of 20 ppm. An exponential line-broadening filter (1 Hz) was applied to
the FIDs and the resulting spectra Fourier transformed using XWinNMR (Bruker Biospin,
Karlsruhe, Germany) and phased, baseline corrected and referenced automatically using an
in-house routine written in MATLAB (version 7.4, The MathWorks, Natick, Massachusetts).
MATLAB was used for all subsequent procedures. For statistical analysis, the signal in the
chemical shift ranges !0.20-4.50 and !6.2-10.0 ppm were used. All NMR spectra were
normalized using two techniques: (i) constant sum normalization and (ii) probabilistic
quotient normalization17
.
Page 6 of 30
ACS Paragon Plus Environment
Submitted to Analytical Chemistry
123456789101112131415161718192021222324252627282930313233343536373839404142434445464748495051525354555657585960

Couto Alves et al. Properties of STOCSY for Metabolite Characterization 19/12/08
7
Target metabolites and metabolite representation
In order to select target metabolites exhibiting structural correlations and representative of the
diversity found in NMR biofluid spectra, the following criteria were employed: (i) coverage
of diverse biological pathways, (ii) different peak amplitudes, (iii) different levels of
positional variation, (iv) more than one peak per metabolite, and (v) minimal overlap with
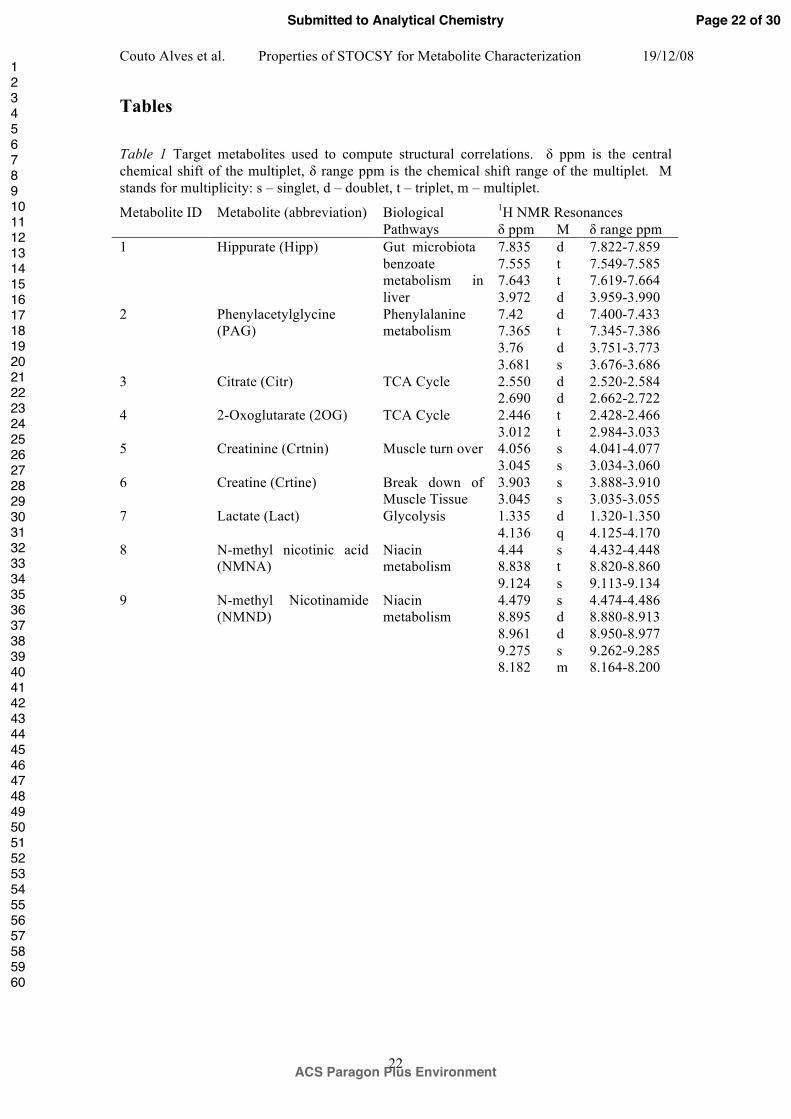
other peaks. The 9 target metabolites satisfying these criteria are presented in Table 1 and
their resonances annotated on a typical control spectrum in Figure S-4.
To compute correlations between peaks of each metabolite in the target set, and since
STOCSY analysis does not involve any peak integration, one must first choose which
intensity variables will represent each metabolite’s peaks. Intuitively one might expect the
maximum of each peak to be most representative measure of its intensity. However, this does
not allow for positional variation of the peak. We therefore tested two alternative
representation methods, ‘resonance maximum’ which used a single variable at the maximum
of each peak, and ‘resonance range’ which used all variables within a specified range
containing the peak. The variables used for both methods were selected by visual inspection
of a large number of spectra and are listed in Table 1. Note that when using the resonance
maximum representation, correlations between the resonance maximum variable and non-
maximum variables of the same metabolite were excluded from the analysis.
Construction of correlation distributions
Our overall methodology is depicted in Figure 1. First, spectral intensity variables
corresponding to the target metabolites are extracted (Figure 1A), followed by computation of
the Pearson correlation matrix (Figure 1B), allowing performance statistics to be calculated
(Figure 1C). The correlation matrix computed from all spectral variables is depicted in Figure
1B. The rows/columns of the matrix are sorted such that the spectral variables of the target
metabolites appear at the top/left (in ppm order, lowest at top) and all remaining spectral
signals occupy the remaining rows/columns. The symmetric matrix can be decomposed into
four quadrants of three distinct types:
Page 7 of 30
ACS Paragon Plus Environment
Submitted to Analytical Chemistry
123456789101112131415161718192021222324252627282930313233343536373839404142434445464748495051525354555657585960

Couto Alves et al. Properties of STOCSY for Metabolite Characterization 19/12/08
8
(i) The square ‘metabolite correlation matrix’ (top left) has a block diagonal structure
where the diagonal blocks capture the structural correlations for each target metabolite. Off-
diagonal blocks capture the non-structural correlations between target metabolites.
(ii) The rectangular ‘complementary correlation matrix’ (top right and bottom left),
captures correlations between target metabolite variables and remaining spectral signals. It
therefore only contains non-structural correlations.
(iii) The bottom right quadrant is a square matrix capturing correlations between the
spectral signals not corresponding to target metabolites, thus corresponding to both structural
and non-structural correlations. The class of a given element is not known a priori
(‘indeterminate’), and therefore we omit these correlations from the analysis.
The set of structural correlations is shown in Figure 1B as the correlations enclosed by the red
line, composed of the upper triangular part of each diagonal block from the metabolite
correlation matrix. The set of non-structural correlations is shown in Figure 1B as the
correlations lying within the blue line. This region is composed of the complementary
correlation matrix plus the off diagonal blocks of the metabolite correlation matrix.
Performance Statistics and Bootstrap Analysis
We assessed the performance of a simple correlation threshold, ", to classify correlations as
either structural (a positive result) or non-structural (a negative result). The Receiver
Operating Characteristic (ROC) plots the True Positive Rate (TPR) versus False Positive Rate
(FPR) for every threshold level as defined below.
= Sensitivity
= 1 – Specificity
where #P and #N are the total number of structural and non-structural correlations
respectively, #TP and #FP are the number of structural correlations correctly and incorrectly
Page 8 of 30
ACS Paragon Plus Environment
Submitted to Analytical Chemistry
123456789101112131415161718192021222324252627282930313233343536373839404142434445464748495051525354555657585960

Couto Alves et al. Properties of STOCSY for Metabolite Characterization 19/12/08
9
predicted respectively, and TNR stands for True Negative Rate. The Area Under the Curve
(AUC) of the ROC quantifies the degree of separation between class distributions. AUC has
the same value as the Wilcoxon-Mann-Whitney statistic, which here is an estimator of the
probability of a structural correlation being greater than a non–structural correlation ,
i.e. . We also use the Hodges-Lehmann estimator (HL") to quantify the
difference between the sets of structural and non-structural correlations. HL" is equal to the
median of all pair-wise differences between structural and non-structural correlations. Given a
correlation r between two intensity variables being greater than the threshold !, the
probability of correctly assigning the corresponding peaks to the same metabolite is denoted
by the positive predictive value (PPV):
(1).
We note that the commonly used false discovery rate (FDR) is equal to 1-PPV.
We employed a bootstrap analysis to understand the impact of sample size and the choice of
target metabolites on the sensitivity, specificity and PPV (1000 bootstrap samples). To assess
the effect of sample size, for each bootstrap sample, L spectra
( ) were randomly selected with replacement from the full
data set and the correlation analysis applied to the sample. To simulate an alternative set of
target metabolites, the metabolite list was resampled with replacement and the correlation
analysis applied to the corresponding set of variables using all spectra. This means that a
given correlation could be classified as structural for one bootstrap sample (i.e. between
metabolites on the bootstrapped target list) and as part of the indeterminate set for another
sample. By exchanging metabolites between the target set and the remaining spectral regions,
this process simulates the effect of target sets of differing sizes and examines whether our
estimates can be generalized to the wider metabolome.
Page 9 of 30
ACS Paragon Plus Environment
Submitted to Analytical Chemistry
123456789101112131415161718192021222324252627282930313233343536373839404142434445464748495051525354555657585960
Couto Alves et al. Properties of STOCSY for Metabolite Characterization 19/12/08
10
Results
Correlation matrices and the impact of metabolite representation and
normalization methods for the control data
The set of correlations used in the analysis of control spectra is depicted in Figure 2. As
expected, a strong positive correlation signal is observed on the diagonal blocks of the
metabolite correlation matrix (panels A and C) deriving primarily from associations between
signals from the same metabolite; these are the structural correlations. The elements off the
diagonal blocks in panels A and C and all elements in panels B and D (complementary
correlation matrix) correspond to non-structural correlations and exhibit a lower average
degree of correlation. We note that there are a small number of strong positive and negative
non-structural correlations, possibly deriving from analytical or biological sources, but leave
their investigation to another paper. Some diagonal blocks in the metabolite correlation matrix
exhibit low or negative correlations due to peak shifts (see below).
Comparing the two metabolite representation methods (i.e. resonance maximum vs. resonance
range), Figure 2A and C indicate that the diagonal blocks of the metabolite matrix showed
consistently higher average correlations using the resonance maximum than the resonance
range representation. The ROC AUC statistics, which were 0.98 for resonance maximum and
0.77 for resonance range representations, confirmed a much higher discrimination power for
the resonance maximum representation. The poorer discrimination of the resonance range
method can be understood as the effect of a larger proportion of low structural correlations
(see e.g. creatine and creatinine) resulting from inclusion of low signal-to-noise regions and
nearby peaks from non-target metabolites. The off diagonal blocks of the metabolite
correlation matrix exhibited correlations close to zero in both metabolite representations as
expected. Figure 2B and D show a relatively similar set of features and thus do not favor one
particular representation method.
The two representations were further compared using data normalized with the probabilistic
quotient method17
(see supporting information, Figure S-3). No major differences were seen
Page 10 of 30
ACS Paragon Plus Environment
Submitted to Analytical Chemistry
123456789101112131415161718192021222324252627282930313233343536373839404142434445464748495051525354555657585960

Couto Alves et al. Properties of STOCSY for Metabolite Characterization 19/12/08
11
between the two normalization methods, in either of the correlation matrices and for either of
the representation methods. The ROC analysis showed that normalization had little impact on
the class separation (resonance maximum representation, AUC=0.98, range representation,
AUC=0.78). Given the improved discrimination, and ease of interpretation, we employed the
resonance maximum representation and total area normalization in all subsequent analyses.
The distributions of structural and non structural correlations are statistically
distinct
The STOCSY approach to structural assignment assumes that it is possible to statistically
discriminate structural from non-structural correlations. It is clear from Figure 3 that the
distributions are quite different. The non-structural correlation distribution is symmetric and
unimodal with mean -0.002 and standard deviation 0.154, exhibiting highest probability for
correlations near zero and a decaying frequency of higher correlations. However, the
structural correlation distribution is highly negatively skewed, with a large proportion of high
positive values and virtually no negative values. The mean and standard deviation of the
structural correlations were 0.758 and 0.246 respectively. A two-sample Kolmogorov-
Smirnov test rejected the null hypothesis that the two distributions were the same at p=7.3x10-
112. A structural correlation is higher than a non-structural correlation by HL" = 0.78 (2p =
3x10-98
, Mann-Whitney test). Figure 3D shows the ROC curve for the analysis of the two
distributions indicating a very high degree of discrimination. From the ROC, the probability
of a structural correlation being greater than non-structural correlation is estimated to be
AUC=0.98. In the following, we examine the ability of a simple correlation threshold to
discriminate structural from non-structural correlations. Using conventional terminology, we
refer to a structural correlation above the threshold as a true positive (TP) and a non-structural
correlation below the threshold as a true negative (TN).
Impact of peak positional variation and intensity on correlation structure and
STOCSY performance
In complex biological samples, the chemical shift of a given resonance can undergo small
variations due to matrix effects such differences in pH and ionic strength. The impact of this
Page 11 of 30
ACS Paragon Plus Environment
Submitted to Analytical Chemistry
123456789101112131415161718192021222324252627282930313233343536373839404142434445464748495051525354555657585960

Couto Alves et al. Properties of STOCSY for Metabolite Characterization 19/12/08
12
variation on the correlation space of hippurate and citrate is depicted in Figure 4. The
resonances of hippurate do not exhibit high levels of positional variation and their correlation
matrix (Figure 4A) shows very high positive correlations, as expected since only structural
correlations are present. The strongest correlations occur in a checker board pattern of blocks
connecting resonance maxima with other maxima. Strong correlations are also seen in blocks
connecting the troughs between peaks. Conversely for citrate, which is known to exhibit a
high degree of peak positional variation, a significant reduction in the mean correlation level
is observed and a proportion of the structural correlations are negative (Figure 4B). This
variation also introduces strong band-diagonal features into the correlation matrix which are
the characteristic STOCSY signature of peaks with positional variation3. Such features can
easily be reproduced in a simple theoretical model of peak shifts as shown in Figure 4C and
D.
We investigated the dependence of the discrimination on peak positional variation and peak
intensity. No clear relationship between peak positional variation or mean peak intensity and
the number of false positives was observed (see Figure S-1), although some individual
metabolites with high positional variation had low AUC values. Hence, positional variation
can reduce structural correlations, but is unlikely to produce false assignments through
spurious high non-structural correlations.
Impact of sample size on the sampling distribution of the true positives and true
negatives
To characterize the impact of sample size on the STOCSY performance, bootstrap resampling
studies were performed with the control data set. Figure 5 summarizes the change in the TP
and TN rates (or equivalently sensitivity and specificity) with varying numbers of samples.
Figure 5A shows that the bootstrap estimate of the TP rate (TPR*) changes very little with
sample size. Compared to the full sample of L=1050, the change in the TP rate estimate is
very low, even at a sample size of L=10 (maximum change 4% at threshold of 0.9).
Conversely, the mean TN rate (TNR*) changes significantly with sample size (Figure 5B),
widening appreciably when fewer samples are available. This change affects the degree of
Page 12 of 30
ACS Paragon Plus Environment
Submitted to Analytical Chemistry
123456789101112131415161718192021222324252627282930313233343536373839404142434445464748495051525354555657585960
Couto Alves et al. Properties of STOCSY for Metabolite Characterization 19/12/08
13
overlap between structural and nonstructural distributions. For example, AUC increases from
0.93 at L=10 to 0.97 at L=50, the latter value being very close to value of 0.98 observed at
L=1050. Hence, the change in TN rate implies that the main difficulty for STOCSY at small
sample sizes will be due to spurious high non-structural correlations. However, we note that
for thresholds above 0.5, the change in the TN estimates between L=50 and L=1050 is less
than 3%, reflecting the relatively minor impact of sample size at the typical threshold levels
used in practice.
The 95% confidence intervals for the estimation of TP and TN rates are also shown in Figure
5A and B. The confidence intervals for TP are larger than for TN, reflecting the much smaller
set of structural correlations (n=157) than nonstructural correlations (n=685125). The TN
confidence interval is very narrow even for a relatively small sample size of L=50 (maximum
interval ±6% at a threshold of 0.0), while the TP confidence interval is wider (maximum
interval ±12% at a threshold of 0.9). As expected, the confidence intervals decrease with
increasing numbers of samples, confirming the intuitive notion that larger sample sizes
improve the discrimination power of STOCSY.
Effect of choice of target metabolites
Despite the strict selection criteria employed, our estimates of STOCSY performance will be
affected by the particular choice of metabolites on the target list. To study this, we applied
bootstrap resampling to the metabolite list (n=9) for the control data and the resulting
confidence intervals are shown in Figure 5C and D. The confidence intervals for TP are
much larger than for TN, due to the much larger number of non-structural than structural
correlations in the data, and consequent imbalance of #TN and #TP. Comparing with Figure
5A and B for L=1050, it is clear that the confidence intervals are increased when resampling
metabolites as compared to individuals (only significant for TP, Man-Whitney p=0.005).
However, bootstrap estimates are known to be sensitive to small data sets, suggesting that the
much larger confidence intervals for TP are largely an effect of the small number of target
metabolites, and not purely due to a high variance of structural correlations. Figure 5 also
Page 13 of 30
ACS Paragon Plus Environment
Submitted to Analytical Chemistry
123456789101112131415161718192021222324252627282930313233343536373839404142434445464748495051525354555657585960

Couto Alves et al. Properties of STOCSY for Metabolite Characterization 19/12/08
14
shows that the estimated TP and TN rates (TPR* and TNR*) deviate very little from the full
sample estimates. This implies that the main difficulty in generalizing these results to other
metabolites will be due to uncertainty rather than bias of the estimates. Additionally,
assuming the correlation distributions resulting from our target metabolite list can be
generalized to the wider metabolome, it can easily be demonstrated that our estimates of PPV
are conservative (see Supporting Information, Figure S-2).
STOCSY performance under different biological conditions
All the preceding results have been calculated for a set of data from ‘normal’ animals. The
practical utility of this work depends on the extent to which the derived thresholds generalize
to other data sets, derived under different biological conditions. We therefore compared the
performance STOCSY on spectra from animals subject to different treatments (caloric
restriction, metabolic acidosis, acute hydrazine toxicity and a combination of 115 toxic
treatments from the COMET database) resulting in different ‘abnormal’ biological conditions.
As an example, Figure 6 compares the performance on the control and caloric restriction data
sets. The figures are strikingly similar, indicating a good level of generalization of the control
results. The sensitivity is very similar in both data sets, dropping from 100% at a threshold
close to zero, indicating that almost all structural correlations are positive. In both data sets,
the sensitivity and specificity are equal at low correlation thresholds (93% at "=0.21 for
controls, 94% at "=0.40 for caloric restriction) indicating an excellent degree of
discrimination between structural and nonstructural correlations for both data sets. The
thresholds for high levels of PPV also show high similarity (e.g. PPV=0.9 at "=0.89 for
controls and "=0.93 for caloric restriction). The specificity for caloric restriction shows a
wider distribution than for controls, thus requiring higher thresholds to reach equivalent
specificities. This is an effect of the lower number of samples (n=34 for caloric restriction,
n=1050 for controls) as demonstrated in Figure 5B.
The key correlation thresholds and AUC values for all five data sets and are reported in Table
2. A high discrimination power between structural and non-structural correlations was
Page 14 of 30
ACS Paragon Plus Environment
Submitted to Analytical Chemistry
123456789101112131415161718192021222324252627282930313233343536373839404142434445464748495051525354555657585960

Couto Alves et al. Properties of STOCSY for Metabolite Characterization 19/12/08
15
attained across all data sets, as evidenced by the AUC values. The 95% confidence intervals
of the thresholds at which the PPV=0.9 or 1.0 and where specificity=1.0 overlapped for all
pairs of data sets. The latter result indicates that the highest non-structural correlation was of a
similar level under diverse biological conditions.
Discussion and Conclusions
The work presented here supports the application of STOCSY for metabolite structural
identification, as already applied in the literature3, 5, 8-10
. The distributions of structural and
non-structural correlations are highly distinguishable and simple correlation thresholds are
able to achieve a high probability of structural association at reasonable sample sizes. Most
importantly, our results generalize to other data sets describing a wide range of biological
conditions.
Our analysis was based on a set of manually verified structural associations and enabled us to
define correlation thresholds (see Table 2) above which two NMR signals could be
structurally associated with a given probability. Figure 7 illustrates an approach to the
identification of unknown peaks, using these thresholds with 1-d and 2-d STOCSY plots. An
example of the full 2-d STOCSY is given in supporting information, Figure S-5. In 1-d
STOCSY, a ‘driver’ peak is selected and Pearson correlations of all other spectral variables to
the driver peak are superimposed on a plot of the corresponding covariance of each variable
using a color scale similar to that of the 2-d approach. One approach is as follows.
1. Set the threshold to that corresponding to 50% PPV (#=0.76 according to Table 2).
Correlations above this threshold have a 50% chance of being structural. Figure 7A
shows the grid-like pattern of correlations visible in the region !0.9-1.7 for the
control data, suggesting a structural relationship. The chemical shifts are consistent
with those of pentanoic and/or hexanoic acid (!1.65 quintet, !1.4 multiplet and !0.95
triplet). The expected correlation from the triplet at 2.3ppm is not seen due to overlap
with the much stronger signal from 2-OG.
Page 15 of 30
ACS Paragon Plus Environment
Submitted to Analytical Chemistry
123456789101112131415161718192021222324252627282930313233343536373839404142434445464748495051525354555657585960

Couto Alves et al. Properties of STOCSY for Metabolite Characterization 19/12/08
16
2. Using a higher threshold, e.g. 90% PPV (#=0.89) check that any correlations between
the putative metabolite peaks and other regions of the spectrum disappear. For the
example in Figure 7A, observe that no correlations above this level (yellow/red
colors) are visible on the grid, aside from those within ringed vertices.
3. Using a lower threshold, e.g. #=0.33 (sensitivity=90%) plot the 1-dimensional
STOCSY (Figure 7C) driven from one of the strong resonances. 90% of structural
correlations are above the threshold. In addition, the shape of the multiplet patterns
expected for pentanoic / hexanoic acid is evident, increasing confidence in the
assignment.
4. In most cases, the correlation patterns of metabolites overlap. This is illustrated in
Figure 7B for the case of NMND and NMNA. At a threshold of #=0.76 (PPV=50%),
two overlapping grid patterns are clearly seen. The 1-dimensional STOCSY, Figure
7D driven from the !9.28 peak of NMND strengthens the assignment as before.
5. Weak putative structural correlations should be inspected on the 2d STOCSY plot for
the characteristic signs of peak shift (see Figure 4) and/or peak overlap, as a possible
cause of a reduced correlation signal.
In this case, the structural correlations of pentanoic and/or hexanoic acid have been identified
by this procedure. While the above represents just one example, our bootstrap analysis
simulates the generalization of the adopted thresholds to a range of unknown metabolites. By
computing the performance statistics on many different subsets of the original target list, we
were able to determine their variation and thus the impact on thresholds when different target
metabolites are left out (Figure 5C & D). The bias on both sensitivity (TPR) and specificity
(TNR) estimates was low. This indicates that, on average, the thresholds quoted in Table 2
should be applicable to the wider metabolome.
There is additional information that STOCSY practitioners can use to determine the
likelihood of a structural association between two spectral variables. Typical 1-dimensional
NMR acquisitions result in many data points per peak, and thus the level of correlation is
Page 16 of 30
ACS Paragon Plus Environment
Submitted to Analytical Chemistry
123456789101112131415161718192021222324252627282930313233343536373839404142434445464748495051525354555657585960

Couto Alves et al. Properties of STOCSY for Metabolite Characterization 19/12/08
17
expected to vary smoothly on the scale of the peak width. The occurrence of high correlations
at clearly defined peaks rather than areas of baseline also increases the confidence of the
structural assignment. Such ‘frequency spatial’ correlation was not included in our analysis
owing to the difficulty of encoding this information in the statistical methodology.
Nonetheless, this extra information may allow lower correlation thresholds than those
reported here to be used in practice, while still retaining low false discovery rates.
Surprisingly, the method of normalization had little impact on the correlation maps or the
discrimination in most data sets. Constant sum normalization is known to induce spurious
correlations in spectral data sets due to closure effects18
. In our analysis, only the hydrazine
data showed significant differences between normalization methods. Hydrazine also exhibited
a lower AUC value than the other data sets, indicating poorer discrimination. One reason for
these observations is the strong variability in speed of response of individual animals to the
toxic insult in this case (so-called fast and slow responders19
). For some metabolites, this
produced a wide range of intensities at the single time point examined, resulting in both
closure-induced correlations and high biological correlations, thus increasing the overlap
between distributions. This suggests that when using STOCSY for structural assignment, one
should always aim to select groups which are maximally homogeneous and stationary.
Small variations in the chemical shift of individual peaks due to matrix effects are a well
known feature of biological NMR spectra20
. While their presence degrades performance, they
lead to clear patterns in the 2-dimensional correlation maps (see Figure 4) allowing their
effects to be easily recognized and mitigated. Positional variation tends to reduce the level of
structural correlations, leading to false negatives, and does not appear to induce any spurious
structural correlations (false positives). This may be important when interpreting 1-
dimensional STOCSY plots (equivalent to plotting one row of the correlation matrix) since
the maximum structural correlation may be shifted away from the resonance maximum.
Therefore performance might be improved by aligning spectra before running a STOCSY
analysis21
.
Page 17 of 30
ACS Paragon Plus Environment
Submitted to Analytical Chemistry
123456789101112131415161718192021222324252627282930313233343536373839404142434445464748495051525354555657585960
Couto Alves et al. Properties of STOCSY for Metabolite Characterization 19/12/08
18
While our analysis shows that the statistics we derive are not heavily dependent on the data
set used, we found that there were some deviations, particularly for data exhibiting a high
degree of heterogeneity. Therefore, we put forward our methodology as a general approach
which could be applied to individual data sets to generate case-specific thresholds. These
might exhibit a higher degree of accuracy than the general statistics presented here.
Additionally, our approach could easily be applied to other correlation-based applications for
the purposes of metabolite identification. It would be informative to investigate whether the
performance metrics evaluated here can be generalized to other biofluids, species and other
STOCSY approaches such as HET-STOCSY8, LC-STOCSY
7 and diffusion-ordered
approaches6. Of particular interest would be the determination of the level of correlation
indicating a structural relationship when combining NMR and LC-MS data (SHY14
).
In this work, we have treated non-structural correlations purely as ‘nuisance’ signals which
confound structural identification by the STOCSY approach. Nonetheless, it is intriguing to
consider their origins. Some non-structural correlations may derive from analytical causes, the
extent of which will be dependent on the type and amount of sample work-up employed (e.g.
metabolite-specific variation in efficiency of extraction protocols). We do not expect this to
be an important factor for sample types requiring minimal preparation, such as the urine data
reported here. A more exciting prospect is that many non-structural correlations may reveal
important biological relationships. It is possible that such associations may be highly
informative about the metabolic state of a system under a variety of biological conditions22, 23
.
These associations clearly deserve further study in their own right and will therefore be a
target for our future work in this area.
Acknowledgements
We thank the members of the Consortium on Metabonomic Toxicology (COMET) for
providing the data analyzed in this study. MR acknowledges funding from the
MET24
AGRAD programme sponsors, AstraZeneca, Unilever and Servier.
Page 18 of 30
ACS Paragon Plus Environment
Submitted to Analytical Chemistry
123456789101112131415161718192021222324252627282930313233343536373839404142434445464748495051525354555657585960

Couto Alves et al. Properties of STOCSY for Metabolite Characterization 19/12/08
19
References
(1) Nicholson, J. K.; Foxall, P. J. D.; Spraul, M.; Farrant, R. D.; Lindon, J. C. Anal.
Chem. 1995, 67, 793.
(2) Noda, I. Applied Spectroscopy 1990, 44, 550-561.
(3) Cloarec, O.; Dumas, M. E.; Craig, A.; Barton, R. H.; Trygg, J.; Hudson, J.; Blancher,
C.; Gauguier, D.; Lindon, J. C.; Holmes, E.; Nicholson, J. Anal.Chem. 2005, 77,
1282.
(4) Holmes, E.; Cloarec, O.; Nicholson, J. K. J Proteome Res 2006, 5, 1313-1320.
(5) Holmes, E.; Loo, R. L.; Cloarec, O.; Coen, M.; Tang, H.; Maibaum, E.; Bruce, S.;
Chan, Q.; Elliott, P.; Stamler, J.; Wilson, I. D.; Lindon, J. C.; Nicholson, J. K. Anal
Chem 2007, 79, 2629-2640.
(6) Smith, L. M.; Maher, A. D.; Cloarec, O.; Rantalainen, M.; Tang, H.; Elliott, P.;
Stamler, J.; Lindon, J. C.; Holmes, E.; Nicholson, J. K. Anal Chem 2007, 79, 5682-
5689.
(7) Cloarec, O.; Campbell, A.; Tseng, L. H.; Braumann, U.; Spraul, M.; Scarfe, G.;
Weaver, R.; Nicholson, J. K. Anal Chem 2007, 79, 3304-3311.
(8) Coen, M.; Hong, Y. S.; Cloarec, O.; Rhode, C. M.; Reily, M. D.; Robertson, D. G.;
Holmes, E.; Lindon, J. C.; Nicholson, J. K. Anal Chem 2007, 79, 8956-8966.
(9) Keun, H. C.; Athersuch, T. J.; Beckonert, O.; Wang, Y.; Saric, J.; Shockcor, J. P.;
Lindon, J. C.; Wilson, I. D.; Holmes, E.; Nicholson, J. K. Anal. Chem. 2008, 80,
1073-1079.
(10) Wang, Y.; Cloarec, O.; Tang, H.; Lindon, J. C.; Holmes, E.; Kochhar, S.; Nicholson,
J. K. Anal. Chem. 2008, 80, 1058-1066.
(11) Bruschweiler, R.; Zhang, F. J Chem Phys 2004, 120, 5253-5260.
(12) Zhang, F.; Bruschweiler, R. Angew Chem Int Ed Engl 2007, 46, 2639-2642.
(13) Zhang, F.; Dossey, A. T.; Zachariah, C.; Edison, A. S.; Bruschweiler, R. Anal Chem
2007, 79, 7748-7752.
(14) Crockford, D. J.; Holmes, E.; Lindon, J. C.; Plumb, R. S.; Zirah, S.; Bruce, S. J.;
Rainville, P.; Stumpf, C. L.; Nicholson, J. K. Anal Chem 2006, 78, 363-371.
(15) Lindon, J. C.; Keun, H. C.; Ebbels, T. M.; Pearce, J. M.; Holmes, E.; Nicholson, J. K.
Pharmacogenomics 2005, 6, 691-699.
(16) Ebbels, T. M. D.; Keun, H. C.; Beckonert, O.; Bollard, E.; Lindon, J. C.; Holmes, E.;
Nicholson, J. K. Journal of Proteome Research 2007, 6, 4407-4422.
(17) Dieterle, F.; Ross, A.; Schlotterbeck, G.; Senn, H. Anal. Chem. 2006, 78, 4281-4290.
(18) Craig, A.; Cloarec, O.; Holmes, E.; Nicholson, J. K.; Lindon, J. C. Anal Chem 2006,
78, 2262-2267.
(19) Nicholson, J. K.; Connelly, J.; Lindon, J. C.; Holmes, E. Nature Reviews Drug
Discovery 2002, 1, 153.
(20) Nicholson, J. K.; Wilson, I. D. Progress in Nuclear Magnetic Resonance
Spectroscopy 1989, 21, 449-501.
(21) Veselkov, K.; Lindon, J.; Ebbels, T.; Volynkin, V.; Crockford, D.; Holmes, E.;
Davies, D.; Nicholson, J. Analytical Chemistry submitted.
(22) Steuer, R.; Kurths, J.; Fiehn, O.; Weckwerth, W. Bioinformatics 2003, 19, 1019-
1026.
(23) Camacho, D.; de la Fuente, A.; Mendes, P. Metabolomics 2005, V1, 53.
(24) Antti, H.; Bollard, M. E.; Ebbels, T. M. D.; Keun, H. C.; Lindon, J. C.; Nicholson, J.
K.; Holmes, E. Journal of Chemometrics 2002, 16, 461-468.
Page 19 of 30
ACS Paragon Plus Environment
Submitted to Analytical Chemistry
123456789101112131415161718192021222324252627282930313233343536373839404142434445464748495051525354555657585960

Couto Alves et al. Properties of STOCSY for Metabolite Characterization 19/12/08
20
Figure Captions
Figure 1: Schematic diagram showing the methodology employed in the paper. In panel A,
spectral variables corresponding to the target metabolites are extracted. Panel B shows a
schematic of the resulting correlation matrix (not to scale) with quadrants corresponding to
the metabolite correlation matrix, the complementary correlation matrix and a set of
correlations whose class is not known (‘indeterminate’). The rows/columns of this matrix are
reordered so as to separate structural from non-structural correlations. Structural
correlations (red) are extracted from the upper triangular diagonal blocks (region with red
border); non-structural correlations (green) are extracted from both metabolite and
complementary correlation matrices (region with blue border). Panel C indicates the
structural / non-structural correlation distributions and resulting performance metrics
(sensitivity, specificity etc.) In panel D, thresholds based on the performance metrics are used
to filter the 2-dimensional STOCSY to indicate correlation patterns indicative of structural
associations for unidentified resonances (blue/orange grids connecting circled correlations).
Figure 2: Correlation data and the impact of metabolite representation. Metabolite (left) and
complementary (right) correlation matrices are displayed as heat maps. Panels A and B show
results for the resonance maximum representation; panels C and D show results for the
resonance range representation. All subplots are produced with constant sum normalization.
White lines separate metabolites on the target list.
Figure 3: The distributions of structural and non-structural correlations for the control data.
Histograms are shown for the distributions of A Structural correlations and B non-structural
correlations. Panel C shows the distributions in box plot format. Red lines indicate thresholds
for moderate and extreme outliers. D ROC plot showing AUC statistic.
Figure 4: Detail of the metabolite correlation matrix (resonance range representation) for A
hippurate and B citrate. Representative trimmed spectra are shown on the horizontal and
vertical axes. C Simulated doublet with positional variation and D corresponding correlation
matrix. All plots use the same color scale. For the simulation, 50 identical Lorentzian doublets
Page 20 of 30
ACS Paragon Plus Environment
Submitted to Analytical Chemistry
123456789101112131415161718192021222324252627282930313233343536373839404142434445464748495051525354555657585960

Couto Alves et al. Properties of STOCSY for Metabolite Characterization 19/12/08
21
were simulated in the region x:[0,2] with line width 0.08, splitting 0.5, and center positions
varying as with .
Figure 5: The impact of sample size (L) and target metabolite set on true positive rate (TPR)
and true negative rate (TNR) for the control data. Left panels show TPR, right panels show
TNR. Estimates were derived by resampling individuals (top) and metabolites (bottom). Each
panel shows the full sample estimate (pink), and bootstrap estimates of the mean (solid lines
labeled *) and 95% confidence intervals (dashed lines) of each statistic.
Figure 6: Sensitivity, specificity and positive predictive value (PPV) versus threshold level for
(A) the control data and (B) the caloric restriction data. The PPV gives the probability of
correctly assigning two peaks to the same metabolite.
Figure 7: Demonstration of the practical use of the thresholds given in Table 2. A: 2-
dimensional STOCSY of the control data thresholded at !=0.76 corresponding to resonances
of pentanoic/hexanoic acid. B: 2-dimensional STOCSY thresholded at !=0.76 corresponding
to resonances of NMND (red) and NMNA (blue). C: 1-dimensional STOCSY driven from
resonance at 1.65 ppm for the region shown in A. D: 1-dimensional STOCSY driven from the
resonance at 9.28 ppm for the region shown in B.
Page 21 of 30
ACS Paragon Plus Environment
Submitted to Analytical Chemistry
123456789101112131415161718192021222324252627282930313233343536373839404142434445464748495051525354555657585960
Couto Alves et al. Properties of STOCSY for Metabolite Characterization 19/12/08
22
Tables
Table 1 Target metabolites used to compute structural correlations. $ ppm is the central
chemical shift of the multiplet, $ range ppm is the chemical shift range of the multiplet. M
stands for multiplicity: s – singlet, d – doublet, t – triplet, m – multiplet.
1H NMR Resonances Metabolite ID Metabolite (abbreviation) Biological
Pathways $ ppm M $ range ppm
7.835 d 7.822-7.859
7.555 t 7.549-7.585
7.643 t 7.619-7.664
1 Hippurate (Hipp) Gut microbiota
benzoate
metabolism in
liver 3.972 d 3.959-3.990
7.42 d 7.400-7.433
7.365 t 7.345-7.386
3.76 d 3.751-3.773
2 Phenylacetylglycine
(PAG)
Phenylalanine
metabolism
3.681 s 3.676-3.686
2.550 d 2.520-2.584 3 Citrate (Citr) TCA Cycle
2.690 d 2.662-2.722
2.446 t 2.428-2.466 4 2-Oxoglutarate (2OG) TCA Cycle
3.012 t 2.984-3.033
4.056 s 4.041-4.077 5 Creatinine (Crtnin) Muscle turn over
3.045 s 3.034-3.060
3.903 s 3.888-3.910 6 Creatine (Crtine) Break down of
Muscle Tissue 3.045 s 3.035-3.055
1.335 d 1.320-1.350 7 Lactate (Lact) Glycolysis
4.136 q 4.125-4.170
4.44 s 4.432-4.448
8.838 t 8.820-8.860
8 N-methyl nicotinic acid
(NMNA)
Niacin
metabolism
9.124 s 9.113-9.134
4.479 s 4.474-4.486
8.895 d 8.880-8.913
8.961 d 8.950-8.977
9.275 s 9.262-9.285
9 N-methyl Nicotinamide
(NMND)
Niacin
metabolism
8.182 m 8.164-8.200
Page 22 of 30
ACS Paragon Plus Environment
Submitted to Analytical Chemistry
123456789101112131415161718192021222324252627282930313233343536373839404142434445464748495051525354555657585960

Couto Alves et al. Properties of STOCSY for Metabolite Characterization 19/12/08
23
Table 2 STOCSY correlation threshold required to attain specific levels of performance, and
AUC statistics for the 5 datasets. Columns marked with + have thresholds not statistically
different across datasets for a confidence interval of 95%.
Specificity Sensitivity Positive Predictive Value Data set
0.1 0.9 1.0+ 0.1 0.9 1.0 0.1 0.5 0.9
+ 1.0
+
AUC
Controls 0.16 0.17 0.90 0.97 0.33 -0.03 0.54 0.76 0.89 0.92 0.98
Caloric
Restriction
-0.35 0.33 0.95 0.99 0.48 0.02 0.74 0.84 0.93 0.96 0.99
Ammonium
Chloride
-0.35 0.40 0.95 0.95 0.17 -0.62 0.79 0.90 0.95 0.96 0.90
115 treatments -0.14 0.25 0.93 0.98 0.37 -0.18 0.71 0.90 0.99 0.99 0.97
Hydrazine -0.30 0.63 0.97 0.97 -0.15 -0.56 0.95 0.96 0.97 0.97 0.78
Median -0.30 0.33 0.95 0.97 0.33 -0.18 0.74 0.90 0.95 0.96 0.97
Mean -0.20 0.36 0.94 0.97 0.24 -0.27 0.75 0.87 0.95 0.96 0.92
Stdev 0.22 0.18 0.03 0.01 0.24 0.30 0.15 0.08 0.04 0.03 0.09
Page 23 of 30
ACS Paragon Plus Environment
Submitted to Analytical Chemistry
123456789101112131415161718192021222324252627282930313233343536373839404142434445464748495051525354555657585960

Couto Alves et al. Properties of STOCSY for Metabolite Characterization 19/12/08
24
Figures
Figure 1: Schematic diagram showing the methodology employed in the paper. In panel A,
spectral variables corresponding to the target metabolites are extracted. Panel B shows a
schematic of the resulting correlation matrix (not to scale) with quadrants corresponding to
the metabolite correlation matrix, the complementary correlation matrix and a set of
correlations whose class is not known (‘indeterminate’). The rows/columns of this matrix are
reordered so as to separate structural from non-structural correlations. Structural correlations
(red) are extracted from the upper triangular diagonal blocks (region with red border); non-
structural correlations (green) are extracted from both metabolite and complementary
correlation matrices (region with blue border). Panel C indicates the structural / non-
structural correlation distributions and resulting performance metrics (sensitivity, specificity
etc.) In panel D, thresholds based on the performance metrics are used to filter the 2-
dimensional STOCSY to indicate correlation patterns indicative of structural associations for
unidentified resonances (blue/orange grids connecting circled correlations).
Page 24 of 30
ACS Paragon Plus Environment
Submitted to Analytical Chemistry
123456789101112131415161718192021222324252627282930313233343536373839404142434445464748495051525354555657585960

Couto Alves et al. Properties of STOCSY for Metabolite Characterization 19/12/08
25
Figure 2: Correlation data and the impact of metabolite representation. Metabolite (left) and
complementary (right) correlation matrices are displayed as heat maps. Panels A and B show
results for the resonance maximum representation; panels C and D show results for the
resonance range representation. All subplots are produced with constant sum normalization.
White lines separate metabolites on the target list.
Page 25 of 30
ACS Paragon Plus Environment
Submitted to Analytical Chemistry
123456789101112131415161718192021222324252627282930313233343536373839404142434445464748495051525354555657585960

Couto Alves et al. Properties of STOCSY for Metabolite Characterization 19/12/08
26
Figure 3: The distributions of structural and non-structural correlations for the control data.
Histograms are shown for the distributions of A Structural correlations and B non-structural
correlations. Panel C shows the distributions in box plot format. Red lines indicate thresholds
for moderate and extreme outliers. D ROC plot showing AUC statistic.
Page 26 of 30
ACS Paragon Plus Environment
Submitted to Analytical Chemistry
123456789101112131415161718192021222324252627282930313233343536373839404142434445464748495051525354555657585960

Couto Alves et al. Properties of STOCSY for Metabolite Characterization 19/12/08
27
Figure 4: Detail of the metabolite correlation matrix (resonance range representation) for A
hippurate and B citrate. Representative trimmed spectra are shown on the horizontal and
vertical axes. C Simulated doublet with positional variation and D corresponding correlation
matrix. All plots use the same color scale. For the simulation, 50 identical Lorentzian doublets
were simulated in the region x:[0,2] with line width 0.08, splitting 0.5, and center positions
varying as with .
Page 27 of 30
ACS Paragon Plus Environment
Submitted to Analytical Chemistry
123456789101112131415161718192021222324252627282930313233343536373839404142434445464748495051525354555657585960

Couto Alves et al. Properties of STOCSY for Metabolite Characterization 19/12/08
28
Figure 5: The impact of sample size (L) and target metabolite set on true positive rate (TPR)
and true negative rate (TNR) for the control data. Left panels show TPR, right panels show
TNR. Estimates were derived by resampling individuals (top) and metabolites (bottom). Each
panel shows the full sample estimate (pink), and bootstrap estimates of the mean (solid lines
labeled *) and 95% confidence intervals (dashed lines) of each statistic.
Page 28 of 30
ACS Paragon Plus Environment
Submitted to Analytical Chemistry
123456789101112131415161718192021222324252627282930313233343536373839404142434445464748495051525354555657585960

Couto Alves et al. Properties of STOCSY for Metabolite Characterization 19/12/08
29
Figure 6: Sensitivity, specificity and positive predictive value (PPV) versus threshold level
for (A) the control data and (B) the caloric restriction data. The PPV gives the probability of
correctly assigning two peaks to the same metabolite.
Page 29 of 30
ACS Paragon Plus Environment
Submitted to Analytical Chemistry
123456789101112131415161718192021222324252627282930313233343536373839404142434445464748495051525354555657585960

Couto Alves et al. Properties of STOCSY for Metabolite Characterization 19/12/08
30
Figure 7: Demonstration of the practical use of the thresholds given in Table 2. A: 2-
dimensional STOCSY of the control data thresholded at "=0.76 corresponding to resonances
of pentanoic/hexanoic acid. B: 2-dimensional STOCSY thresholded at "=0.76 corresponding
to resonances of NMND (red) and NMNA (blue). C: 1-dimensional STOCSY driven from
resonance at 1.65 ppm for the region shown in A. D: 1-dimensional STOCSY driven from the
resonance at 9.28 ppm for the region shown in B.
Page 30 of 30
ACS Paragon Plus Environment
Submitted to Analytical Chemistry
123456789101112131415161718192021222324252627282930313233343536373839404142434445464748495051525354555657585960